Nasdaq 100 Forecast: Cluster Support in Play after Breakdown. More Pain Ahead?

Nasdaq 100 Forecast: Cluster Support in Play after Breakdown. More Pain Ahead?

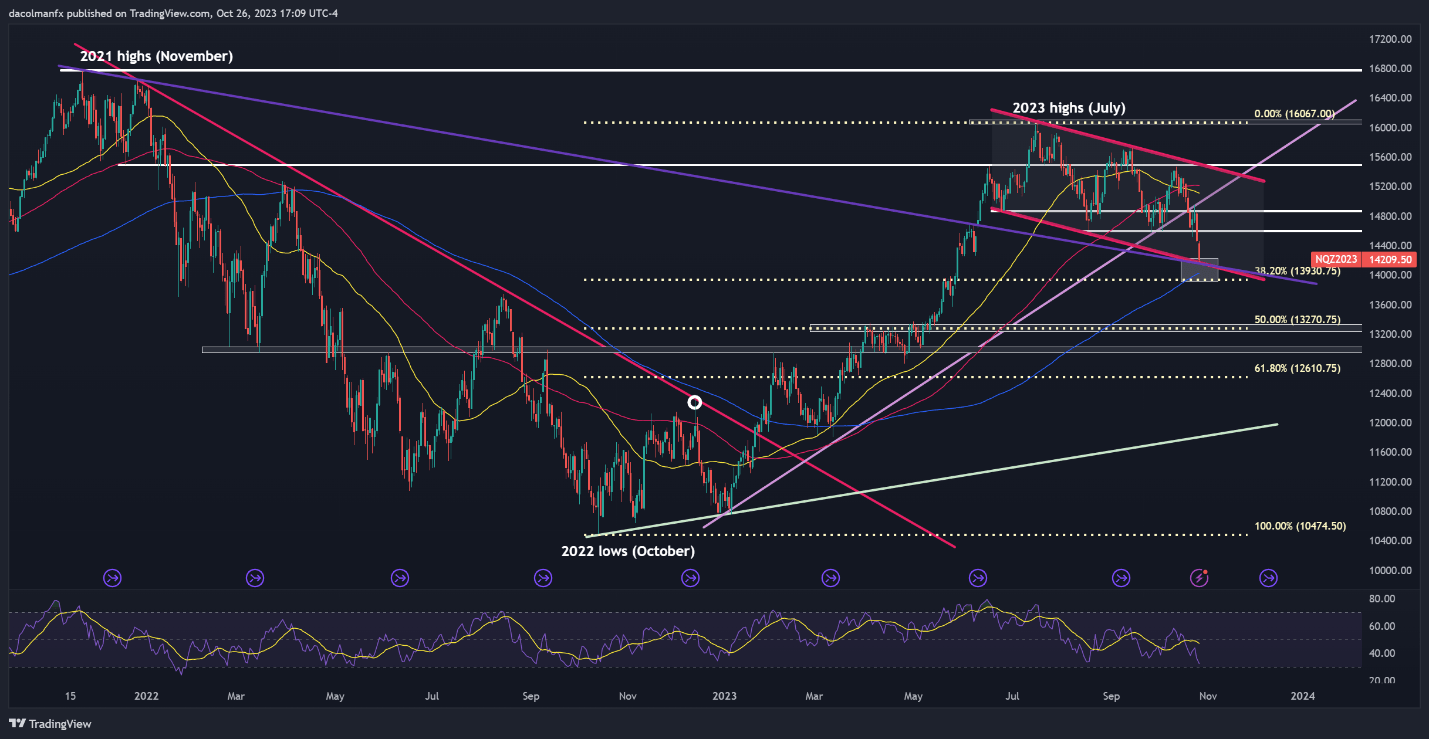
The Nasdaq 100 broke down after breaching technical support located in the 14,600 area. This bearish development intensified the decline, pushing the technology index to its lowest level since late May and into correction territory, characterized by a pullback of more than 10% but less than 20% from its recent high.

Mixed earnings from heavy hitters, such as Alphabet and Meta, coupled with elevated U.S. Treasury yields across the curve, have contributed to the prevailing atmosphere of pessimism, creating an unfavorable environment for risk assets.

Positive economic data hasn’t succeeded in boosting the mood. While activity remains extremely resilient today, investors are forward-looking and deem that the economy won’t be able to sustain its performance for much longer, especially with the Fed hell-bent on keeping rates high for an extended period as part of its fight against inflation.

If you’re in search of a more comprehensive view of U.S. equity indices, our Q4 stock market trading guide is packed with great insights. Download it now!

Taking a look at price action, the Nasdaq 100 has fallen towards an area of cluster support that extends from 14,150 to 13,930, where the lower boundary of the short-term descending channel aligns with the 200-day simple moving average and the 38.2% Fibonacci retracement of the Oct 2022/Jul 2023 rally.

For sentiment to improve, it is imperative for confluence support in the 14,150/13,930 range to hold firm. Any failure to maintain this critical zone could trigger a large selloff, potentially taking the equity benchmark towards 13,270, which coincides with the 50% retracement of the move discussed above.

In the event that dip buyers return and spark a bullish turnaround, initial resistance lies at 14,600. Upside clearance of this key ceiling could reignite upside momentum and set the stage for a move higher to 14,860. On further strength, the market focus will transition to 15,100.

Looking for actionable trading ideas? Download our top trading opportunities guide loaded with interesting technical and fundamental strategies!

NASDAQ 100 TECHNICAL CHART

A screen shot of a graph  Description automatically generated


Euro Technical Outlook – Trend Break Might be Short Lived for EUR/USD

Euro Technical Outlook – Trend Break Might be Short Lived for EUR/USD

EUR/USD TECHNICAL ANALYSIS

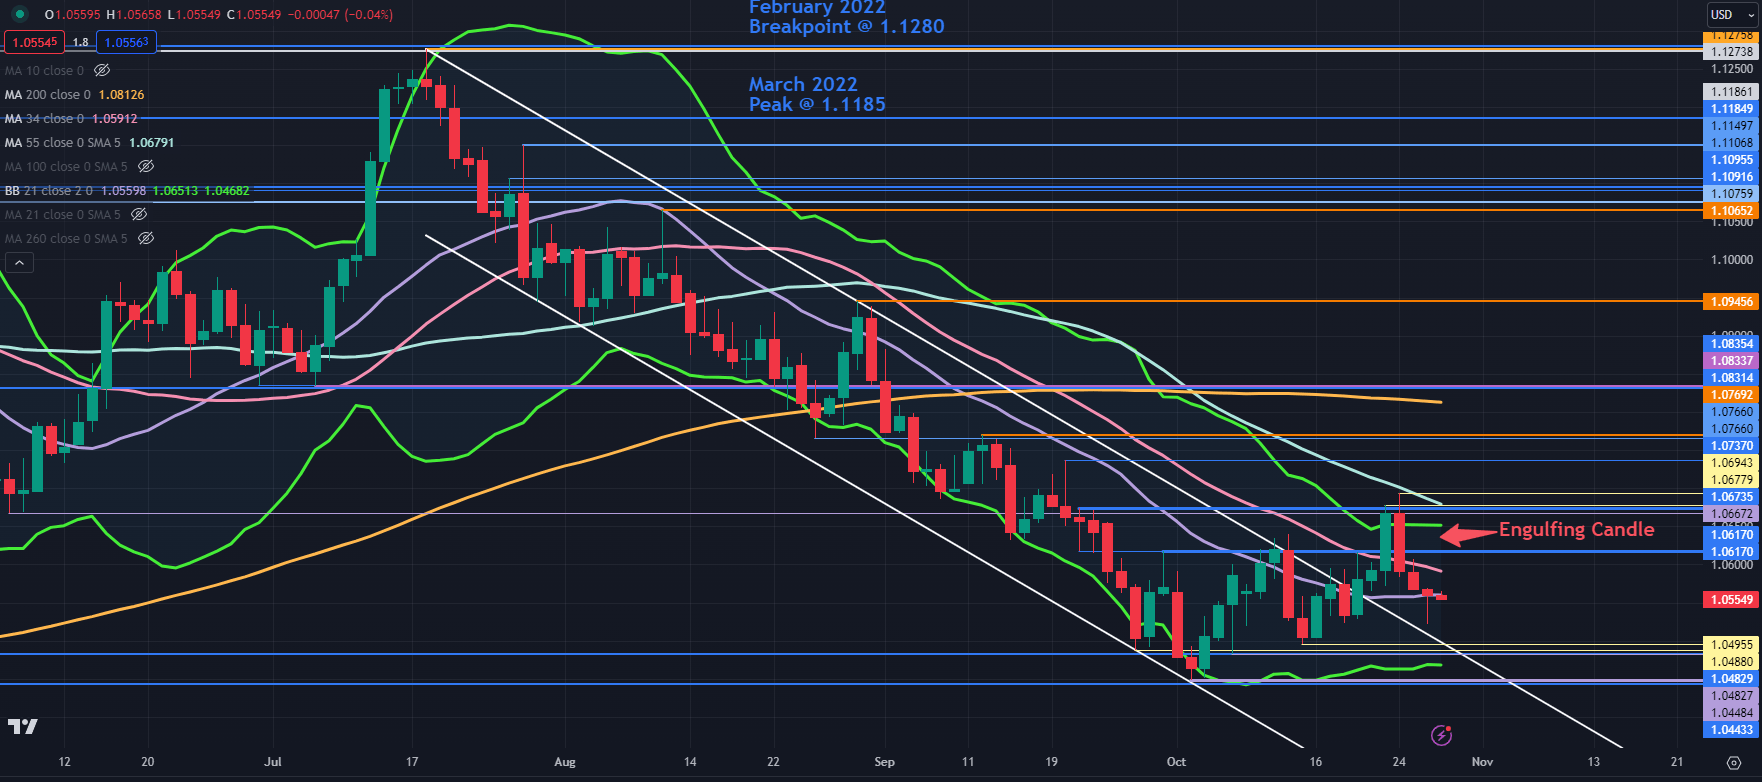
EUR/USD cleanly broke through the topside of a descending trend channel last week and continued higher to briefly pierce minor resistance levels near 1.0680 to make a high at 1.0695.

The price action on the day that the price made that high saw a Bearish Engulfing Candlestick

formation emerged and it has gone lower in the proceeding days.

A Bearish Engulfing Candlestick opens at, or above the previous candle’s close. The length of the bearish candle ‘engulfs’ the previous green candle and it then closes below the prior candle’s open.

This reversal might signal that the descending trend may re-emerge.

The recent rally broke above the upper band of the 21-day simple moving average (SMA) based Bollinger Band. On the same day that Engulfing Candlestick materialised, the price closed back inside the band.

This potentially adds weight to the perspective that a reversal could be in play.

A bearish triple moving average (TMA) formation requires the price to be below the short-term SMA, the latter to be below the medium-term SMA and the medium-term SMA to be below the long-term SMA. All SMAs also need to have a negative gradient.

When looking at any combination of the 21-, 34-, 55- and 100-day SMAs, the criteria for a TMA have been met and might suggest that bearish momentum is evolving.

On the downside, nearby support might lie near the previous lows and breakpoints in the 1.0480 – 1.0495 area ahead of the lows seen in December 2022 and October 2023 near 1.0445.

On the topside, the 55-day SMA is currently near the recent peak and there might be a resistance zone ahead of 1.0700.

The next resistance levels could be at the breakpoints and previous highs near 1.0740, 1.0770, 1.0835 and 1.0945 ahead of a cluster zone of potential resistance in the 1.1075 – 1.1100 area.

EUR/USD DAILY CHART

image1.png

EUR/JPY TECHNICAL ANALYSIS

EUR/JPY appears to have settled back into its recent range after rejecting the move higher earlier this week when it popped above the August to peak to trade at its highest level since 2008.

In the discussion above, EUR/USD seems to have a bearish TMA formation, but looking at the Simple Moving Averages (SMA) on EUR/JPY, a bullish TMA might be about to be triggered.

The hindering factor is the clustering of the 21, 34- and 55-day SMAs. If the price stays above those SMAs, then it is likely that the conditions for a bullish TMA pattern will be triggered.

On the downside, support could be at the breakpoint and a recent low toward 156.50. On a sustained move lower, the levels to watch might be at the previous lows and breakpoints of 154.39, 153.45, 151.60, 151.40 and 151.07.

On the top side, the recent highs and breakpoint near 159.50, 159.75 and 159.90 may offer resistance.

EUR/JPY DAILY CHART


Asian Indices Test Support Ahead of FOMC: Hang Seng, Kospi, Topix Price Setups

Asian Indices Test Support Ahead of FOMC: Hang Seng, Kospi, Topix Price Setups

Hang Seng Index: Downward momentum is increasing

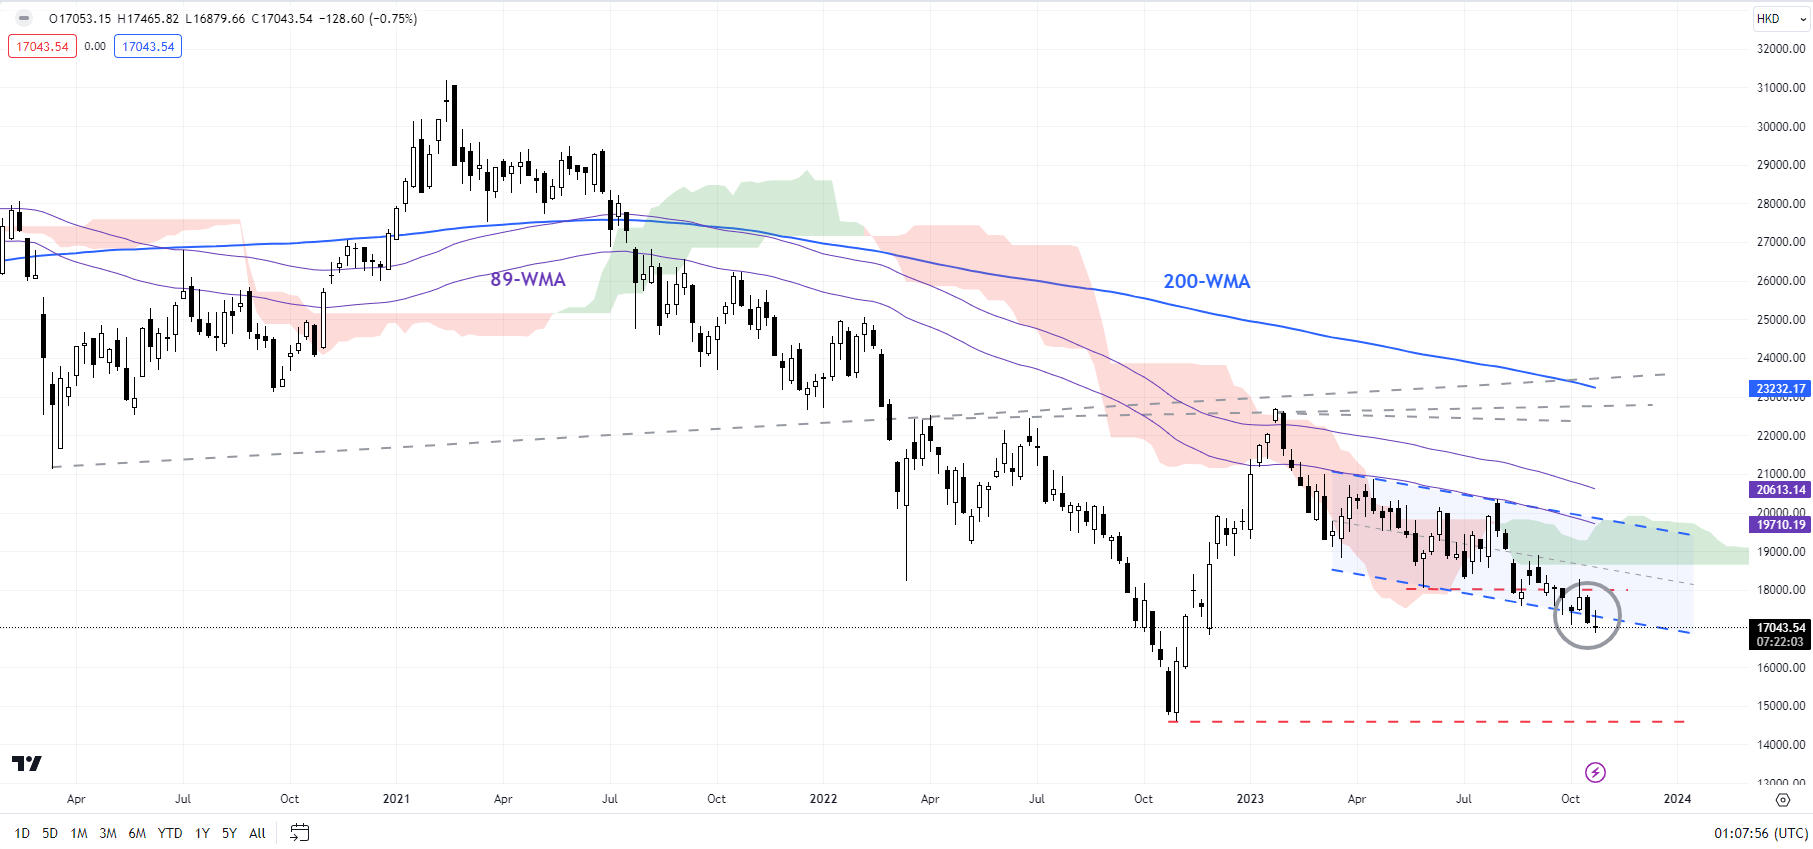
The sequence of lower-highs-lower-lows since early 2023 is a sign that the Hang Seng Index’s trend remains down. The index is now attempting to fall below vital support on the lower edge of a declining channel since early 2023. A decisive break below could pave the way toward the 2022 low of 14600. While oversold conditions and a string of policy measures have at best led to minor pauses within the downtrend so far. For more discussion see, “Q4 Trade Opportunity: HK/China Equities Could be Due for a Rebound,” published October 9.

Hang Seng Index Weekly Chart

image1.png

At a minimum, the Hang Seng Index needs to cross above the mid-October high of 18300 for the downward pressure to begin fading. For a sustained rebound, the index would need to cross several hurdles, including the upper edge of the channel, near the August high of 20350.

Kospi: Approaches a vital floor

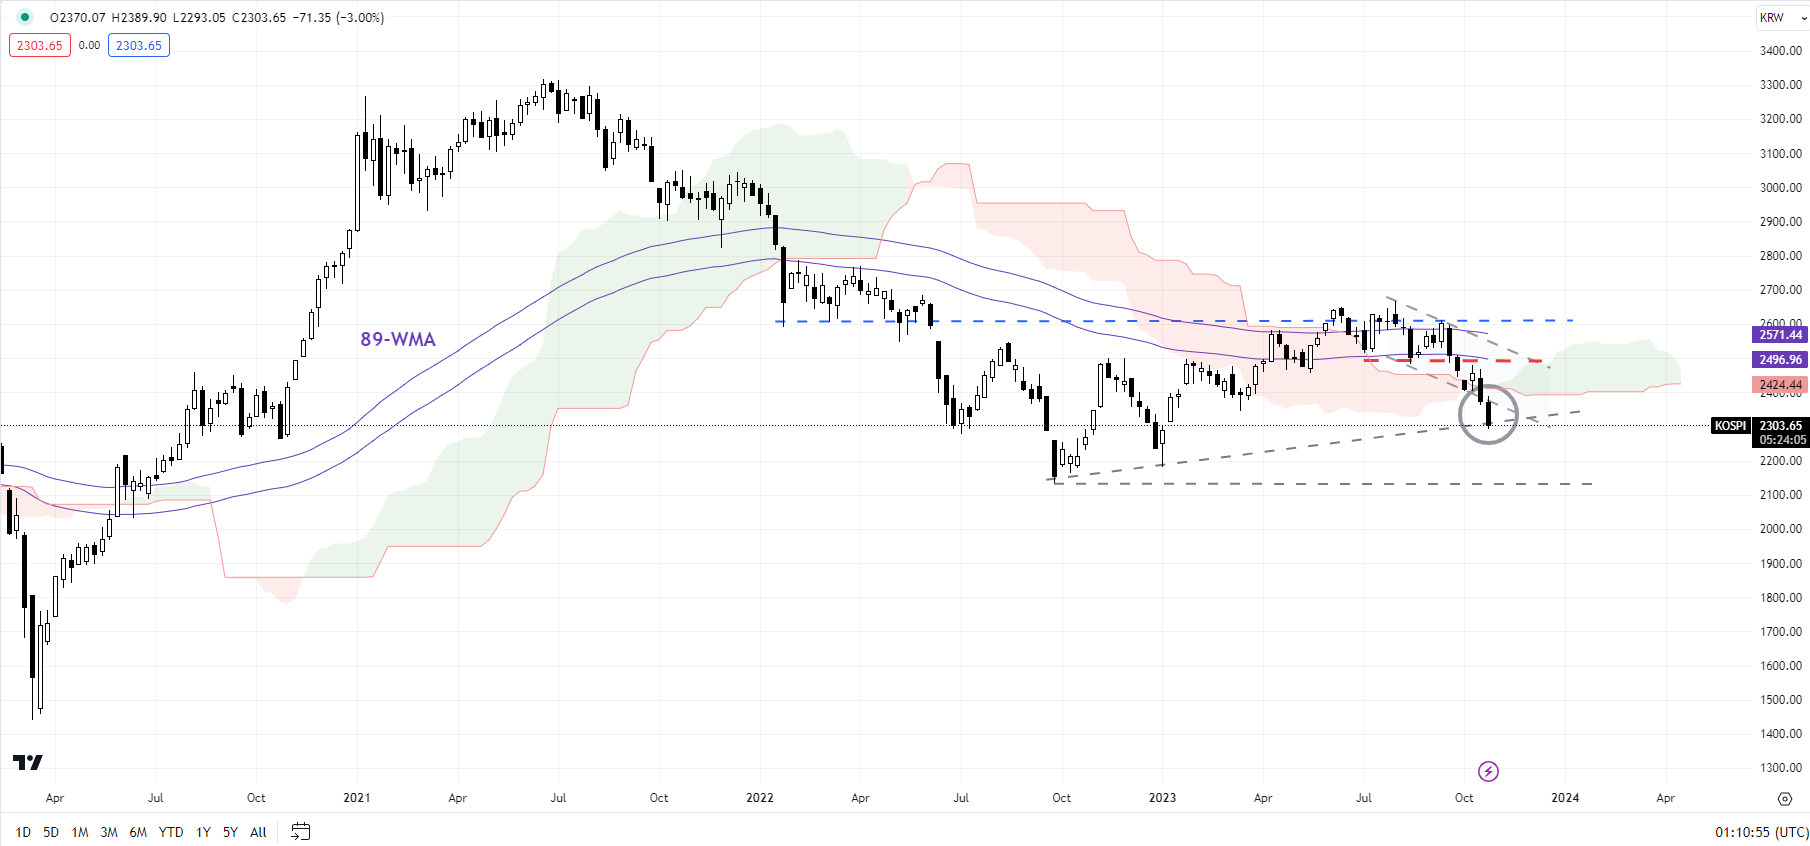
Kospi’s break in August has truncated the nine-month-long recovery. This follows a failure in mid-2023 to cross above a major hurdle at the January low of 2590. Kospi’s fall this week to the lowest level since January means the target of the double top pattern (the June and August highs) of around 2380 has been achieved.

Kospi Weekly Chart

image2.png

Ashighlighted in the previous update, while there is no doubt that the bullish pressure has dissipated, Kospi would need to fall under the 2022 low of 2135, slightly above the 200-month moving average (now at about 2085) for downside risks to accentuate. The last time the index was decisively below the long-term moving average was in 2003.

Topix: Holds above strong cushion

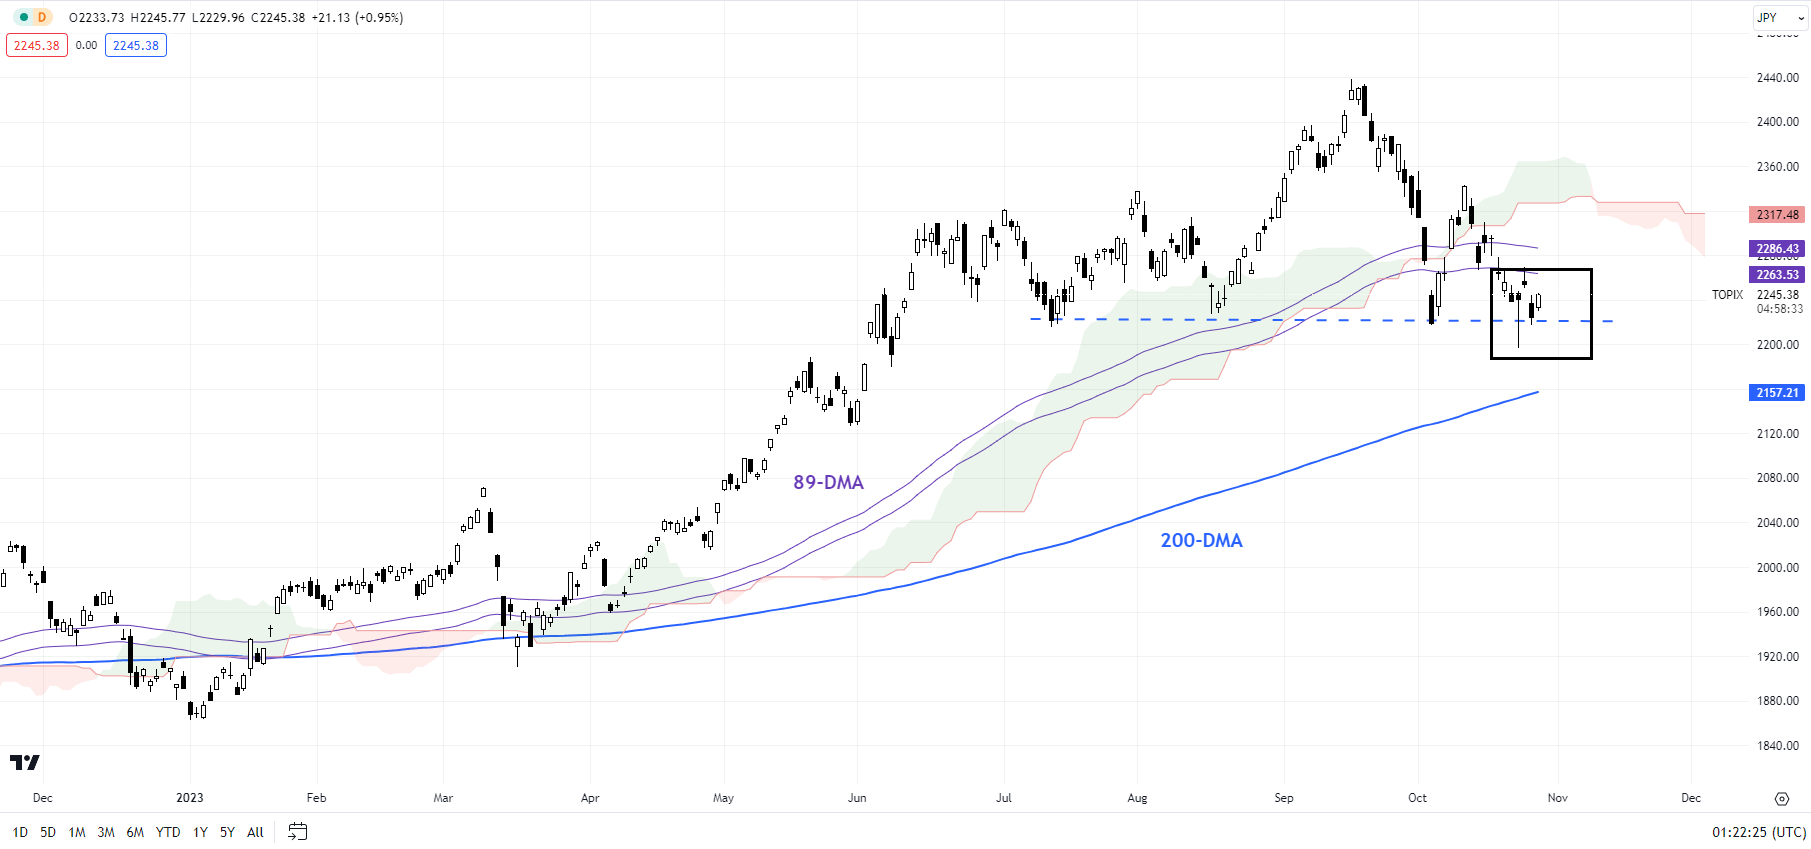
Topix is holding above key support on a horizontal trendline from mid-2023 (at about 2200). Ashighlighted in the previous update, this cushion is strong and might not be broken easily. However, any break below would disrupt the higher-highs-higher-lows sequence prevailing in recent months, suggesting a temporary easing in the upward pressure. Any break below 2200 could open the door toward the 200-day moving average (now at about 2150).

Topix Daily Chart

image3.png

Zooming out, from a big-picture perspective, the index has shown gradual signs of strength in recent years, with the break above a horizontal trendline from the mid-1990s turning out to be unambiguously bullish. Unless the index falls below the resistance-turned-support at the 2021 high of 2120, the broader bullish picture remains intact.

Looking for actionable trading ideas? Download our top trading opportunities guide packed with insightful tips for the fourth quarter!

How To Trade Nickel: Top Nickel Trading Strategies and Tips

How To Trade Nickel: Top Nickel Trading Strategies and Tips

Nickel or Ni (periodic table atomic symbol) is a versatile silver/white metal that is often used as an input in the manufacture of countless secondary products. Listed as number 28 on the periodic table, nickel has exceptional properties including its resistance to corrosion, ferromagnetic (magnetic), ductileness, recyclability, serving as a good conductor of electricity as well as high boiling (2,913 °C) and melting (1,455 °C) points. Some notable uses include the making of coins, steel, reinforcing other materials in the aerospace industry, wiring, alloys and renewable energy.

Nickel is primarily found and extracted in Indonesia, South Africa, Australia, Russia and Canada respectively. These countries combined account for roughly 50% of the worlds nickel supply and should be given the appropriate attention with regard to trading as supply factors as with most commodities, can impact the price of nickel.

NICKEL TRADING HOURS AND EXPOSURE

LME select: 01.00 – 19.00 (Trading for LME precious continues until 20.00) (UK time)

Ring trading: 11.40 – 17.00 (UK time)

Inter-office telephone trading: 24 hours

Trading nickel is not limited to physical purchases (bullion) but via multiple avenues where traders can get exposure to price movements. Futures trading on exchanges such as the London Metals Exchange (LME) are commonplace amongst institutions but for the retail trader, Contracts For Difference (CFDs) are a popular choice. CFDs are accessible globally through many brokers offering nickel trading (spot and futures) but it is recommended to understand contract specifications, leverage and broker safety before committing on this route. Covering nickel through the stock market remains as the most widespread method for retail investors with shares such as Vale S.A., Nornickel, Glencore, BHP, Anglo American and South32 topping the list.

WHAT AFFECTS NICKEL PRICES?

SUPPLY AND DEMAND

As briefly mentioned above, supply and demand constitute a large influence over nickel prices. Economic theory suggests limiting supply drives prices higher and vice versa while the same logic applies to demand (i.e. an increase in demand should lead to higher nickel prices). Global nickel stocks can be monitored on the LME website while Chinese stockpiles also play an important role in nickel price action.

GOVERNMENTS

Governments involved with nickel (import or export) can sway prices by way of government intervention. An example of this was the banning of nickel exports by Indonesia.

GEOPOLITICS

Geopolitical tensions particularly regarding major producers of nickel could significantly move prices. Recently, the Russian invasion of Ukraine disrupted supply chains resulting in a marked increase in the price of Nickel.

CHINA

China is the world’s major consumer of nickel in its various forms, and a slowdown or uptick in the Chinese economy traditionally reflect a positive correlation with the price of nickel. China is arguably the most important demand factor for nickel prices therefore, placing emphasis on Chinese economic and political data is crucial to successful nickel trading.

In actuality, most of the above factors are intertwined and will act in accordance to traditional supply/demand levers making it one of the more important aspects of nickel trading.

WHY TRADE NICKEL?

Nickel’s place in the world commodity marketspace is gaining traction in terms of its usability in growing industries. With nickel being prices in U.S. dollars, the commodity also serves as a hedging tool against a weaker greenback coupled with elevated inflation. In addition, when global markets are on the up (bull market), trading nickel can be a great way to capitalize on increased demand as nickel prices are likely to move higher.

Finally, diversifying ones investment portfolio is often encouraged by market experts and nickel can certainly have a place amongst more common investment types such as stocks or bonds.

TRADING NICKEL: STRATEGIES

Nickel prices being so dependent on fundamental drivers, technical strategies are often seen as secondary support for trading decisions which is why it may be wise to employ a more blended approach using both techniques. The below examples look at each strategy in isolation to better emphasize their respective pros and cons.

TECHNICAL TRADING

From a technical trading standpoint, using traditional indicators and price action techniques can be successfully implemented when trading nickel. Because there are an infinite amount of combinations of technical methods, I have selected a simple yet effective method to illustrate the adaptability of technical trading in markets such as nickel which is not traditionally linked with technical analysis.

DAILY NICKEL CHART

Chart, histogram  Description automatically generated

The chart above includes a 200-day Simple Moving Average (SMA) in grey along with the Relative Strength Index (RSI). Using the SMA as a reference for directional bias (above SMA = bullish; below SMA = bearish), we can utilize the SMA in this case as a support zone for possible long positioning highlighted by the grey boxes. A move below the SMA will ultimately invalidate the move and sound risk management will be required to avoid any adverse price action. Should the market move in the desired route (upwards in this case), the RSI can then be used to close by correlating price with an overbought indication (blue). This simple strategy is just one such technical avenue that may be practiced in the nickel market.

FUNDAMENTAL TRADING AND THE NICKEL SHORT SQUEEZE OF 2022

If we look at the nickel chart since 2015, nickel has been somewhat rangebound between the $10000 – $20000 levels. In early 2022, when Russia invaded Ukraine the price of nickel started to push higher as a disruption in Russian nickel exports impacted supply-side factors. With a major producer being largely taken off the global register, supply concerns piled on and continued to drive up the price of nickel. In conjunction with the invasion, a massive short position was placed by a Chinese trader (Xiang Guangda, Tsingshan Holding Group Co). It is still uncertain as to whether this positioning was purely for hedging purposes (offsetting any losses from falling nickel prices from the physical commodity) or simply speculative reasons but the result was catastrophic for nickel markets. What followed was a short squeeze causing nickel prices to surpass $100000 per ton (see graphic below) triggering the LME to halt nickel trading!

250% NICKEL PRICE APPRECIATION IN JUST OVER 24HRS

image2.PNG

DAILY NICKEL CHART

Graphical user interface, chart  Description automatically generated

Monitoring fundamental drivers, be it supply disruptions from the world’s largest producers or staying in touch with demand-side constituents like China can go a long way in making rational decisions on the future of nickel prices. Fundamentals can be used in conjunction with technical analysis but generally fundamental drivers point to longer-term outlooks and do not lend themselves to short-term strategies.

A Guide to Trading Psychology

A Guide to Trading Psychology

Trading Psychology: Beyond the Basics

The psychology of trading is often overlooked but forms a crucial part of a professional trader’s skillset. DailyFX is the perfect place to learn how to manage your emotions and hone your trading psychology; our analysts have already experienced the ups and downs, so you don’t have to.

Keep reading to discover their top tips, and to learn more about:

  • What is trading psychology
  • How to get in the mindset of a successful trader
  • The basics of trading psychology
  • Trading psychology tools and techniques

Learn more about the realities of trading in our ‘Day in the Life of a Trader’ videos.

Unsure of what trading style to employ? Discover your niche with our DNA FX Quiz !

What is Trading Psychology?

Trading psychology is a broad term that includes all the emotions and feelings that a typical trader will encounter when trading. Some of these emotions are helpful and should be embraced while others like fear, greed, nervousness and anxiety should be contained. The psychology of trading is complex and takes time to fully master.

In reality, many traders experience the negative effects of trading psychology more than the positive aspects. Instances of this can appear in the form of closing losing trades prematurely, as the fear of loss gets too much, or simply doubling down on losing positions when the fear of realizing a loss turns to greed.

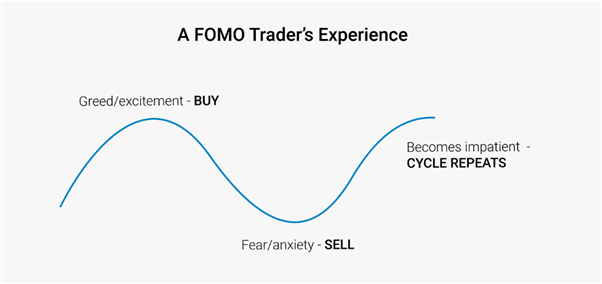
One of the most treacherous emotions prevalent in financial markets is the fear of missing out, or FOMO as it is known. Parabolic rises entice traders to buy after the move has peaked, leading to huge emotional stress when the market reverses and moves in the opposite direction.

Traders that manage to benefit from the positive aspects of psychology, while managing the bad aspects, are better placed to handle the volatility of the financial markets and become a better trader.

The Basics of Trading Psychology

Managing emotions

Fear, greed, excitement, overconfidence and nervousness are all typical emotions experienced by traders at some point or another. Managing the emotions of trading can prove to be the difference between growing the account equity or going bust.

Understanding FOMO

Traders need to identify and suppress FOMO as soon as it arises. While this isn’t easy, traders should remember there will always be another trade and should only trade with capital they can afford to lose.

Cycle of FOMO in the psychology of trading

Avoiding trading mistakes

While all traders make mistakes regardless of experience, understanding the logic behind these mistakes may limit the snowball effect of trading impediments. Some of the common trading mistakes include: trading on numerous markets, inconsistent trading sizes and overleveraging.

Overcoming greed

Greed is one of the most common emotions among traders and therefore, deserves special attention. When greed overpowers logic, traders tend to double down on losing trades or use excessive leverage in order recover previous losses. While it is easier said than done, it is crucial for traders to understand how to control greed when trading.

Importance of consistent trading

New trades often tend to look for opportunities wherever they may appear and get lured into trading many different markets, with little or no regard for the inherent differences in these markets. Without a well thought out strategy that focuses on a handful of markets, traders can expect to see inconsistent results. Learn how to trade consistently.

Japanese Yen (USD/JPY) Testing 150 Resistance Ahead of Bank of Japan Policy Decision

Japanese Yen (USD/JPY) Testing 150 Resistance Ahead of Bank of Japan Policy Decision

The Federal Reserve, Bank of England and the Bank of Japan all announce their latest monetary policy decisions next week and it is the latter that is most likely to spark a fresh bout of volatility. While the Fed and the BoE are expected to leave all policy dials untouched, the BoJ may well tweak their current yield curve control policy and allow JGB yields to move higher. The Japanese central bank currently caps the benchmark 10-year bond yield at 1%, and intervenes if this threshold comes under pressure, but market talk at the moment suggests that the BoJ may allow market yields to rise to 1.5%, a hawkish twist and one that would strengthen the Yen.

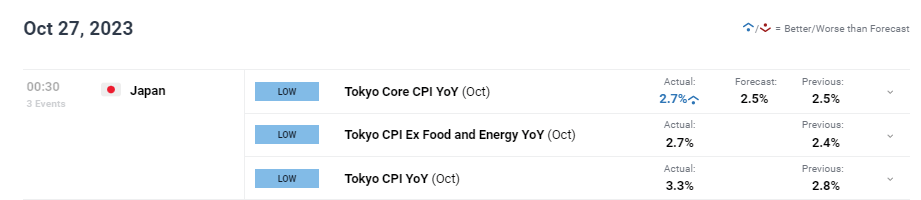
Earlier today the latest Tokyo CPI reading beat market forecasts and showed price pressures rising. This reading is seen as a proxy for national inflation trends and may nudge the BoJ towards acknowledging that inflation in Japan is finally starting to become entrenched. If the Bank of Japan revises its inflation outlook higher, the Japanese Yen will strengthen across the board.

image1.png

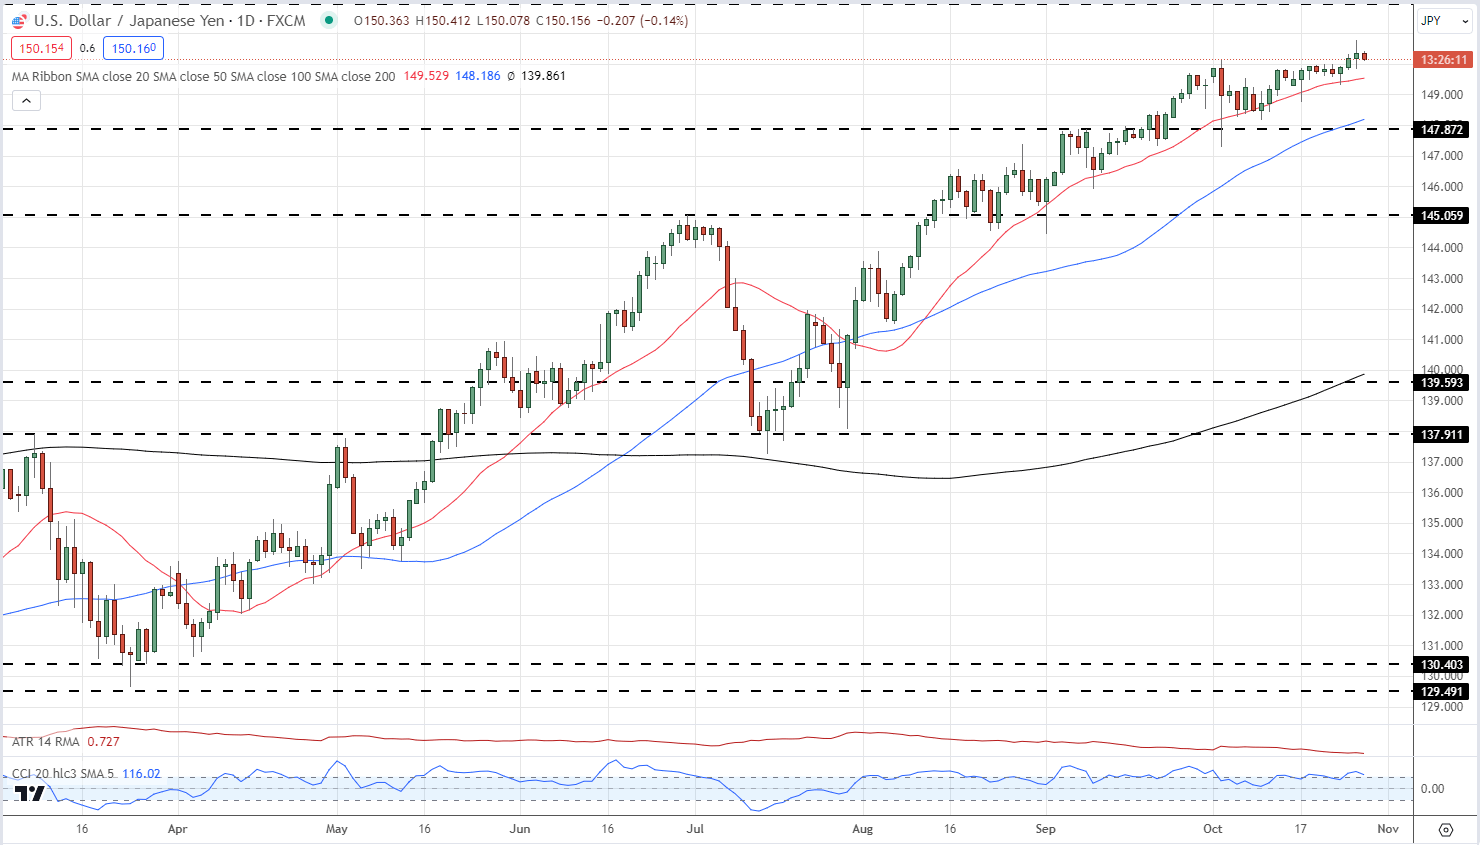
USD/JPY is trading at, or very close to, highs seen one year ago before BoJ intervention sent the pair spiraling lower. The 150 level has been seen as the line in the sand for USD/JPY for many weeks now with any test of this level met with rumors of Japanese official intervention. The pair currently trade just above 150 but a further move higher is very unlikely ahead of next week’s central bank meeting. While the BoJ meeting should be closely watched, the post-Fed decision press conference will also be key for the US dollar’s outlook.

USD/JPY Daily Price Chart – October 27, 2023

image2.png

What is your view on the Japanese Yen – bullish or bearish?? You can let us know via the form at the end of this piece or you can cont

Natural Gas Prices Forecast: EIA Storage Expected to Outpace 5-Year Average

Natural Gas Prices Forecast: EIA Storage Expected to Outpace 5-Year Average

Natural Gas Storage and Outlook

Natural gas futures remained stable as market participants anticipate the release of the government’s weekly storage data. Forecasts suggest an increase in storage, with NatGasWeather predicting a build of +84 Bcf, slightly more than the survey average of +79-82 Bcf, and notably above the 5-year average build of +66 Bcf. The U.S. Energy Information Administration (EIA) will report its figures at 14:30 GMT.

Market Dynamics and Speculation

Wednesday saw U.S. natural gas futures surge by approximately 1%, marking a week’s high. This uptrend can be attributed to the looming colder weather, increased heating demand, and bullish price speculations from the options market. The front-month gas futures for November on the NYMEX experienced a substantial increase, drawing closer to the significant $3 per mmBtu level. Market dynamics suggest a drive by certain firms to keep the November front-month over $3 per mmBtu as the options expire.

Trading Derivatives carries a high level of risk to your capital and you should only trade with money you can afford to lose. Trading Derivatives may not be suitable for all investors, so please ensure that you fully understand the risks involved, and seek independent advice if necessary. A Product Disclosure Statement (PDS) can be obtained either from this website or on request from our offices and should be considered before entering into a transaction with us. Raw Spread accounts offer spreads from 0.0 pips with a commission charge of USD $3.50 per 100k traded. Standard account offer spreads from 1 pips with no additional commission charges. Spreads on CFD indices start at 0.4 points. The information on this site is not directed at residents in any country or jurisdiction where such distribution or use would be contrary to local law or regulation.

Volatility and Spot Prices

Historic daily volatility witnessed peaks and troughs, reaching an all-time high in February 2022 and dropping to its lowest in September 2021. A contributing factor to the suppression of futures price gains has been the decreasing spot prices at the Henry Hub benchmark in Louisiana, which has predominantly been trading below front-month futures this year.

Supply, Demand, and Exports

October saw an elevation in the average gas output in the Lower 48 U.S. states. With winter approaching, it’s anticipated that the cooler season will drive demand. LSEG’s predictions show an increase in U.S. gas demand for the upcoming week. Exports to Mexico are expected to ascend once the New Fortress Energy’s Altamira plant begins operations in November.

Forecast

Considering the imminent cooler weather and rising demand, the short-term perspective for natural gas appears bullish. The U.S. is poised to emerge as the top global LNG supplier by 2023. The European and Asian markets mirror this optimistic outlook, with gas prices hovering around $16 per mmBtu in Europe and $18 per mmBtu in Asia. The international arena, especially supply disruptions linked to the Ukraine situation, is set to play a pivotal role in influencing U.S. exports.

Technical Analysis

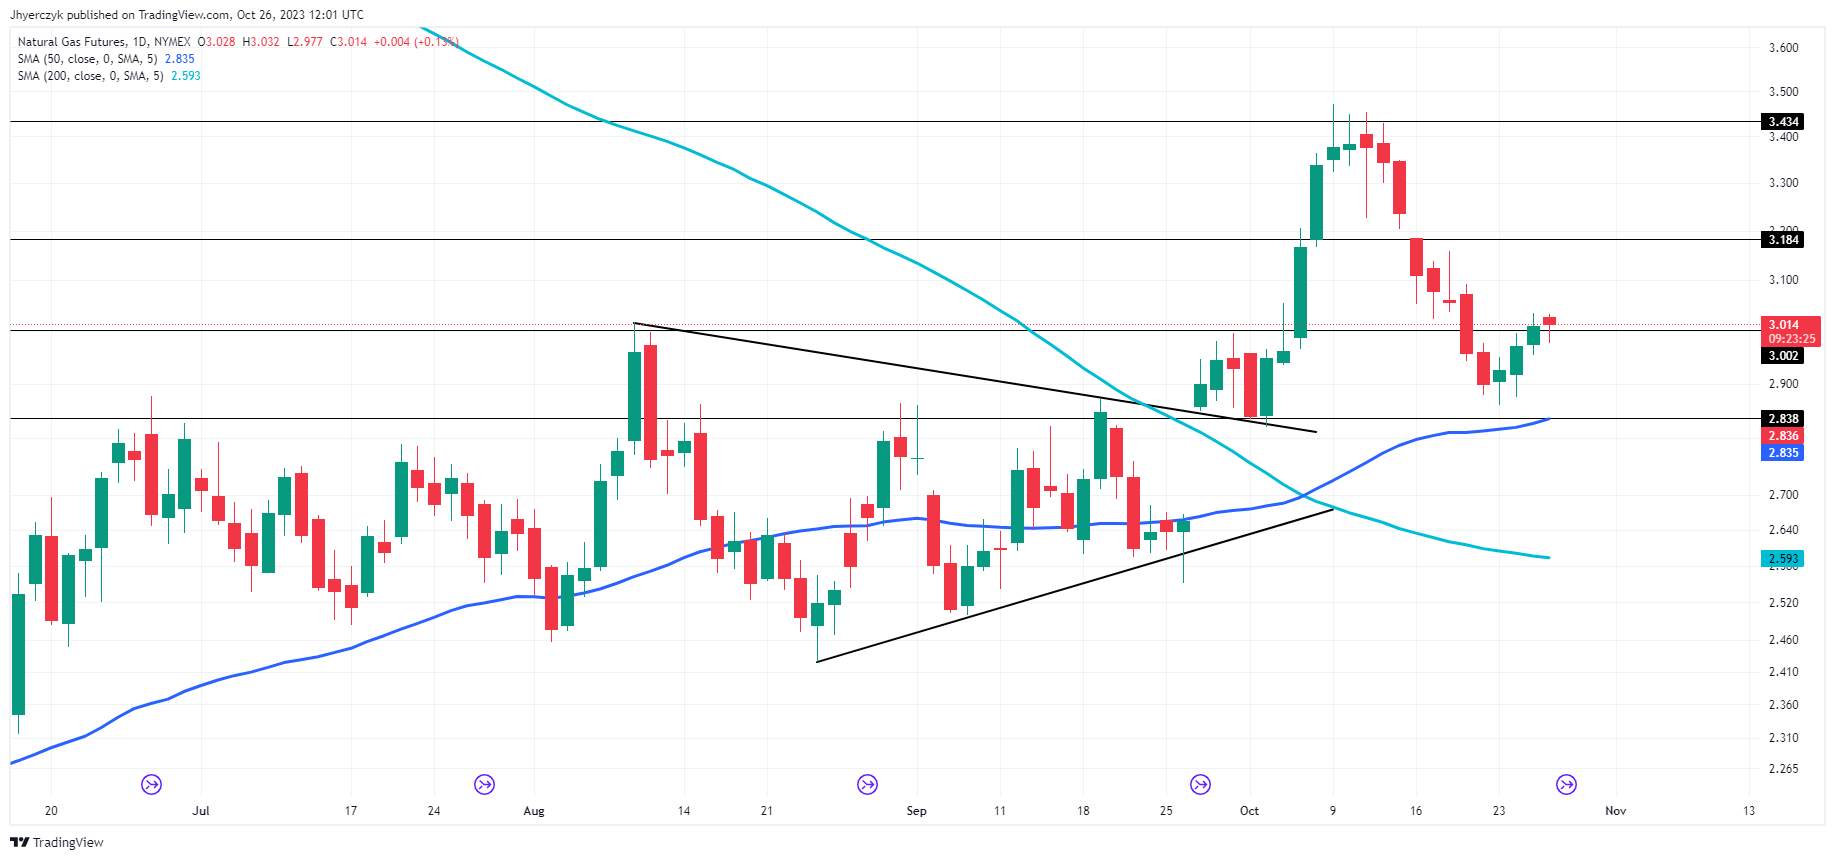
Daily Natural GasThe current daily price of natural gas stands at 3.015. It trades above both the 200-day moving average of 2.593 and the 50-day moving average of 2.835, showcasing bullish momentum in both the short-term and long-term perspectives.

The asset’s position above these key moving averages is a positive sign for traders and suggests sustained upward strength. Furthermore, the price is closely hugging the minor support at 3.002, suggesting a potential pivot point.

With minor resistance at 3.184 and a stronger ceiling at 3.434, any upward movement can face these challenges. Conversely, the main support level at 2.838 acts as a crucial floor for prices in case of a reversal.

Euro (EUR) Latest: ECB Leaves Interest Rates Unchanged, EUR/USD Slips Lower

Euro (EUR) Latest: ECB Leaves Interest Rates Unchanged, EUR/USD Slips Lower

The ECB left all three of its key interest rates unchanged today and noted that while inflation is expected to ‘stay too high for too long’, inflation dropped markedly in September due to strong base effects. The central bank added that ‘The Governing Council’s past interest rate increases continue to be transmitted forcefully into financing conditions. This is increasingly dampening demand and thereby helps push down inflation.’ ECB President Lagarde’s commentary at the upcoming press conference may give traders a clearer view of the thinking behind the central bank’s decision.

image1.png

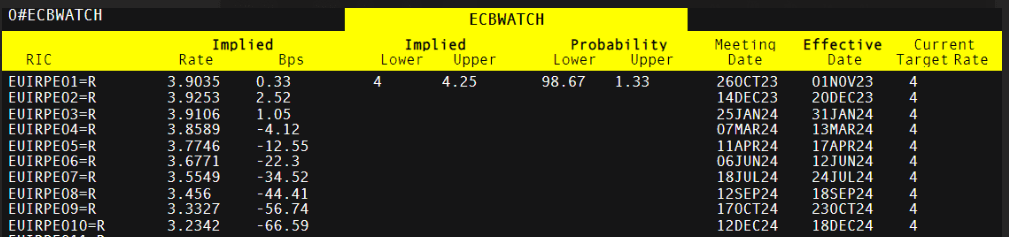
Financial markets had no change in interest rates fully priced-in earlier today with rate cuts being seen between the end of Q1 and the start of Q2 2024 and there is little in today’s decision to change the market’s view.

image2.png

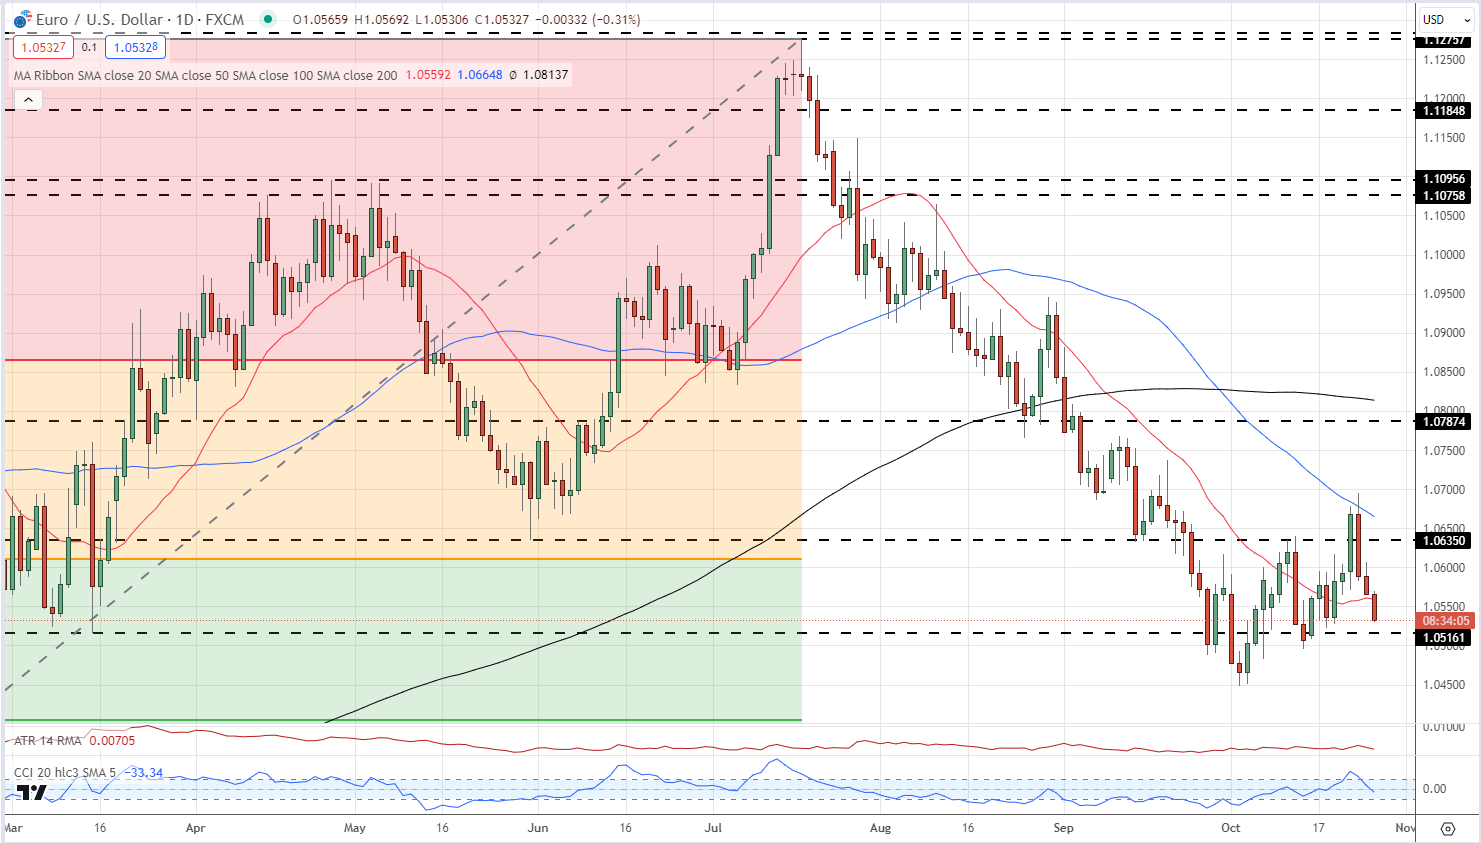
EUR/USD continues to drift lower and is eyeing a break below the 1.0516 and 1.0500 levels. Recent weakness in the pair has been fueled by a stronger US dollar and upcoming US data may push the pair lower.

EUR/USD Daily Price Chart – October 26, 2023

image3.png

IG Retail trader data shows 68.74% of traders are net-long with the ratio of traders long to short at 2.20 to 1.The number of traders net-long is 0.82% higher than yesterday and 2.29% higher than last week, while the number of traders net-short is 5.68% lower than yesterday and 15.02% lower than last week.

is your view on the EURO – bullish or bearish?? You can let us know via the form at the end of this piece or you can contact the author via Twitter @nickcawley1.

The European Central Bank: A Forex Trader’s Guide

The European Central Bank: A Forex Trader’s Guide

The European Central Bank (ECB) is situated in Frankfurt, Germany. It was established in 1998 by the Treaty of Amsterdam. The European Central Bank is different to other central banks in that it controls monetary policy for the entire eurozone. Countries that belong to the eurozone include Austria, Belgium, Cyprus, Estonia, Finland, France, Germany, Greece, Ireland, Italy, Latvia, Lithuania, Luxembourg, Malta, The Netherlands, Portugal, Slovakia, Slovenia and Spain.

European Central Bank

What is the ECB

The European Central Bank acts as the central bank for the 19 countries that belong to the eurozone. The European Central Bank is overseen by a governing council that consists of six executive board members, with one serving as the president. The executive board members are appointed by the European Council.

The European Central Bank’s primary objective is to maintain price stability. They use monetary policy to support the economy and job creation.

Key Economic Mandates of the ECB

The European Central Bank’s primary mandate or objective is price stability. Price stability is the control of inflation, Harmonised Index of Consumer Prices (HICP) and the exchange rate of the EUR.

1) Price Stability – which is price stability or inflation

2) Financial stability – Through the control of price stability and sometimes other mechanisms.

Price Stability

To maintain price stability, the European Central Bank influences the short-term interest rate for the eurozone. The European Central Bank has a target interest rate (like most central banks) of below, or close to, 2%. Although they target inflation mostly, GDP and unemployment data have a big effect on the decisions the policy makers make.

If inflation goes above 2%, the European Central Bank may signal a hiking of the interest rate to the public to tighten the eurozone’s economic expansion and bring down inflation. If unemployment numbers are increasing and the economy is slowing down, the bank may have to make the decision to decrease interest rates, to stimulate the economy and job growth. A period of rising inflation and increasing unemployment will require the policy makers to weigh the pros and cons of tightening the economy to reign-in inflation or stimulate the economy to produce jobs.

Financial Stability

The European Central Bank also plays a large role in keeping the eurozone’s financial system stable. In times of a crisis they can do this by adding liquidity to the system, either by buying bonds on the open market or decreasing the interest rate to extremely low levels to help distressed debt holders pay back their obligations.

If the European Central Bank does not add liquidity in times of a crisis, the entire financial system could collapse.

How ECB interest rates affect the Euro

Interest rate impact on the Euro

The European Central Bank can affect the value of the Euro through changes in interest rate expectations. Traders should understand that currencies tend to appreciate when interest rate expectations increase, not just from increases in the nominal interest rate.

For example, if the European Central Bank keeps interest rates unchanged but issues forward guidance (tells the market) that they expect more interest rate hikes in future, the value of the Euro tends to appreciate.

A q uantitative easing program (QE) has a similar effect to interest rates on the Euro. Quantitative easing is the buying of securities on the open market by a Central Bank in order to stimulate the economy and add liquidity to the financial system. Historically it has only been done in times of a financial crisis. Increased quantitative easing reduces the value of the Euro because it increases the amount of money in supply.

Interest rate impact on the economy

The European Central Bank lowers interest rates when it is trying to stimulate the economy (GDP) and increases interest rates when it is trying to contain inflation caused by an economy operating above potential (overheating).

Lower interest rates stimulate an economy in a few ways:

  1. Businesses can borrow money and invest in projects that will receive more than the risk borrowing rate.
  2. When interest rates are lower the stock market is discounted at a lower rate, leading to an appreciation in stock market values which causes a wealth effect.
  3. People invest their money into the economy (stocks and other assets) because they can earn more in these assets than at currently low interest rates.

How to trade ECB interest rate decisions

The table below displays the possible scenarios that come from a change in interest rate expectations. Traders can use this information to forecast if the currency is likely to appreciate or depreciate and how to trade it.

Market expectations Actual Results Resulting FX Impact
Rate Hike Rate Hold Depreciation of currency
Rate Cut Rate Hold Appreciation of currency
Rate Hold Rate Hike Appreciation of currency
Rate Hold Rate Cut Depreciation of currency

Let’s look at an example, EUR/USD, where the European Central Bank ended its long-time program of quantitative easing. Ending the quantitative easing program means that the central bank would no longer be adding more money to the system. On December 13, 2018 the European Central Bank announced an end to its quantitative easing program, which led to an appreciation in the Euro because it signalled that less money than expected would be in the economy.

European central bank ends quantitative easing program

Top Takeaways of the ECB and Forex Trading

  • The European Central Bank is fundamental to the value of the Euro.
  • The Euro tends to appreciate or depreciate depending on changes in interest rate expectations, not just on actual changes.
  • Quantitative easing has a similar effect to changes in interest rates. Changes in expectations of quantitative easing will have an effect on the Euro.
  • Rising inflation does not mean the European Central Bank will increase interest rates, it depends on the balance between economic growth and inflation. The ECB will raise rates if inflation is close to, at, or above target – the ECB’s primary mandate is to maintain price stability (inflation).

Learn more about forex fundamentals

Use the DailyFX economic calendar to keep an eye on all the important economic data releases, including central bank speeches and interest rate data. Don’t forget to bookmark our Central Bank Rates Calendar so you can prepare for regular announcements.

We also recommend finding out more about the role of central banks in the forex market, and central bank interventions involve.

If you are just getting started on your trading journey, get to grips with the basics of forex trading in our New to Forex trading guide.

Learn more about other central banks

Most central banks have similar mandates of controlling price stability and upholding financial stability, although there are some differences. Learn more about the different central banks:

  1. The European Central Bank
  2. The Bank of England
  3. The Swiss National Bank
  4. The Federal Reserve
Oil Prices Forecast: Weaker as Traders Juggle Geopolitical Risks, Demand Concerns

Oil Prices Forecast: Weaker as Traders Juggle Geopolitical Risks, Demand Concerns

Fluctuation Amid Geopolitical Tensions and Market Fundamentals

Oil prices took a hit last Thursday, succumbing to a stronger dollar and increasing U.S. crude stockpiles, thus erasing the gains seen earlier due to heightened Middle East tensions. The volatile market reflects a complex interplay between geopolitical risks and fundamental market dynamics.

U.S. Crude Inventories on the Rise

U.S. crude inventories surged by 1.4 million barrels to reach 421.1 million barrels, surpassing analysts’ expectations of a 240,000-barrel increase. This rise in stockpiles points to weaker-than-anticipated demand in the U.S. market. Moreover, refinery utilization rates also dipped by 0.5 percentage point to 85.6%, indicating a sluggish demand for refined products.

Trading Derivatives carries a high level of risk to your capital and you should only trade with money you can afford to lose. Trading Derivatives may not be suitable for all investors, so please ensure that you fully understand the risks involved, and seek independent advice if necessary. A Product Disclosure Statement (PDS) can be obtained either from this website or on request from our offices and should be considered before entering into a transaction with us. Raw Spread accounts offer spreads from 0.0 pips with a commission charge of USD $3.50 per 100k traded. Standard account offer spreads from 1 pips with no additional commission charges. Spreads on CFD indices start at 0.4 points. The information on this site is not directed at residents in any country or jurisdiction where such distribution or use would be contrary to local law or regulation.

Geopolitical Factors in Play

Wednesday’s market saw nearly a 2% increase in oil prices owing to geopolitical unrest. However, gains were curtailed by a Wall Street Journal report revealing Israel’s decision to temporarily hold off on invading Gaza. These geopolitical uncertainties are causing rapid swings in oil pricing but seem to be overshadowed by underlying market fundamentals.

Economic Indicators Add Pressure

Adding to the bearish outlook, macroeconomic data from the euro zone showed an unexpected decline in business activity. Moreover, the stronger dollar is putting additional downward pressure on oil prices, as it makes the commodity more expensive for holders of other currencies.

Short-Term Outlook: Bearish

In the short term, the market sentiment leans bearish. Despite occasional spikes due to geopolitical risks, the underlying fundamentals point to a weaker demand outlook. The upcoming Chinese stimulus, involving the issuance of 1 trillion yuan ($137 billion) in sovereign bonds, offers a glimmer of hope for crude demand, but it’s countered by Beijing’s new policies aimed at capping oil refining capacities.

By addressing both the supply and demand dynamics and the geopolitical factors affecting the oil market, it becomes clear that traders should brace for continued volatility, with a bearish near term outlook.

Technical Analysis

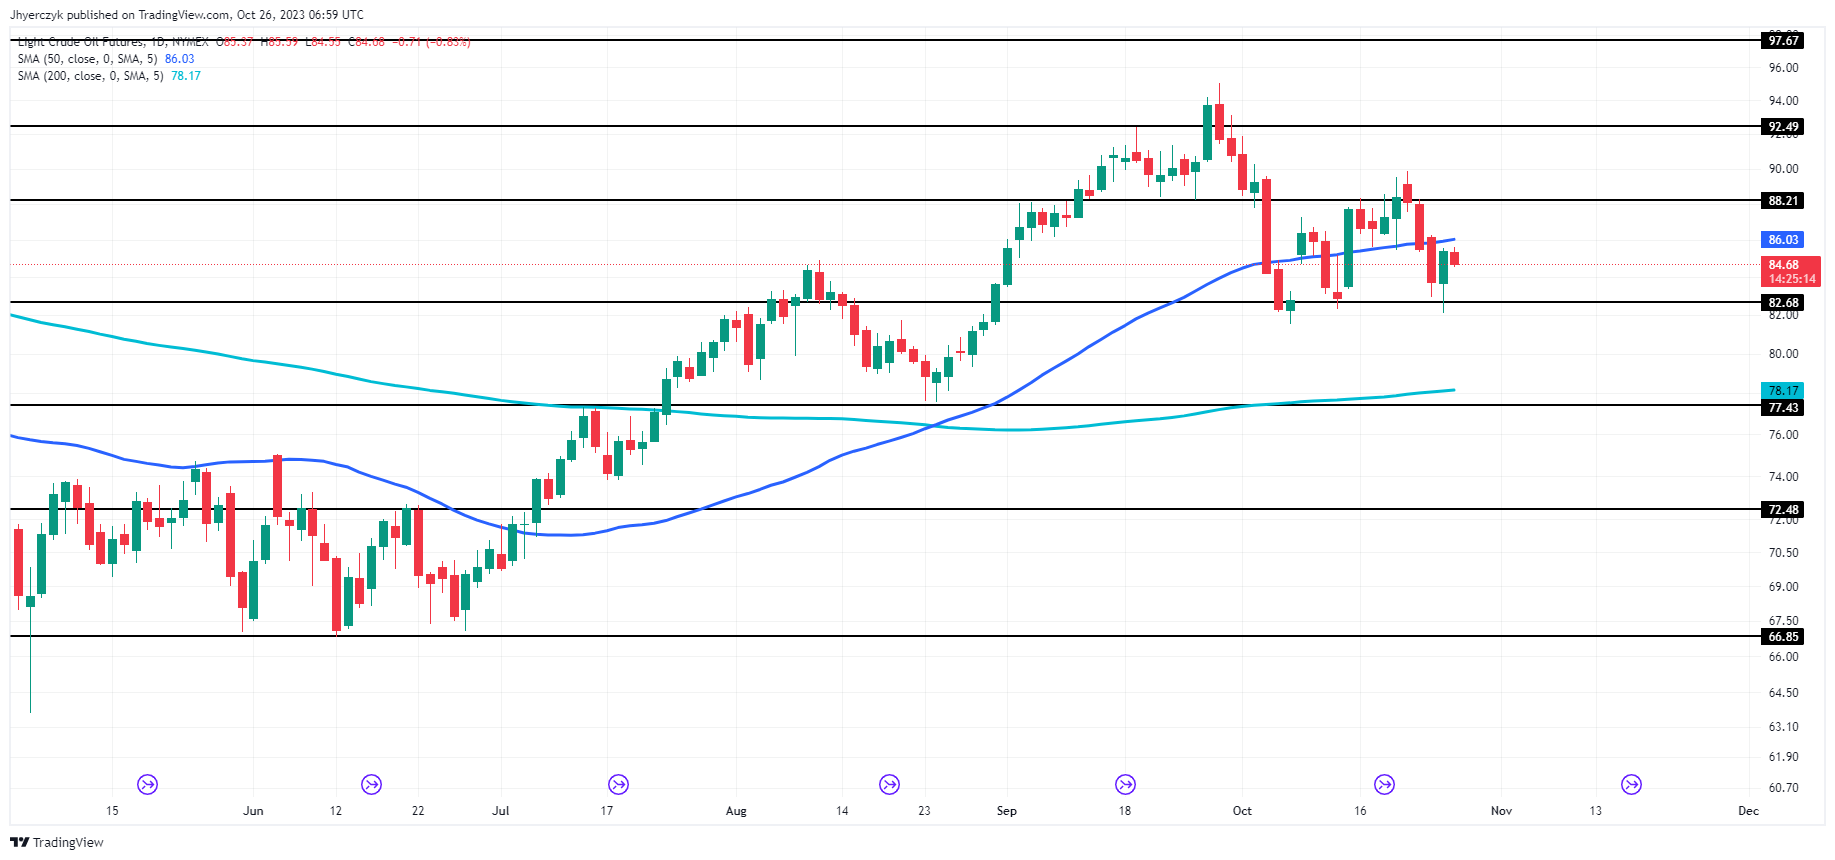
Daily Light Crude Oil FuturesThe current daily price of light crude oil futures at $84.65 sits between the 50-day and 200-day moving averages, at $86.03 and $78.17 respectively, suggesting a sideways market in the near term.

It is above the main support at $77.43 but below the minor resistance at $88.21, pointing to a neutral zone. Market sentiment is neither strongly bullish nor bearish, leaning more towards a consolidating market.

While the asset is hovering closer to the 50-day moving average, indicating short-term bullishness, it remains under minor resistance, which caps the upside potential.

Breaking $82.68 support could trigger an acceleration into the 200-day moving average at $78.17.