US Indices Beginning to Look Vulnerable; S&P 500, Nasdaq, Dow Price Setups

US Indices Beginning to Look Vulnerable; S&P 500, Nasdaq, Dow Price Setups

S&P 500: Make or break?

The lower low created this week relative to the early-October lows highlights the growing risk of a deeper setback in the S&P 500 index, which is now testing the 200-day moving average, near the early-October low of 4215, and the lower edge of a declining channel since July. A decisive break below could expose the downside toward the end-April low of 4050.

The index last week pulled back from key converged resistance on the 89-day moving average. The failure of the index to touch the upper edge of the channel was a sign of underlying weakness. The turnaround in the daily cloud structure is another reflection of changing dynamics, as highlighted in late September. See “US Indices Risk Support Test After Hawkish Fed: S&P 500, Nasdaq Price Action,” published September 21.

S&P 500 Daily Chart
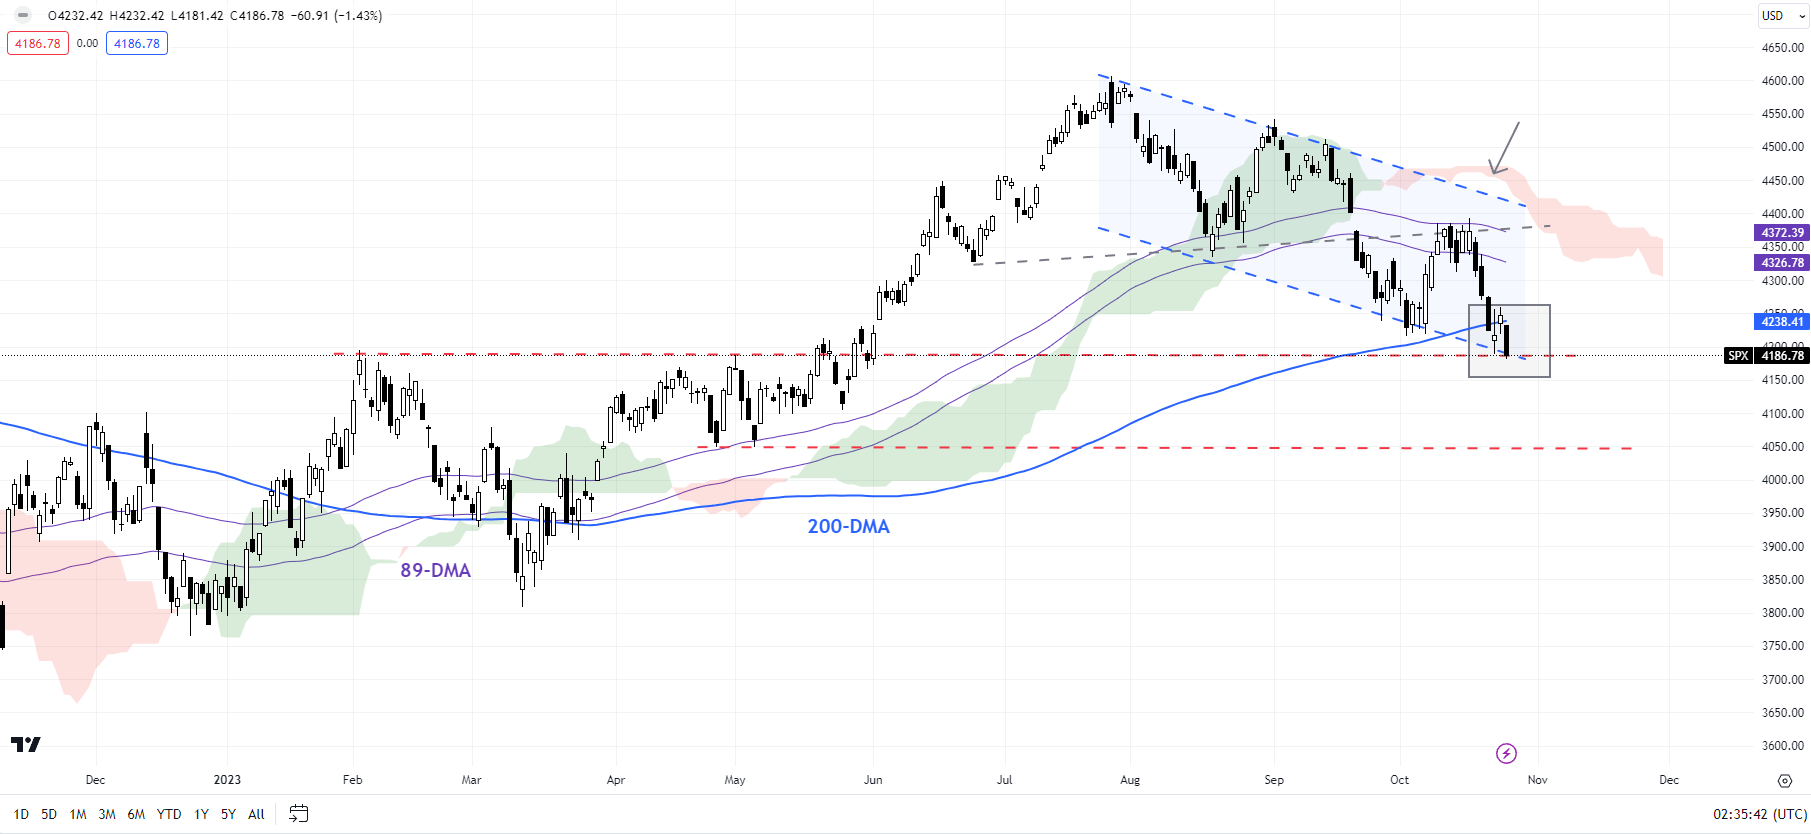
image1.png

Chart Created by Manish Jaradi Using TradingView

Zooming out from a multi-week perspective, the weakness since August reinforces the broader fatigue, as pointed out in previous updates. See “US Indices Hit a Roadblock After Solid Services Print: S&P 500, Nasdaq,” published September 7; “US Indices Rally Beginning to Crack? S&P 500, Nasdaq Price Setups,” published August 3; “S&P 500, Nasdaq 100 Forecast: Overly Optimistic Sentiment Poses a Minor Setback Risk,” published July 23.

Elevate your trading skills and gain a competitive edge. Get your hands on the U.S. dollar Q4 outlook today for exclusive insights into key market catalysts that should be on every trader’s radar.

Nasdaq 100 Daily Chart
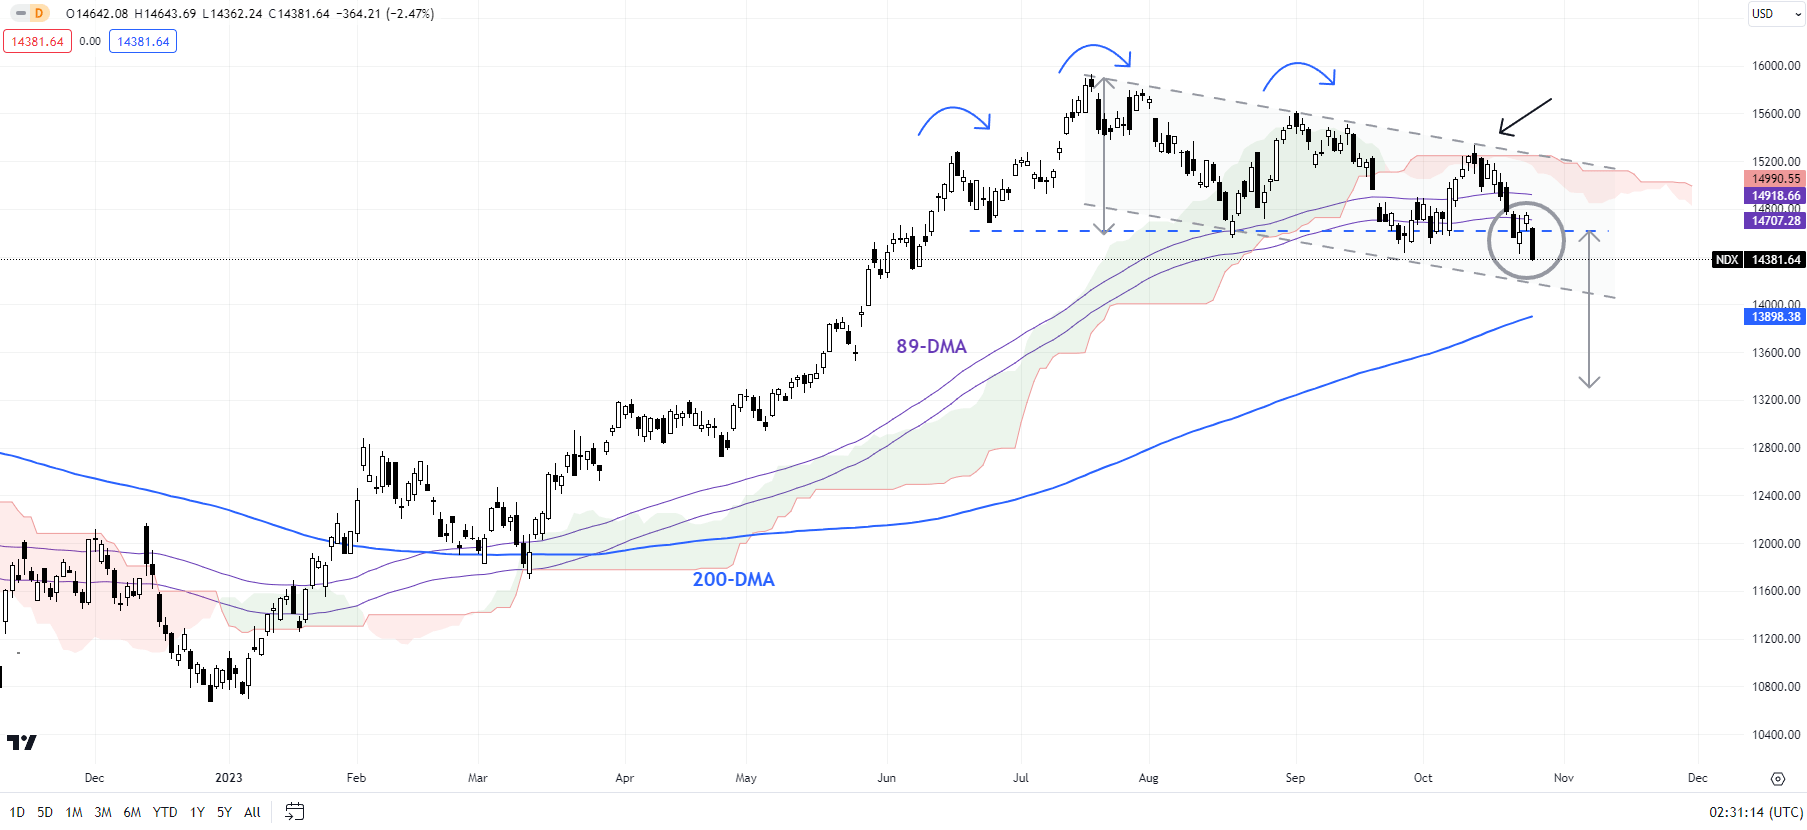
image2.png

Nasdaq 100: Retests crucial support

The Nasdaq 100 index is looking weak as it retests vital cushion area at the September low of 14435. Below that, the next support is on the lower edge of a declining channel since July, slightly above the 200-day moving average (now at about 13900). The index has fallen sharply in recent sessions from a significant hurdle on the upper edge of the channel. Subsequent support is at 13300 (the 50% retracement of the 2023 rise).

The weakness since mid-2023 is a reflection of broader fatigue on higher timeframe charts, as highlighted in arecent update, raising the risk of a gradual weakening, similar to the May-October drift lower in gold. For more discussion, see “Is Nasdaq Following Gold’s Footsteps? NDX, XAU/USD Price Setups,” published August 14.For the immediate downward pressure to fade, at minimum, the index needs to break above the October high of 15335.

Dow Jones Industrial Average Weekly Chart
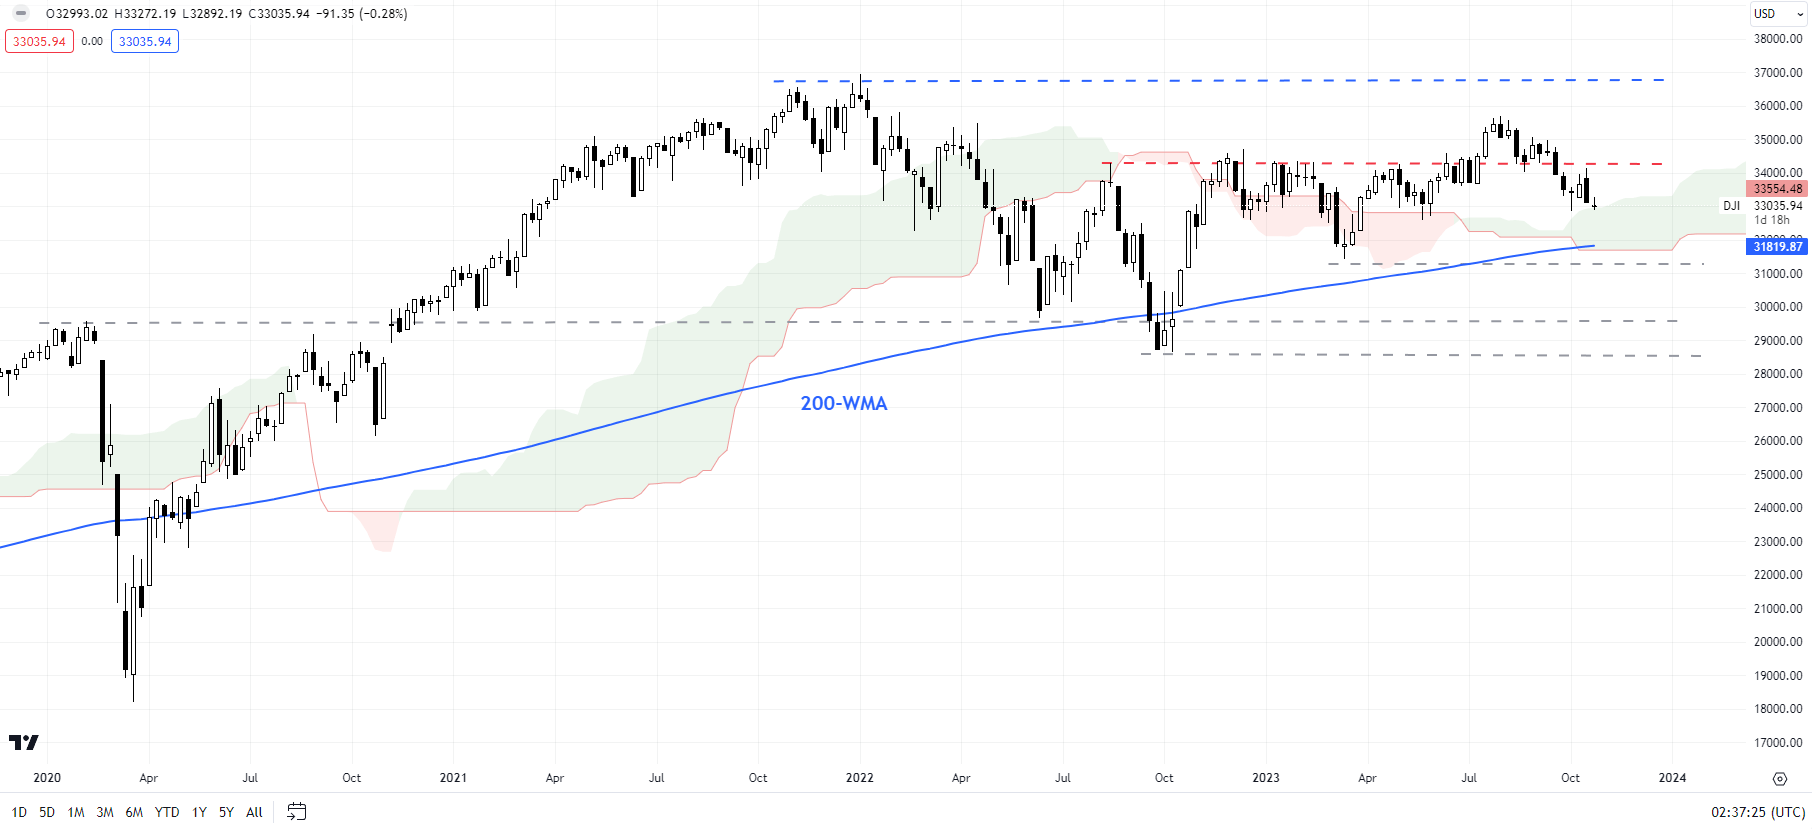
image3.png

Dow Jones Industrial Average (DJIA): Within the range

The failure to hold above crucial resistance on a horizontal trendline since mid-2022 has raised the prospect of a false bullish break. Any break below the 200-day moving average, near the March low of 31430 would confirm the development. Such a break would reinforce the broader sideways trend prevailing since early 2022. A break below 31430 could open the way toward the end-2023 low of 28715.

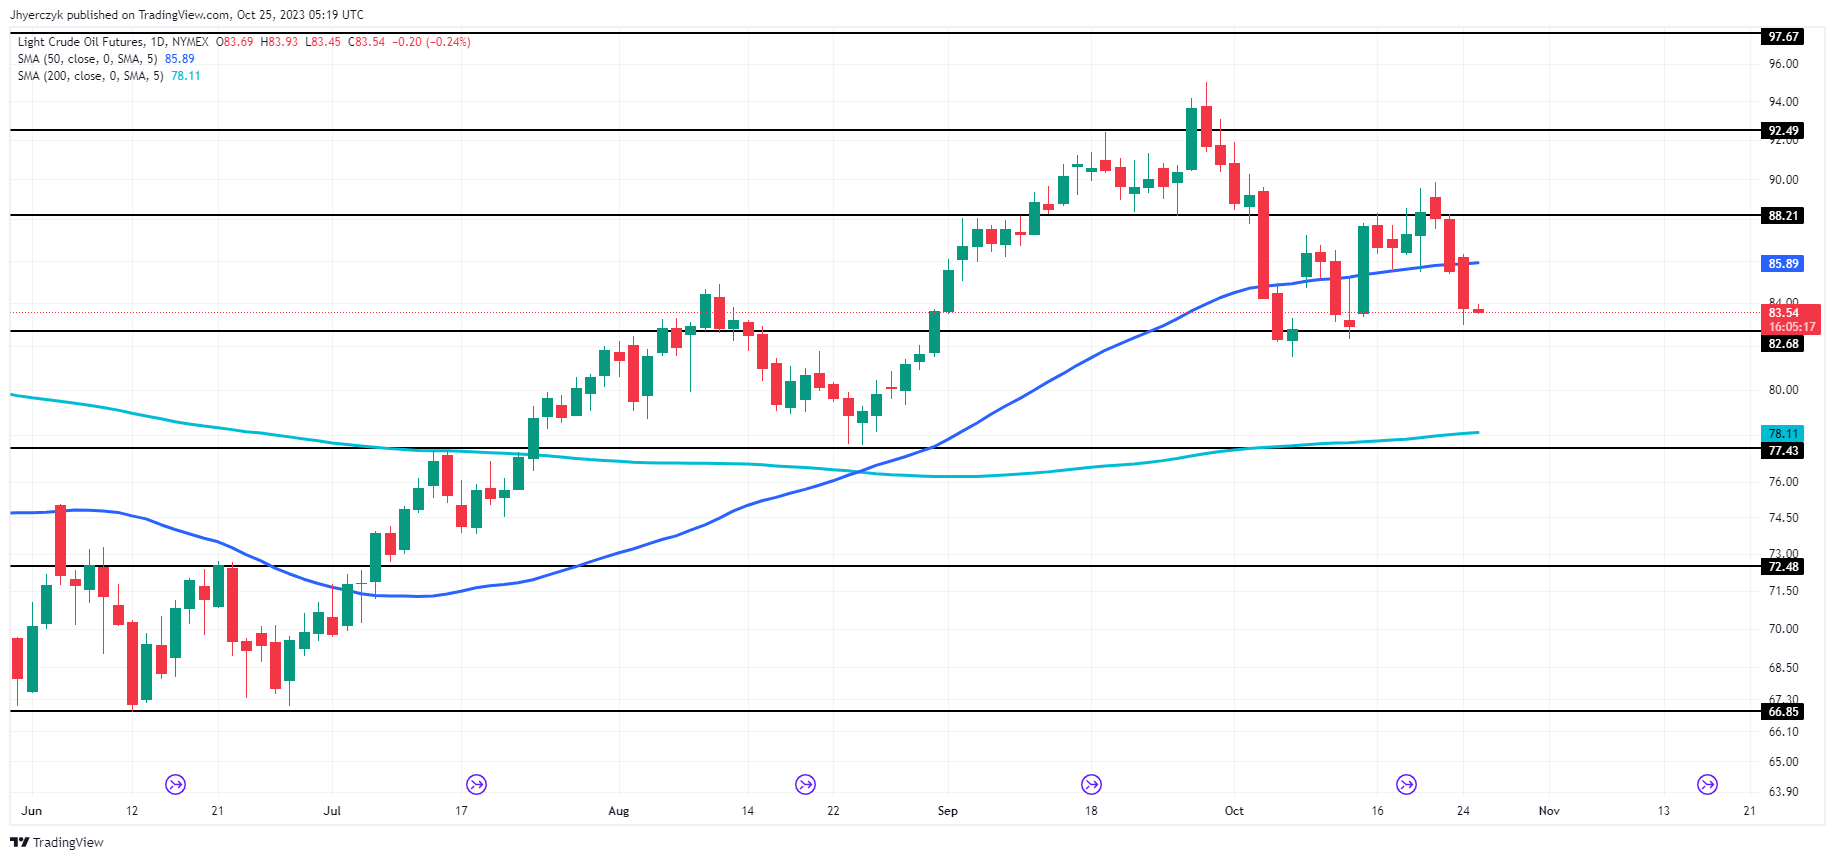
Oil Prices Forecast: Middle-East Tensions Eclipsed by Bearish European Outlook

Oil Prices Forecast: Middle-East Tensions Eclipsed by Bearish European Outlook

Geopolitical Tensions Struggle to Lift Oil Amid Economic Gloom

Concerns about Middle Eastern supply disruptions due to the Israel-Hamas conflict have failed to buoy oil prices, which have been dragged down by fears of waning demand in Europe. Recent data indicate a surprise decline in Eurozone business activity, hinting at a possible recession in the bloc. This has overshadowed geopolitical tensions and has led to decreased oil consumption compared to last year, as per Euroilstock data.

Oil Markets Face Uncertainty

Mixed signals are being sent from various corners of the globe. Efforts to prevent the Israel-Hamas conflict from escalating have been discussed by the leaders of the U.S. and Saudi Arabia, adding another layer of complexity to oil markets. However, European economic indicators, particularly softer PMIs, suggest weakening demand, nullifying the potential bullish impact of any geopolitical risk premium associated with the Middle East conflict.

Trading Derivatives carries a high level of risk to your capital and you should only trade with money you can afford to lose. Trading Derivatives may not be suitable for all investors, so please ensure that you fully understand the risks involved, and seek independent advice if necessary. A Product Disclosure Statement (PDS) can be obtained either from this website or on request from our offices and should be considered before entering into a transaction with us. Raw Spread accounts offer spreads from 0.0 pips with a commission charge of USD $3.50 per 100k traded. Standard account offer spreads from 1 pips with no additional commission charges. Spreads on CFD indices start at 0.4 points. The information on this site is not directed at residents in any country or jurisdiction where such distribution or use would be contrary to local law or regulation.

China and U.S. Inventory Levels: A Ray of Hope?

Contrarily, China, the world’s largest oil importer, has approved a massive bill to issue 1 trillion yuan ($137 billion) in sovereign bonds to stimulate its economy, offering some support to crude prices. Furthermore, falling U.S. oil inventories, which declined by 2.7 million barrels for the week ending October 20, according to the American Petroleum Institute (API) stand in contrast to analysts’ expectations of an inventory rise, adding a positive spin to the market.

The U.S. Economy Holds Firm

U.S. economic data has shown resilience, pulling the dollar up and rendering dollar-denominated oil more expensive for other currency holders. The strength of the U.S. economy is stark when compared to the UK and the Eurozone, whose business activities are contracting, further pressuring oil prices.

Short-Term Outlook: Bearish

Given the prevailing economic data and geopolitical context, the short-term market sentiment for oil appears to be bearish. While U.S. inventories and China’s stimulus could offer some support, the overwhelming economic indicators from Europe and potential for conflict escalation in the Middle East are likely to keep prices subdued.

Technical Analysis


The current daily price of light crude oil futures is $83.54, sandwiched between the minor support at $82.68 and main support at $77.40. It’s below the 50-day moving average of $85.89, suggesting bearish momentum, but above the 200-day moving average of $78.11, signaling long-term bullishness.

However, the fact that it’s trading below the 50-day moving average and closer to the minor support level rather than the minor resistance of $88.21 indicates near-term caution among traders.

Overall, despite the long-term bullish indicators, the immediate sentiment leans more toward the bearish side.

DAX Index: German Business Sentiment and Deutsche Bank Earnings in Focus

DAX Index: German Business Sentiment and Deutsche Bank Earnings in Focus

DAX Tuesday Overview

On Tuesday, the DAX gained 0.54%. Following a 0.02% gain on Monday, the DAX ended the day at 14,880.

Corporate Earnings Mute Recession Signals

On Tuesday, prelim private sector PMI numbers from Germany and the Eurozone sent the DAX into negative territory. An unexpected contraction in the German services sector raised the prospect of a German recession. More marked contractions across the Eurozone private sector fueled bets on a Eurozone recession.

Trading Derivatives carries a high level of risk to your capital and you should only trade with money you can afford to lose. Trading Derivatives may not be suitable for all investors, so please ensure that you fully understand the risks involved, and seek independent advice if necessary. A Product Disclosure Statement (PDS) can be obtained either from this website or on request from our offices and should be considered before entering into a transaction with us. Raw Spread accounts offer spreads from 0.0 pips with a commission charge of USD $3.50 per 100k traded. Standard account offer spreads from 1 pips with no additional commission charges. Spreads on CFD indices start at 0.4 points. The information on this site is not directed at residents in any country or jurisdiction where such distribution or use would be contrary to local law or regulation.

However, a better-than-expected US services PMI and corporate earnings drove buyer demand.

Importantly, 10-year US Treasury yields failed to revisit recent peaks, supporting riskier assets.

On Tuesday, the Nasdaq Composite Index ended the day up 0.93%, with the S&P 500 and Dow gaining 0.73% and 0.62%.

The Tuesday Market Movers

MTU Aero rallied 6.10%, with defense stock Rheinmetall AG gaining 3.18% on Tuesday. Adidas was also a front-runner, rising by 1.79%. Puma retained its full-year profit forecast, supporting Adidas.

However, bank stocks ended the session with heavy losses. Commerzbank and Deutsche Bank AG ended the Tuesday session down 1.62% and 1.18%.

The auto sector was also a drag on the DAX.

Porsche and BMW fell by 1.01% and 0.86%. Volkswagen and Mercedes Benz Group saw losses of 0.45% and 0.28%, with Daimler Truck Holding declining by 0.27%. Recessionary fears weighed on the demand outlook. On Monday, Volkswagen cut its profit margin outlook, which resonated on Tuesday.

Tuesday Focus: German Business Sentiment and Earnings

Business sentiment will be in the spotlight on Wednesday. Economists forecast the German Ifo Business Climate Index to rise from 85.7 to 85.9 in October. Despite the disappointing headline private sector PMIs for October, the survey revealed firms were less pessimistic. An improving outlook may offer support for DAX-listed stocks. Economists forecast the Ifo Expectations index to increase from 82.9 to 83.3.

Beyond the numbers, corporate earnings also need consideration. Deutsche Bank will release earnings results on Wednesday.

US Housing Sector and Earnings in the Spotlight

Housing sector figures from the US will draw interest later in the Wednesday session. Economists forecast new home sales to tumble by 11.0% in September (Aug: -8.7%). A deteriorating US housing market could be an early warning sign for the US economy.

While the numbers warrant consideration, US Treasury yields and corporate earnings will likely dictate buyer appetite for riskier assets.

After earnings results from Alphabet (GOOGL), Coca-Cola (KO), General Electric (GE), General Motors (GM), and Microsoft (MSFT), Meta Platforms (META) will be in the spotlight.

The futures markets point to a mixed Wednesday session. The DAX was up 23 points, while the Nasdaq mini was down 42 points.

Short-Term Forecast

Corporate earnings must continue to fuel demand for DAX-listed stocks. German and euro area recessionary jitters will remain a headwind as investors look ahead to the ECB monetary policy decision.

DAX Technical Indicators

Daily Chart

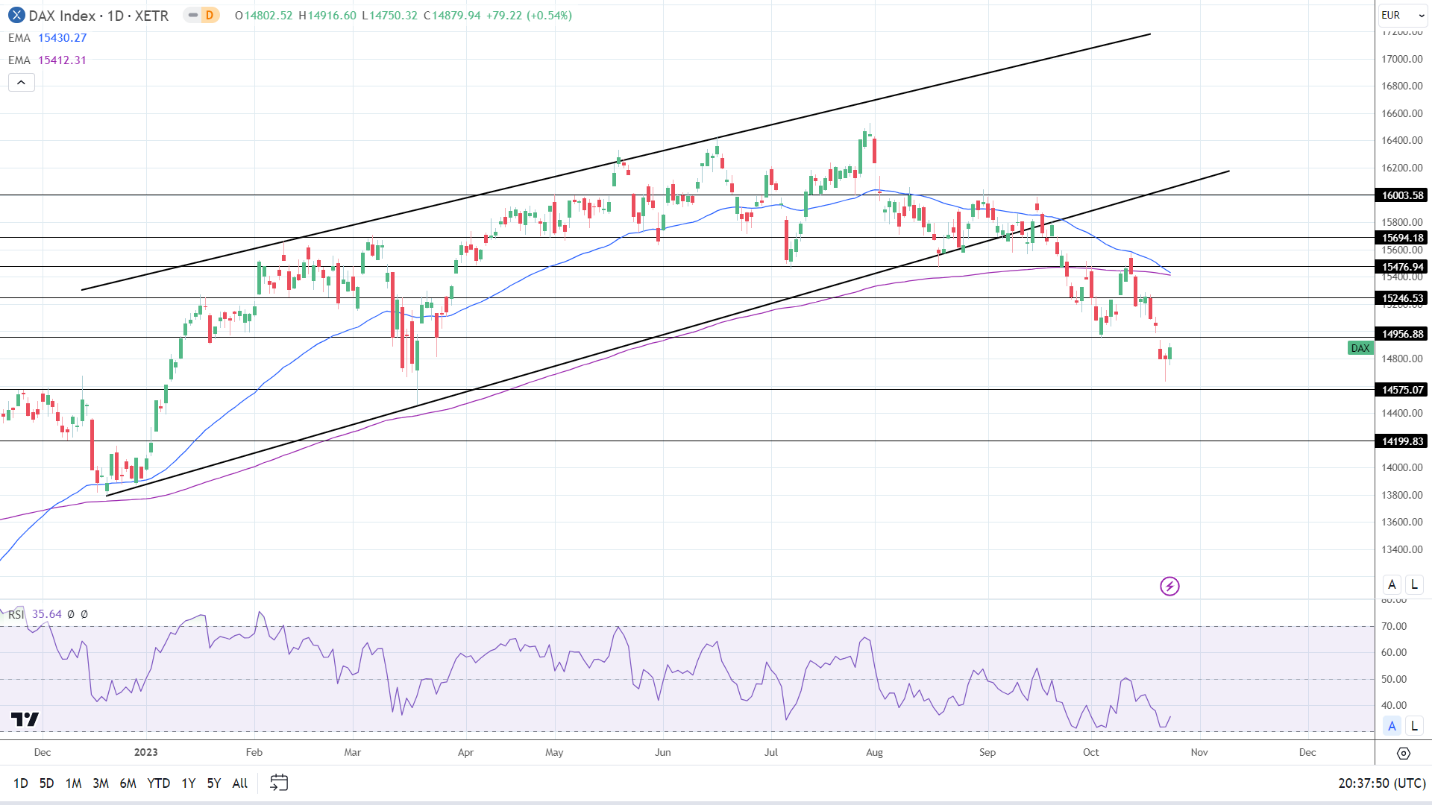
The DAX remained below the 50-day and 200-day EMAs, affirming bearish price signals. Significantly, the 50-day EMA converged on the 200-day EMA. A bearish cross of the 50-day EMA through the 200-day EMA would pressure the DAX.

A DAX break above the 14,957 resistance level would support a return to 15,000. German business sentiment and corporate earnings will be focal points today.

The 14-day RSI reading of 35.64 indicates a DAX drop below 14,750 before entering oversold territory.

DAX Daily Chart sends bearish price signals.
DAX 251023 Daily Chart

4-Hourly Chart

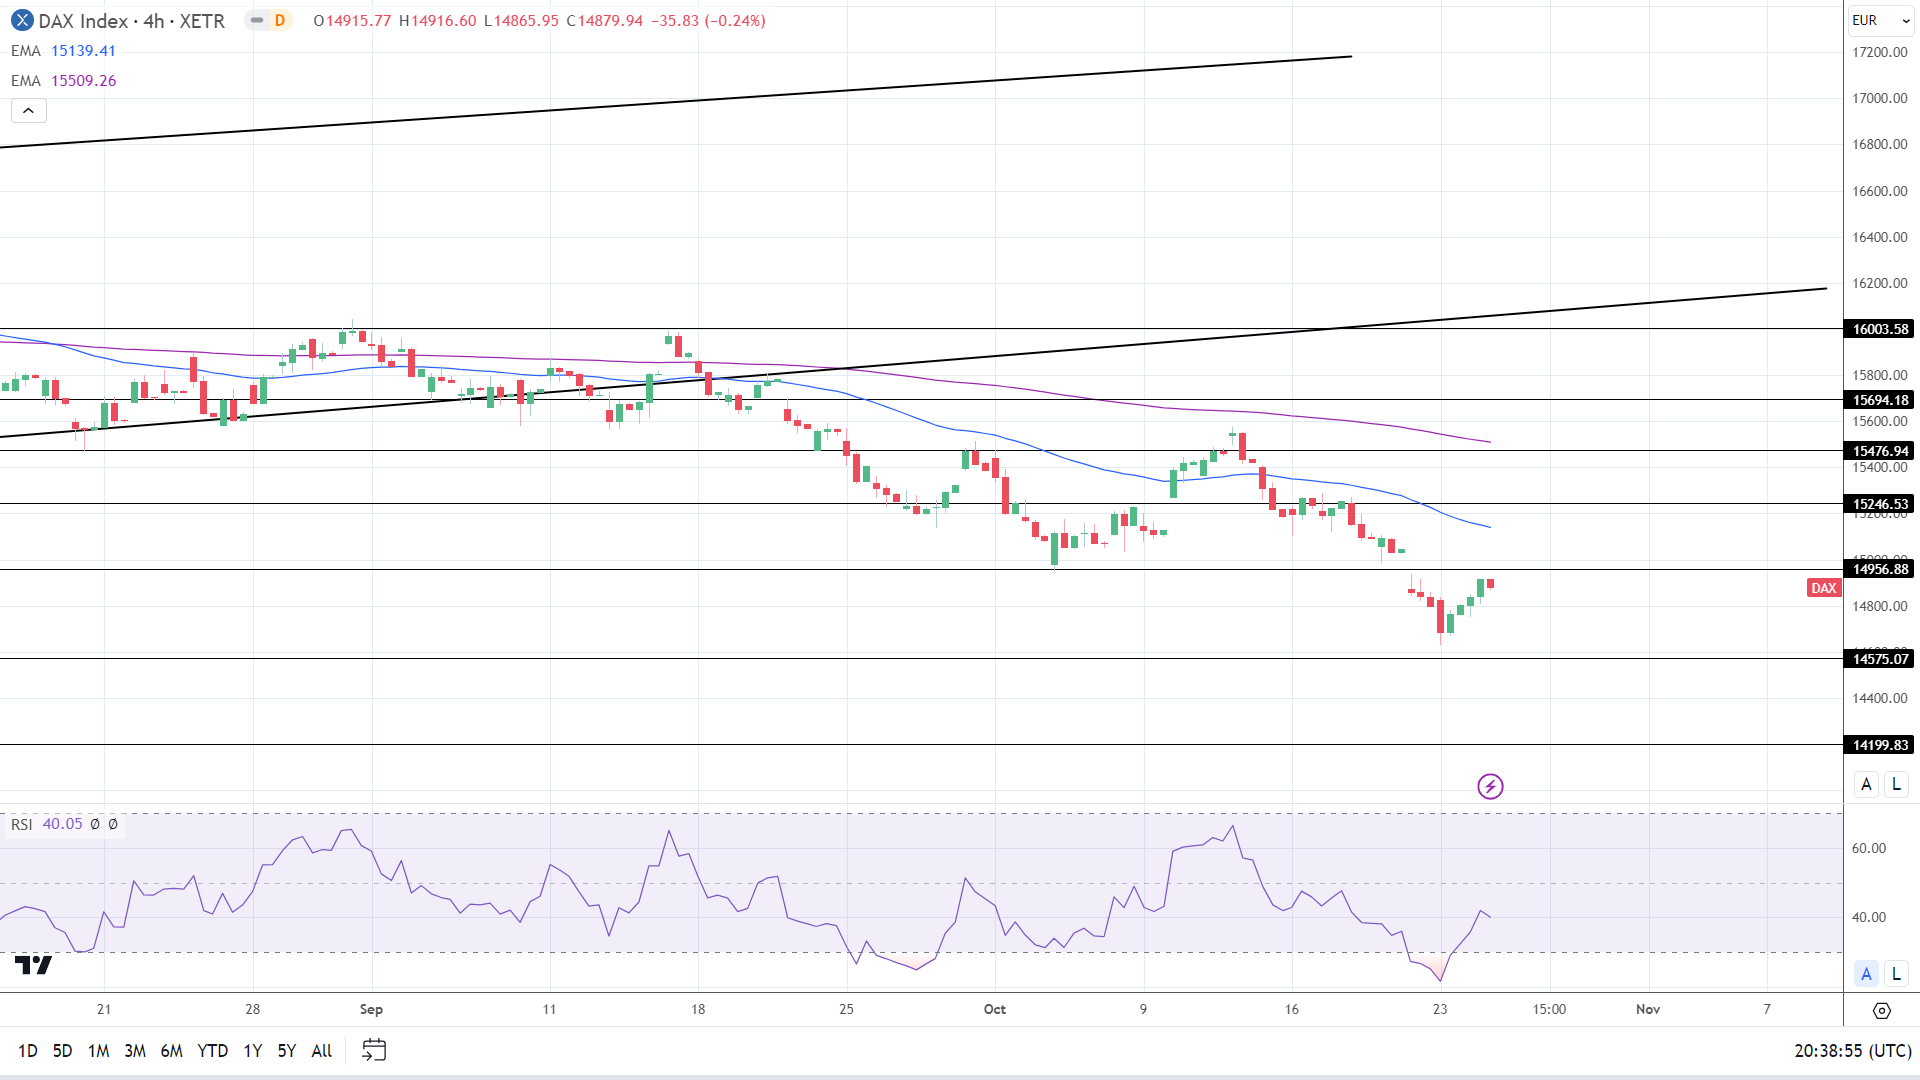
The DAX sits below the 50-day and 200-day EMAs, reaffirming bearish price signals. A DAX break above the 14,957 resistance level would give the bulls a run at the 50-day EMA.

However, a fall through 14,800 would support a move toward the 14,575 support level.

The 40.05 14-4 hour RSI reading indicates a DAX return to 14,750 before entering oversold territory.

4-Hourly Chart affirms bearish price signals.
DAX 251023 4-Hourly Chart
EUR/USD Forecast: German Business Sentiment in Focus Pre-ECB

EUR/USD Forecast: German Business Sentiment in Focus Pre-ECB

Tuesday Overview

On Tuesday, the EUR/USD declined by 0.74%. Partially reversing a 0.71% gain from Monday, the EUR/USD ended the day at $1.05895. The EUR/USD rose to a high of $1.06945 before falling to a low of $1.05829.

German Business Sentiment in the Spotlight Pre-ECB

The German economy is in the spotlight again on Wednesday. German Ifo Business Climate figures for October will garner investor attention. Economists forecast the headline Ifo Business to increase from 85.7 to 85.9.

Trading Derivatives carries a high level of risk to your capital and you should only trade with money you can afford to lose. Trading Derivatives may not be suitable for all investors, so please ensure that you fully understand the risks involved, and seek independent advice if necessary. A Product Disclosure Statement (PDS) can be obtained either from this website or on request from our offices and should be considered before entering into a transaction with us. Raw Spread accounts offer spreads from 0.0 pips with a commission charge of USD $3.50 per 100k traded. Standard account offer spreads from 1 pips with no additional commission charges. Spreads on CFD indices start at 0.4 points. The information on this site is not directed at residents in any country or jurisdiction where such distribution or use would be contrary to local law or regulation.

While the headline figure needs consideration, investors must view the components. An improved Business Expectations Index would raise hopes of an improving macroeconomic environment.

On Tuesday, the German private sector PMI survey revealed firms were less pessimistic about their outlook, supporting the Ifo forecasts.

A pickup in business expectations may support investment, including hiring, which would improve the demand outlook. Eurozone private consumption accounts for over 50% of the Eurozone economy.

Beyond the numbers, ECB President Christine Lagarde is on the ECB calendar to speak on Wednesday. References to the economy, inflation, and monetary policy will influence the EUR/USD.

US Housing Sector Is a Litmus Test of the US Economy

On Wednesday, US new home sales will be in focus. Elevated mortgage rates continue to impact homebuyer demand. The US construction sector contributes less than 5% to the economy. However, the housing sector affects consumer sentiment. Elevated mortgage rates may lead to a pullback in consumer spending.

US private consumption contributes over 65% to the US economy. A weak demand outlook may ease pressure on the Fed to raise interest rates.

Economists forecast new home sales to tumble by 11.0% in September, following an 8.7% slide in August.

Beyond the numbers, investors must monitor news updates from the Middle East. The threat of a widening regional conflict would fuel demand for the safety of the US dollar.

Short-Term Forecast:

Private sector PMIs set the near-term trend for the EUR/USD. However, the ECB and US inflation figures will likely decide the fate of the EUR/USD ahead of the US nonfarm payrolls and Fed interest rate decision.

EUR/USD Price Action

Daily Chart

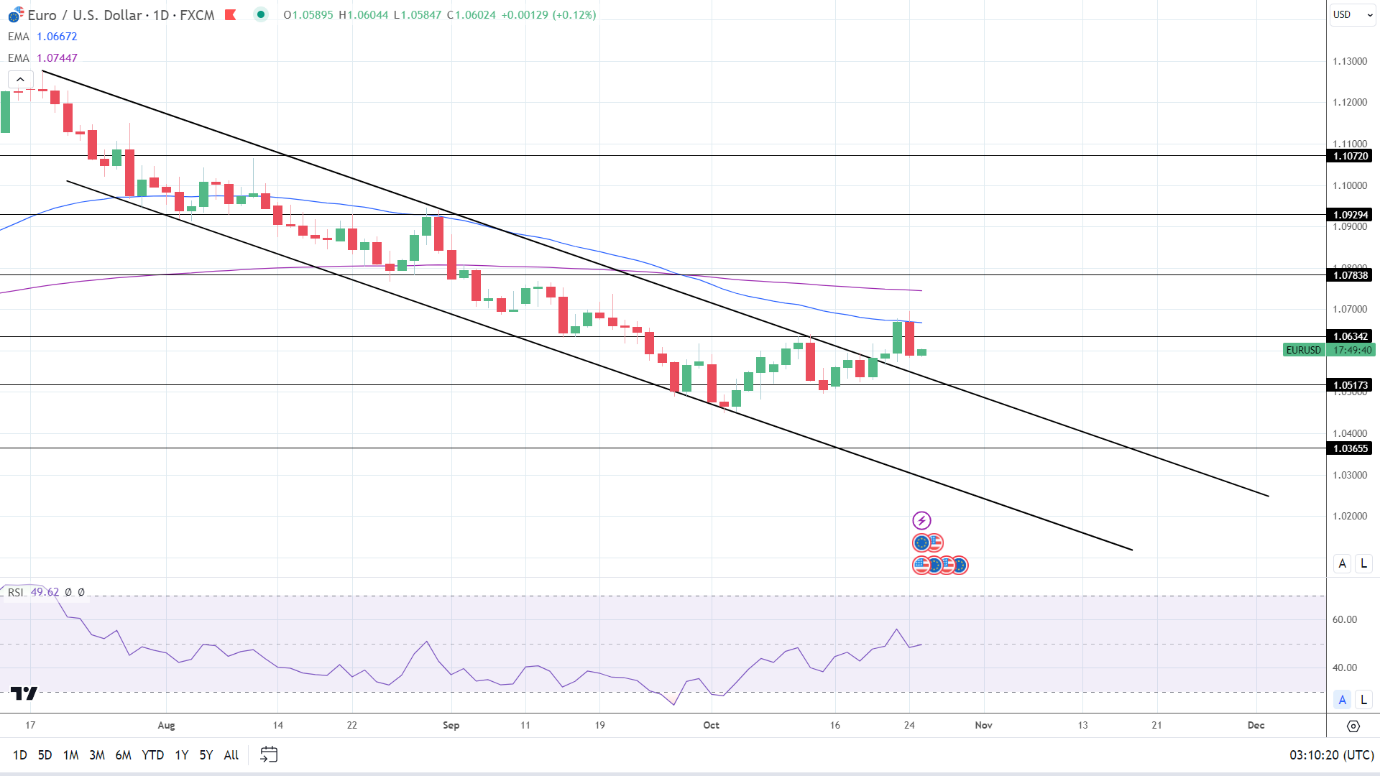
The EUR/USD sat below the 50-day and 200-day EMAs, sending bearish price signals.

A EUR/USD break above the $1.06342 resistance level would support a breakout from the 50-day EMA to target $1.07.

Upbeat German business sentiment and a deteriorating US housing sector will likely fuel buyer appetite for the EUR.

However, an unexpected slump in business expectations and an escalation in the Middle East conflict would test buyer demand.

A EUR/USD drop below the trend line would give the bears a run at the $1.05173 support level.

The 14-period Daily RSI, 49.62, suggests a EUR/USD drop below the trend line before entering oversold territory.

EUR/USD Daily Chart sends bearish price signals.
EURUSD 251023 Daily Chart

4-Hour Chart

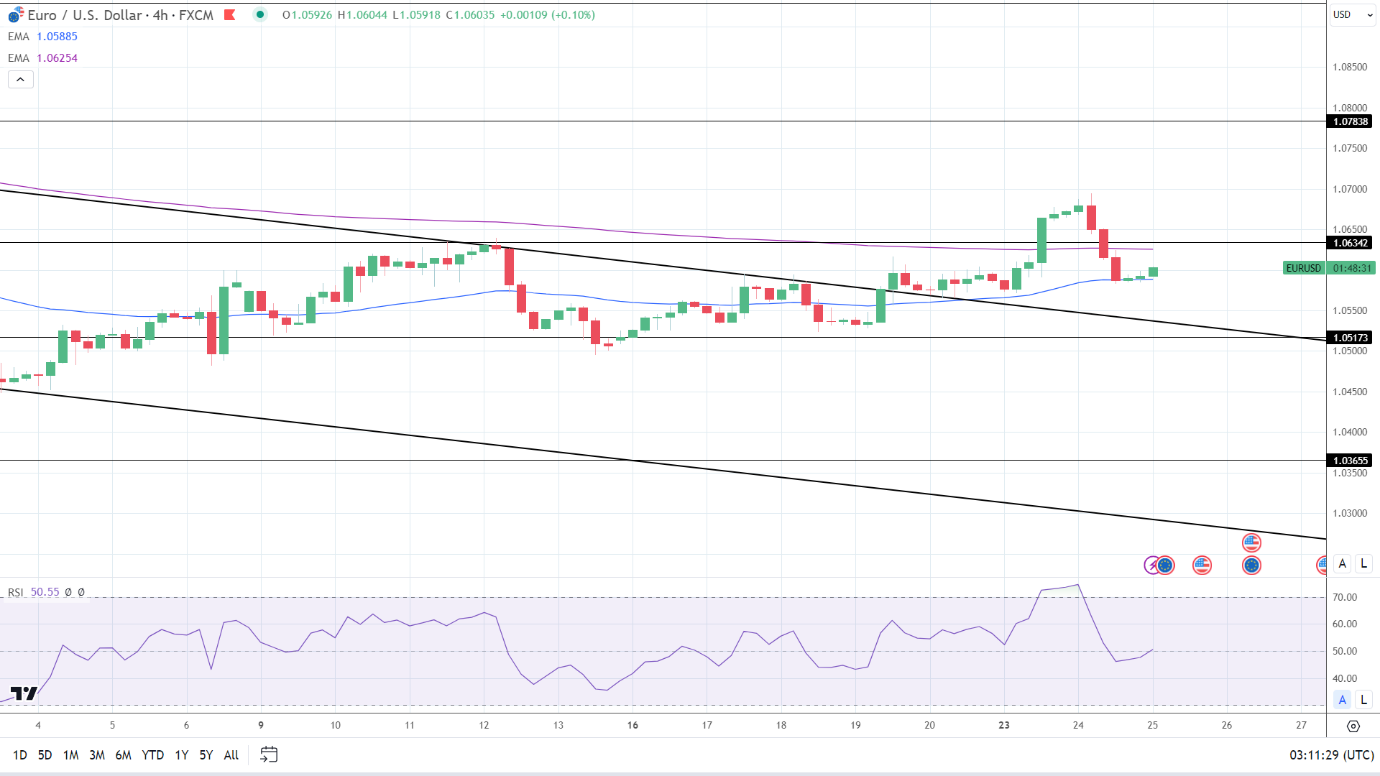
The EUR/USD sits above the 50-day EMA while hovering below the 200-day EMA, sending bullish near-term but bearish longer-term price signals.

A EUR/USD break above the 200-day EMA and $1.06342 resistance level would bring $1.07 into view.

A fall through the 50-day EMA would give the bears a run at the trend line and $1.05173 support level.

The 14-period RSI on the 4-hour chart, 50.55, suggests a EUR/USD break above the 200-day EMA and $1.06342 resistance level before entering overbought territory.

4-Hourly Chart sends bullish near-term price signals.
EURUSD 251023 4 Hourly Chart
Silver Prices Forecast: XAG/USD’s Outlook Turns Bearish Amid Economic Indicators

Silver Prices Forecast: XAG/USD’s Outlook Turns Bearish Amid Economic Indicators

Silver Market Eyes Key Levels Amid Volatile Catalysts

Silver (XAG/USD) prices are struggling to sustain the momentum from their recent surge, hovering below the crucial $24 resistance level. After a staggering 14.5% gain in just twelve days, silver is losing steam, possibly due to traders taking profits. It’s still early to discern whether this is a pause or the beginning of a more significant trend reversal.

Upcoming Economic Indicators Add Uncertainty

Investors are currently treading cautiously as pivotal U.S. economic data points loom large. Markets are keenly awaiting the U.S. third-quarter GDP figures, the PCE inflation index, and the Federal Reserve’s policy decision. A speech from Jerome Powell, Fed Chairman, has also added to the cautious atmosphere. Powell emphasized the central bank’s commitment to tempering inflation, leaving the market to believe that the status quo on interest rates will likely be maintained in the upcoming Federal Open Market Committee meeting.

Trading Derivatives carries a high level of risk to your capital and you should only trade with money you can afford to lose. Trading Derivatives may not be suitable for all investors, so please ensure that you fully understand the risks involved, and seek independent advice if necessary. A Product Disclosure Statement (PDS) can be obtained either from this website or on request from our offices and should be considered before entering into a transaction with us. Raw Spread accounts offer spreads from 0.0 pips with a commission charge of USD $3.50 per 100k traded. Standard account offer spreads from 1 pips with no additional commission charges. Spreads on CFD indices start at 0.4 points. The information on this site is not directed at residents in any country or jurisdiction where such distribution or use would be contrary to local law or regulation.

Geopolitical Concerns Take a Back Seat

Geopolitical tensions, particularly in the Middle East, have so far failed to significantly lift silver as a safe-haven asset. The conflict between Israel and Hamas in the Gaza Strip has drawn global attention, but hopes for a ceasefire have softened the immediate demand for safe-haven assets like silver.

U.S. Treasury Yields and the Dollar in Focus

U.S. Treasury yields remain near 16-year highs even after a slight pullback below 5%. Bill Ackman’s recent move to cover his bond short position hinted at bonds possibly becoming more attractive. Meanwhile, the U.S. dollar has shown strength against a basket of currencies, further pressuring silver prices.

Short-Term Outlook: Bearish

Given the impending economic indicators and the fading safe-haven appeal, the short-term outlook for silver leans bearish. The market is treading water beneath the key resistance levels, and a strong dollar coupled with lofty U.S. Treasury yields could continue to weigh on prices in the near term.

Technical Analysis

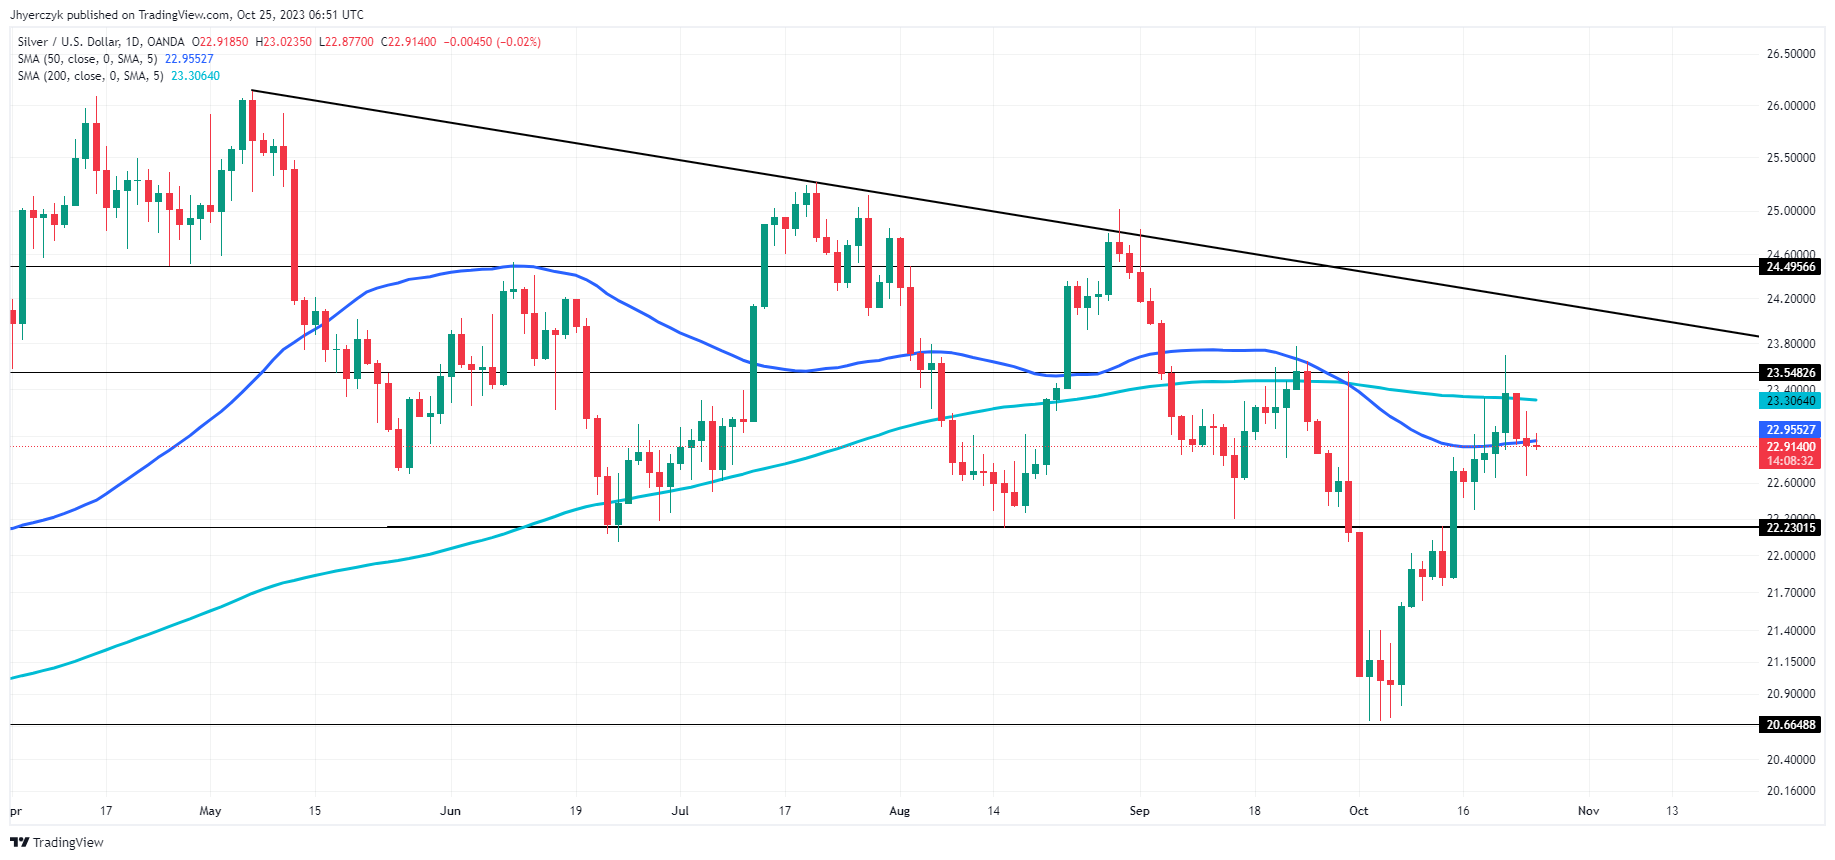
Daily Silver (XAG/USD)The current daily price of Silver (XAG/USD) at 22.91 is slightly below both the 50-day moving average of 22.95 and the 200-day moving average of 23.31. This positions the asset in a bearish stance for both short-term and long-term perspectives.

Silver is hovering close to its minor support level at 22.23, well above the main support at 20.66. Meanwhile, minor and main resistance levels are observed at 23.55 and 24.50, respectively.

Given these technical indicators, the market sentiment for silver is currently bearish, bolstered by its performance relative to both the 50-day and 200-day moving averages.

Gold Prices Forecast: Fed Policy and US Economic Health Take Center Stage

Gold Prices Forecast: Fed Policy and US Economic Health Take Center Stage

Gold Faces Crucial Hurdles Amid Economic Indicators

Gold (XAU/USD) is wading in murky waters as the conflict in the Middle East and key economic indicators leave traders in a standoff. Despite softer U.S. Treasury yields lending some support, the safe-haven allure of the yellow metal seems to be waning. While gold came close to touching the key resistance level at $2,000, profit-taking appears to have put a dent in its recent rally.

Economic Drivers Take Center Stage

Market participants are keenly awaiting the U.S. GDP figures for Q3 and the PCE price index due at the end of the week. With the conflict between Israel and Hamas showing signs of a possible ceasefire, the spotlight is back on economic fundamentals. The U.S. Treasury yields have calmed down but are still near 16-year highs, after Bill Ackman’s decision to cover his bond short position, which brings U.S. economic indicators back to the fore.

Trading Derivatives carries a high level of risk to your capital and you should only trade with money you can afford to lose. Trading Derivatives may not be suitable for all investors, so please ensure that you fully understand the risks involved, and seek independent advice if necessary. A Product Disclosure Statement (PDS) can be obtained either from this website or on request from our offices and should be considered before entering into a transaction with us. Raw Spread accounts offer spreads from 0.0 pips with a commission charge of USD $3.50 per 100k traded. Standard account offer spreads from 1 pips with no additional commission charges. Spreads on CFD indices start at 0.4 points. The information on this site is not directed at residents in any country or jurisdiction where such distribution or use would be contrary to local law or regulation.

Fed’s Stance Looms Large

As the Federal Reserve prepares for its next policy meeting, its commitment to tackling inflation remains unshaken. The markets are mostly expecting the interest rates to stay constant. Jerome Powell’s previous statements indicate that the bank may require a slowdown in economic growth to achieve its inflation target sustainably.

The Resilient Dollar

The U.S. dollar continues to show strength when measured against a basket of currencies, largely owing to the robustness of the U.S. economy, especially when compared to the UK and the European Union. Recent data indicated positive PMI readings in the U.S., contrasting with contractions in both the UK and the Euro Zone. Continued strength could put a lid on demand for dollar-denominated gold.

Short-term Forecast

Given the shift from geopolitical factors to economic drivers, and with U.S. economic indicators coming into focus, gold is likely to struggle in reaching the psychological $2,000 barrier in the short term. Overall, the market sentiment leans bearish, at least for now.

Technical Analysis

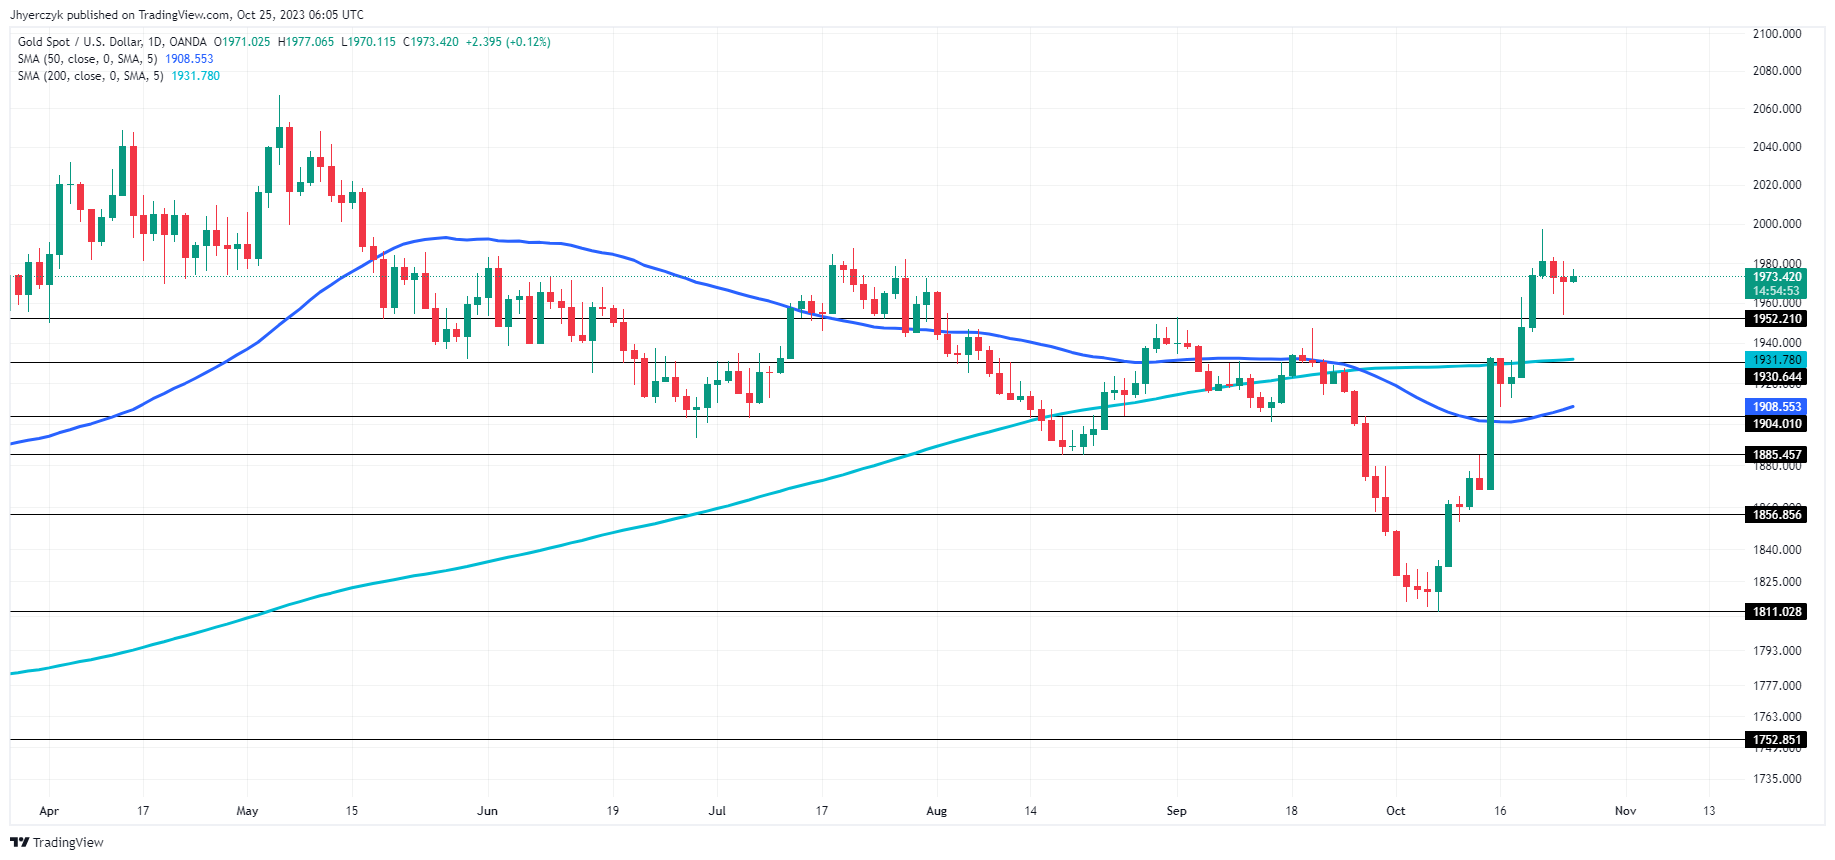
Daily Gold (XAU/USD)Based on the provided data for gold (XAU/USD), the current daily price of $1973.54 is trading above both the 200-day moving average of $1931.78 and the 50-day moving average of $1908.56. This suggests a bullish trend in the short and medium term.

The asset is also trading above the main support level of $1930.64 and minor support at $1952.21, strengthening the bullish outlook.

Market sentiment is bullish given the daily price’s position relative to key moving averages and support levels. However, the gold may still be vulnerable to a near-term pullback into the 200-day moving average, which may attract new buyers.

AUD to USD Forecast: Aussie Climbs as Inflation Spurs RBA Rate Hike Bets

AUD to USD Forecast: Aussie Climbs as Inflation Spurs RBA Rate Hike Bets

Tuesday Overview

On Tuesday, the AUD/USD rose by 0.31%. Following a 0.40% gain on Monday, the Aussie dollar ended the day at $0.63545. The Aussie dollar fell to a low of $0.63296 before rising to a high of $0.63790.

Australian Inflationary Pressures Return to Test the RBA

On Wednesday, Australian inflation figures for Q3 garnered investor interest. The Monthly CPI Indicator rose from 5.2% to 5.6% in September, reflecting a pickup in inflationary pressure at the end of Q3. Economists forecast an inflation rate of 5.4%.

Trading Derivatives carries a high level of risk to your capital and you should only trade with money you can afford to lose. Trading Derivatives may not be suitable for all investors, so please ensure that you fully understand the risks involved, and seek independent advice if necessary. A Product Disclosure Statement (PDS) can be obtained either from this website or on request from our offices and should be considered before entering into a transaction with us. Raw Spread accounts offer spreads from 0.0 pips with a commission charge of USD $3.50 per 100k traded. Standard account offer spreads from 1 pips with no additional commission charges. Spreads on CFD indices start at 0.4 points. The information on this site is not directed at residents in any country or jurisdiction where such distribution or use would be contrary to local law or regulation.


Prices for housing (+7.2%), transport (+9.4%), and food and non-alcoholic beverages (+4.7%) had the most significant contributions to the monthly indicator.

According to the ABS,

  • Consumer prices increased by 1.2% in Q3 quarter-on-quarter, up from 0.8% in Q2.
  • Automotive fuel (+7.2%), rents (+2.2%), new dwelling purchases (+1.3%), and electricity (+4.2%) were the most marked contributors.
  • The annual inflation rate softened from 6.0% to 5.4% in Q3 quarter-on-quarter. Inflation softened for the third consecutive quarter.
  • Significantly, annual services inflation softened for the first time since December 2021 but remained elevated.

The Aussie dollar responded to the numbers, with investors raising bets on an RBA rate hike. On Tuesday, RBA Assistant Governor Michelle Bullock reportedly said,

“The Board will not hesitate to raise the cash rate further if there is a material upward revision to the outlook for inflation.”

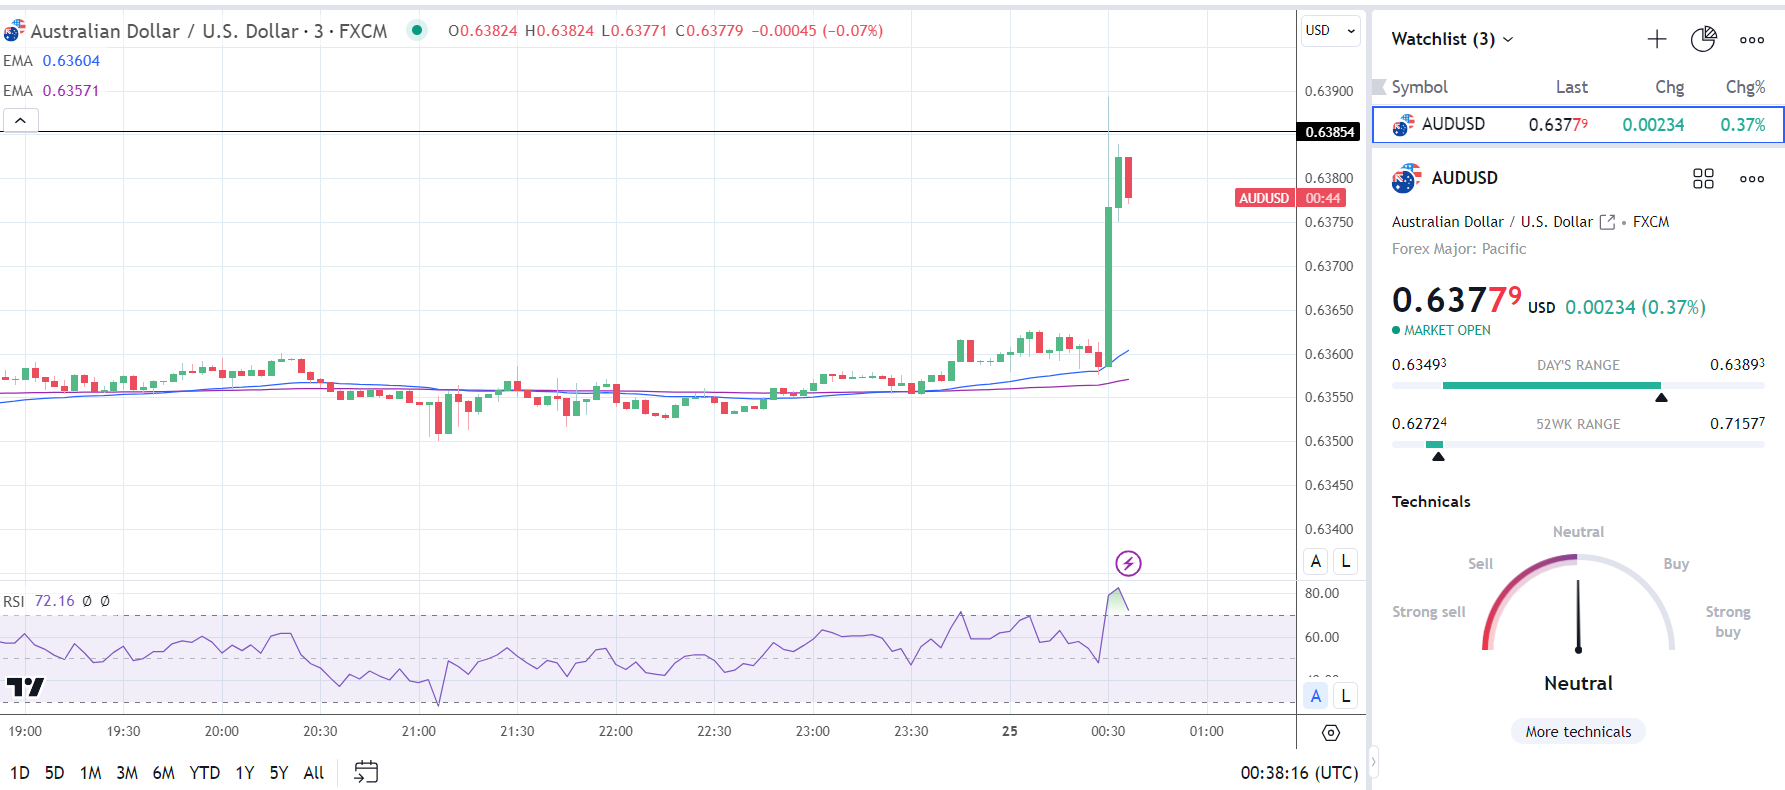
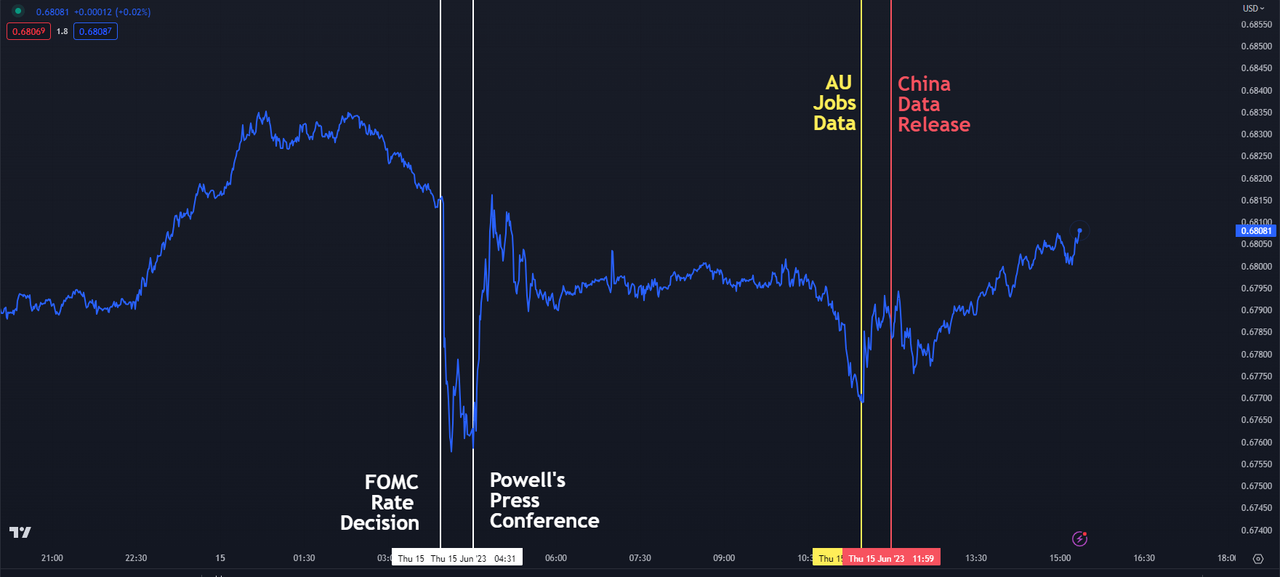
The AUD/USD rallied from $0.63586 to $0.63893.

AUD/USD reacts to Q3 Inflation Report.

AUDUSD 251023 3-Minute Chart

US Housing Sector in Focus

The US housing sector will be in the spotlight on Wednesday. New home sales figures for September will warrant consideration. The US housing sector contributes less than 10% to the US economy. However, a higher mortgage rate environment impacts consumer confidence and spending.

A negative outlook on consumption would impact the US economy and ease demand-driven inflationary pressures. US private consumption contributes over 65% to the US economy.

Economists forecast new home sales to decline by 11.0% in September (Aug: -8.7%).

Short-Term Forecast

Near-term trends for the AUD/USD over the next week may hinge on the US GDP and inflation figures. After the Australian CPI Report, softer US inflation figures on Friday could tip monetary policy divergence toward the Aussie dollar.

AUD/USD Price Action

Daily Chart

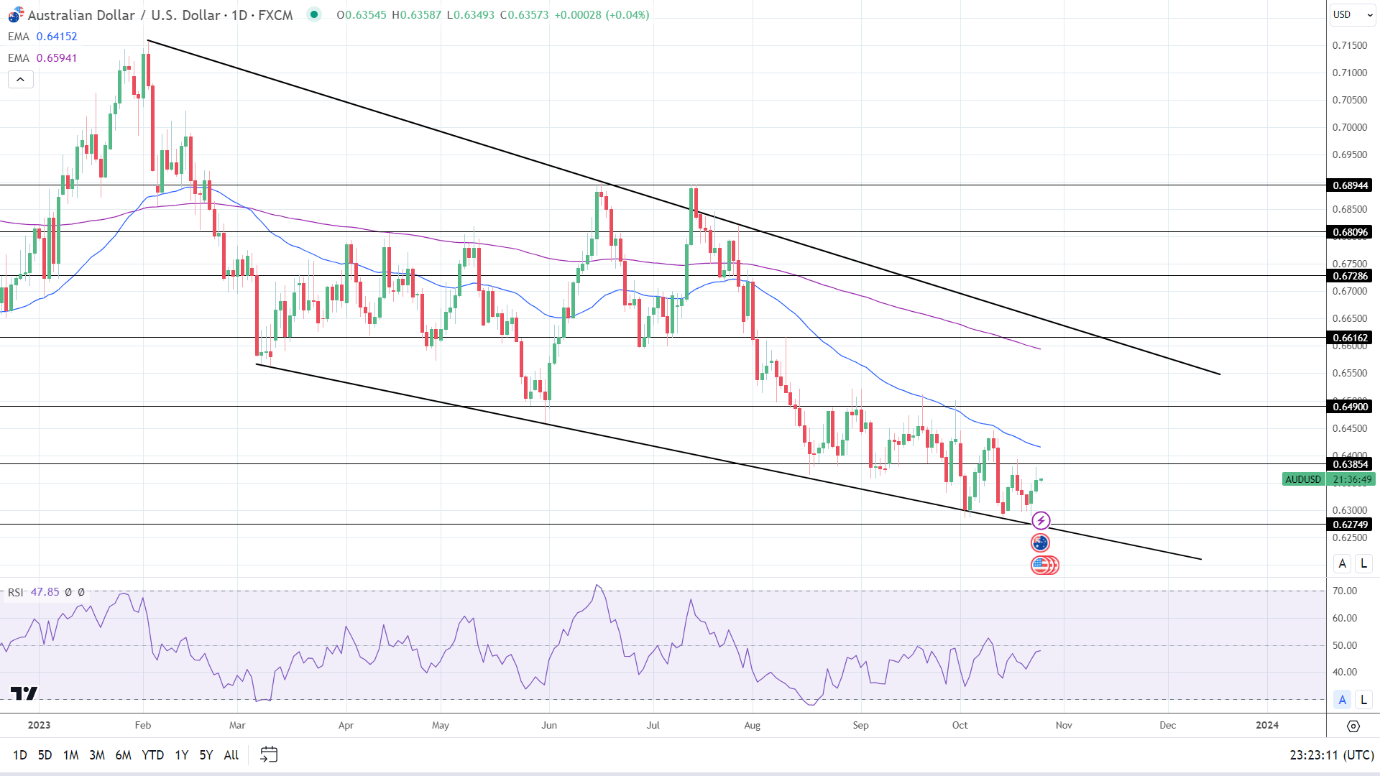
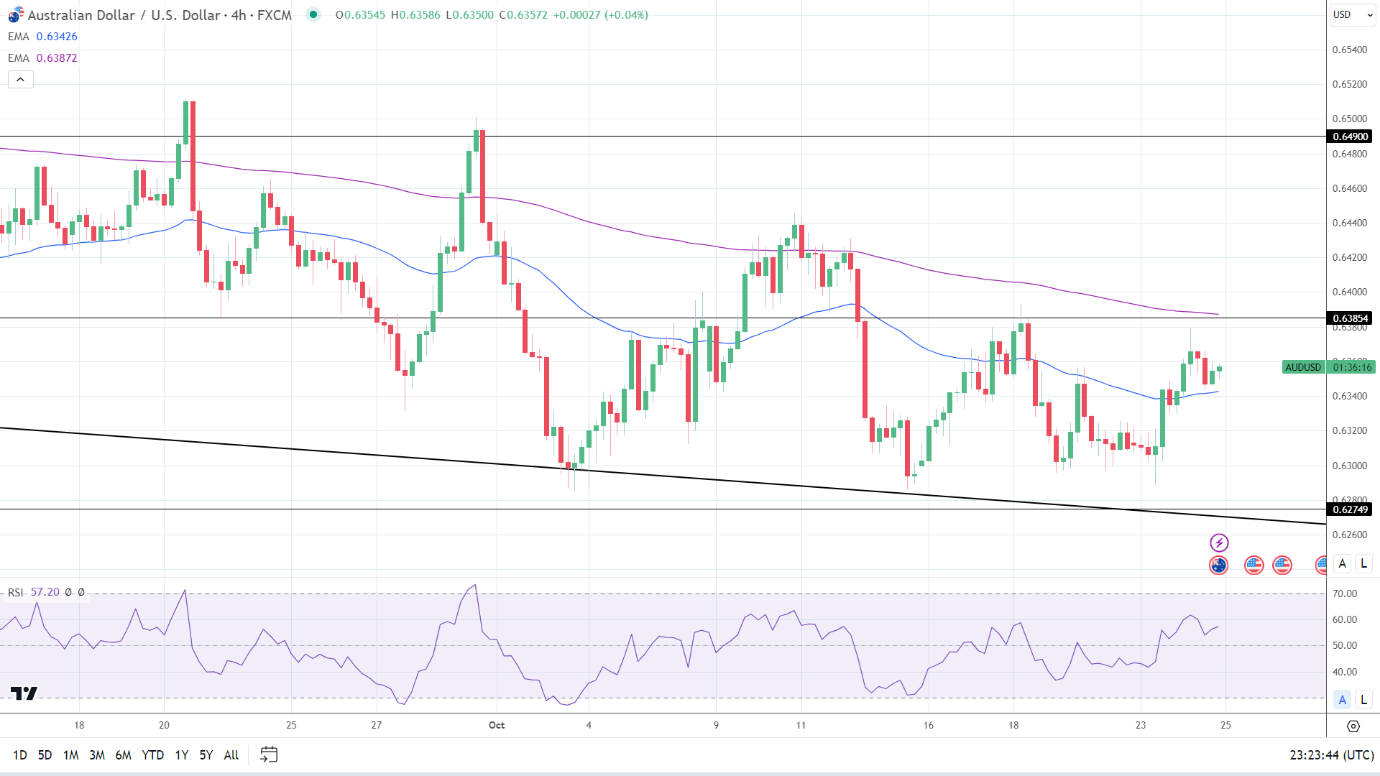
The AUD/USD sat below the 50-day and 200-day EMAs, affirming bearish price signals.

A break and hold above the $0.63854 resistance level would support a move to the 50-day EMA. Market sentiment toward RBA monetary policy and market risk appetite will likely guide the Aussie dollar.

However, a fall through the Tuesday session low of $0.63296 would support a move to the trend line and 0.62749 support level. Buying pressure will likely intensify at $0.62750. The trend line is confluent with the support level.

A 14-period Daily RSI reading of 47.85 indicates an AUD/USD move to the $0.62749 support level and the trend line before entering oversold territory (typically below 30 on the RSI scale).

Daily Chart sends bearish price signals.

AUDUSD 251023 Daily Chart

4-Hourly Chart

The AUD/USD hovers above the 50-day EMA while remaining below the 200-day EMA, sending bullish near-term but bearish longer-term price signals.

A move through the $0.63854 resistance level and 200-day EMA would support a return to $0.64. However, selling pressure may intensify at $0.63850. The 200-day EMA is confluent with the resistance level.

An AUD/USD fall through the 50-day EMA would bring the $0.62749 support level and trend line into view.

The 14-period 4-Hourly RSI at 57.20 suggests an AUD/USD move to the $0.63854 resistance level before entering overbought territory.

4-Hourly Chart sends bullish near-term price signals.
AUDUSD 251023 4-Hourly Chart
Bitcoin (BTC/USD) Pops Above $35k Before a Pullback, More Upside Ahead?

Bitcoin (BTC/USD) Pops Above $35k Before a Pullback, More Upside Ahead?

BITCOIN SPOT ETF DEVELOPMENTS

Bitcoin prices surged overnight following my update yesterday on news that the iShares Bitcoin Trust had been listed on the DTCC (Depositary Trust & Clearing Corporation, which clears Nasdaq trades). This is part of the process to bring the ETF to market prompting speculators to ramp up their bullish bias.

The impact saw BTCUSD pop above the $35k briefly today before a pullback. It then emerged that the iShares Bitcoin Trust had been removed from the DTCC. This development saw a $1000 drop in Bitcoin prices with BTCUSD dropping to around the $33500 mark before steadying somewhat.

image1.png

The world’s largest cryptocurrency has hovered between the $33500 and $34000 handle ever since. I actually think a pullback here may be a good thing as it would provide for a larger move to the upside if the spot Bitcoin ETF is finally approved.

MICROSTRATEGY IN THE GREEN ONCE MORE ON $4.7B BITCOIN BET

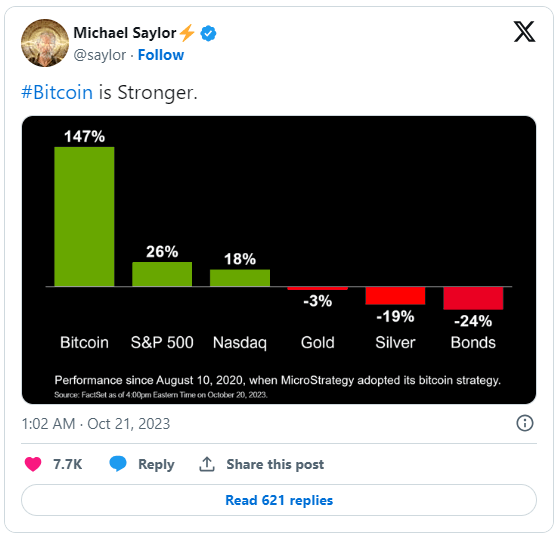
Crypto markets are on the up at the moment and this has benefitted companies in the industry as well. News came through yesterday that the MicroStrategy Bitcoin investment is profitable once more putting Michael Saylor back in the news. The Company’s stash was deeply in the red in late 2022 but 2023 has brought renewed hope as the spot Bitcoin ETF approval gains traction. Mr Saylor who is now executive Chairman of MicroStrategy tweeted an interesting graphic on October 21 as well which indicated the performance since August 10, 2020, when MicroStrategy adopted its Bitcoin strategy. Since the tweet Bitcoin has risen around 12.25% and was up around 15% when it peaked above the $35000 mark today.

image2.png

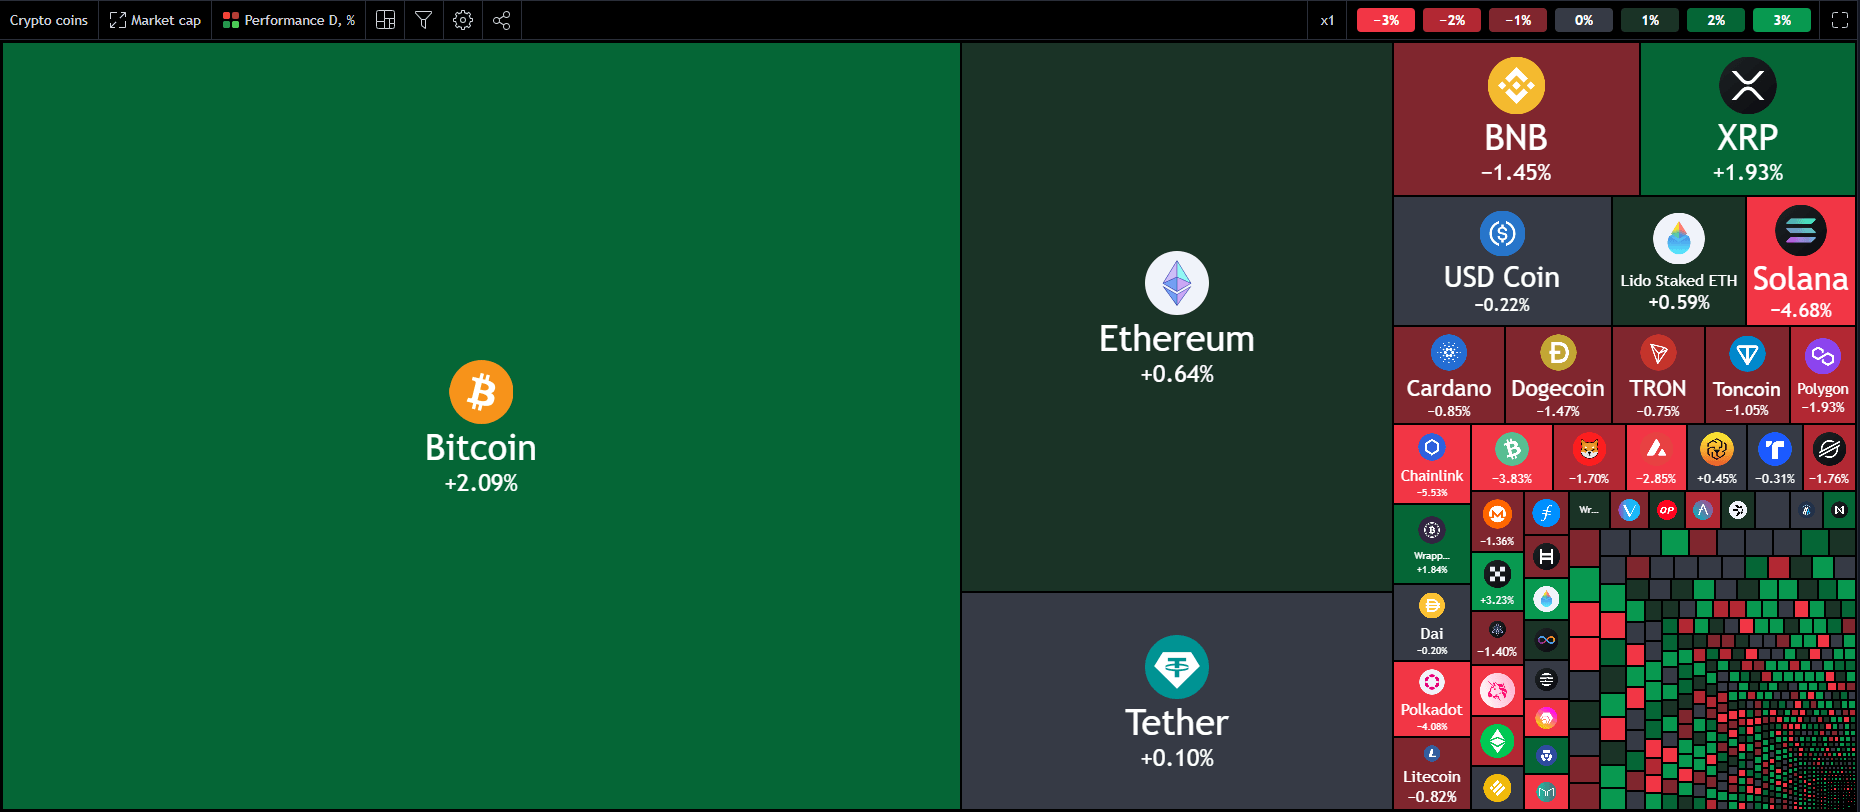
A look at the Crypto heatmap and we can see the dominance of Bitcoin on this recent bull run. We have not seen similar gains for other major names such as Ripple and Ethereum. It will be interesting to gauge the potential knock-on effect should the Bitcoin ETF finally receive approval.

TECHNICAL OUTLOOK AND FINAL THOUGHTS

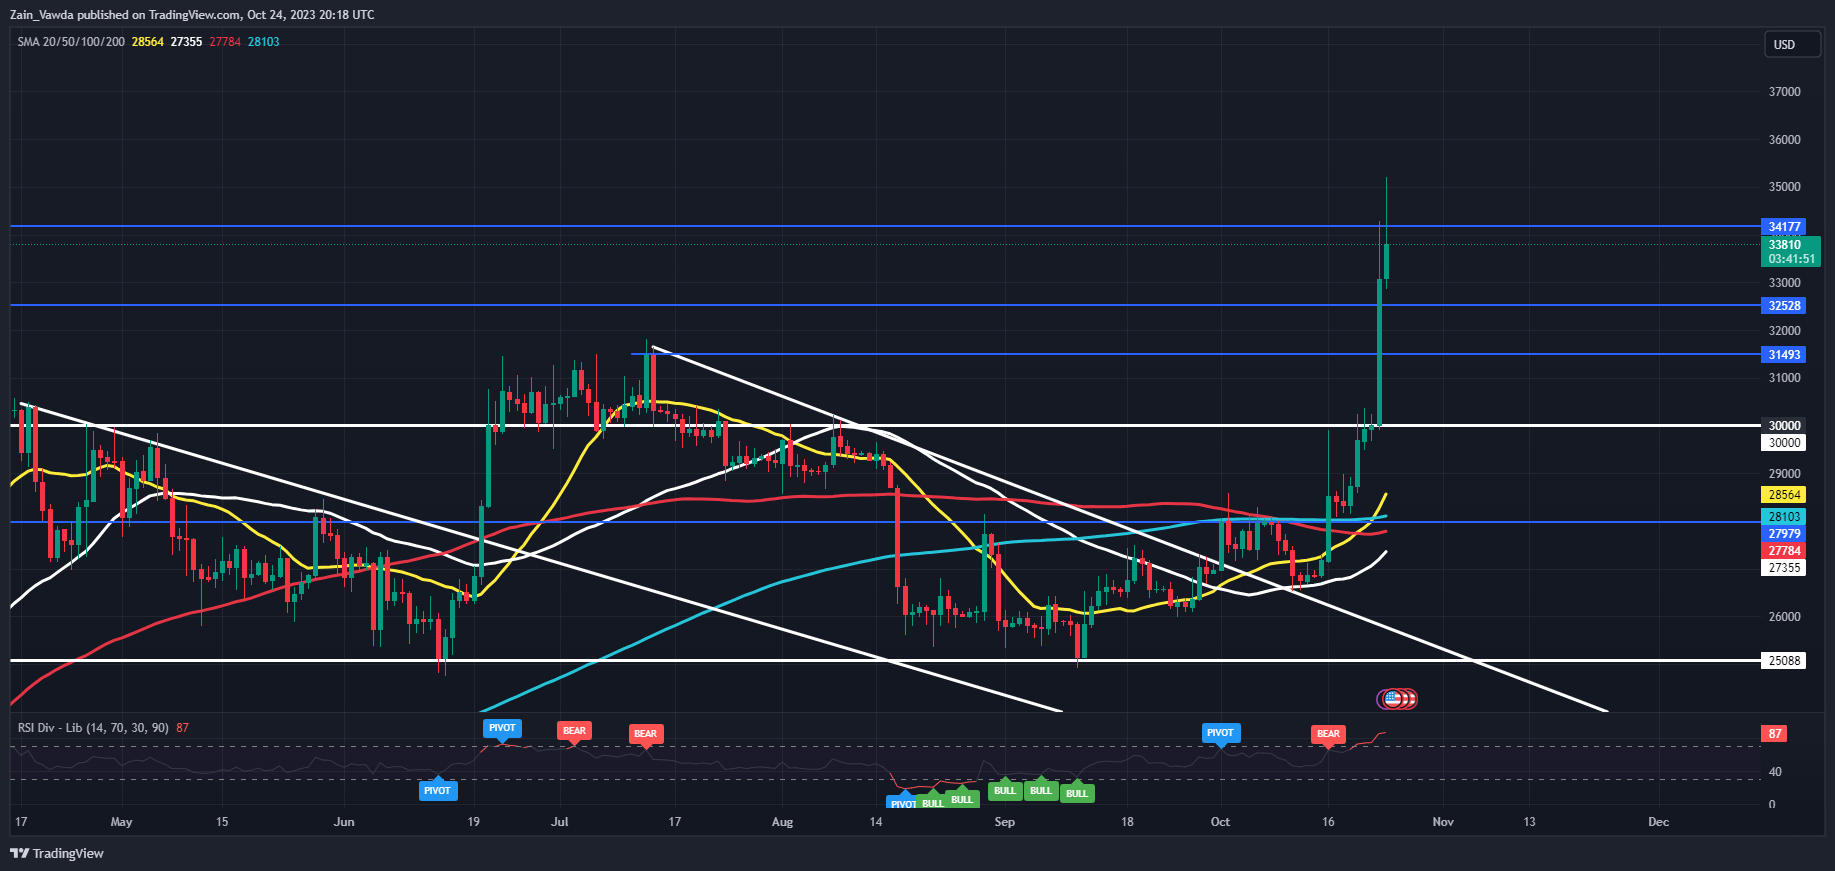
From a technical standpoint BTCUSD has put in an impressive rally over the last 2 weeks. The fact that the rally has been so expansive leads me to believe that a pullback may be forthcoming soon which might actually be a positive for Bitcoin. This could allow bulls better pricing ahead for potential longs of the Spot ETF decision.

The 14-day RSI is currently in overbought territory also hinting at the potential for a pullback with resistance at the $34177 mark. A daily candle lose above faces the hurdle of the psychological $35000 mark which could prove a tough nut to crack if we do not have a retracement first.

Key Levels to Keep an Eye On:

Support levels:

  • 33000
  • 32528
  • 31500

Resistance levels:

  • 34177
  • 35000
  • 37500

BTCUSD Daily Chart, October 24, 2023.

EUR/USD Forecast: Euro Sinks After Fakeout ahead of ECB Decision. What Now?

EUR/USD Forecast: Euro Sinks After Fakeout ahead of ECB Decision. What Now?

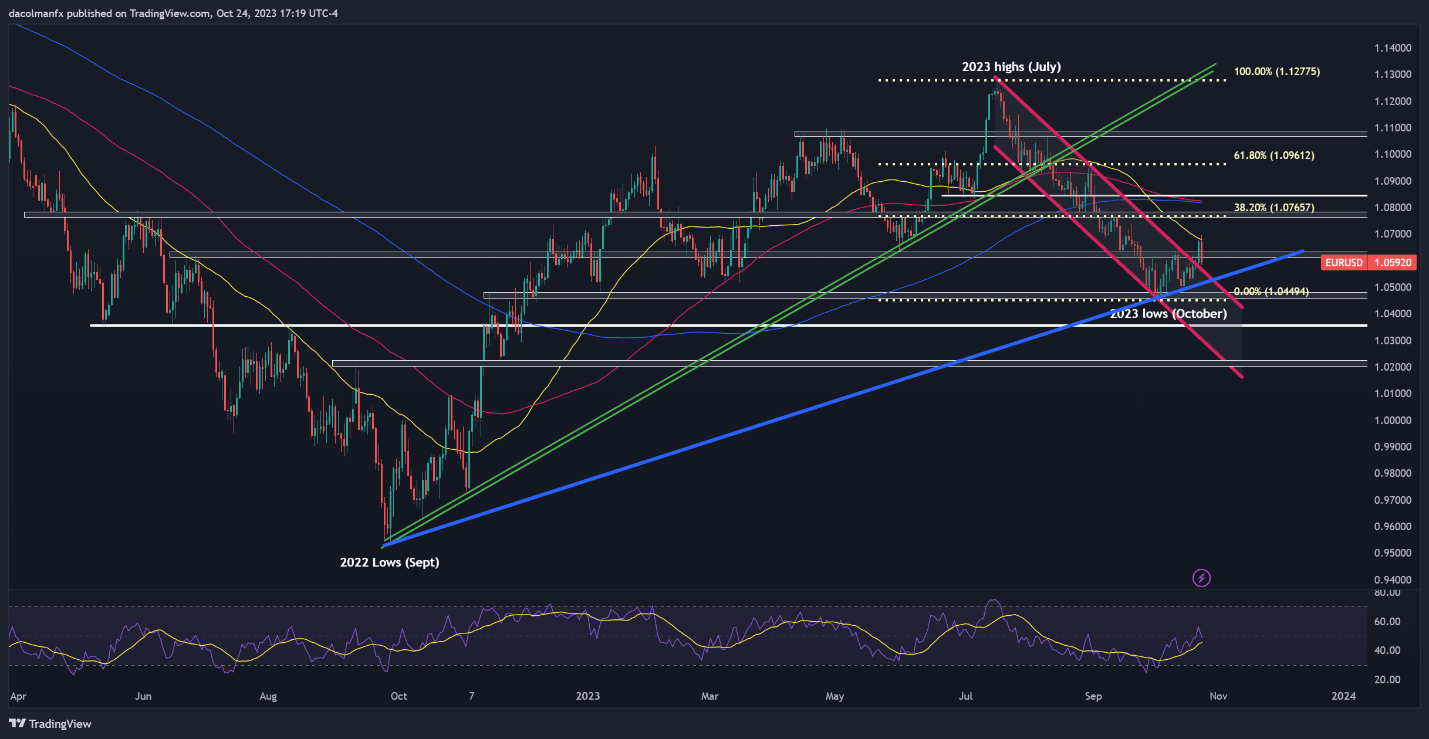
EUR/USD dropped sharply on Tuesday (-0.72% to 1.0590), relinquishing the gains it had garnered at the beginning of the week, and failing to maintain its bullish breakout, a sign that sellers have reasserted themselves after a short period of indecision.

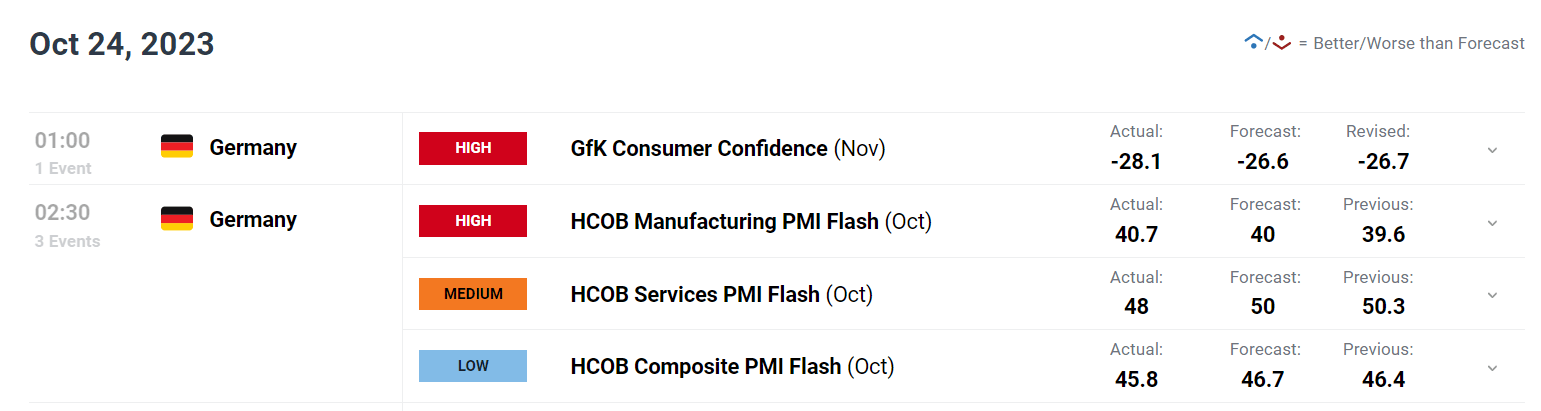
In terms of price action catalysts, the common currency’s pullback was driven by disappointing eurozone data. By way of context, October German business activity, as reflected by the S&P Global composite PMI, fell further into contraction territory, raising concerns that a recession is underway in Europe’s largest economy.

GERMAN DATA

image1.png

Curious to know the likely trajectory for EUR/USD and the market catalysts that should be on your radar? Find all the information you need in our Q4 euro trading forecast. Download it now!

Economic fragility could challenge market expectations that interest rates will remain at elevated levels for an extended period despite the European Central Bank’s rhetoric, creating the right conditions for regional bond yields to come under pressure.

We’ll gain more insights into policymakers’ thinking later this week when the European Central Bank announces its monetary policy decision. That said, the institution led by Christine Lagarde is seen hitting the pause button after having delivered 450 basis points of tightening over the past ten meetings.

Traders have already factored in this anticipated pause, so it is important to closely monitor guidance, placing a particular focus on President Lagarde’s communication. If the central bank chief signals that this isn’t just a short hiatus to gather more data to better assess the outlook but rather the conclusion of the hiking cycle, the euro could suffer large losses against the U.S. dollar.

On the other hand, should the guidance indicate the possibility of another rate increase in the future, perhaps in December, EUR/USD could find itself in a favorable position for a cautious rebound. However, any potential gains would likely be limited due to the prevailing interest rate differentials between the U.S. and Europe.

Want to find out how retail positioning can shape the short-term trajectory of EUR/USD? Our sentiment guide has all the relevant information you may be looking for. Grab a free copy now!

EUR/USD TECHNICAL ANALYSIS

EUR/USD breached channel resistance early in the week, but the lack of follow-through on the upside and the subsequent reversal on Tuesday strongly implies that the initial breakout was, in fact, a fakeout.

We’ll have more clues about market dynamics in the coming days, but if prices extend lower following the bearish fakeout, the first floor to keep an eye on rests at 1.0575. Below that threshold, the focus is on trendline support at 1.0515, followed by this year’s lows just a touch below the 1.0500 handle.

Conversely, if buyers stage a comeback and drive the exchange rate higher, initial resistance appears at 1.0625, and 1.0675 thereafter, which corresponds to the 50-day simple moving average. On further strength, attention transitions to 1.0765, the 38.2% Fibonacci retracement of the July/October slump.

If trading losses have dampened your spirits, consider taking a proactive approach to enhance your skills. Download our guide, “Traits of Successful Traders,” to access invaluable insights that may help you sidestep typical trading pitfalls.

EUR/USD TECHNICAL CHART

A screen shot of a graph  Description automatically generated


Australian Dollar Jumps on Shocker CPI Data. Will AUD/USD Go Higher on an RBA Hike?

Australian Dollar Jumps on Shocker CPI Data. Will AUD/USD Go Higher on an RBA Hike?

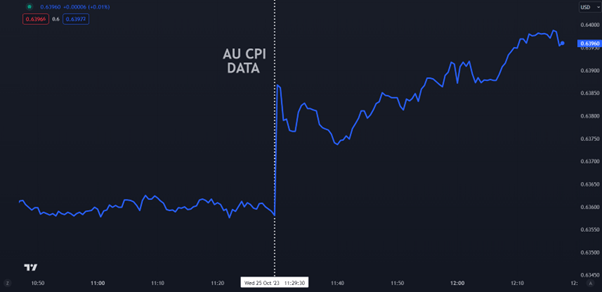
The Australian Dollar made gains in the aftermath of headline CPI of 5.4% beating forecasts of 5.3% year-on-year to the end of September and against 6.0% previously.

Perhaps crucially, the September quarter-on-quarter headline CPI was 1.2% rather than the 1.1% anticipated and 0.8% prior. This represents a re-acceleration of price pressures.

The RBA’s preferred measure of trimmed-mean CPI was 5.2% year-on-year to the end of September instead of estimates of 5.0% and 5.9% previously.

The trimmed mean quarter-on-quarter CPI read of 1.2% was above the 1.0% forecast and prior.

Today’s CPI is undeniably undesirable, especially for the RBA’s preferred trimmed mean measure.

Some commentators are at ease about today’s CPI, citing that the annual number has decreased. This decrease in the yearly figure is the base effect rather than an indication of the current state of play. Q/Q headline CPI for 3Q 2022 was 1.8% against today’s 3Q 2023 read of 1.2%, which allows for a drop in the annual number.

The problem for policymakers is that inflation has been reignited over the third quarter.

The lead-up to today’s CPI figure saw an intriguing run of commentary from the RBA. Let’s go to the Hansard –

Wednesday 11th – RBA Assistant Governor Chris Kent said, “Some further tightening may be required to ensure that inflation, that is still too high, returns to target.”

Tuesday 17th October – RBA October meeting minutes published and stated, “The Board has a low tolerance for a slower return of inflation to target than currently expected. Whether or not a further increase in interest rates is required would, therefore, depend on the incoming data and how these alter the economic outlook and the evolving assessment of risks.”

Wednesday 18th October – RBA Governor Michele Bullock said, “The problem is we’ve had shock after shock after shock. The more that keeps inflation elevated, even if it’s from supply shocks, the more people adjust their thinking.”

Tuesday 24th October – RBA Governor Michele Bullock said in regards to getting inflation down, “It is possible that this can be done with the cash rate at its current level but there are risks that could see inflation return to target more slowly than currently forecast. The Board will not hesitate to raise the cash rate further if there is a material upward revision to the outlook for inflation.”.

She also restated, “The Board has been clear that it has a low tolerance for allowing inflation to return to target more slowly than currently expected.”

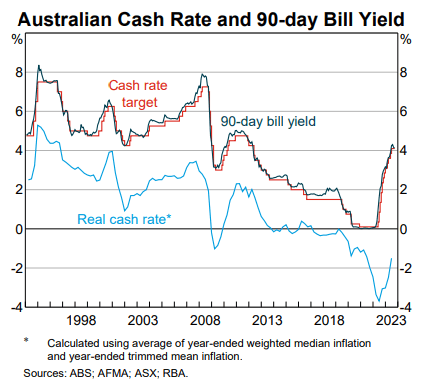
Looking at the chart below, published by the RBA earlier this month, two aspects stand out.

First is the depth of the negative real cash rate and second, the large gap between the real cash rate and the return on the 90-day Bank Bill.

The real cash rate is the RBA’s cash rate target less the headline inflation rate (CPI).

Negative real interest rates undermine the wealth of the nation with today’s money being more valuable than cash in the future. Savers in particular are most punished by these circumstances.

Of course, we know the answer is simple. The 2-ways to correct the situation are by lifting interest rates or by getting inflation down.

The chart reflects the recent achingly high inflation reads relative to the last 30-years, since inflation targeting was mandated by the Australian Government to the RBA.

image1.png

That mandate went through a review process under the current Government and some tinkering was undertaken.

Of significance is that the inflation target has been maintained. Today’s reacceleration of price pressures depresses the real cash rate further. The longer inflation stays high and interest rates are unchanged, the more damage is done to the economy in the long run.

Going into today’s data, the interest rate futures markets ascribed close to a 0% probability of a 25 basis-point hike by the RBA at their monetary policy meeting on November 7th.

The dial moved toward a 60% possibility of a hike post-CPI.

The pandemic is mostly consigned to the history books, but inflation is still with us and growing.

Former RBA Governors have previously said, in the overall sense, that 25 basis points is here nor there for monetary policy. If the RBA does not hike at either the November or December meetings, then the next opportunity will not be until February.

An early insurance policy for the new Governor might be in the offing.

AUD/USD SHORT TERM REACTION TO CPI BEAT