UK Economy on the Brink: PMI Data Signals Persistent Contraction

UK Economy on the Brink: PMI Data Signals Persistent Contraction

UK Economy Faces Persistent Contraction, Lowest Optimism Since Last Year

The latest data from the S&P Global/CIPS Flash UK PMI Composite Output Index reveals ongoing contraction in the UK private sector for the third consecutive month. October’s numbers show a slight uptick at 48.6 from September’s 48.5, but this still remains below the critical 50.0 threshold, marking a contraction rather than expansion. This decline is recorded across both manufacturing and service sectors, with manufacturing taking the harder hit.

Manufacturing and Services Sector in Downturn

October witnessed the manufacturing sector recording a three-month high at 45.3, yet it was the sector’s eighth consecutive month of decline, the longest since the 2008/09 recession. Firms noted customer destocking and a dearth of new orders as factors affecting production. On the other hand, the services sector, with a marginal drop in business activity, recorded a nine-month low at 49.2. The primary reasons cited include subdued consumer confidence, increased borrowing costs, and weak real estate demand. Notably, technology services were the rare bright spot where activity growth was reported.

New Orders and Employment Numbers Fall

New order volumes across the private sector continued to contract, with October marking the fourth consecutive month of decline. Corporate caution and stretched household budgets were attributed to this decrease. The employment scenario also looked grim, with staffing numbers in decline for the second month in a row. Non-replacement of voluntary leavers and redundancies were reported in both sectors.

Dim Outlook and Low Business Optimism

Business optimism weakened for the first time since July, reaching the lowest level in 2023. Both manufacturing and service sectors expressed equal concerns about the UK’s economic outlook and higher borrowing costs. Additionally, the study reveals input price inflation easing for the third consecutive month, largely due to softer cost pressures in services and falling purchasing prices in manufacturing.

Short-term Forecast: Bearish Outlook

With mounting concerns about the UK economy’s direction, higher living costs, and diminishing export markets, a bearish short-term outlook seems inevitable. Though the decline in overall output remains modest, the intensifying gloom casts doubts on any immediate economic rebound. Even if inflationary pressures moderate, weak demand and dwindling business optimism suggest that the UK could be flirting with a mild recession in the coming months.

UK Unemployment Rate Falls to 4.2% in August

UK Unemployment Rate Falls to 4.2% in August

UK Unemployment Falls to 4.2%

The UK unemployment rate declined from 4.3% to 4.2% in August, with employment falling by 82k in July.

According to the Office for National Statistics,

  • The UK employment rate declined by 0.3 percentage points (pp) to 75.7% quarter-on-quarter in the three months to August 2023.
  • Economic inactivity rose by 0.1 pp to 20.9%.
  • In the July to September 2023 period, job vacancies declined by 43,000 to 988,000. Significantly, job vacancies fell for the fifteenth consecutive month.
  • Wage growth including bonuses rose by 8.1% in August.

The latest employment figures are experimental figures. Wage growth figures and the unemployment rate were noteworthy. While softer, wage growth remained elevated. The lower unemployment rate may also raise eyebrows.

GBP/USD Reaction to the UK Labor Market Overview Report

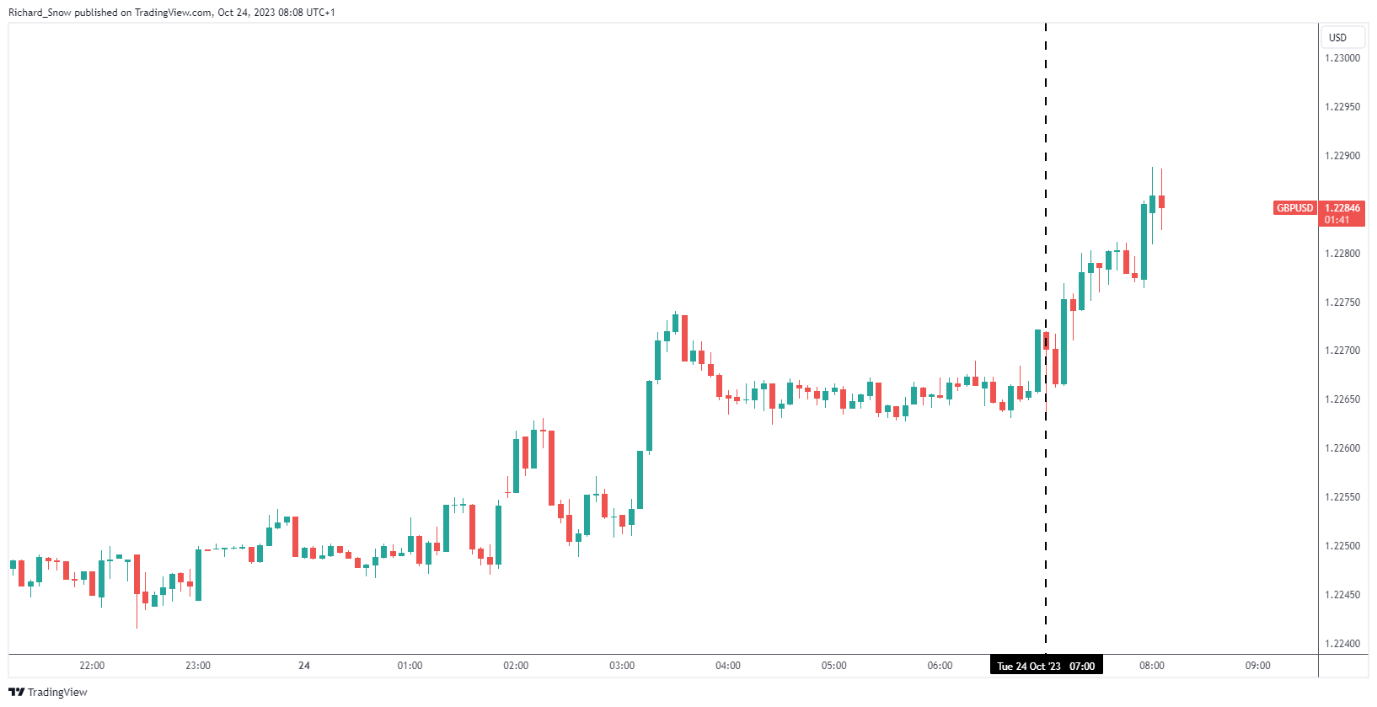
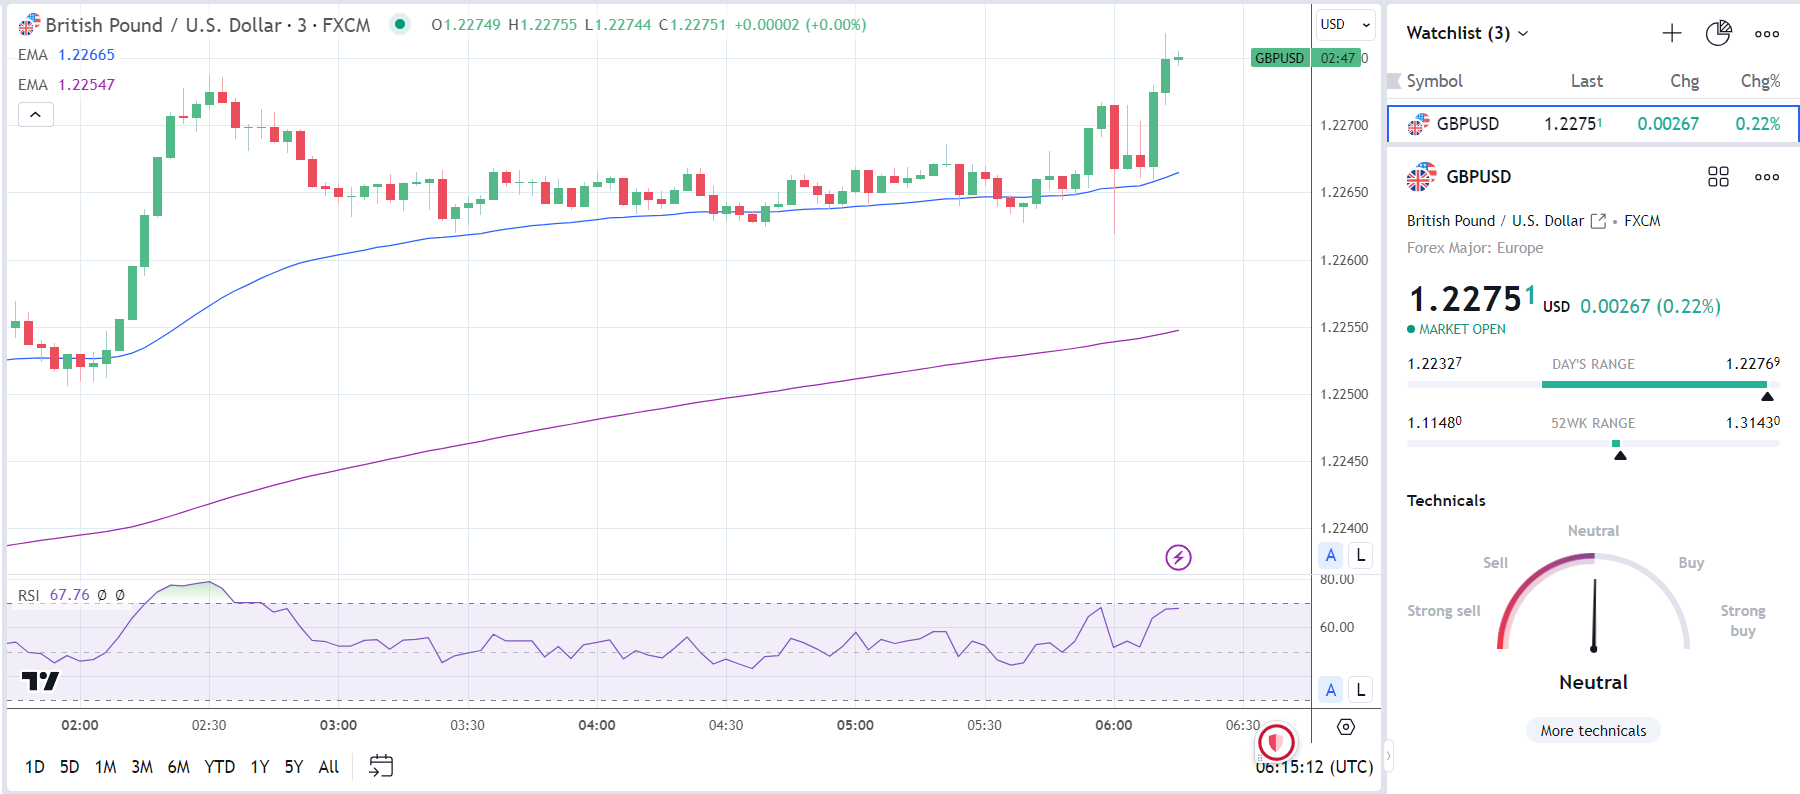
Before the economic indicators, the GBP/USD fell to a low of $1.22327 before rising to a high of $1.22737.

However, in response to the labor market numbers, the GBP/USD fell to a low of $1.22619 before rising to a high of $1.22769.

This morning, the GBP/USD was up 0.22% to $1.22751.

GBP/USD reacts to UK labor market report.
241023 GBPUSD 3 Minute Chart

Up Next: Private Sector PMIs

UK private sector PMIs will also be in focus on Tuesday. The services sector, accounting for over 70% of the UK economy, will likely draw more investor interest.

Economists forecast the S&P Global/CPIS Services PMI to hold steady at 49.3 in October.

Later in the session, US private sector PMIs may impact market risk sentiment. Economists forecast the US S&P Global Services PMI to fall from 50.1 to 49.8,

Beyond the economic calendar, US corporate earnings will influence market risk sentiment. Coca-Cola (KO), General Electric (GE), General Motors (GM), Microsoft (MSFT), Alphabet (GOOGL), and Visa (V) are among the big names releasing earnings.

Euro Jumps on Treasury Yield Slide and a Technical Break. Higher EUR/USD?

Euro Jumps on Treasury Yield Slide and a Technical Break. Higher EUR/USD?

The Euro has managed to rally to start this week after a volatile trading session through the US time zone.

Most notably, Treasury yields climbed higher overnight before retreating lower after famed investors, Bill Ackman and Bill Gross Tweeted some bullish dynamics for US government debt.

Ackman said that his organisation had covered its short bond position due to concerns about the outlook for the US economy.

Not long after, Bill Gross, a fixed-income specialist, made public his preference for buying the Treasury inverted yield curve in the 2s 10s and 2s 5s.

He is expressing a view of buying the short-end bonds and selling the long-end bonds on the basis that the Federal Reserve mantra of ‘higher for longer is yesterday’s news’.

He also sees problems ahead for the US economy and is buying near-term interest rate futures outright that will settle in 2025.

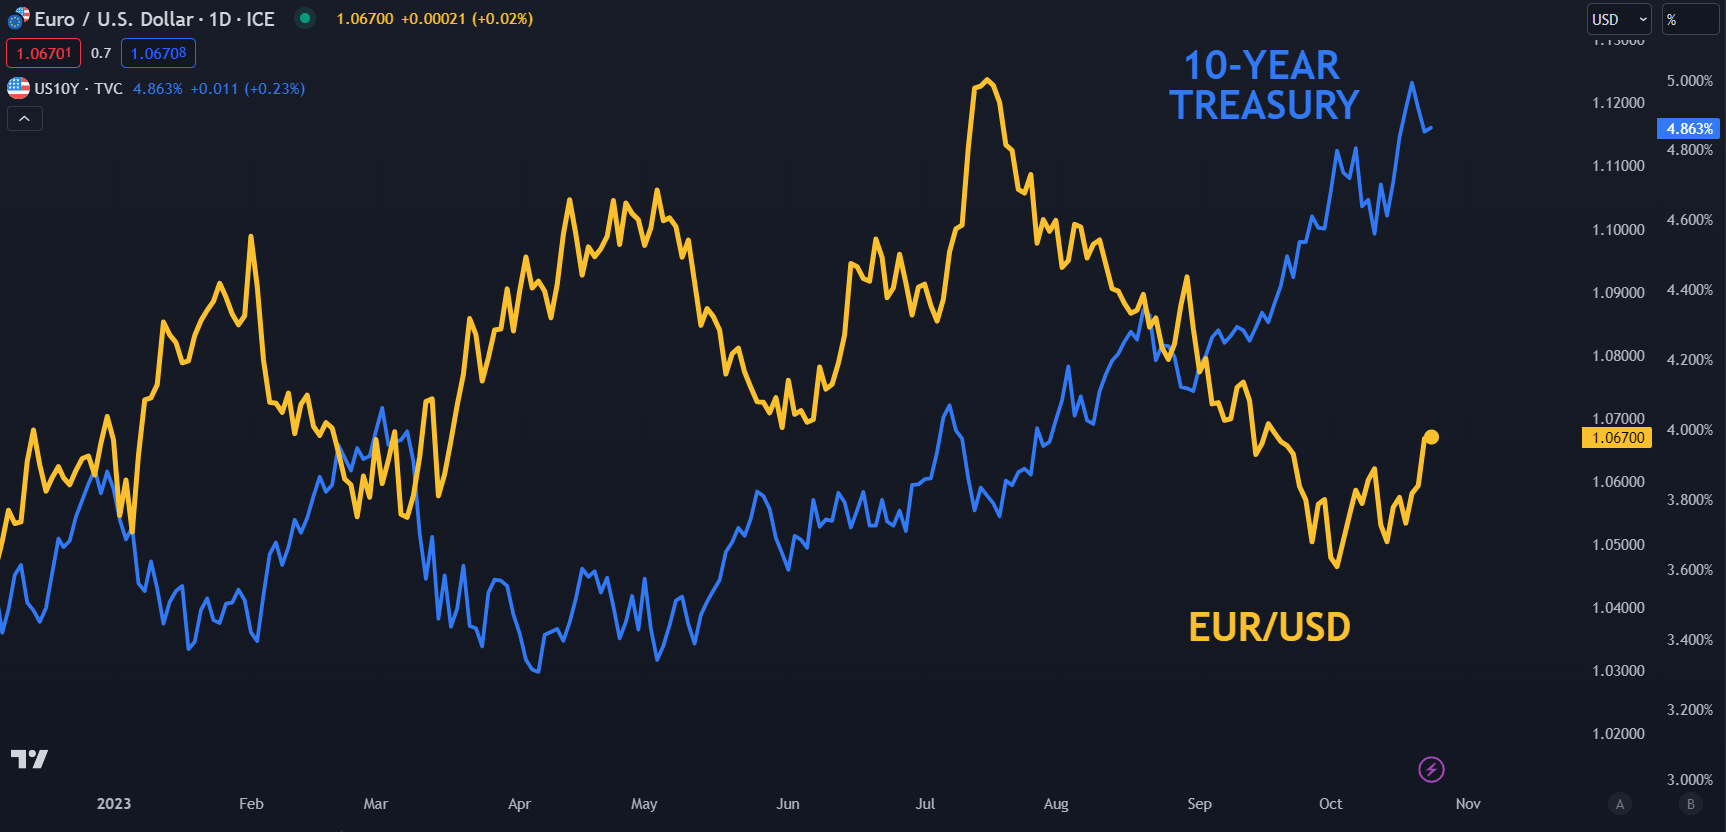
The context for EUR/USD is the possibility that Treasury yields might have peaked, particularly for the benchmark 10-year note. Time will tell if the ‘Bills’ are correct or otherwise.

EUR/USD AND 10-YEAR TREASURY YIELDS – AN INVERSE RELATIONSHIP AT TIMES

image1.png

Chart Created in TradingView

EUR/USD TECHNICAL ANALYSIS UPDATE

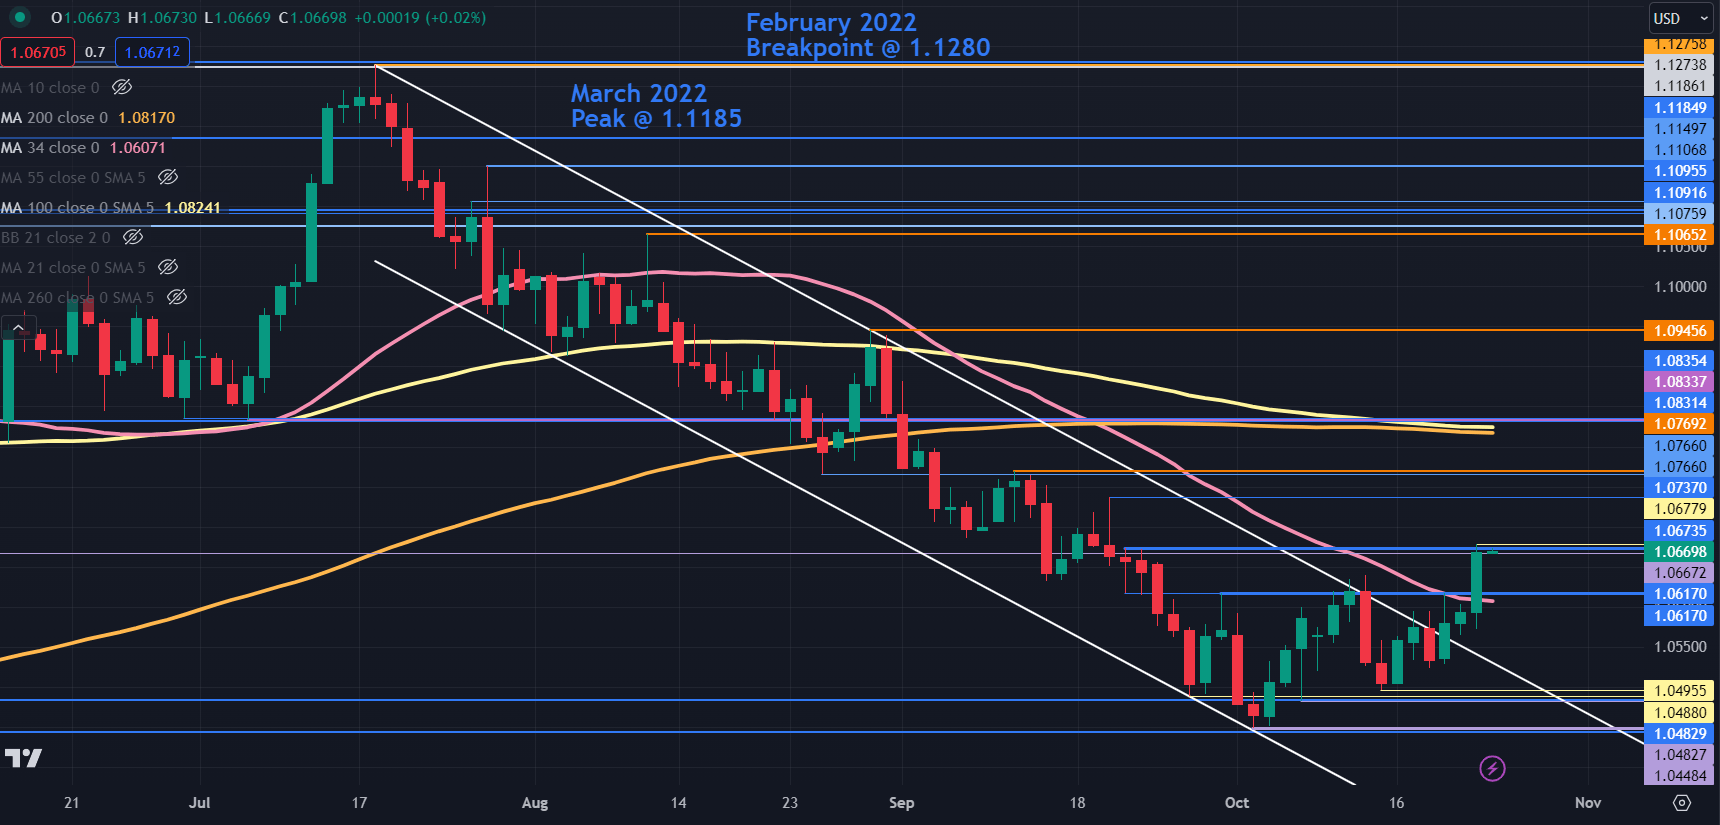
EUR/USD cleanly broke through the topside of a descending trend channel last Thursday and continued higher before pausing at minor resistance levels near 1.0680 today. To learn more about breakout trading, click on the banner below.

The next resistance levels could be at the breakpoints and previous highs near 1.0740, 1.0770, 1.0835 and 1.0945 ahead of a cluster zone of potential resistance in the 1.1075 – 1.1100 area.

The 100- and 200-day simple moving averages (SMA) are both near 1.0825 and may offer resistance.

On the downside, nearby support might lie near the breakpoint at 1.0617 which also has the 34-day SMA just below, potentially lending support.

Further down, a series of breakpoints and prior lows in the 1.0480 – 1.0495 area might provide a support zone. Below there, the lows of early 2023, which were tested at the start of this month, may provide support near 1.0440 levels of note.

EUR/USD DAILY CHART

image2.png

Chart Created in TradingView

Has the US Dollar Hit an Inflection Point? GBP/USD, AUD/USD, EUR/USD, USD/JPY

Has the US Dollar Hit an Inflection Point? GBP/USD, AUD/USD, EUR/USD, USD/JPY

The US dollar’s rally is showing signs of fatigue ahead of the Oct. 31-Nov.1 FOMC meeting. Markets are pricing in a 98% chance that the Fed will keep interest rates on hold after a number of Fed officials recently pointed out that the tightening in financial conditions as a result of the jump in yields has reduced the need for imminent tightening – a point echoed by Fed chair Powell last week. For more details, see “US Dollar Outlook After Powell: GBP/USD, AUD/USD, EUR/USD Price Action,” published October 20.

Meanwhile, technical charts suggest that the greenback could be in the process of setting a short-term peak – a risk highlighted earlier this month. See “US Dollar Showing Tentative Signs of Fatigue: EUR/USD, GBP/USD, USD/JPY,” published October 5.

DXY Index: Upward pressure could be easing a bit

image1.png

DXY Index: Interim peak in place?

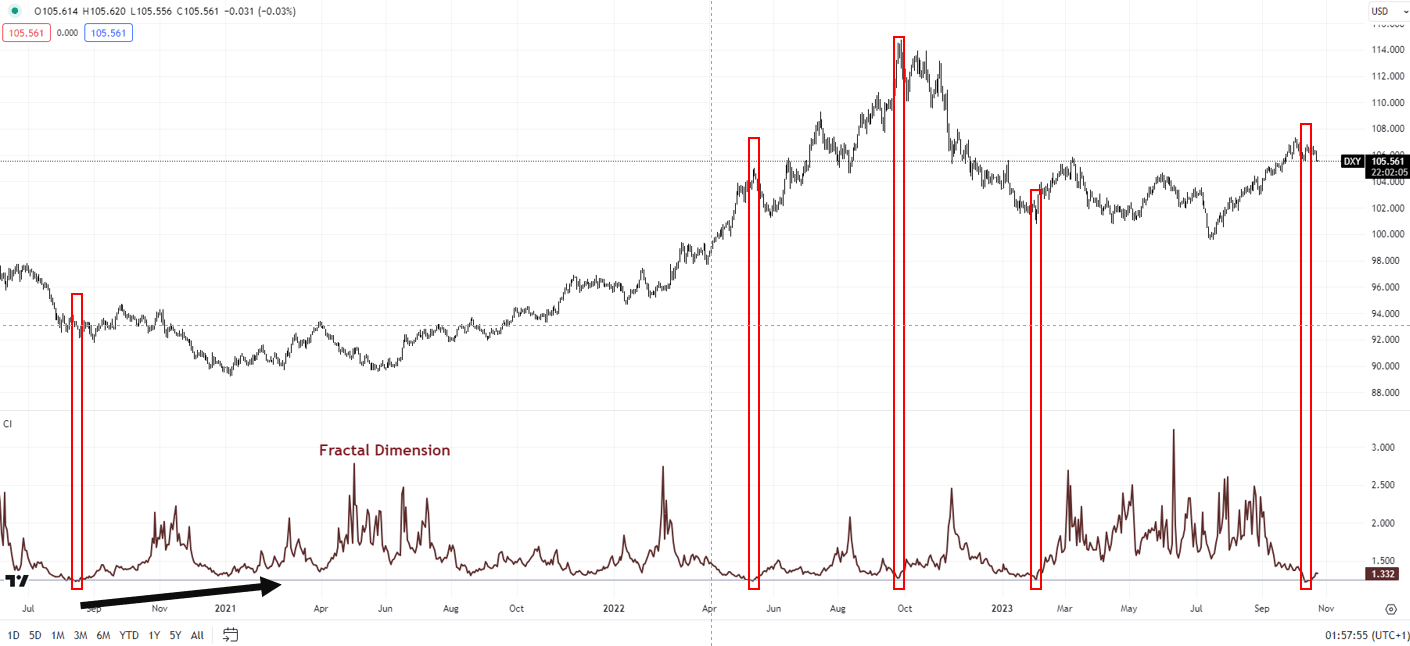
Market diversity, as measured by fractal dimensions, appears to be low as the DXY Index hit a multi-month high earlier this month. Fractal dimensions measure the distribution of diversity. When the measure hits the lower bound, typically 1.25-1.30 depending on the market, it indicates extremely low diversity as market participants bet in the same direction, raising the odds of at least a pause or even a price reversal. For the DXY Index, recently the 65-day fractal dimension fell below the threshold of 1.25, flashing a red flag, pointing to a consolidation/minor retreat at the very least. For more discussion, see “Has the US Dollar Rally Hit Limits? DXY Index Fractals, Price Action,” published October 17.

EUR/USD Daily Chart

image2.png

EUR/USD: Breaks above minor resistance

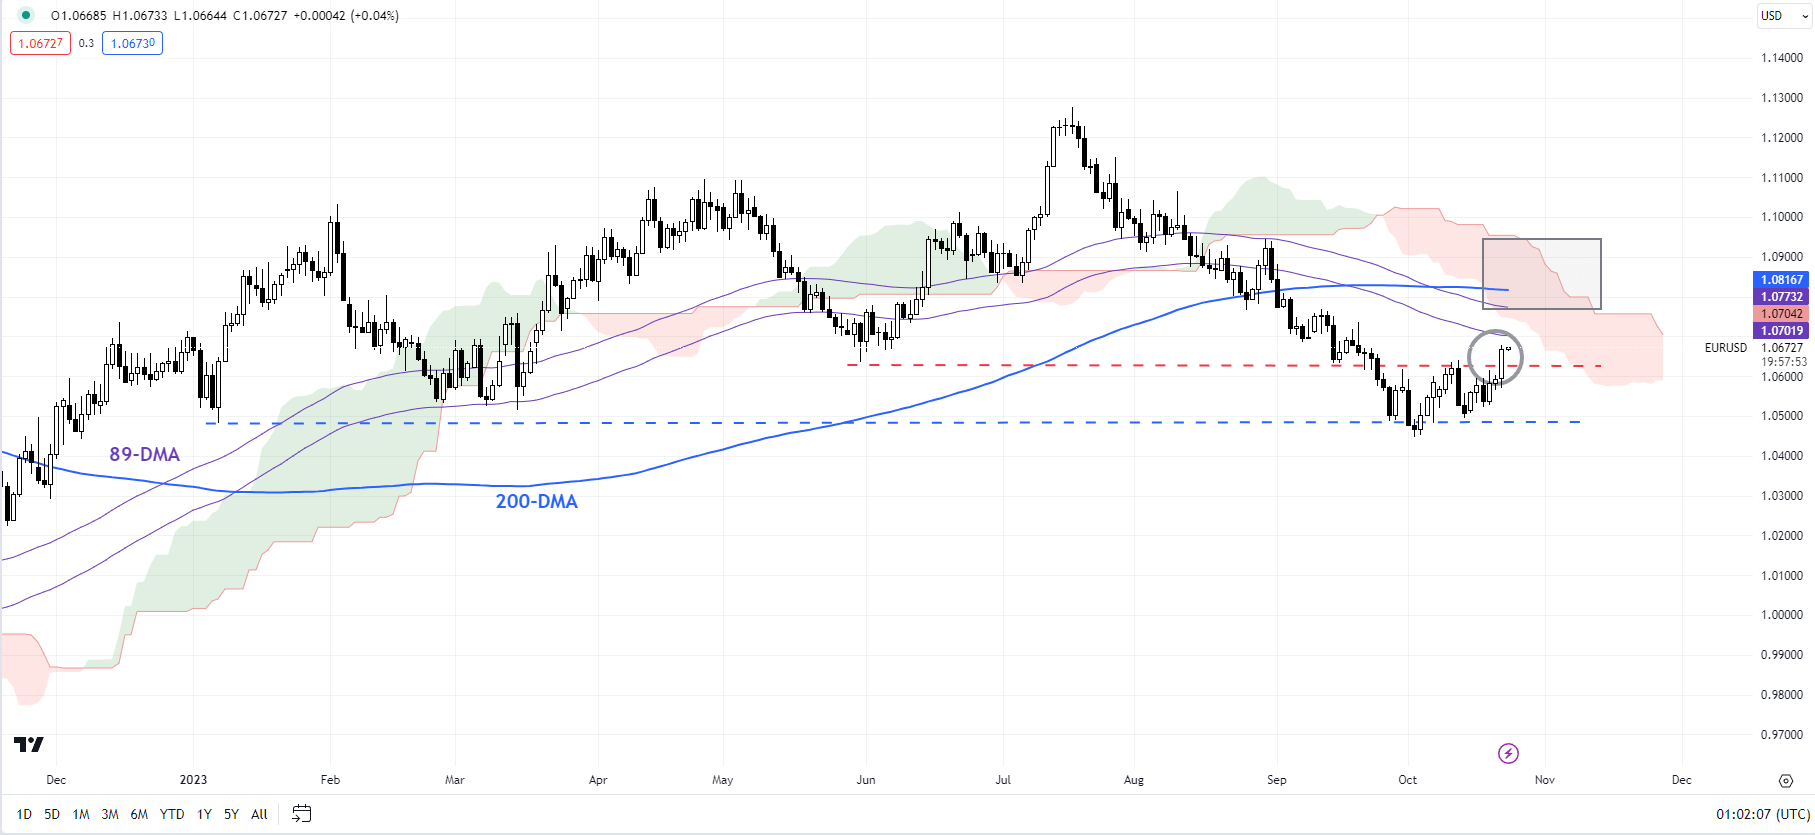
EUR/USD has broken above minor resistance at the October 11 high of 1.0635 suggesting that the immediate downward pressure has faded a bit. This follows a rebound from a strong cushion at the January low of 1.0480 – a break below would have posed a serious threat to the medium-term uptrend that started late last year. EUR/USD’s rebound could extend a bit further toward the 200-day moving average (now at about 1.0825), roughly coinciding with the 89-day moving average (now at about 1.0725).

If you’re puzzled by trading losses, why not take a step in the right direction? Download our guide, “Traits of Successful Traders,” and gain valuable insights to steer clear of common pitfalls that can lead to costly errors.

GBP/USD Weekly Chart

image3.png

GBPUSD: Slide pauses

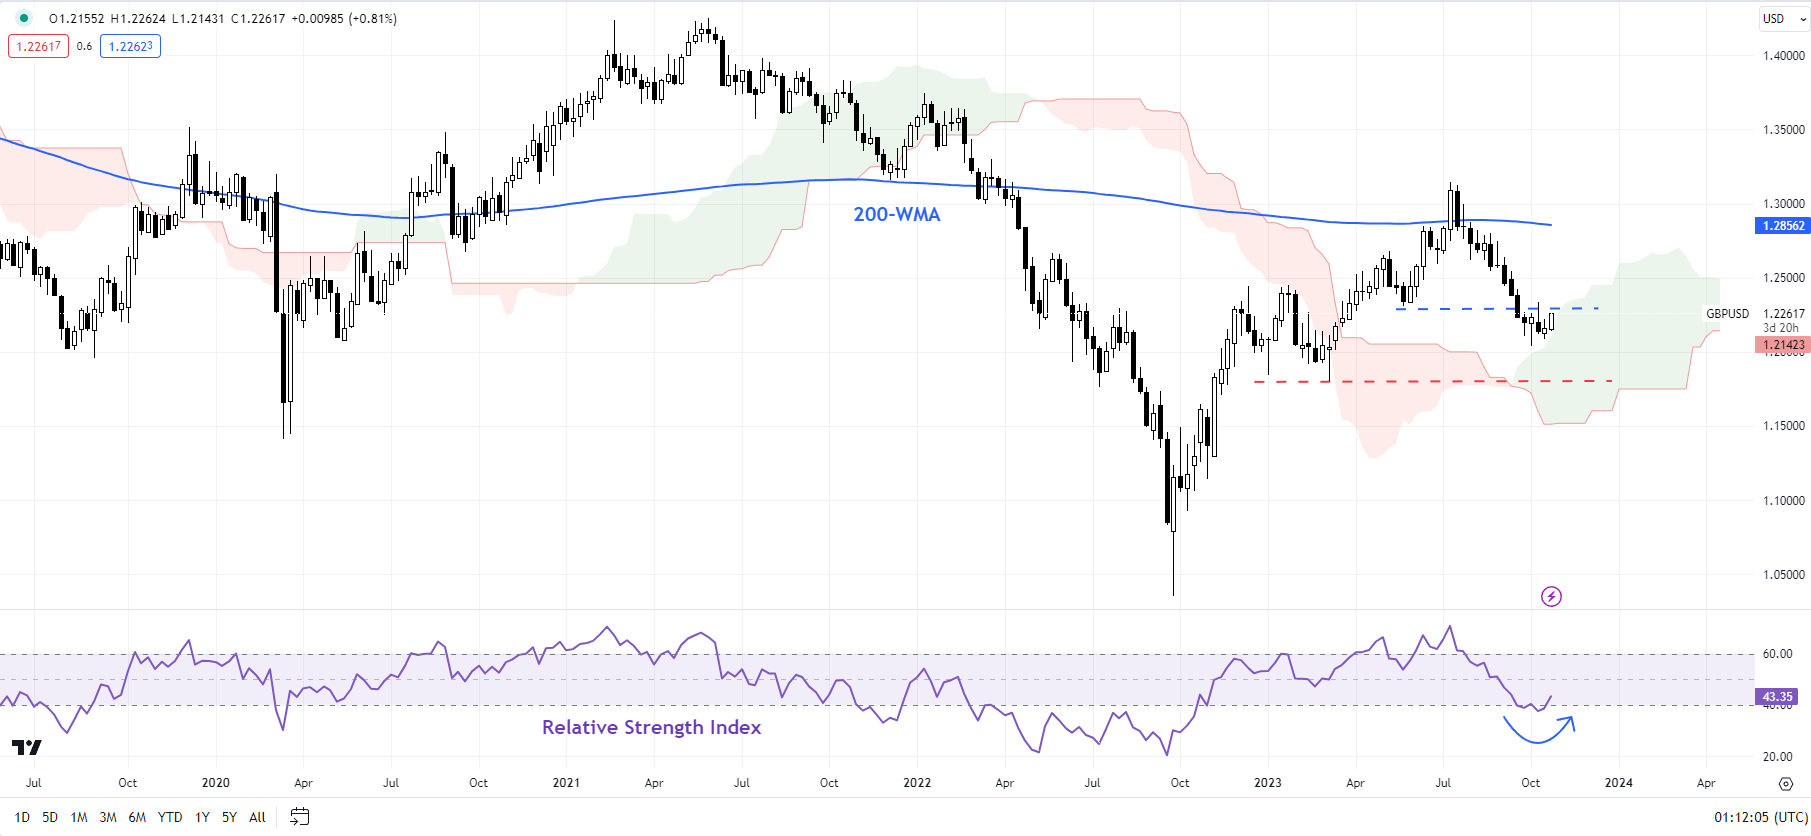
GBP/USD’s slide has paused as it approaches significant support at the March low of 1.1800. Given oversold conditions, and light positioning, a minor rebound wouldn’t be surprising. Any break above the initial resistance at the October 11 high of 1.2350 could open the way toward the 200-day moving average (now at about 1.2450). Zooming out, the retreat in July from the 200-week moving average and the subsequent sharp decline raises the odds that the retracement is the correction of the rally that started a year ago. For more discussion, see “Pound’s Resilience Masks Broader Fatigue: GBP/USD, EUR/GBP, GBP/JPY Setups,” published August 23.

USD/JPY Daily Chart

image4.png

USD/JPY: Holds below the psychological 150 mark

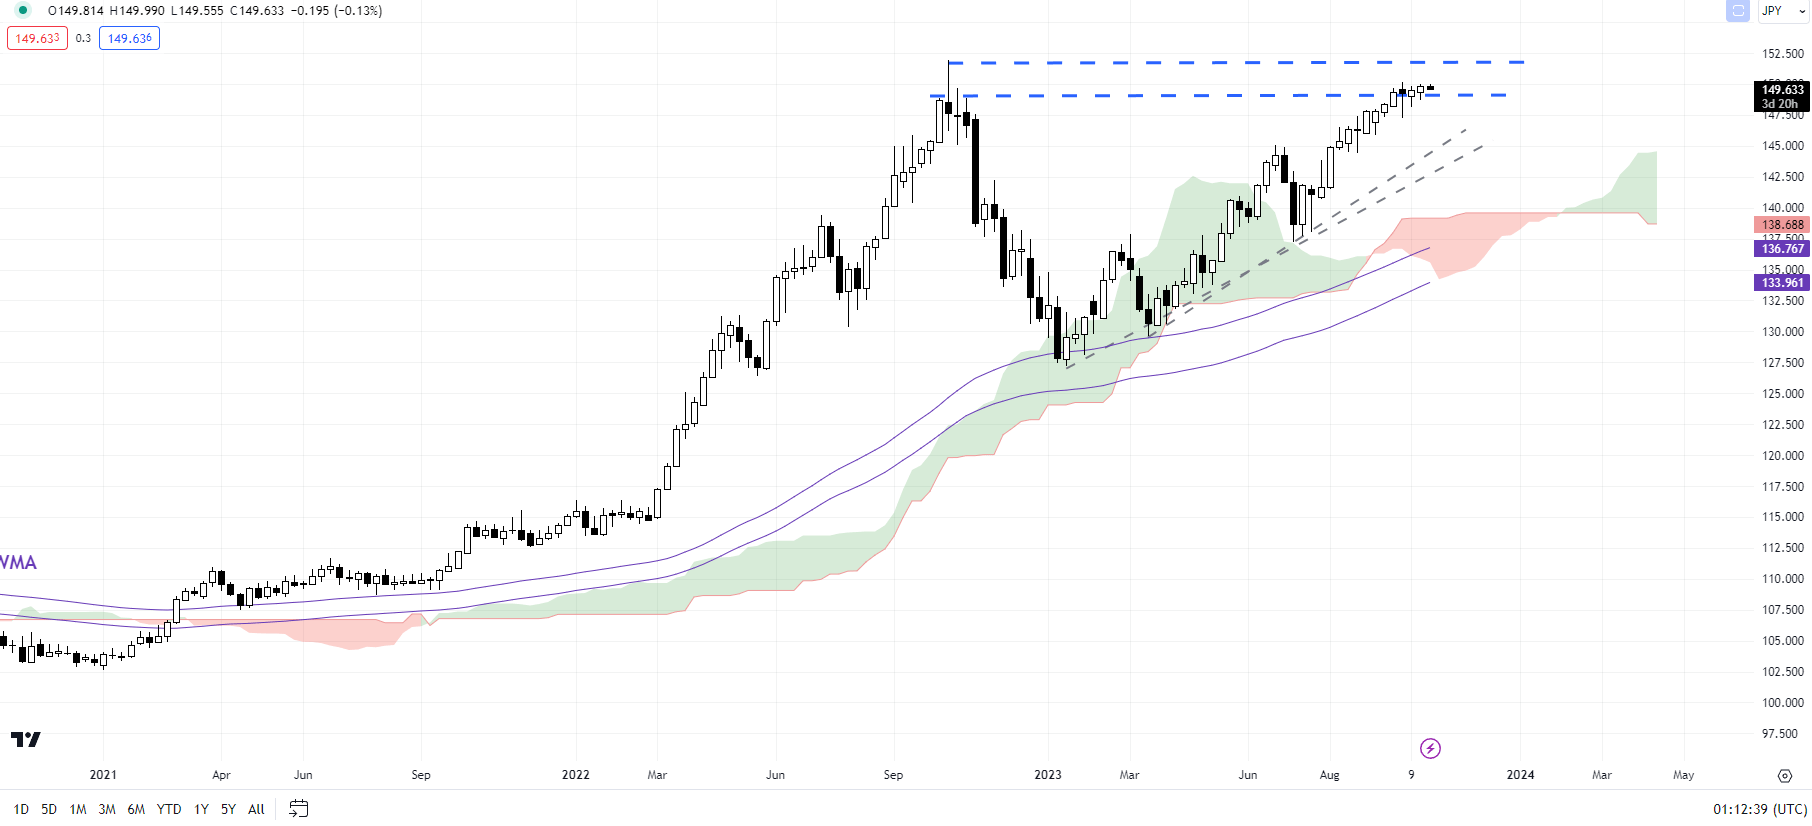
USD/JPY’s rally is showing signs of fatigue as it tests the psychological barrier at 150, not too far from the 2022 high of 152.00. There is a chance of a minor retreat, initially toward the Oct. 10 low of 148.25. Beyond that, a crack under the early-October low of 147.25 would be required to confirm that the multi-week upward pressure had faded. For more discussion, see “Japanese Yen After BOJ: What Has Changed in USD/JPY, EUR/JPY, AUD/JPY?” published September 25.

AUD/USD Daily Chart

image5.png

AUD/USD: Attempting to set a low

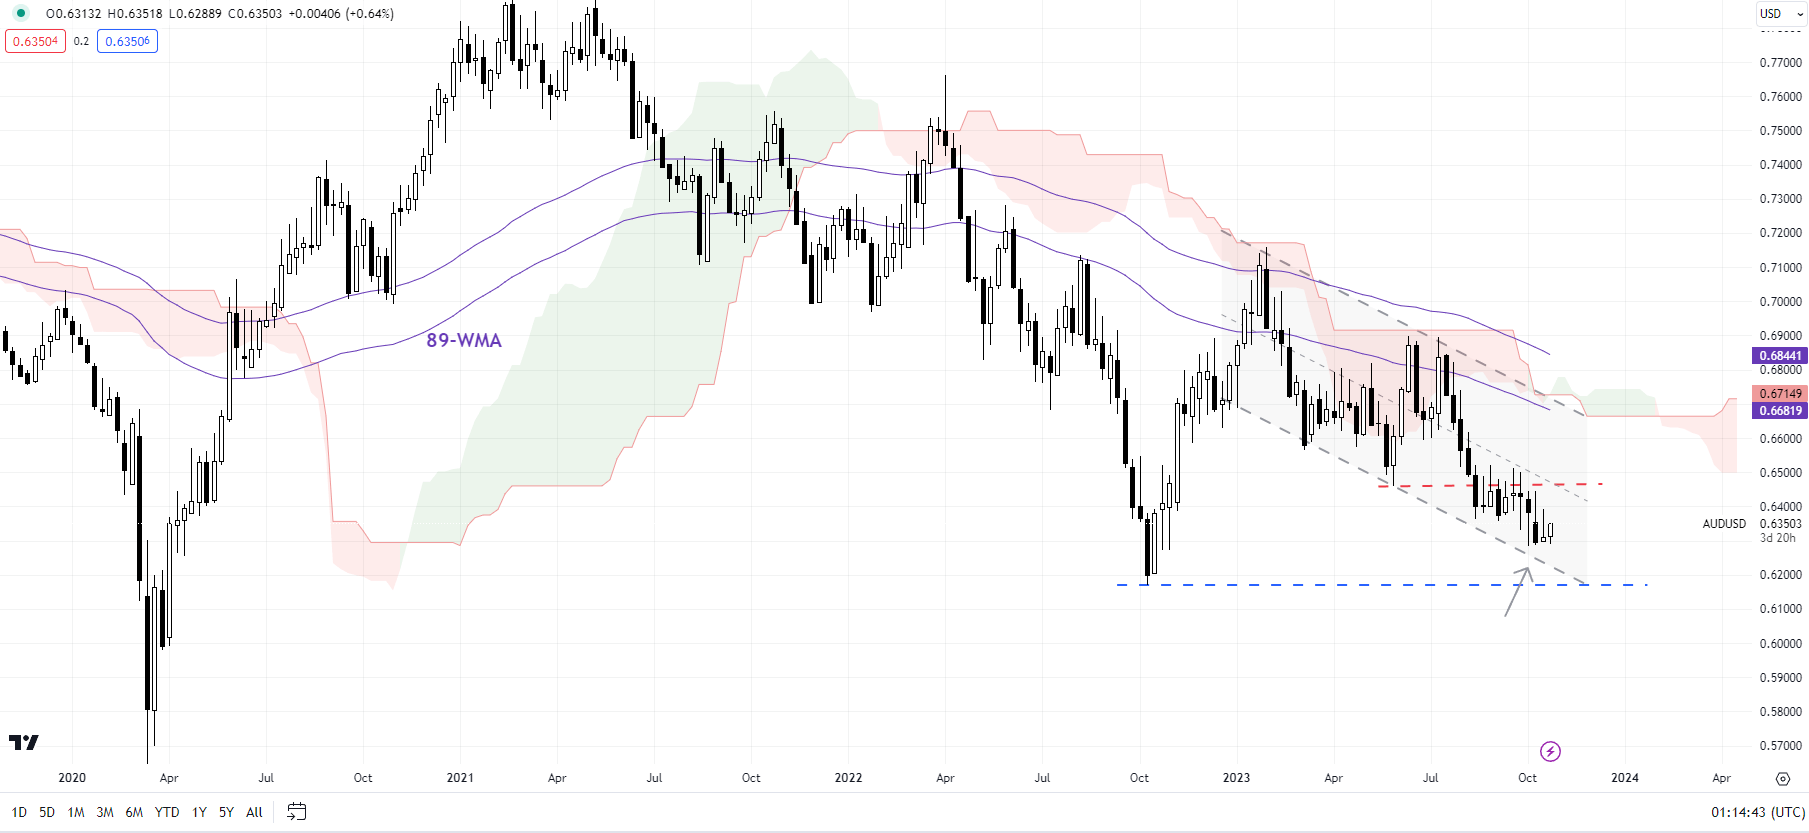
AUD/USDis attempting to form a low but lacks the required upward momentum yet. The pair has been holding above support on the lower edge of a declining channel since August, around minor support at the early-October low of 0.6285. AUD/USD would need to break above resistance at the end-August high of 0.6525 for the immediate downward pressure to dissipate. For more discussion, including fundamentals, see “Australian Dollar Jumps After China GDP Beat; What’s Next for AUD/USD?” published October 18.

Looking for actionable trading ideas? Download our top trading opportunities guide packed with insightful tips for the fourth quarter!

Gold Price Steadies After Treasury Yields Collapse, Sinking USD. Where to for XAU/USD?

Gold Price Steadies After Treasury Yields Collapse, Sinking USD. Where to for XAU/USD?

The gold price has recovered some of the ground lost overnight as markets recalibrate on the prospect of a possible peak in Treasury yields at the long end.

Treasury yields peeled lower after tweets from famed investors, Bill Ackman and Bill Gross signalled a shift in their view of US government debt.

Ackman said that he had covered his short bond position due to concerns about the outlook for the US economy.

Bill Gross was a bit more nuanced, looking at curve trades and outright buying of short-term interest rate futures but both investors said that they have been sellers of long-end bonds of late.

The 10-year note eclipsed 5.02% in the US session before rolling over and touching 4.83% going into the close. It remains near the low so far today.

In all that carnage, the DXY (USD) index dipped to a four-week low and is seen as weaker across the board over the last 24 hours. EUR/USD has continued higher after breaking above a descending trend line last week. Despite the lower US Dollar, the gold price has been unable to capitalise on it.

USD/JPY remains in a tight range after the Bank of Japan announced an unscheduled bond buying operation as FX markets weigh the possibility of physical intervention should the price rise significantly above 150.

The Australian Dollar has reclaimed 0.6350 today ahead of a speech by RBA Governor Michele during today’s European session.

3Q Australian CPI will be released tomorrow, and it is likely to be crucial for the RBA’s monetary policy deliberations at its November gathering.

Bitcoin added to overnight gains, trading above USD 35,000 today for the first time since May 2022 to be around 15% higher to start the week.

It appears that speculation on a spot Bitcoin ETF getting approval for U.S. investors might have squeezed some shorts in the product.

Crude oil is languishing going into Tuesday’s session after easing lower on the possibility of a delay in the outbreak of urban warfare in Palestine.

The S&P 500 index broke below the 200-day simple moving average (SMA) on Monday and remains below it today. APAC equities have had a fairly mixed day with slight gains and losses for the major indices.

After UK jobs data today, a series of PMI numbers will hit the screens from across Europe and the US.

The full economic calendar can be viewed here.

GOLD TECHNICAL ANALYSIS SNAPSHOT

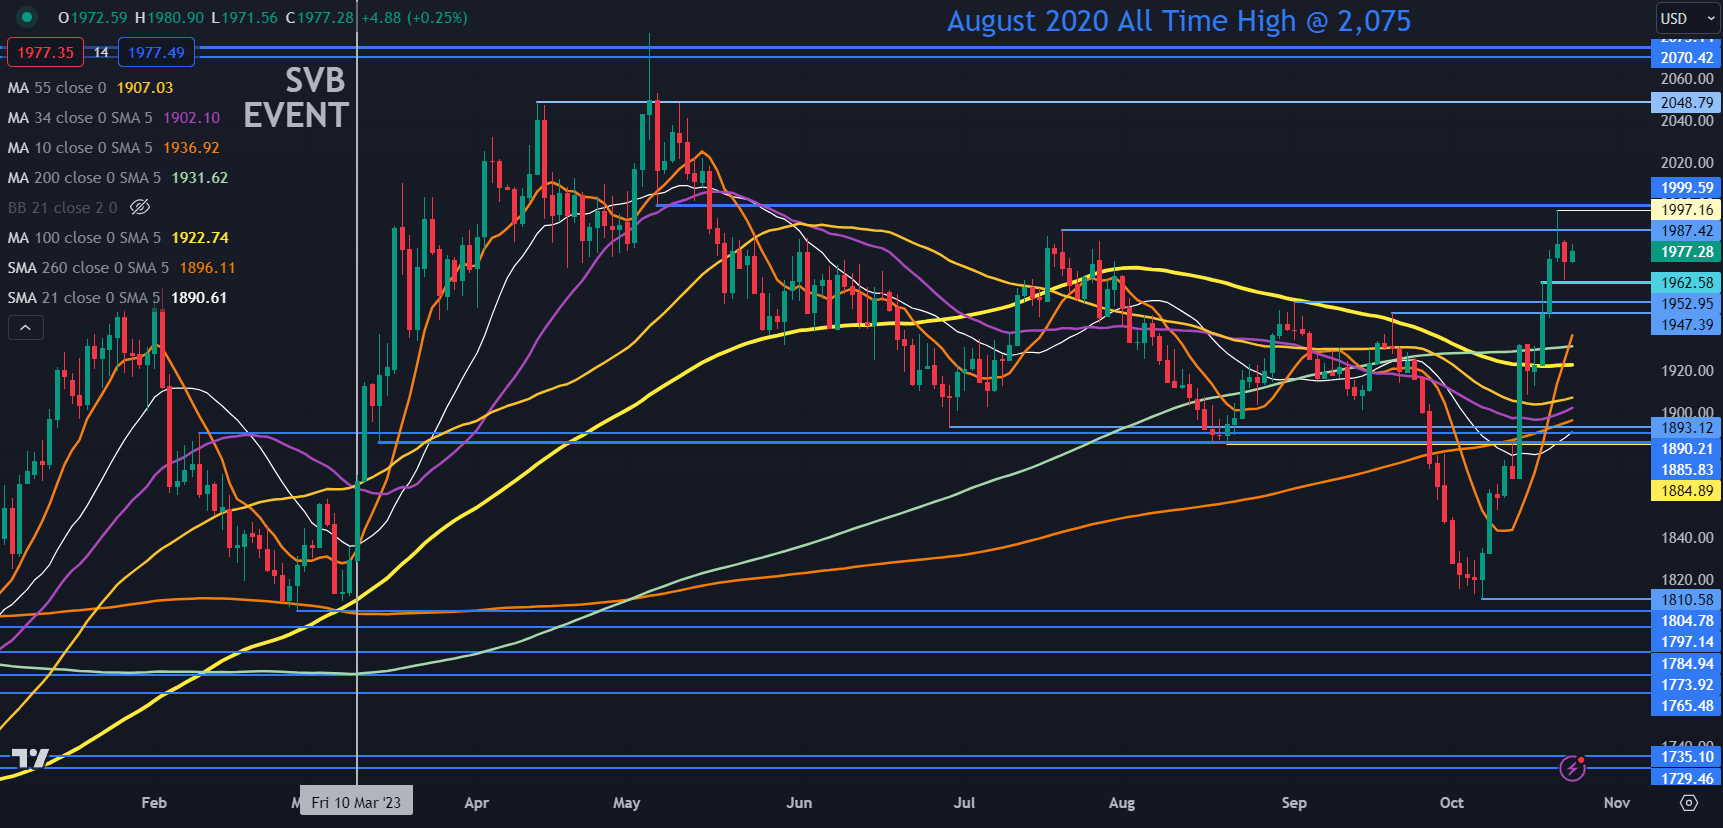
The gold price rallied to within a whisker of breakpoint resistance last Friday but fell short of the psychological 2000 level.

Overnight, breakpoint support held near 1960 and these levels may continue to offer resistance and support respectively.

A feature of the chart below is the clustering of the 10-, 21-, 34-, 55-, 100-, 200- and 260-day Simple Moving Average (SMA). They all lie between 1890 and 1937.

This may suggest that mean reversion is possible and might allow range trading conditions to continue.

To learn more about range trading, click on the banner below.

SPOT GOLD CHART

image1.png


Bitcoin Aiming for 39,000? BTC/USD & ETH/USD Price Setups

Bitcoin Aiming for 39,000? BTC/USD & ETH/USD Price Setups

Cryptocurrencies have surged on hopes that the US could soon approve a bitcoin exchange-traded fund. Technical charts suggest there is room for further rise.

BITCOIN: Cracks above the key barrier

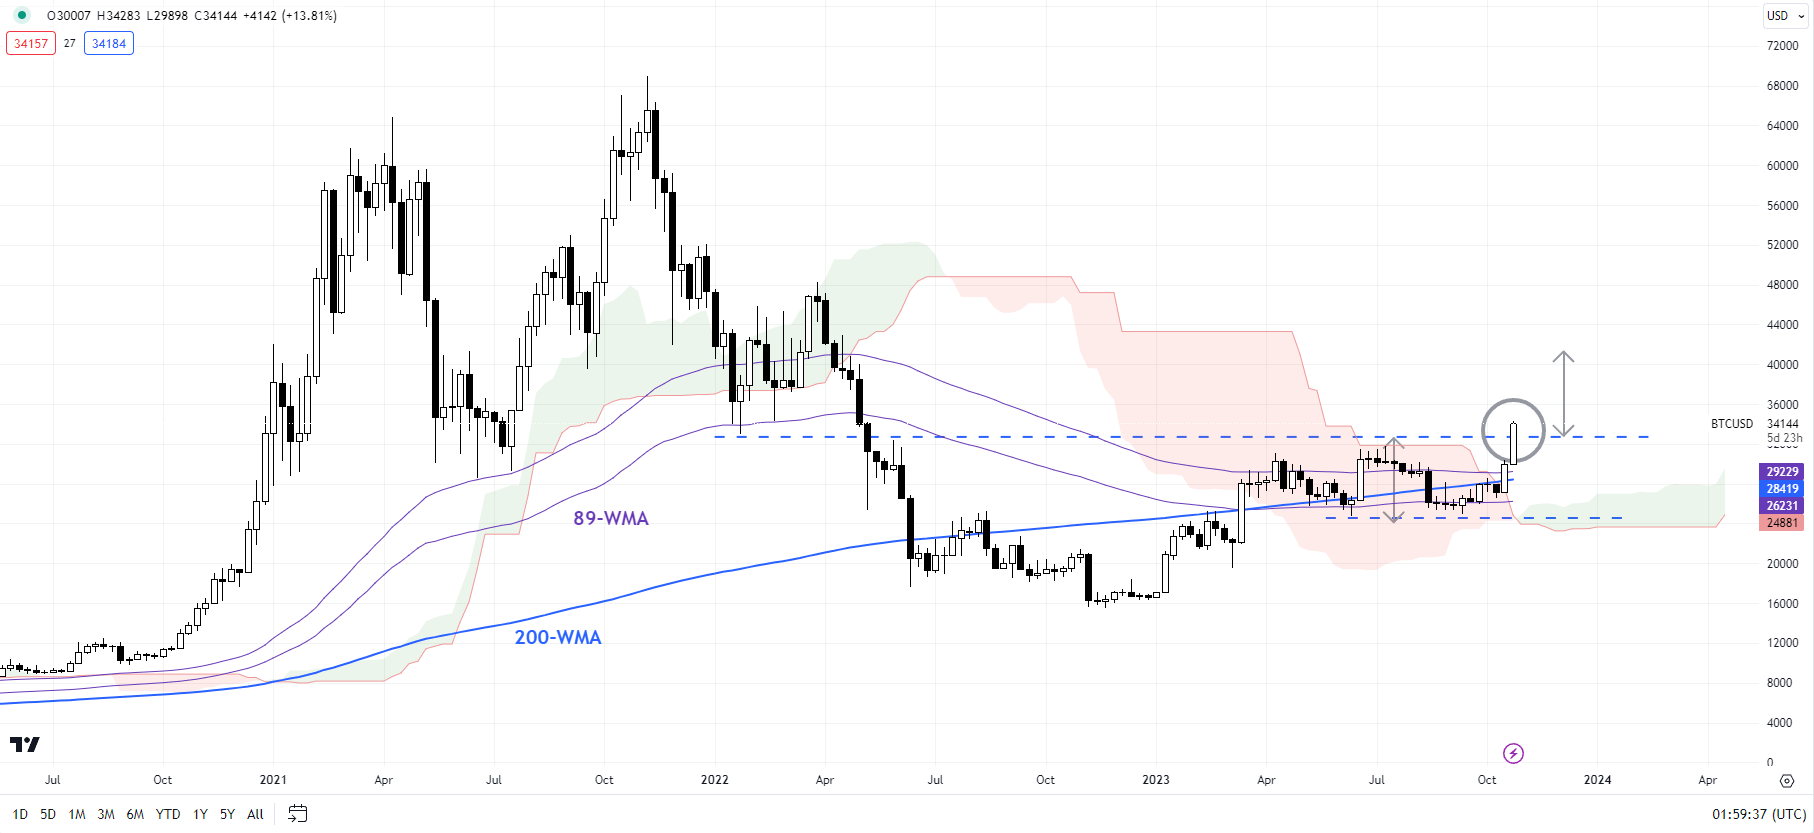
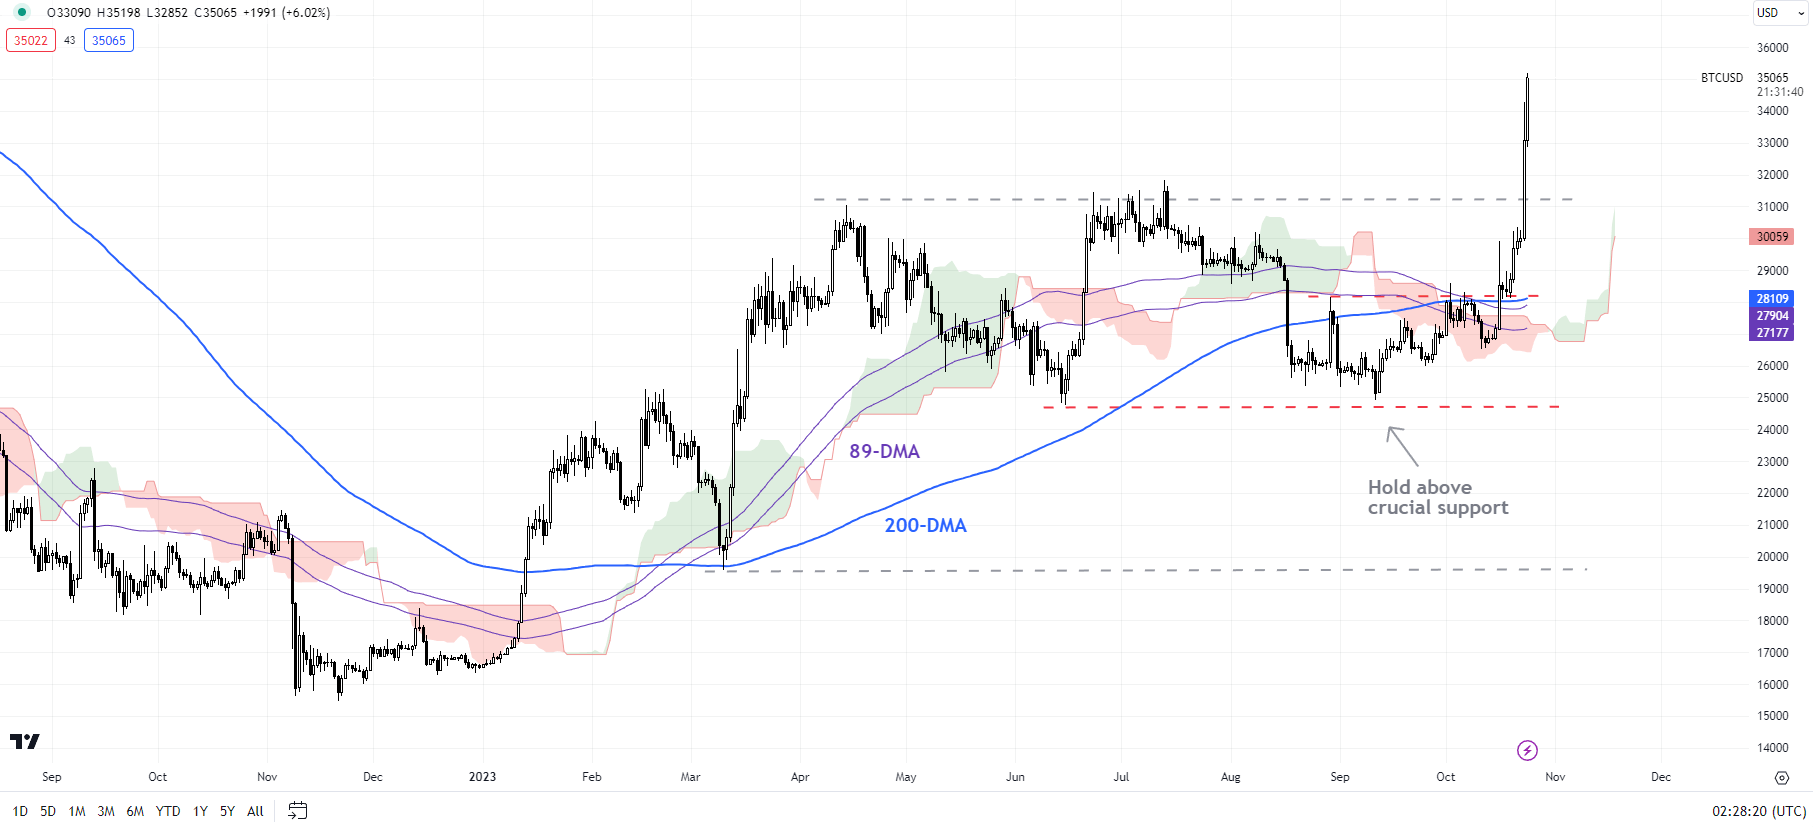
Bitcoin has broken above a crucial hurdle at the July high of 31800, triggering a double bottom (the June and September 2023 lows), potentially opening the way toward 39,000. The surge in momentum follows a rise above another vital barrier on the 200-day moving average, roughly coinciding with the end-August high of 28150. The move on the daily charts coincides with a rise out of the bearish Ichimoku cloud on the weekly charts – BTC/USD was last above the cloud back in 2021.

BTC/USD Weekly Chart

image1.png

Signs of upward momentum emerged last month after a rebound from strong support at the June low of 24750, which kept intact the higher-top-higher-bottom formation since the end of 2022. Importantly, this keeps alive the possibility of an extended recovery given the 2021-2022 decline, reinforcing the bullish medium-term trajectory, first highlighted earlier this year – see “Bitcoin Technical Outlook: BTC/USD Turns Bullish”, published January 18.

BTC/USD Daily Chart

image2.png

Dips could be limited for now, with immediate support on the 10-hour moving average (now at about 33,000), and stronger support on the 30-hour moving average (now at about 31600).

ETHEREUM: Holds above vital support

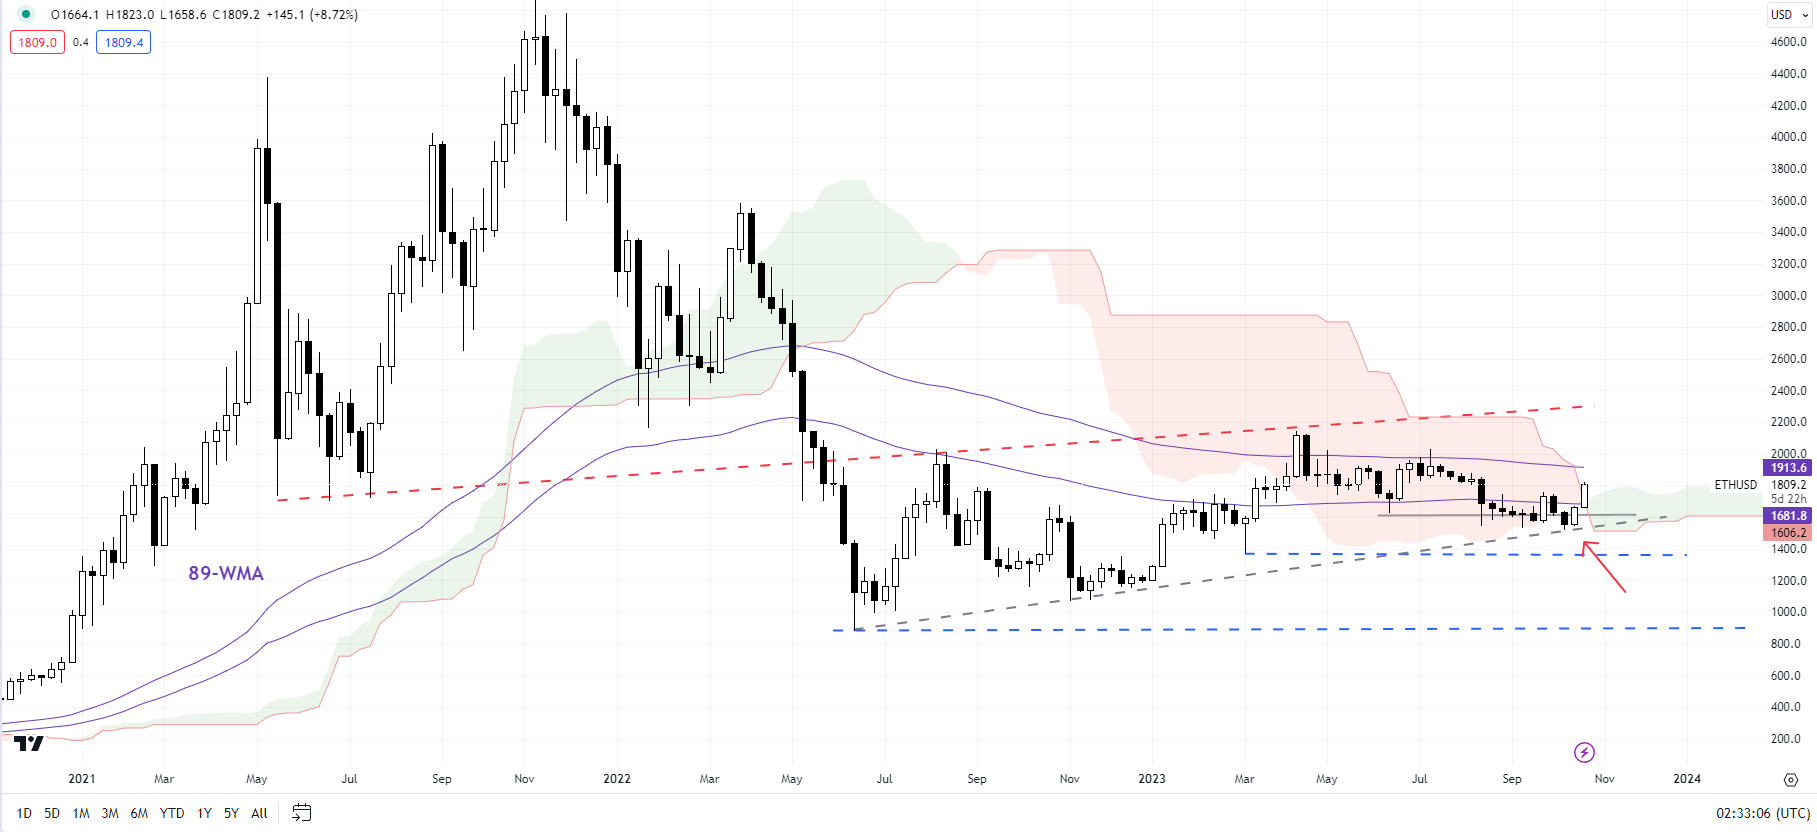
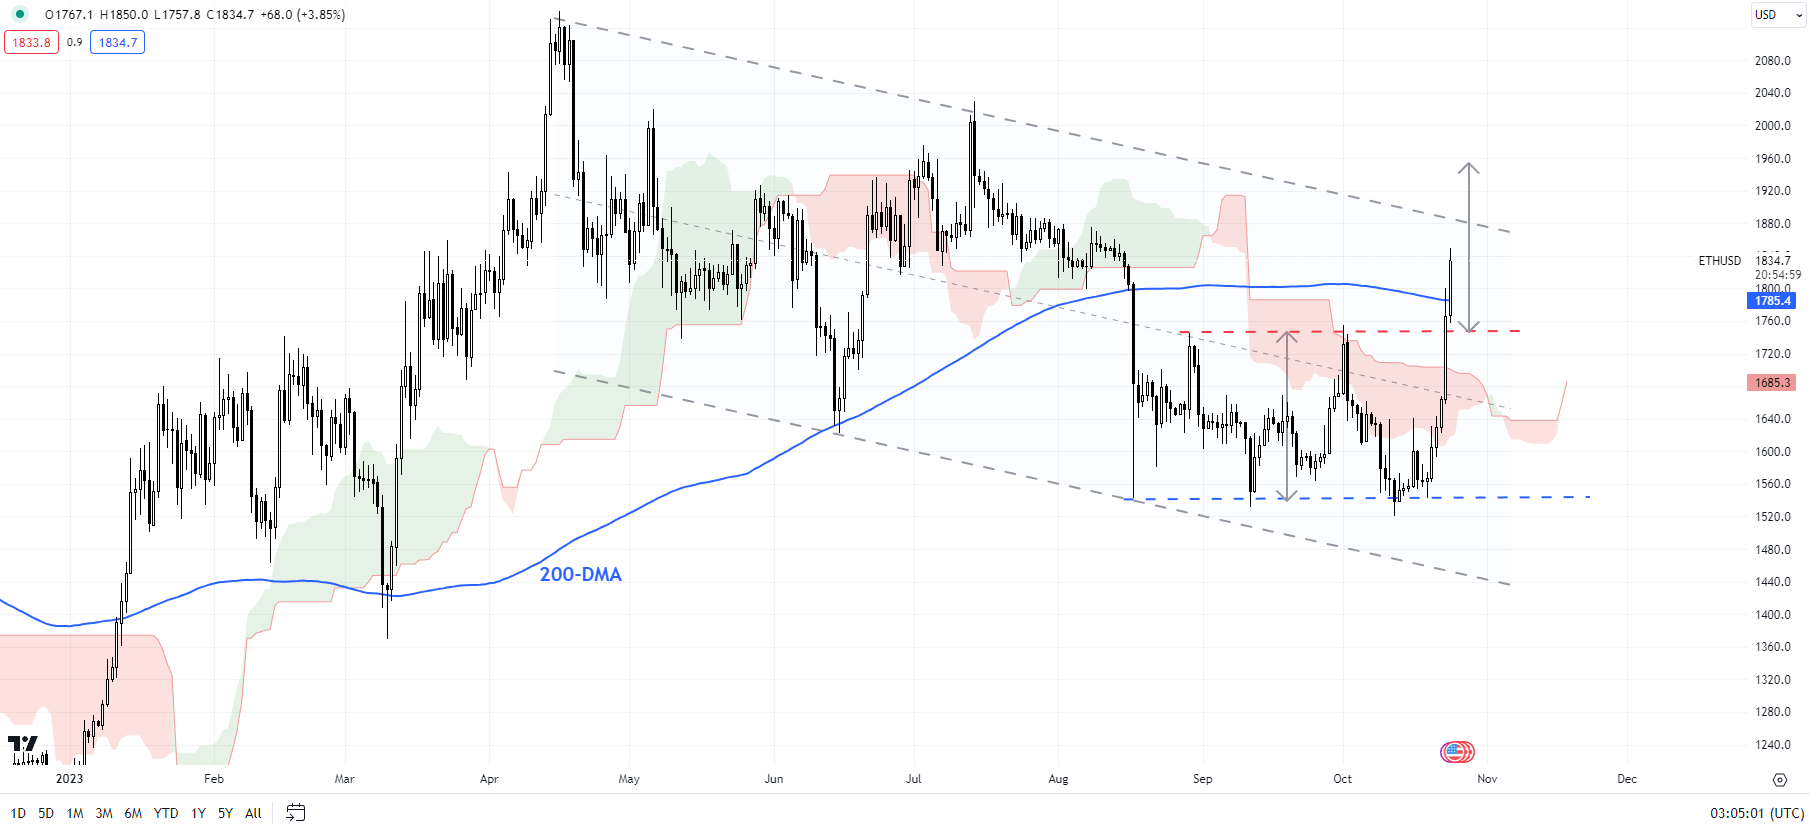
Ethereum has been attempting to break above a key hurdle on the upper edge of a sideways channel since August (that comes in at about 1745). A decisive break above could open the door toward 1970, the price objective of the pattern.

ETH/USD Weekly Chart

image3.png

The bullish momentum started after ETH/USD hit a key cushion on the lower edge of the channel at about 1550, not too far from the lower edge of a downtrend channel since April. On the weekly charts, ETH/USD has held above the 200-week moving average, an uptrend line from last year, around the lower edge of the Ichimoku cloud.

ETH/USD Daily Chart

image4.png

Having said that, for the recovery to continue, ETH/USD would eventually need to cross above the April high of 2145, raising the odds of an extended rebound toward 2400 (the 38.2% retracement of the 2021-2022 decline).

Curious to learn how market positioning can affect asset prices? Our sentiment guide holds the insights—download it now!

UK Breaking News: Unemployment Rate Drops in August, GBP Lifts

UK Breaking News: Unemployment Rate Drops in August, GBP Lifts

The UK has experienced a notable easing in the job market – one of the telling signs that restrictive monetary policy is having an effect on the real economy. Central banks are broadly in agreement that a period of below trend growth and easing in the job market is required to bring inflation back towards target. The slight turn lower will not force the Bank of England to seek higher interest rates as inflation has broadly been heading lower and effects of higher rates are being felt across the board.

image2.pngUK and EU PMI is up next, with previous prints failing to inspire. Germany and the UK both received lower revisions to their respective growth outlooks from the IMF in its latest World Economic Outlook, underscoring the difficulties that lie ahead.

Immediate Market Response

GBP/USD saw a slight lift after the release, helped somewhat by a weaker USD after US yields declines yesterday.

GBP/USD 5- minute chart

image3.png

Binance, Global Trade Capital, and More: Executive Moves of the Week

Binance, Global Trade Capital, and More: Executive Moves of the Week

Binance France has seen another change in its leadership as Stéphanie Cabossioras stepped down from her position as the Executive Director. Her departure marks yet another senior executive leaving Binance this year, adding to the leadership transitions within the cryptocurrency exchange.

David Prinçay, the President of Binance France, confirmed Cabossioras’ resignation in a recent post on the social platform X (formerly known as Twitter). Prinçay expressed his gratitude for Cabossioras’ contributions to Binance France and wished her the best in her future endeavors.

Uncover more about the growing list of executives leaving Binancem which now includes Cabossioras.

Yen Breaches 150 Per Dollar Again, Raising Intervention Risk

Yen Breaches 150 Per Dollar Again, Raising Intervention Risk

The yen briefly weakened beyond 150 against the dollar again as the wide yield gap between Japan and the US continues to weigh on this year’s worst-performing major currency.

It touched 150.11 per the greenback in early Asian trading on Monday before quickly recovering amid weight from options-related dollar selling and suggestions of algorithmic transactions. It was little changed at 149.87 at 11:30 a.m. in Tokyo.

Traders are wary of betting on further depreciation given the risk of intervention from authorities in Japan. Finance Minister Shunichi Suzuki said last week that it is important to have stability in foreign exchange markets and for them to reflect fundamentals.

“Dollar-yen broke the 150 line during hours with low liquidity and less participants, probably led by speculators,” said Yukio Ishizuki, senior currency strategist at Daiwa Securities Co. in Tokyo. “The topside of the currency pair is likely to become heavier in the Tokyo trading hours amid growing concerns about intervention, especially above the 150 line. People will continue to stay nervous.”

The yen’s rapid recovery from above 150 also showed signs of being “triggered by algorithm transactions that were automatically executed due to intervention concerns,” said Fukuhiro Ezawa, head of financial markets in Tokyo at Standard Chartered Bank.

The wide interest rate divide with the US is seen in the Treasury 10-year yield at 4.96%, which is almost six times that of Japan’s equivalent at 0.835%. The divergence in monetary settings is fueling the gap and Bank of Japan Governor Kazuo Ueda said Friday that the BOJ will continue patiently to keep settings accommodative in order to achieve the goal of stable and sustainable 2% inflation.

Traders are on tenterhooks with a BOJ policy meeting approaching on Oct. 30-31, and tensions in the Middle East increasing uncertainty in global markets.

Investors are also digesting a Nikkei report that BOJ officials are pondering the question of whether to tweak yield-curve control program as domestic long-term interest rates float higher in tandem with those in the US. It didn’t say where it obtained the information.

“If the BOJ wants to see a stronger yen, I think they will need to do more than just widen the band yet again,” Rodrigo Catril, currency strategist at National Australia Bank in Sydney, said of the YCC program. “The market is right to be cautious.”

A tweak to the BOJ’s ultra-loose monetary policy this month could propel the yen to 145 against the dollar if the central bank also flags that a rise in interest rates is coming, according to RBC BlueBay Asset Management.

The central bank is likely to unwind its unusual policy of sub-zero rates during the first half of 2024, according to the majority of 315 respondents in a Bloomberg Markets Live Pulse survey.

Yet until Monday, the yen had hovered just below 150 per dollar since it went to 150.16 on Oct. 3. That move suddenly reversed, with it recovering to 147.43, stoking speculation that Japan had entered the market to prop up the currency. Senior government officials stuck to a strategy of keeping investors guessing on the following day by declining to clarify whether they had intervened.

Japan spent around ¥9 trillion ($60 billion) in September and October last year across three occasions in their first intervention to support the yen since 1998. This year the currency has weakened more than 12% against the dollar, making it the worst performer among its Group-of-10 peers.

Japan’s chief currency official Masato Kanda has said that as a general principle, rate hikes and interventions are ways to respond to excessive currency moves. He has vowed to take action if needed against excessive swings, but declined to say whether recent market moves were speculative.

Still, the International Monetary Fund has said that it sees no factors that would compel Japan to intervene in the foreign exchange market to support the yen.

When Japan Ends Negative Rate Policy, Treasuries Will Suffer

When Japan Ends Negative Rate Policy, Treasuries Will Suffer

Japan’s era of negative interest rates will end in coming months, and the implications for world markets will be enormous, with US Treasuries set to suffer the most, according to the latest Bloomberg Markets Live Pulse survey.

The Bank of Japan is likely to unwind its unusual policy of sub-zero rates during the first half of 2024, the majority of 315 respondents said. The move would bring an end to a bold experiment it embarked on in 2016 — one that’s recently placed Japan at odds with other major central banks that have been tightening aggressively to combat inflation.

What the BOJ does, and when it does it, will reverberate through world markets. The biggest consequence, according to MLIV Pulse respondents: more turbulence for the vast amount of Treasuries. That’s because higher yields in Japan would encourage fund repatriation by Japanese investors whose huge holdings include US, European and Australian debt.

“A shift in the BOJ’s policy could slow the export of capital from Japan as yields become more attractive locally than they were before,” said Martin Whetton, head of financial markets strategy at Westpac Banking Corp. in Sydney.

Thirty-seven percent of participants said Treasuries will face the most severe impact from Governor Kazuo Ueda shifting away from super-accommodative policy. Declines in the dollar may add to the misery, as 36% expect pain for the currency that the US debt is denominated in.

Portfolio managers and central banks around the world are keeping a watchful eye on any move by the BOJ, which has made negative rates and yield curve control the cornerstone of its policy to fight stagnant prices. It rocked global markets by raising the cap on benchmark 10-year bond yields in late 2022, and again at the end of July, pushing up bond yields.

“Some form of normalization is probably necessary,” said Eugene Leow, a senior rates strategist at DBS Bank Ltd. “This could mean upward pressure on five- to 10-year developed-market yields as higher Japanese government bond yields spill over.”

Japanese investors are the biggest foreign holders of US government bonds, with more than $1.1 trillion at the end of August, according to data from the US Treasury Department. Life insurers dumped a net ¥196 billion ($1.3 billion) of foreign bonds in the April-September period, following a record ¥8 trillion of sales in the previous six months, according to Ministry of Finance data.

The MLIV Pulse survey shows that 61% of respondents expect global bond market volatility to increase when the BOJ changes the policy, with majority of respondents predicting the historic step will happen next year.

“The market will probably be very jittery until traders and investors will get used to a world with positive yields,” said Ayako Sera, a market strategist in Tokyo at Sumitomo Mitsui Trust Bank Ltd. “It’s like a big stone being thrown into a pond where there has been no wind.”

Treasuries, traditionally the pillar of stability in many saving and investment portfolios, are already more volatile than stocks, at least by one measure. The combination of the aggressive policy tightening by the Federal Reserve and the flood of bond sales by the US government have imposed historical losses, especially on long-duration debt.

The survey asked participants when they thought benchmark Japanese 10-year sovereign yields would reach 1%, the effective limit tolerated by the BOJ. That level is likely to be touched in the first half of 2024, according to 43%, or even later, per 16% of respondents.

Japan’s 10-year yields have almost doubled since late July, when the BOJ increased the cap. At 0.835%, though, they’re still far below 4.91% for their US counterparts.

This yield gap has been widening, making the yen into worst performer among Group of 10 currencies so far this year. The Japanese currency has lost more than 12% against the greenback this year, ending last week at 149.86 per dollar.

The vast majority of survey respondents, at 62%, predict the dollar-yen rate to finish the year in a range of 140 to 150.

The MLIV Pulse survey of Bloomberg News readers on the terminal and online is conducted weekly by Bloomberg’s Markets Live team, which also runs the MLIV blog. This week, are asking which is a better investment, the Ozempic maker Novo Nordisk or the AI chip leader Nvidia. Share your views here.