The foreign exchange market provides traders and investors with the opportunity to earn on the difference in currency quotations, as well as by copy trading, developing and selling signals and trading systems. Forex trading for beginners is a chance to try their hand at a new enterprise, gain financial freedom and start making the most of their time.
What is Forex and how does trading work? How do you develop an action plan? What is important for achieving your trading goals? You will find the answers to these questions in this review. You will also get examples of strategies that can be used to create trading systems.
The article covers the following subjects:
What is The Forex Market?
Forex is the international currency market. Its participants include exchanges, brokers, banks, investment funds, private traders and their trading partners, payment systems and others.
Forex has another meaning – it’s an over-the-counter market for contracts for difference (CFDs). Here, the basic assets are currencies, cryptocurrencies, stocks, futures, options, and commodity assets.
Forex market participants:
- Traders – individuals and legal entities who buy and sell assets or lend them to other traders. A Forex trader can be either an individual or an investment fund that serves the interests of its customers;
- Brokers – intermediaries providing Forex trade services for a commission. Brokers are a link between other market participants;
- Market makers and liquidity suppliers – banks and investment funds that fill the foreign exchange market with liquidity during imbalances. They can also act as transaction counterparties.
Each Fx market participant aims to make money on speculation or commissions. The goal of private traders is to predict the direction of the price and close the trade in time with as much profit as possible.
How Does Forex Trading Work?
Foreign exchange trading goes as follows:
- You need to open a trading account with a broker, usually in USD. Broker is an intermediary that allows individual traders to access the market;
- The broker provides current quotes – currency pair rates, stock prices, etc. A trader can buy an asset at the current market price to sell it later for more money, or sell, then buy at a lower price and close the trade. If the forecast was correct, the trader earns; if the price went in the opposite direction, they incur a loss;
- The broker sends the buy/sell offer to the liquidity provider or to the ECN system (electronic platform). If there is an opposite offer of this volume on the market, the trade is executed.
Let us look at an example of a Forex trade for beginners. The current price of the company A stock on the trading platform is 10 USD. The trader predicts that the stock price will go down to at least 7 USD. They open a short position with a volume of 100 stocks, which the broker lends to the trader. However, there are buyers on the market who are ready to only buy 40 shares at this price. There is also an offer to buy another 60 shares at the price of 9 USD. The broker offers this deal to the trader and asks if they agree. The trader agrees, the price falls down to 7 USD, they buy 100 shares at this price and give back what they owe to the broker. The buyers are at a loss, while the trader’s profit is 40 × 3 + 60 × 2 = 240 USD. If the price goes up, the trader will incur a loss, since they will need to buy the stocks at a higher price to repay the debt.
It works the same way with currency pairs. When opening a long position in the GBP/USD pair, the trader sells USD and buys GBP. If they open a short position, the British pounds are sold (the pounds are lent by the Forex broker for free) for the dollars with the expectation to buy cheaper pounds after the rate declines and repay the debt. The trader earns on the difference in the rates.
Uses of the Forex Markets
The main purpose of Forex trading is earning on speculation. The trader buys cheaper, sells more expensive. The order depends on the forecasted direction of the price.
Other opportunities for making money on Forex:
- hedging – a strategy of insuring risks using hedging tools. For example, opening opposite trades in the same pair or different pairs with high correlation, using forward contracts, derivative swaps, etc.;
- carry trade – earning on the difference in discount rates. The swap charged by the broker depends on the discount rates of the country issuing the currency. In some cases, swap can be accrued to the trader’s account;
- copy trading – copying trades of professional traders. With this method, it is important to understand risk management rules.
Active currency trading is not the only option for earning. For example, you can develop trading systems and sell advisors built on their basis. You can write educational posts on social media, develop an affiliate network, supply trading signals, etc.
Forex for Hedging
Hedging on Forex means insuring unprofitable trades. This trading method is used when the trade needs to be kept open on the market but the price is going in the direction opposite to the forecast. It can also be used during periods of high volatility, when it is not clear which way the rate is moving.
Hedging options:
- Full hedging – opening multidirectional trades of the same volume in the same instrument.
- opening two same-direction trades in instruments that move in opposite directions;
- opening multidirectional trades in instruments with direct correlation.
Hedging is often used for already open trades when you need to wait out temporary instability in the price.
Forex for Speculation
Speculative trade on Forex involves earning on the difference in currency rates. At different times, different fundamental factors can affect different assets.
For example, the cost of stocks is affected by publications of quarterly and annual reporting. If the financial results are better than the forecast, the stocks go up. The USD rate against other currencies is influenced by the changes in the discount rate and employment data. If the rate goes up, and unemployment goes down, the dollar will grow. The AUD rate is influenced by natural disasters. Due to fires in Australia, exports are lower, so the Australian dollar becomes cheaper, and the USD goes up.
Forex trader needs to:
- identify as many fundamental factors affecting the value of the asset at the moment as possible;
- determine how and how strongly each of them affects the rate;
- highlight the most influential factors, compare with the existing forecast and make your own.
The accuracy of the forecast depends on the accuracy of your assessment of fundamental factors.
Important Terms You Need to Know to Trade Forex
Before opening an account with a broker, a Forex trader should study the trade conditions and read the offer. The offer is an agreement that the trader accepts automatically when opening an account. Each broker has specific features that you need to know about.
The problem is that the offer is usually hard to read because it is full of specialized terms. Without knowing the terms, it is impossible to understand the intricacies of the agreement, which makes it impossible to train and trade.
Spot Forex
Spot is a form of calculations between counterparties in which the trade is executed immediately at the current price. On Forex, the term “spot” means:
- with a deposit of 100 USD, the trading platform indicates the current price at 1 EUR = 1.20 USD;
- the trade volume is 1 EUR;
- pressing the “Buy” button instantly opens a position, which means that 1 EUR was bought for 1.20 USD;
- the EUR is then sold in a similar way – instantly and at the current closing price.
The volume of Forex trades is calculated in lots, but this is a simplified example for easier understanding. On the stock market, spot is an operation in which payment takes place immediately, and the delivery of the goods happens on a pr -agreed date. On exchanges, the date can be calculated as T+0, T+1, T+2, where T is the date of the spot transaction and the number means the number of days after it.
CFDs
CFD is the best Forex trading instrument for beginners. It is a contract for price difference that allows you to earn on the instrument without actually owning the underlying asset.
For example, a trader opens a trade to buy XAU/USD at a price of 1,900 USD, and the broker records the opening price of the trade. The trader however does not become the actual owner of the gold. The price then rises to 1,920 USD, the trader closes the trade and gets the price difference – 20 USD – as profit.
There is a nuance called dividend adjustment that should be taken into account when trading stock CFDs. When actually buying a stock, the owner usually receives dividends. In the case of CFD trading, the dividend amount can be either added or subtracted from the trading account balance, depending on the direction of the open position.
Pip & Point
Different sources give various definitions of point and pip, which may cause confusion. Let’s try to figure it out.
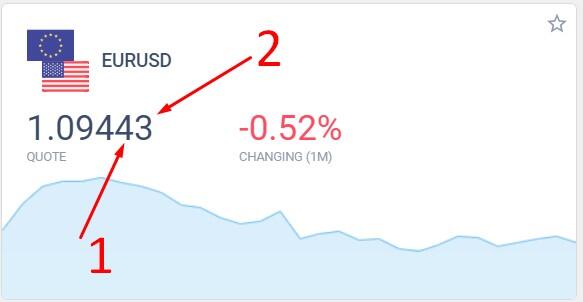
A point is the minimum price change value. Currency pair quotes used to be presented in a four-digit format, and a point was the fourth digit after the decimal point. For example, if the price changed from 1.2345 to 1.2346, the change was 1 point. Then five-digit quotes were introduced, and it caused several options for point and pip definitions:
- point and pip are the same thing: the minimum price change, i.e. the fifth digit after the decimal point;
- a pip is the minimum price change- the fifth digit after the decimal point. A point is the fourth digit after the decimal point. 1 point = 10 pips.
1 – point (the number 4), 2 – pip (the number 3).
Almost all currency pairs have five-digit quotes. USD/JPY quotes have three digits, so the point here is the second digit and the pip is the third.
Important! To eliminate possible errors, look for the definition of the point in your broker’s offer and other documents. In addition, please note that in the descriptions of many strategies, a point is the fourth decimal place; five-digit quotes are not considered.
Spread
Spread is the difference between the buy and sell price of an asset. The trading platform always provides two quotes: buy and sell. If you subtract the sell price from the buy price, you get your spread. This difference is retained by the trading system as a fee for the transaction. It is displayed as a negative value immediately after opening a position. The trader’s goal is to make a profit that at least covers the cost of the spread.
1.09486 – 1.09443 = 43, which means the spread was 4.3 points.
Trading for beginners. What you need to know about spread:
- spread can be fixed or floating. Floating spread depends on the liquidity and volatility of the market. For example, if news comes out, which causes a wave of interest for the asset, its spread widens sharply due to the imbalance of buyers and sellers;
- exotic currency pairs have wider spread, while instruments with high liquidity have narrower spread;
- spread is formed by the liquidity provider, and the broker includes markup in it. In the trading terminal, the trader sees the full amount of the commission.
- spread is indicated in points. Its amount in the deposit currency can be calculated by knowing the value of one point.
Margin
Margin is the part of the funds on the trading account that is frozen by the broker as collateral for the opened trade. For example, with a deposit of 100 USD, a trader opens a trade with a volume of 10 USD. With a leverage of 1:1, the frozen margin will be 10 USD. This money remains on the account until the trade is closed. However, it cannot be used to open other positions. If the leverage is 1:10, the margin for the same trade volume is 10 times lower at 1 USD.
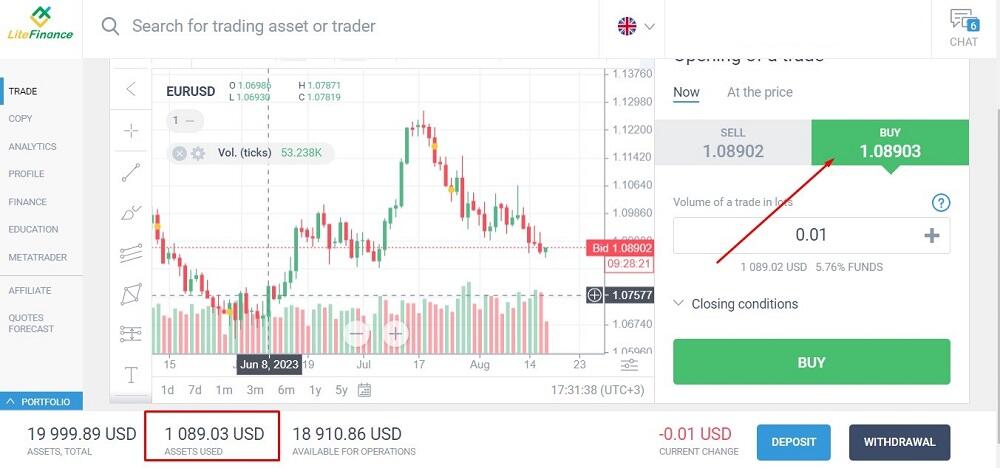
Example in Forex trading No. 1. Leverage -1:1. Trade volume – 0.01 lot.
1 full standard lot equals 100,000 base units. This means for 0.01 lots you need 100,000 × 0.01 × 1.08903 = 1,080.03 margin. The discrepancies in decimal places in the screenshot are due to price changes between the opening of the trade and the moment the screenshot was taken.
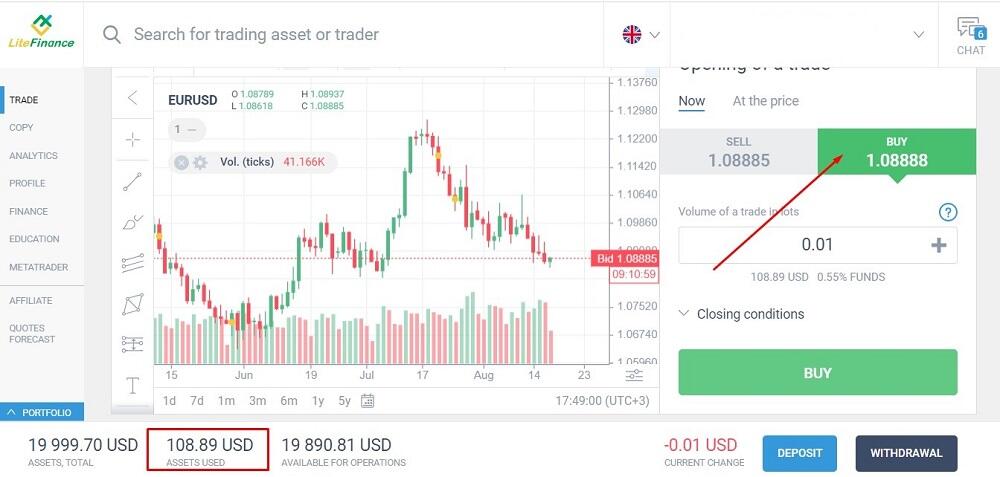
Example in Forex trading No. 2. Leverage – 1:10, trade volume – 0.01 lot.
The screenshot shows that the frozen amount of funds is 10 times lower. In the previous example 18,910.86 USD were available for later trading, but with leverage the margin decreased by 10 times and funds amounted to 19,890.81 USD.
Leverage
Leverage is funds lent to the trader by the broker. For example, if the deposit is 100 USD, with a leverage of 1:10 the trader has 1,000 USD at their disposal. Leverage can be used for two purposes:
- increasing the position volume if the price is moving in the desired direction, but you don’t have enough funds to open a position;
- reducing the broker’s collateral with the same position volume allows you to stay within your risk management requirements with a small deposit.
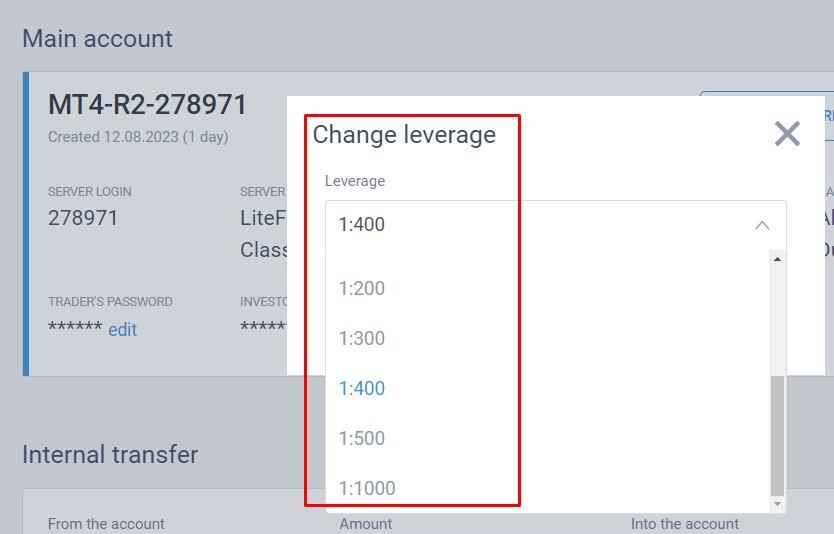
The leverage value for currency pairs is applied to the entire account. You can change it in your account settings.
Using leverage increases your risks. When using leverage to increase the trade volume, the point value automatically increases. For example, for the EUR/USD pair, with a trade of 0.01 lots, a price movement of 1 point will change the deposit by 10 cents. If the leverage is 1:100 and the trade volume is increased to 1 lot, 1 point will change the deposit by 10 USD. This applies not only to profit, but also to loss.
Bear Market
Bear market (or bearish market) is a market in which sellers, or “bears” in Forex slang, have a clear advantage. This means that the number of orders to sell an asset significantly exceeds the number of orders from buyers.
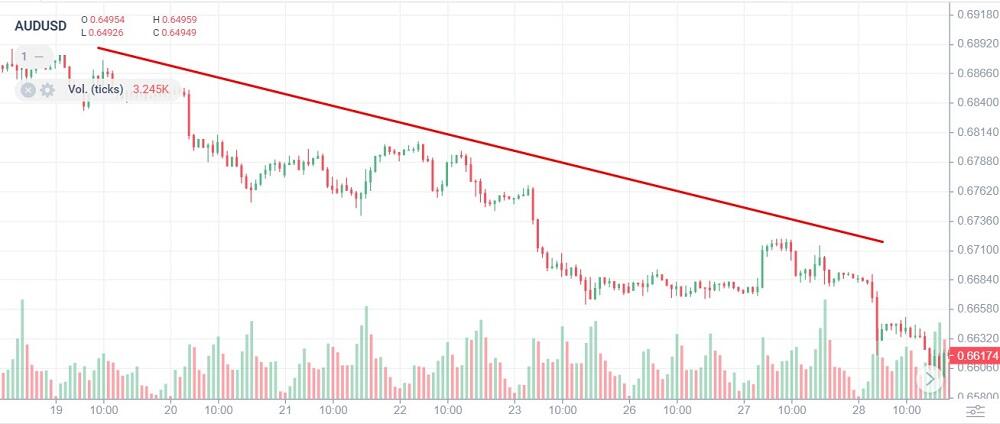
In charts, bearish market looks like a downward trend. It can be either temporary, which means it can be observed in short-term timeframes, or long-term – one can spot it in timeframes from D1 and higher.
Example of a bearish trend with several upward corrections.
Bull Market
Bull market, or bullish market, is a market in which buyers, or bulls, have a clear advantage. For example, traders start actively placing buy orders under the influence of some fundamental factor. The price goes up, which leads to an upward trend referred to as bullish market.
Example of a long-term bullish market for the USD/TRY pair showing the devaluation of the Turkish lira over several months.
Blue Chip Stocks
Blue chips are stocks of the companies leading in their sector of the global market. These are stocks of companies with consistent revenue that are more reliable during crises, have the largest capitalization in the industry and usually pay out dividends. Blue chips are often included in large stock indices, such as NASDAQ, Dow Jones, or S&P 500. For a trader, they are attractive due to their liquidity and growth prospects. High liquidity allows trading in large volumes without the danger of the spread widening unexpectedly.
Dividend
Dividends are part of the returns of a joint-stock company, which is distributed among shareholders in accordance with their share in the total capital of the company. Dividends are paid out by the decision of shareholders. The amount of dividends per share and the frequency of payouts are also determined by the meeting of shareholders. Information about the payment schedule is usually on any analytical portal.
Why dividends may be of interest to a trader:
- additional profit for actual owners of shares;
- dividend adjustment for CFD trading;
- trading system based on the “dividend gap” – a price gap that occurs after the record date.
Day Trading
Day trading on Forex means opening and closing trades within one day. Regardless of when the trade is opened, it is closed before the end of the trading day to avoid paying the swap.
Options for intraday strategies:
- scalping on M5-M15 intervals – high-frequency trading on Forex with trades only lasting for several minutes. Some sources classify scalping as a separate category of strategies;
- trend trading on Forex involves searching for stable trends on M30-H1 intervals. Positions are kept on the market for an average of 10-15 candlesticks;
- swing trading is trend trading during corrections.
Day trading is convenient because the trader has enough time to analyze the market and make decisions. In addition, they have the result within a few hours. With a strong trend, day trading can turn into position trading.
Close
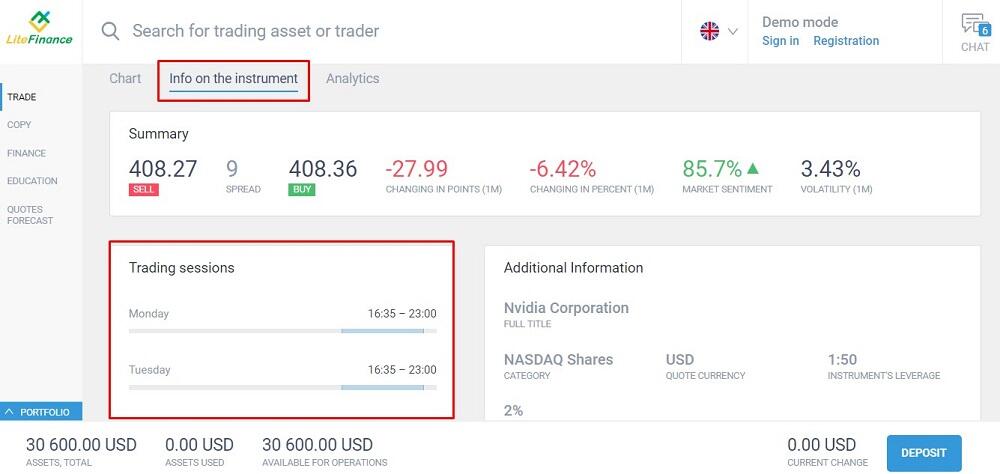
The Forex market operates around the clock on weekdays. The stock market has a clear schedule, which depends on the particular exchange where the trading takes place. Closing is the time when the exchange stops its operation and trading ceases. The information about the opening and closing times of trading sessions is available in the contract specification.
Exchange
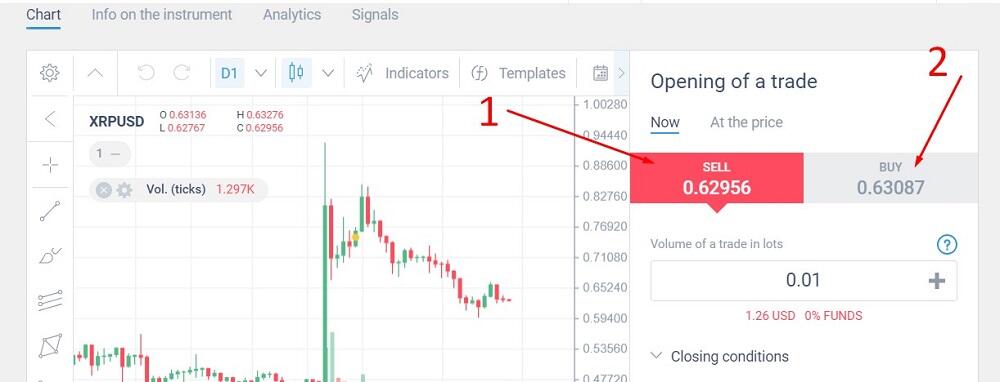
Trading platforms have two asset prices:
- Bid (sell) price is the demand price set by the buyer. It is always lower than the Ask price. This is the price at which you sell an asset by opening a short position;
- Ask (buy) price is the supply price set by the seller. It is always higher than the Bid price. This is the price at which you buy an asset by opening a long position.
1 — Bid (sell) price, 2 — Ask (buy) price.
Beginning Forex traders opening positions in the MetaTrader 4 trading terminal need to pay attention to one nuance: the developers changed the colors of the buy and sell buttons in the order window.
Users often match the color of the line in the chart with the color of the button, without paying attention to the caption. But then the red Ask price matches with the sell button, which is impossible. The sell price cannot be higher than the buy price. Please take this into account when using MT4, or use another platform such as LiteFinance.
Broker
Broker is an intermediary company that provides access to the financial exchange and over-the-counter markets to traders and investors.
Forex trading services provided by the broker:
- free trading platform, Forex trading without investments on a demo account;
- executing the trader’s orders, sending buy or sell orders to liquidity providers or the ECN system;
- providing leverage;
- copying trades of other Forex traders, social trading;
- free educational materials, video lessons, etc.;
- affiliate programs, getting a commission from the profits of referrals and sub-partners.
The broker’s commission is markup added to the spread, swap, and a fixed commission per each standard lot on ECN accounts.
Types of Currency Pairs
Currency pairs may differ from each other in the following ways:
- liquidity allows traders to open a position in a certain instrument at any time. In addition, liquid assets such as EUR/USD and GBP/USD have narrow spreads. Examples of currencies with low liquidity are the rand (South Africa) and the bolivar (Venezuela);
- volatility – a characteristic of the speed and range of price changes. For example, daily volatility of the USD/SGD pair is about 0.46%; for USD/JPY it’s 0.98%. High volatility pairs are suitable for scalping and channel strategies. Low volatility pairs are better suited for trading on stable trends;
- correlation: direct if the charts of the pairs are similar, and reverse if they mirror each other. Correlation can be used when searching for signals, since the response time to fundamental factors differs between currencies.
Investment tip. Use calculators to determine volatility and the strength of correlation. You can find them on analytical resources, for example, on Investing.
Major Currency Pairs
Major currency pairs are the main currency pairs that include the USD and one of the seven freely exchanged currencies. They account for 75% of the trading volume on the foreign exchange market. Their distinctive features include:
- high liquidity with moderate volatility;
- narrow spread with virtually no widening during news releases;
- easy access to information on the instrument, such as macroeconomic statistics of countries, news, etc.
| Currency pair |
Volatility, % |
| NZD/USD |
1.16 |
| AUD/USD |
1.11 |
| USD/JPY |
0.98 |
| GBP/USD |
0.83 |
| USD/CHF |
0.83 |
| EUR/USD |
0.73 |
| USD/CAD |
0.56 |
Volatility may change, but the table shows how its levels for different currency pairs correlate with each other.
Canadian, Australian and New Zealand dollars are commodity currencies, which to some extent simplifies the analysis of fundamental factors influencing their exchange rates.
Minor Currency Pairs
Minor currency pairs are cross rates of the major currencies, for example, the euro and the Canadian dollar or the Japanese yen and the Swiss franc. Cross currency pairs are considered more difficult to forecast since the indirect influence of the US dollar must be taken into account.
| Currency pair |
Volatility, % |
| GBP/JPY |
1.01 |
| CHF/JPY |
0.98 |
| GBP/NZD |
0.91 |
| EUR/CAD |
0.71 |
| AUD/NZD |
0.69 |
Minor pairs are well suited for correlation strategies. For example, the economies of Australia and New Zealand are closely intertwined due to their geographic proximity. In addition, the national currencies of both countries are classified as commodity currencies. The main fundamental factors influencing their exchange rate are exports and imports statistics, as well as prices for raw materials.
Exotic Currency Pairs
Exotic currency pairs include national currencies of developing and developed countries. They are characterized by manual control of their exchange rates, high inflation and political risks, and difficult forecasting due to a lack of statistics. Their main characteristics in Forex trading:
- low liquidity. It is quite easy to buy an exotic currency, but often you will only be able to sell it at a large discount. In other words, such pairs have a wide spread, which can expand more than twice under the influence of fundamental factors;
- high volatility, frequent deep drawdowns on trends.
| Currency pair |
Volatility, % |
| USD/ZAR |
1.49 |
| USD/SEK |
1.27 |
| USD/BRL |
1.14 |
What Are The Benefits of Forex Trading?
Forex trading for beginners has a number of advantages:
- low entry threshold. The minimum deposit is 50 USD. For comparison, the threshold for entering the stock market is at around 1,000 USD, taking into account all the commissions for transactions and mediation;
- low commissions. Due to the high liquidity of the market, Forex assets have a narrow spread;
- free leverage. For example, on cryptocurrency exchanges traders have to pay for leverage;
- ability to sell currency without actually owning it. Free loans from brokers;
- cent accounts that allow you to gain trading experience on the real market with virtually no risk;
- wide range of assets available for Forex trading, including currency pairs, cryptocurrencies, stocks, precious metals, etc.;
- ability to copy trades of professional traders. Most Forex brokers offer a social trading service for their clients: in order to copy trades, all you need to do is select a trader from the ranking, specify profitability and risk management parameters, and click “Copy”;
- Forex trading is available 24 hours a day on weekdays, since Forex is an over-the-counter market that operates around the clock, except holidays and weekends;
- negative balance protection prevents you from losing more funds than you have on your balance, unlike stock exchange, where litigation to collect debts from traders is quite common;
- Forex trading with the help of advisors. Automatic management of trades based on the selected algorithm.
Forex trading is accessible from anywhere in the world. By using a computer or mobile phone with Internet connection, a trader can monitor the market situation and open positions remotely. Successful trading is only possible with skills and experience.
What Are The Risks Associated with Forex Trading?
Risks associated with Forex trading:
- risk of a sharp increase in volatility. To minimize losses from unexpected price fluctuations, always set a stop loss. The position will close automatically when the price reaches the stop loss level;
- risk of loss due to the use of leverage. The desire to increase the trade volume of despite risk management directions can result in a loss;
- fundamental factor risk. This risk is due to the possibility of news releases that subvert the expectations of the majority. The price reverses, an imbalance appears on the market, the spread grows, and slippage occurs;
- risk of analysis error. It is difficult to take into account all the factors that influence the price of an asset, as well as to adequately assess the value of each of them;
- technical risk: redrawing of indicators, gaps in quotes that distort test results, internet shutdown;
- financial risk, the risk of third parties gaining access to the account. Passwords are usually stolen through viruses, keyloggers, and phishing links;
- emotional risk – the risk of making a mistake due to an emotional reaction;
- force majeure is a sudden event that can affect market movements.
It is impossible to completely eliminate all risks. The most effective methods of risk mitigation are using stop loss, following the risk management rules, diversification by investing in different asset classes, and emotional control. Beginners should not trade on Forex during important news releases due to possible increases in volatility.
How To Trade Forex For Beginners
Forex trading for beginners. Algorithm for a beginner Forex trader.
Preliminary stage:
- learn the basics. Find answers to the following basic questions: what is Forex? How does the market work? What can you buy and sell on Forex? Who are the main market participants? Make sure you understand the basic principles and instruments;
- move on from the basics to a more in-depth understanding of trading theory. Learn technical and fundamental analysis tools, auxiliary tools (screeners, trader calculators, MyFxBook, CoinMarketCap). Learn the risk management rules.
- move from theory to practice. Learn the types of Forex trading strategies and practice your knowledge by trading on a demo account.
Main stage:
- develop a trading plan. It should include a trading system, price forecasting methods, and an emergency algorithm. The plan must have a goal and implementation steps with verification of intermediate results at each step;
- select a trading strategy and analysis tools. For example, strategies adapted to your Forex trading model, original trading systems, etc.;
- test the strategies. The trading system must be perfected using the history of quotes. Select the best settings that would give optimal profitability with the lowest risk level. Examples of testers: MT4, Fx Blue, Forex Simulator;
- switch to a live account. But first, perfect your strategy on at least 100-200 trades on a demo account. If there is a deviation from the test results, stop and look for the reasons.
- Always consider potential risks and manage your emotions.
How To Read Forex Charts For Beginners
Almost all platforms offer three chart options: line, candlestick and bar charts. There are also tic-tac-toe, Heikin Ashi, Renko charts, which differ from the standard charts in price calculation. You can add them using a script, if supported by the platform.
You can trade on several charts at the same time. For example, classic candlesticks and Heikin Ashi are a good combination due to the different price calculation approaches.
Line charts
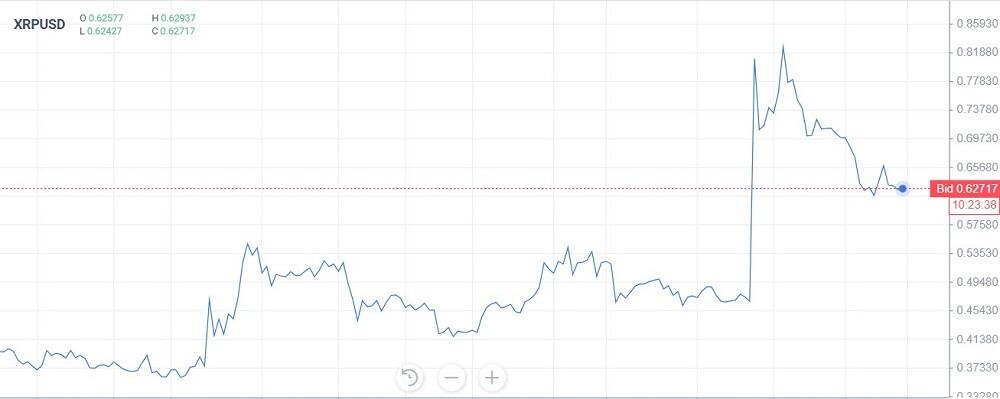
Line chart is a chart that displays the price as a solid line connecting the closing prices of time frames. For example, if the H1 timeframe is selected, the line connects the last prices of each hour.
The line chart is visually convenient, especially when intersections of prices and moving averages are used as signals. However, a line chart is considered to contain little useful information.
OHLC bar charts
Bar chart consists of vertical lines with small appendices at the top and bottom. The vertical line is the price movement for the selected timeframe. The line on the left is the opening price, and the line on the right is the closing price. If the closing price is higher than the opening price, the vertical line is green representing a rising bar. If it is lower and the line is red, it is a falling bar.
The chart displays all four price types. It is rarely used since it is visually less convenient than candlestick charts.
Candlestick charts
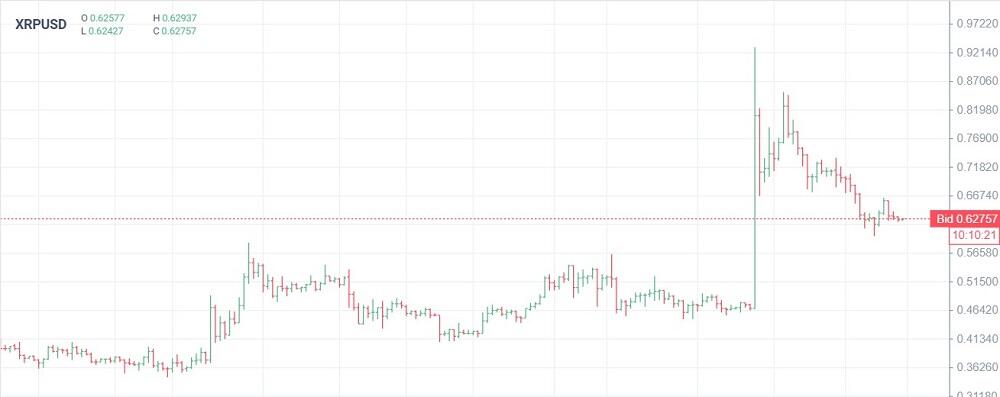
Candlestick chart is a chart displaying the price in the form of a candle body with so-called “shadows”. The body is formed by the opening and closing prices of the timeframe. For example, for H1 this is the price at the beginning and end of one hour. If the price closes below the opening price, the body of the candle is red. If it closes above, it is green. Shadows are the high and low price values within the timeframe, for example, an hour.
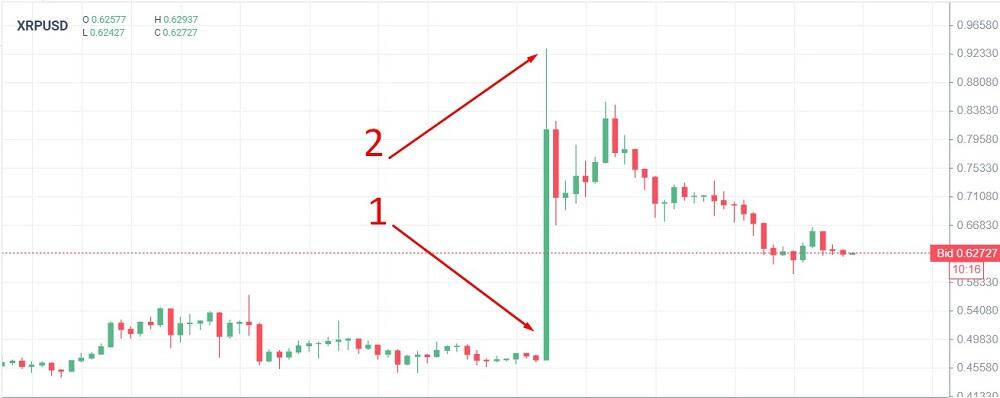
In the example above, the Ripple cryptocurrency rose sharply after a court ruled in its favor in a proceeding against the US Securities and Exchange Commission (SEC). The regulator believed that XRP is a security, therefore the issuing of coins is a violation of the US stock laws. The court decided otherwise, so the price exceeded 0.9 USD within one day (the number 2). Then traders decided that this price was comfortable enough to close trades, and sales began. After that the price rolled back to 0.8 USD. At the end of the day, the body of the candle was formed (the number 1).
Forex Trading Strategies For Beginners
A trading strategy is the trader’s general vision for opening and closing trades. It serves as the basis of a trading system – a detailed algorithm that takes into account risk management, the results of testing on the history of quotes, emergency algorithm, and emotion management. A strategy is a general recommendation; the system is developed individually.
Breakout
In addition to upward and downward trends, the market can also experience a flat – a horizontal price movement. It appears in the following cases:
- temporary pause in the trend movement – currency traders are assessing the situation, and the price may reverse or continue moving;
- calm before news releases/holidays/weekends – volatility increases sharply after news releases, and a trend change may occur.
A strategy that involves opening a trade at the moment of a breakout of the boundaries of the flat area towards the emerging trend is called breakout trading.
When the price breaks through the border of a flat channel but returns to it, the breakout is false. The following factors will help you filter out false signals:
- size of the candlestick body. Candles in a flat usually have small bodies and shadows. Trading volumes are small, there are relatively few trades, so the price barely deviates from the average value. A sharp increase in the body and shadow of the candle during a breakout signals the beginning of a trend;
- patterns. For example, the triangle pattern can show a potential breakout moment – the price approaching the corner;
- fundamental factors. The breakout is accompanied by news that reasonably explains it.
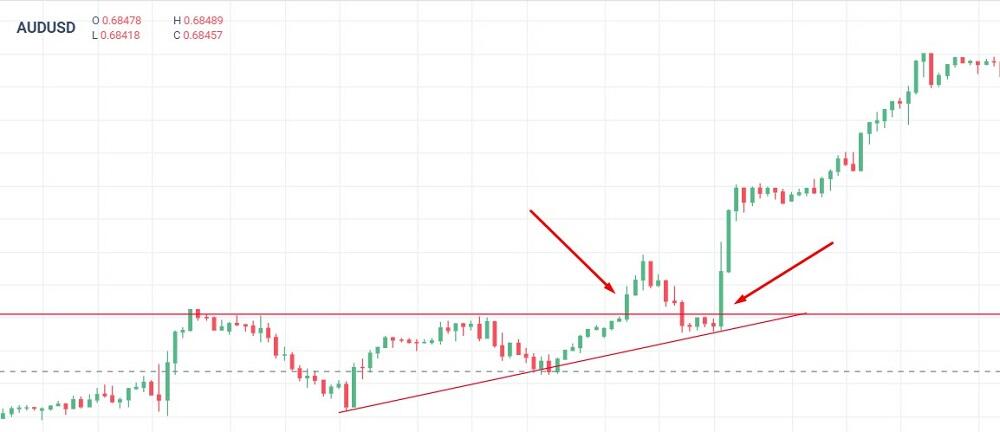
Example. In the hourly interval, an almost perfect triangle pattern has been formed. The candles in the triangle are small; a flat is obvious. The first breakout is accompanied by small candles and, although the breakout candle is larger than the previous ones, the price reverses into the triangle. To insure against false breakouts, use a stop loss.
Then the price again pushes off the support level in the corner of the triangle and breaks through the resistance level with a large growing candle. On the next candle you can open a long position.
Moving Average Cross
The idea of moving averages (MA) crossing and the location of prices relative to them is used in many simple strategies:
- a moving average with a long period is slow, reacts late to the current short-term price changes, but shows the long-term trend better;
- a moving average with a short period is fast, almost instantly changes its direction with the current price change. It can be used to track short-term impulses.
Signal: the fast moving average crosses the slow moving average. It is desirable that both MAs have the same direction. If the fast MA crosses the slow one from the bottom up, the price is higher than the moving averages and is directed upward – the trend is upward. If it crosses from the top down, the price is below the moving averages and is directed downwards – the trend is downward.
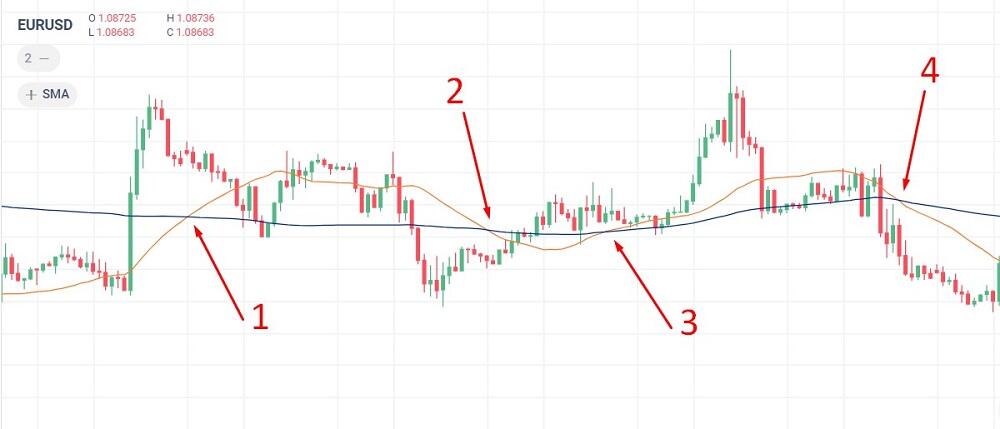
The fast MA (24) is orange, the slow MA (120) is blue. Timeframe – H1.
- 1 – no signal. With the fast MA moving upward, the price direction is down;
- 2 – no signal. The fast MA and the price have different directions;
- 3 – weak signal. You can open a trade only when the fast MA and the price go up;
- 4 – strong signal. The fast MA and the price are pointing down. The horizontal direction of the slow MA is allowed.
It is recommended to use additional filters. You can select the MA settings individually for each currency pair. Instead of simple moving averages, you can use exponential MAs.
Donchian Channels
Donchian channels is a channel indicator that forms the boundaries of the average price movement range relative to its average value for the period specified in the settings. The higher the volatility, the wider the channel.
The indicator shows the high and low price values for the selected period. Unlike other channel indicators, here the channel boundaries follow the price. Therefore, the recommendation “to open a trade when the channel breaks out” does not work, since there is no breakout.
The idea behind the strategy is as follows:
- both channel lines are horizontal – the highs and lows do not change, there is no obvious trend movement on the market;
- the upper line goes up while the lower line is horizontal – with a constant low, the highs begin to update, and an upward trend emerges;
- the lower line goes down while the upper line is horizontal – with a constant high, the lows begin to update, and a downward trend emerges.
Confirmation signal: if the second line also begins to move towards the first, you can open a trade.
This is not a basic indicator. If the platform you use does not have it, add it manually. Copy the indicator to the platform via the menu “File” → “Open data catalog” to the MQL4/Indicators folder. After adding, reboot the platform.
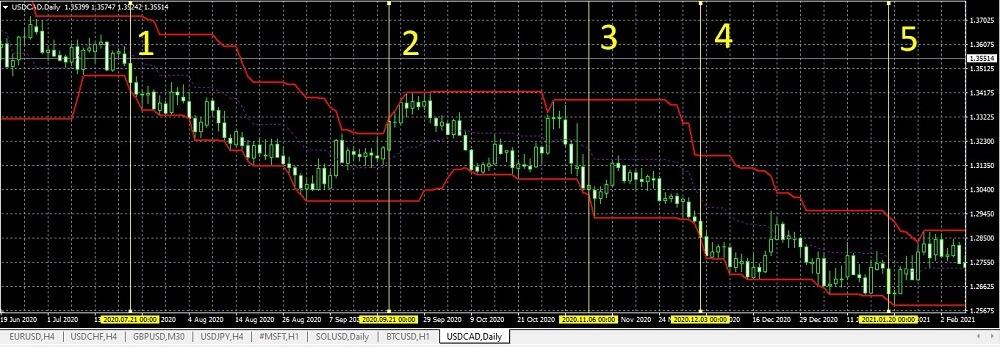
Example. The period is 20 days in a daily interval. It is specified in the settings.
- 1 – working signal. The lower line of the channel begins to move downwards, and after a few candles the upper line follows it;
- 2 – no confirmation signal. When the lower line begins to rise after the upper one, the upper one is already horizontal;
- 3 – no confirmation signal. The upper line remains horizontal;
- 4 – weak signal. The upper line began to move down earlier – this is a signal of the beginning of a downward trend. In this case, the downward movement of the lower line will be a confirmation signal;
- 5 – false signal. The channel boundaries are directed downwards, the price is going up.
Donchian channels are not really a strategy but rather an idea for a trading system. In this version, 50% of the signals are either false or weak. You need to select individual settings for each asset and add additional filters – levels, oscillators, etc.
Tips For Forex Trading Beginners
The best piece of advice is to say goodbye to the illusion that you can get rich quick and easy on Forex. And remember, when one person makes a profit on the financial market, another suffers a loss.
Some basic recommendations for beginners:
- don’t rush to make a deposit, practice on a demo account first. You can move on to a live Forex trading account when you are certain that your trading system brings stable profit. It is believed that you should have at least 100 successful trades;
- stick to the algorithm. You must understand how to open trades, how to exit the market, and how to react to force majeure. You must have a goal and a clear idea of how to achieve it. Chaotic opening of trades is doomed to failure;
- follow the risk management rules. Sometimes you can take risks in order to get more income. But you need to understand these rules perfectly in order to know when to break them. In addition, this requires extensive trading experience;
- manage your emotions. One of the common mistakes is neglecting the trading system and being led by emotions. Rash emotional actions inevitably lead to losses.
In 99% of cases, the loss of capital is caused by the trader’s mistake rather than the broker or analyst. Check the information, carefully read the offer and the list of trading conditions, and follow the risk management rules. Remember that only you are responsible for your actions.
Know The Markets
When trading on the foreign exchange, stock and commodity markets, you need to understand their operation well:
- what fundamental factors influence the EUR/USD rate, the cost of BTC or oil futures;
- what is the volatility level of an asset over short- and long-term intervals;
- which assets have a strong direct and inverse correlation with your instrument of choice. This will help you keep track of the preliminary signals. For example, if wheat becomes more expensive, corn will also begin to rise.
You also need to follow the news of the market in which you want to work. For example, if you trade cryptocurrency, you don’t need to follow OPEC’s decisions on oil production, but you should have a crypto newsfeed on hand.
Make a Plan And Stick To It
Your plan is a trading system or strategy that takes you step by step closer to your goal. It must answer the following questions:
- what do you want to achieve and how soon? For example, “have a stable income of 10% per month” or “double my deposit in 6 months”;
- how do you plan to achieve this? Using your own strategy, copying trades from a professional trader or buying and holding an asset;
- how does your trading system work and what results does it show? Which signals are main and which are for confirmation? What is the risk level per trade? How do you exit the market?
- and most importantly, what do you do in case of force majeure?
Practice
There is no point in learning theory if you do not put the acquired knowledge to practice. The theory provides a basis, but does not prepare you for all possible developments. Only by experiencing the real market and testing indicators will you develop the necessary skills to trade successfully.
Tips:
- once you’ve learned the basics of an indicator, immediately try it out on a demo account;
- once you’ve become comfortable with a strategy, perfect it until you reach a stable profit. If the strategy doesn’t work, change it and practice the new one;
- feel free to ask questions on trading forums. Many professional traders are happy to help beginners;
- keep a trader’s journal. This is software that keeps a log of your actions, with the option to group data and display results in the form of sortable tables, charts, and histograms.
Forecast The “Weather Conditions” of The Market
How to assess the state of the market in relation to the selected asset:
- look at the current trend. Which direction did the price move with the opening of a new session? Which direction is the trend going in a long-term timeframe (H4, D1)?
- are there any trend reversal or continuation patterns forming? Can you draw support and resistance levels and trend lines? Are supply and demand zones visible?
- what news has come out at the moment and will be released in the near future in accordance with the economic calendar? Assess the market sentiment.
Combine technical, graphic and fundamental analysis tools to create a successful forecast.
Know Your Limits
Determine how much you are willing to lose on one trade. What is the largest stop loss you can set taking into account the value of a point? What is the largest volume of all open trades taking into account the value of a point?
Even if it seems that the trend is stable and you can increase the volume of a position, do not do this if it violates the rules of risk management. The same applies to Martingale: the level of acceptable risk must be determined when you are drawing up a plan and developing a trading system.
Know Where To Stop Along The Way
You cannot stay glued to the monitor – it’s exhausting and takes too much time. But hoping for a perpetual trend movement is a mistake too:
- use pending orders, stop loss and take profit. A stop loss order limits the potential loss, and a take profit order closes the trade with a profit when the specified price level is reached;
- use a trailing stop. This is a dynamic stop loss that follows the price in the direction of your forecast and stops if the price reverses. It is available on most trading platforms;
- use the tactic of partially closing a position. For example, your target is 20 USD per trade. The cost of a point is 1 USD (for the EUR/USD pair this corresponds to a trade volume of 0.1 lot). As soon as the price passes 20 points, close 50% of the trade and insure the remaining 50% with a trailing stop at a distance of 10 points.
Try to make the most of the trend movement but with minimal risk. A trailing stop is the best solution for this.
Check Your Emotions At The Door
Your emotional state indirectly affects your results, and sometimes this can cause problems:
- fear of decision-making and FOMO;
- greed, the desire to get rich right now;
- anger, irritation. Possible reasons: the market is going in the wrong direction, you missed a good moment, the trade brought a loss, and so on;
- despair – you are watching your deposit melt away but still hoping for the best, although you just need to close the trade;
- absent-mindedness, fatigue. Often appears when you are continuously monitoring the charts. Such a state worsens your reaction and clarity of thinking;
- following the crowd, making rash decisions to join the majority;
- joy, euphoria, and the desire to repeat the success can dim your sense of risk.
There is only one rule – keep your composure, manage your emotions, follow your action plan. This is the only way you can achieve success. If you feel that your emotions are getting out of control, take a break and change your environment.
Keep It Slow And Steady
Speed matters in scalping, where trades are kept in the market for only a few minutes. Intraday strategies involve closing the trade before the end of the day, which allows you to save on swap. In this case it is enough to take advantage of price movements of 5-8 candles.
In the H1 timeframe, a trading day consists of 24 candles, each of which corresponds to one hour. When a signal appears on one of them, the trader has a whole hour to decide whether to open a trade on the next candle or wait it out.
Don’t Be Afraid To Explore
A professional trader learns every day. Strive to learn something new every day:
- perfect your skills on different trading instruments, develop new ideas, feel free to discuss them with other traders;
- don’t be afraid to experiment if it’s within your risk management;
- make changes to the trading plan if necessary. Your goals may change as they are achieved.
Try not only to gain new knowledge, but also to develop an intuitive understanding of the market.
Conclusion
What a beginner trader needs to know about Forex:
- Forex is a market where you can make money on currency price differences. The more accurate your forecast of the price change, the greater the profit;
- the key to success is knowledge, constant practice, trying strategies on a demo account and in a tester, following risk management rules, and managing emotions;
- Before opening a trade on a real account, you need to understand the principles of trading, know the terms, have basic skills in working with the trading platform and have a clear action plan;
- Your action plan should answer the questions: what are the goals and how much time do you have to achieve them? What instruments will be used? What to expect from the trading system? What are the risks? What to do in case of force majeure?
- Your trading system must answer the questions: how, when and based on what principle do you open trades? How do you close them? Which signals are main and which are additional?
Believe in your abilities, strive to learn something new, follow the plan and do not give up because of temporary setbacks.













 Chat now!