Oil Prices Forecast: Weaker Amid Israel-Hamas Diplomacy, Eased Supply Concerns

Oil Prices Forecast: Weaker Amid Israel-Hamas Diplomacy, Eased Supply Concerns

Oil Markets Respond to Israel-Hamas Conflict and Global Supply Factors

Oil prices took a dip on Monday, swayed by hopes of de-escalation in the Israel-Hamas conflict and softened supply pressure. Brent crude futures declined to $91.24 a barrel, while U.S. West Texas Intermediate (WTI) dropped to $87.00. Just a week prior, both benchmarks had risen over 1% due to fears that the conflict could potentially escalate, affecting the world’s largest oil-producing region.

Diplomacy Influences Oil Markets

Over the weekend, diplomatic initiatives aimed at mitigating the Israel-Hamas conflict intensified, particularly with aid convoys entering Gaza from Egypt. Market sentiment also took a hopeful turn as Israel paused a planned ground incursion into northern Gaza for hostage negotiations. These developments have helped reduce the conflict’s risk premium on oil prices.

Trading Derivatives carries a high level of risk to your capital and you should only trade with money you can afford to lose. Trading Derivatives may not be suitable for all investors, so please ensure that you fully understand the risks involved, and seek independent advice if necessary. A Product Disclosure Statement (PDS) can be obtained either from this website or on request from our offices and should be considered before entering into a transaction with us. Raw Spread accounts offer spreads from 0.0 pips with a commission charge of USD $3.50 per 100k traded. Standard account offer spreads from 1 pips with no additional commission charges. Spreads on CFD indices start at 0.4 points. The information on this site is not directed at residents in any country or jurisdiction where such distribution or use would be contrary to local law or regulation.

Supply Pressures Easing

The supply equation is also shifting. The U.S. has lifted sanctions on Venezuela, an OPEC member, following a government deal with the Venezuelan opposition. This move could alleviate the tightness in the oil supply market, which has been exacerbated by OPEC and Russian production cuts.

China’s Role in Global Oil Dynamics

In a separate development, Chinese refiners dipped into their crude stockpiles for September, drawing about 240,000 barrels per day, according to Clyde Russell from Reuters. China, the world’s largest crude importer, appears to be trimming back on expensive imports in response to the oil price rally that began in July. Diesel exports from China have also been strong, as refiners capitalize on high Asian transport fuel margins.

Short-term Outlook: Bearish

With diplomatic efforts gaining momentum and supply constraints easing, the short-term outlook for oil appears bearish. The market seems to be adjusting to these geopolitical and supply chain developments, leading to a pullback in oil prices.

Technical Analysis
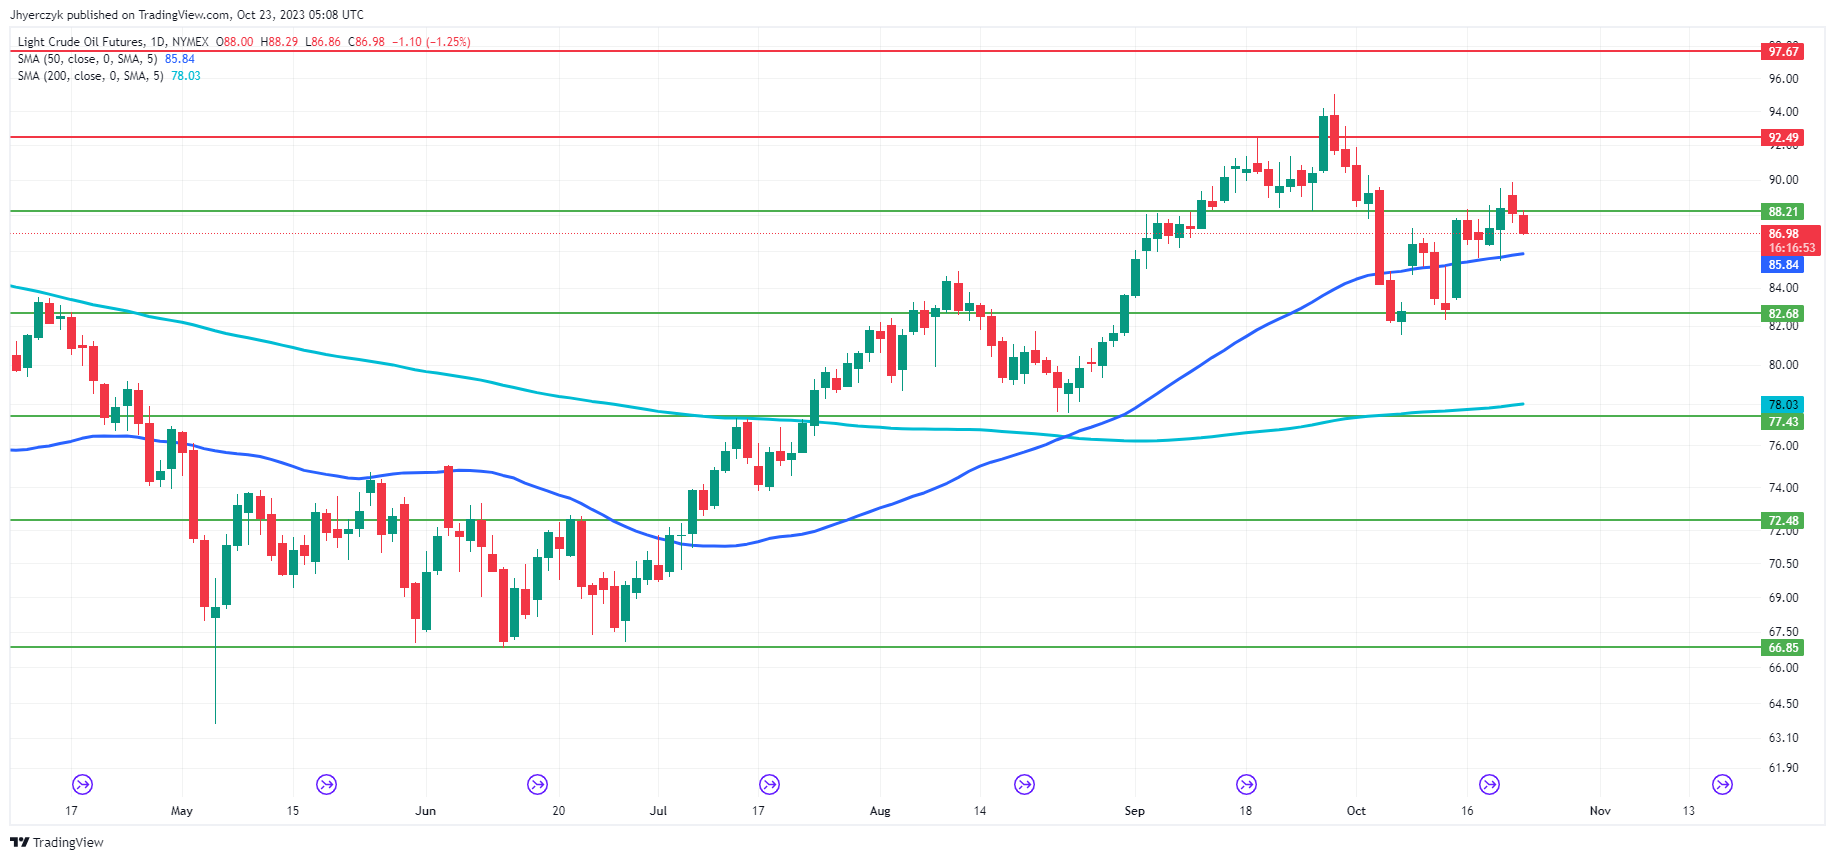
Daily Light Crude Oil FuturesThe current daily price of light crude oil futures is $87.01. This price is above the 200-day moving average of $78.03 but also above the 50-day moving average of $85.84. In other words, the asset is trading above both its longer-term and shorter-term averages.

Main support stands at $82.68, while minor support is at $88.21; both are below the current price. Conversely, minor and main resistance levels are at $92.49 and $97.67, respectively, above the current price.

With these factors considered, the market sentiment is trending higher. However, a failure to hold the 50-day moving average could shift momentum to the downside.

Gold Price Slips After Stellar Rally Despite Lofty Treasury Yields. Higher XAU/USD?

Gold Price Slips After Stellar Rally Despite Lofty Treasury Yields. Higher XAU/USD?

The gold price eased to start the week after posting solid gains on perceived haven flows outweighing the higher yields on government bonds across most of the globe.

While the geopolitical situation in the Middle East assisted in undermining growth and risk-orientated assets such as equities, parts of the fundamental macroeconomic backdrop could have also played a role in the precious metal’s rally.

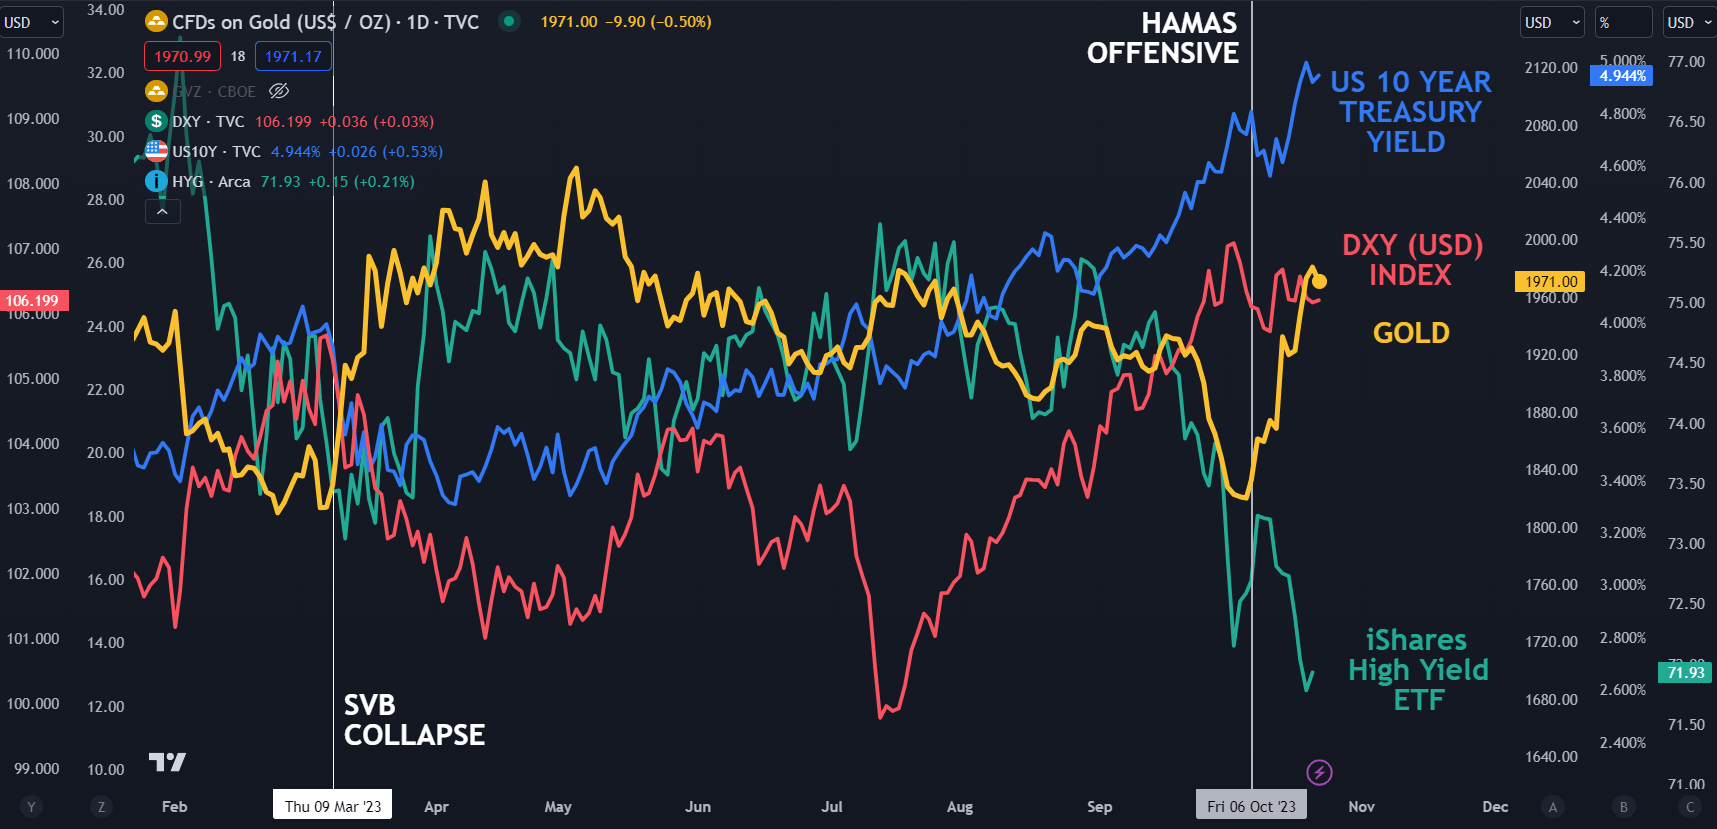
Using the iShares iBoxx High Yield Corporate Bond Fund Exchange Traded Fund (ETF) as a proxy for credit, we can see the deterioration in the outlook for corporate bonds.

The ETF has fallen to levels that were seen in the aftermath of the Silicon Valley Bank collapse. The squeeze on credit also saw Wall Street equity indices take a bath and the lift in risks for other assets may have contributed to the benefit of the gold price.

Unfortunately, the situation in the Middle East does not appear likely to find a peaceful resolution anytime soon and this might keep the bid tone for the yellow metal for now despite higher Treasury yields.

The monetary policy-sensitive 2-year Treasury note traded at 5.25% last Thursday for the first time since 2006 before collapsing toward 5.10% to close out the week.

Similarly, the benchmark 10-year note traded at its highest level since 2007, nudging over 5.0% before retreating to around 4.95%.

Looking at the chart below, the elevated 10-year Treasury yields and DXY (USD) index are yet to impact the gold price, but it might be worth watching should those markets move abruptly.

It’s possible that the sell-off in the iShares high-yield ETF could have broader implications for equities as debt financing becomes more expensive for companies.

SPOT GOLD, DXY (USD) INDEX, US 10-YEAR TREASURY AND iShares iBoxx HIGH YIELD ETF

image1.png

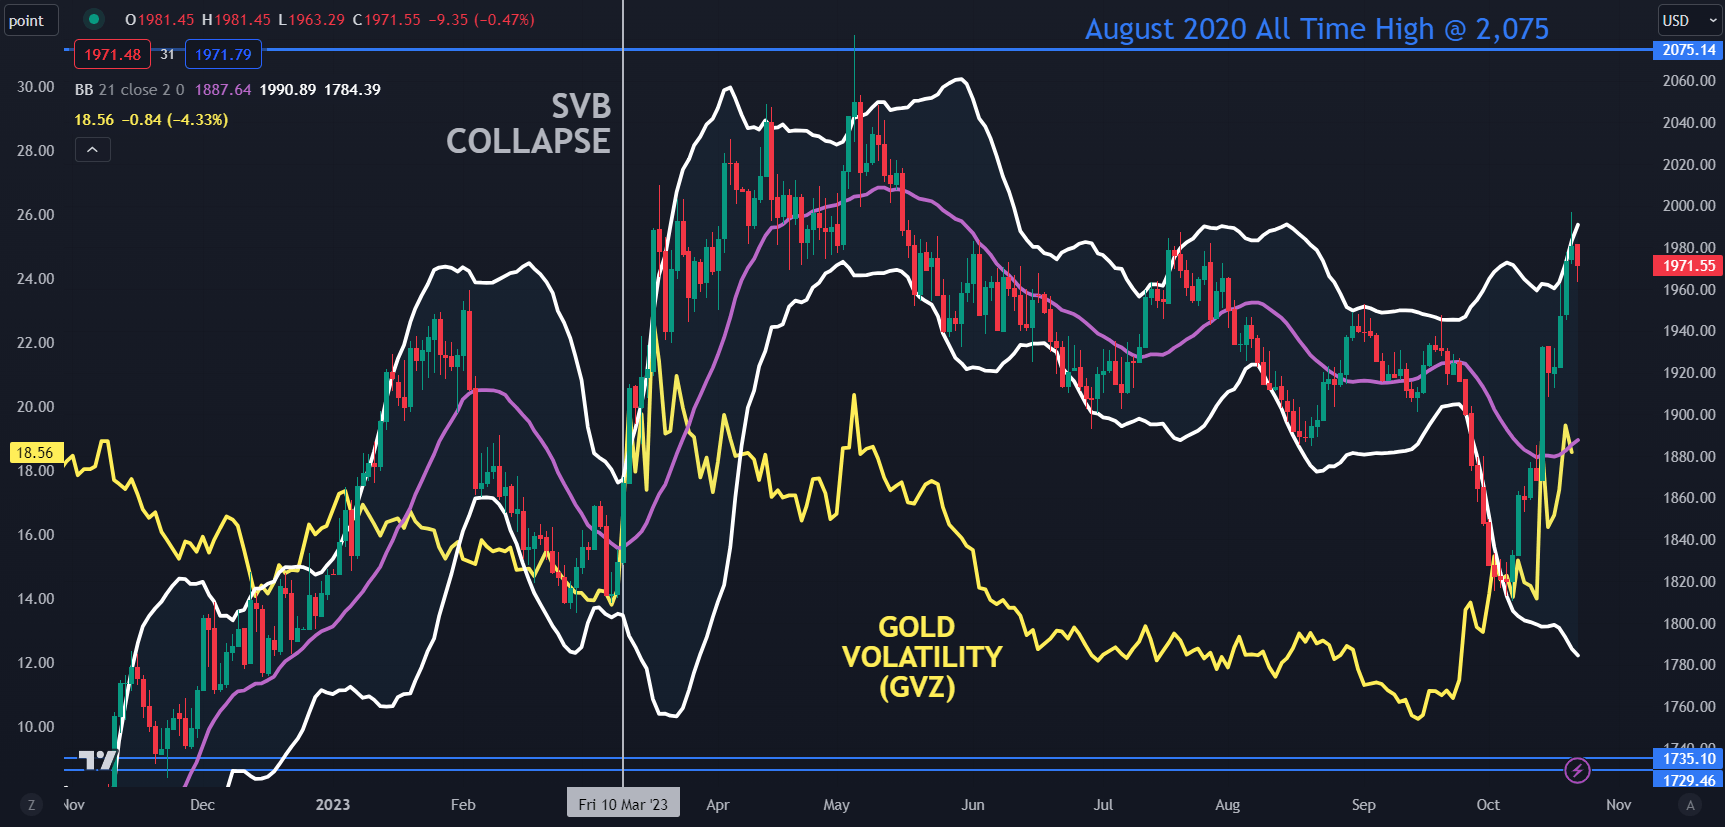
All this price action across markets has seen gold volatility tick higher as measured by the GVZ index. The GVZ index measures implied volatility in the gold price in a similar way that the VIX index gauges volatility in the S&P 500.

At the same time, the width of the 21-day simple moving average (SMA) based Bollinger Bands. has expanded. The Bolling Bands represent historical volatility. To learn more about trading Bollinger Bands, click on the banner.

SPOT GOLD, BOLLINGER BANDS AND GVZ INDEX

image2.png


Crude Oil Correction in Play; Natural Gas’ Rebound May Not be Over

Crude Oil Correction in Play; Natural Gas’ Rebound May Not be Over

Crude Oil: Correction still in force

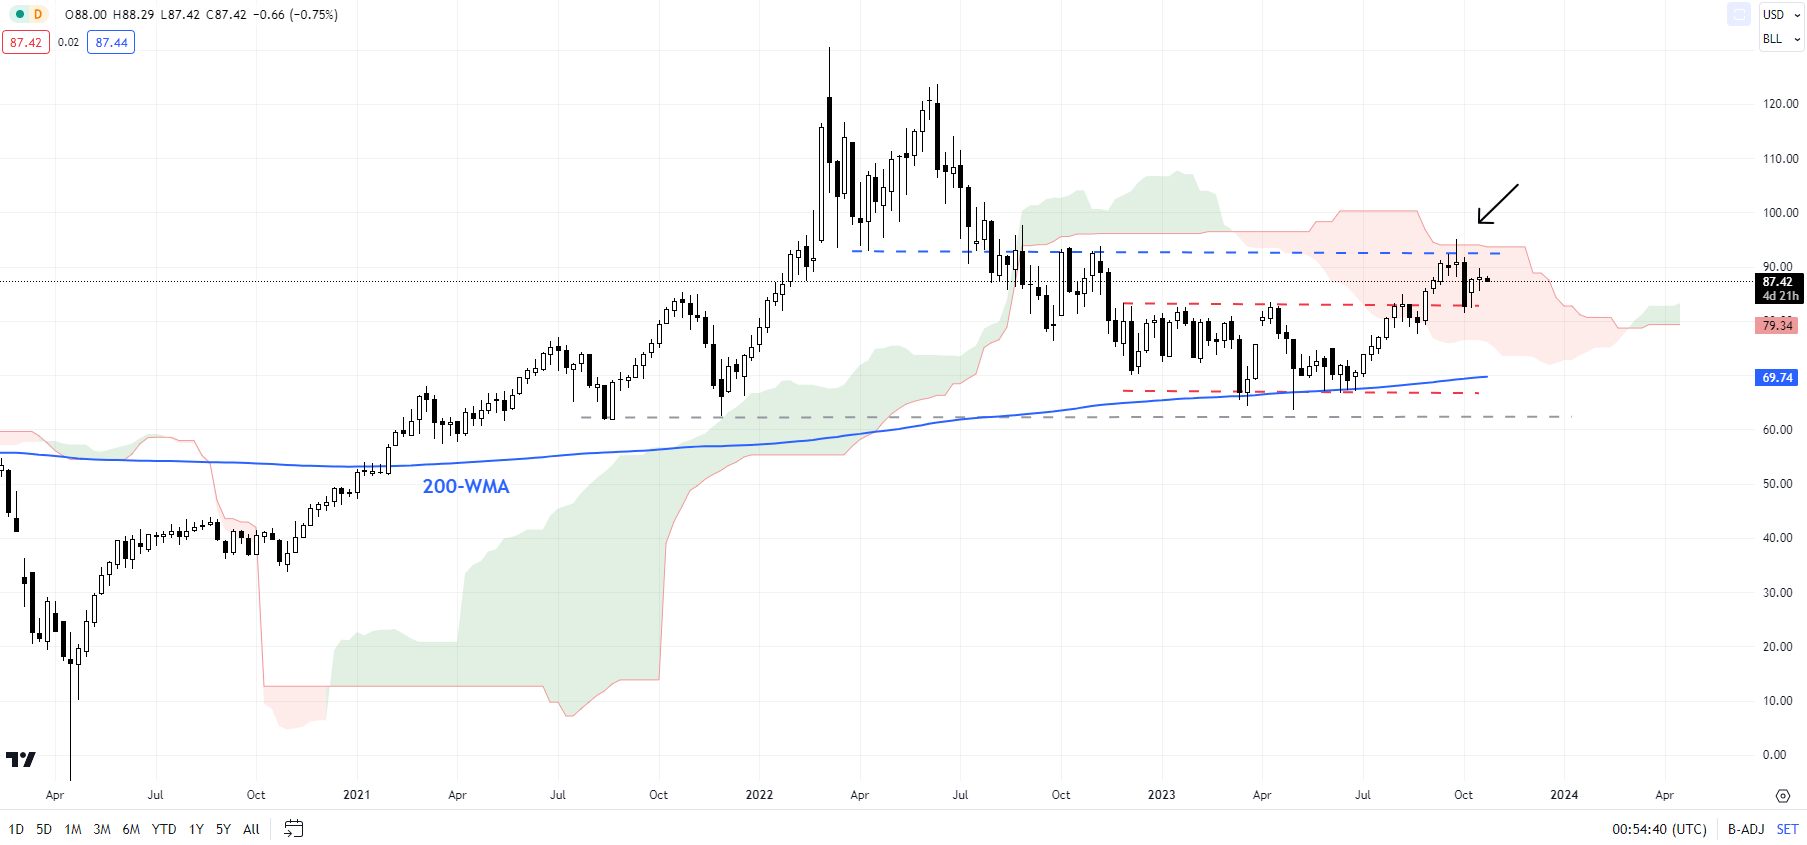
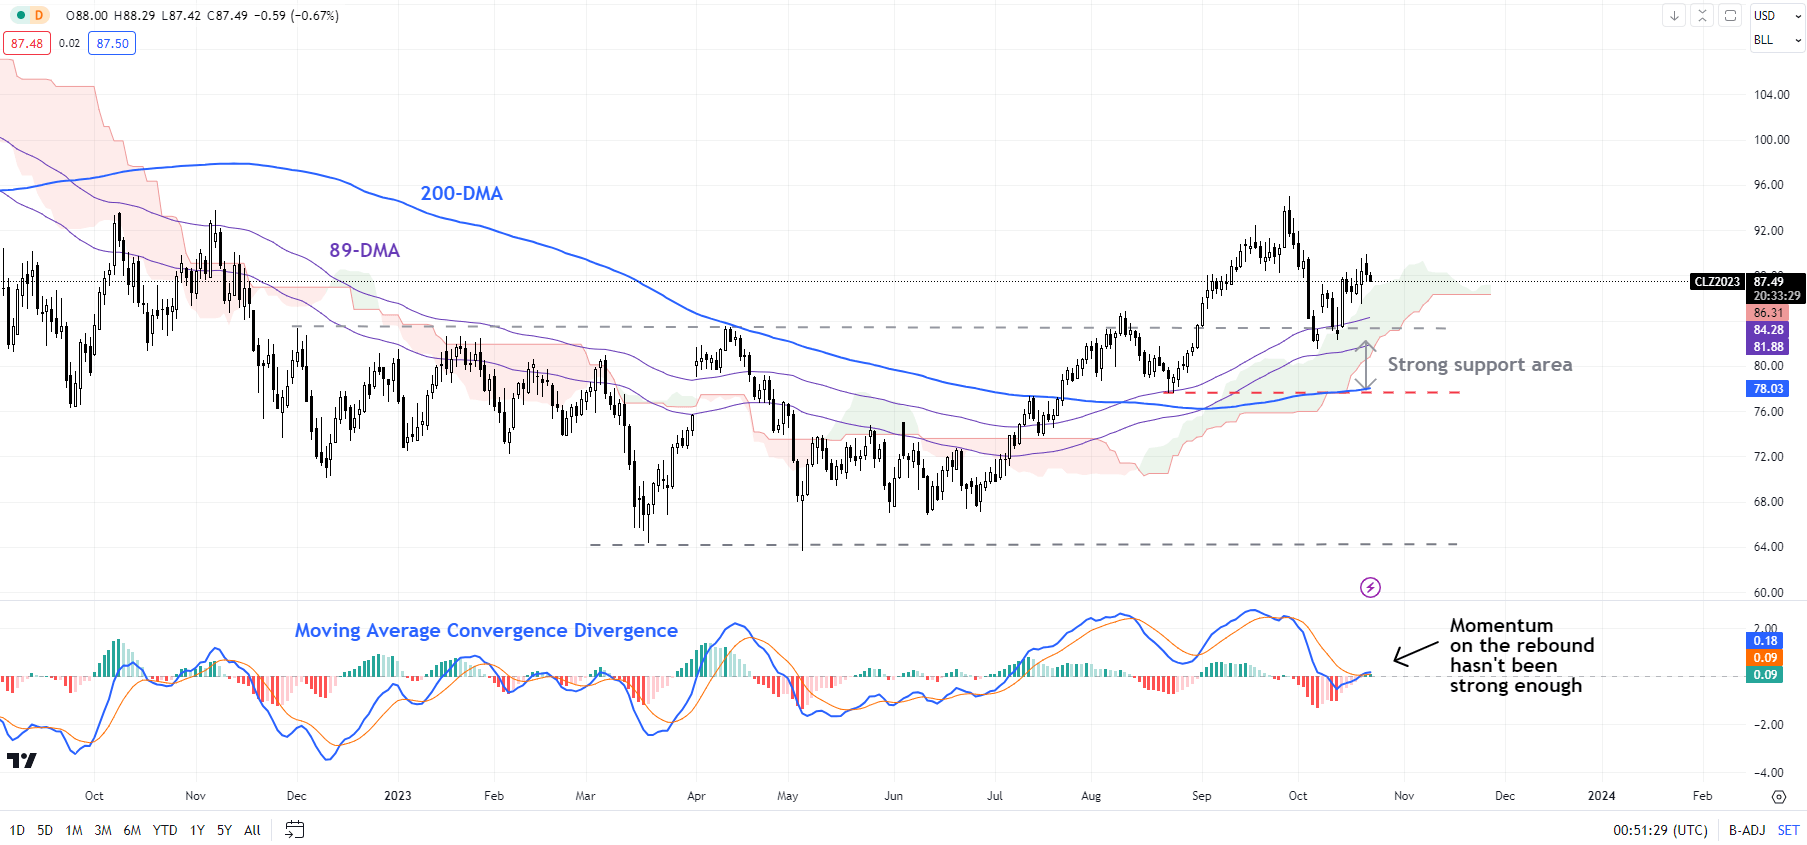
Momentum in the most recent rebound in crude oil isn’t looking strong enough to ensure a sustainable rally just yet. The implication is that the downward correction that started toward the end of September could still be in play. Oil has recovered from near quite strong converged support, including the 89-day moving average, slightly above the 200-day moving average, and the August low of 77.50.

Earlier last month, oil pulled back from stiff converged barriers, including the Ichimoku cloud on the weekly charts and the October high of 93.00. This resistance remains crucial – a break above this barrier is needed to confirm that the rebound from June isn’t just a dead-cat bounce.

Crude Oil Weekly Chart


image1.png

Earlier in September, crude broke out from the multi-month sideways zone triggering a double bottom (the March and May lows), pointing to a potential rise toward 103. The 77.00-81.00 support area continues to offer a strong cushion which could limit the immediate downside, and while the support remains in place, oil could still attempt another leg higher.

Crude Oil Daily Chart

image2.png

Looking for actionable trading ideas? Download our top trading opportunities guide packed with insightful tips for the fourth quarter!

Natural gas: Approaches strong support

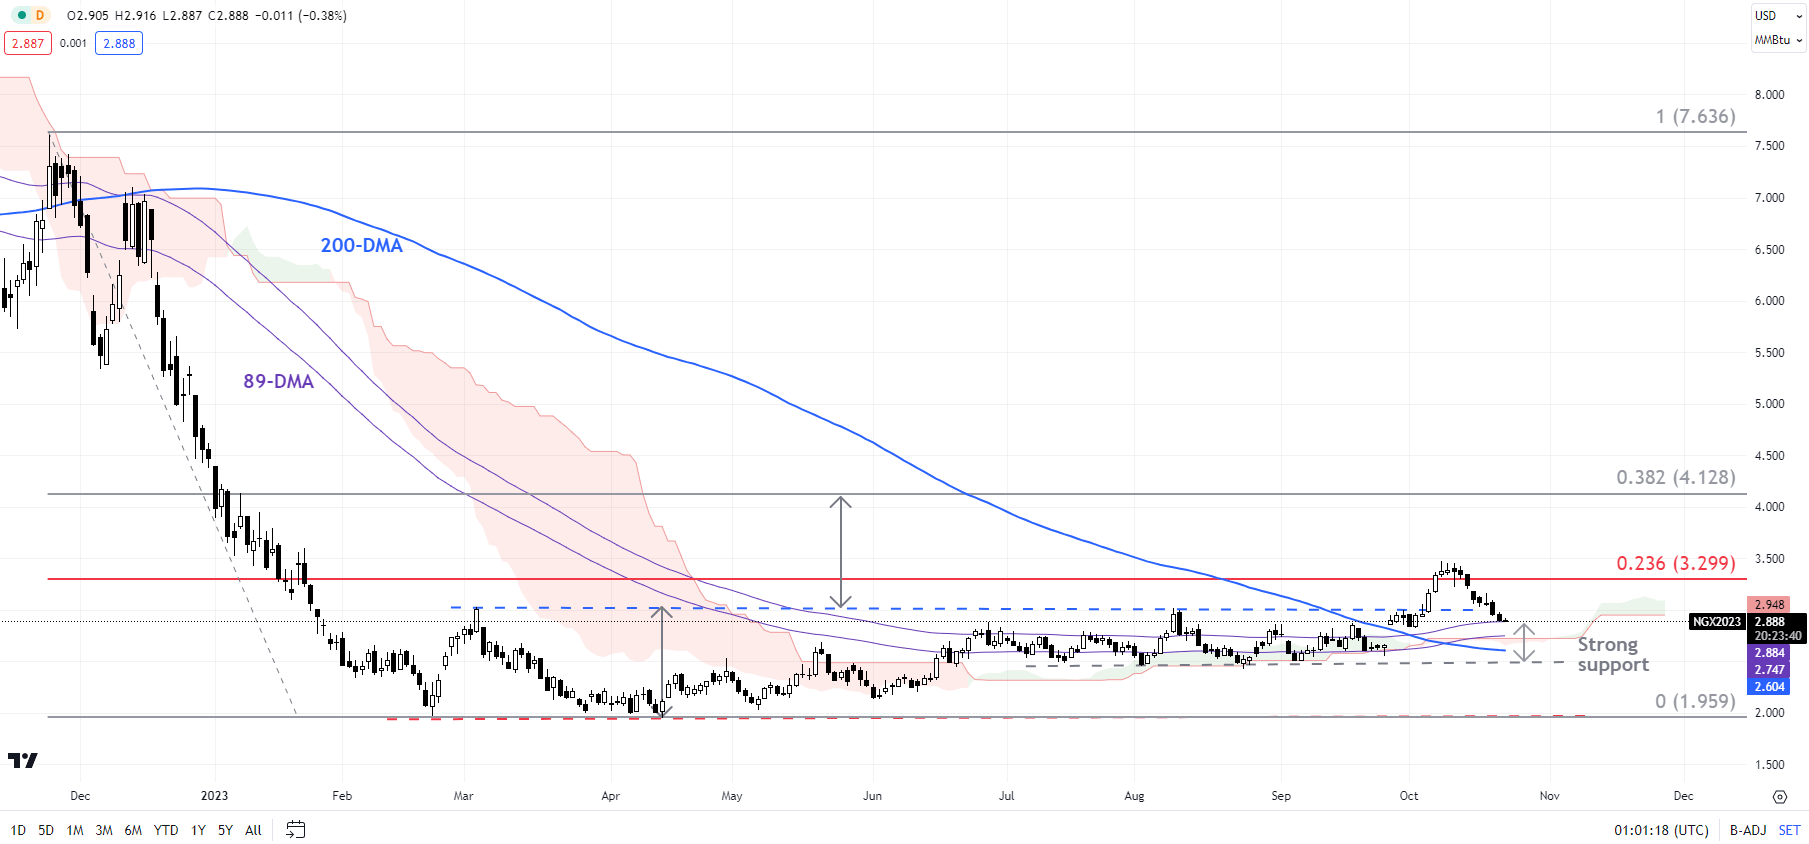
Natural gas has retreated from a stiff barrier around 3.25 (the 23.6% retracement of the November 2022-February 2023 fall). In the context of a slightly zoomed-out view, the retreat isn’t surprising given the steps forward one step back nature of recovery since early 2023. This follows a break higher from a multi-month sideway range is a further confirmation that the long road to recovery may have started, but the damage done in 2022 could take time to unwind.

Natural Gas Daily Chart

image3.png

The break earlier this month above crucial resistance at the March & August highs of 3.03 triggered a significant break out from an eight-month-long sideways range, pointing to a rise to around 4.00-4.10, based on the price objective of the pattern. Importantly, for the first time since the end of 2022 natural gas has risen above the 200-day moving average and a decisive break above the 89-day moving average, suggesting that the base building may have taken place. For more details see “Bullish Natural Gas: Base May Have Been Built,” published October 9.

Any break above 3.25 could open the door toward 4.20 (the 50% retracement). However, for the bullish view to remain intact, natural gas needs to stay above the August low of 2.40.

Elevate your trading skills and gain a competitive edge. Get your hands on the US Dollar Q4 outlook today for exclusive insights into key market catalysts that should be on every trader’s radar.

Japanese Yen Eyes New Lows as Markets Speculate on BoJ Action. Intervention Ahead?

Japanese Yen Eyes New Lows as Markets Speculate on BoJ Action. Intervention Ahead?

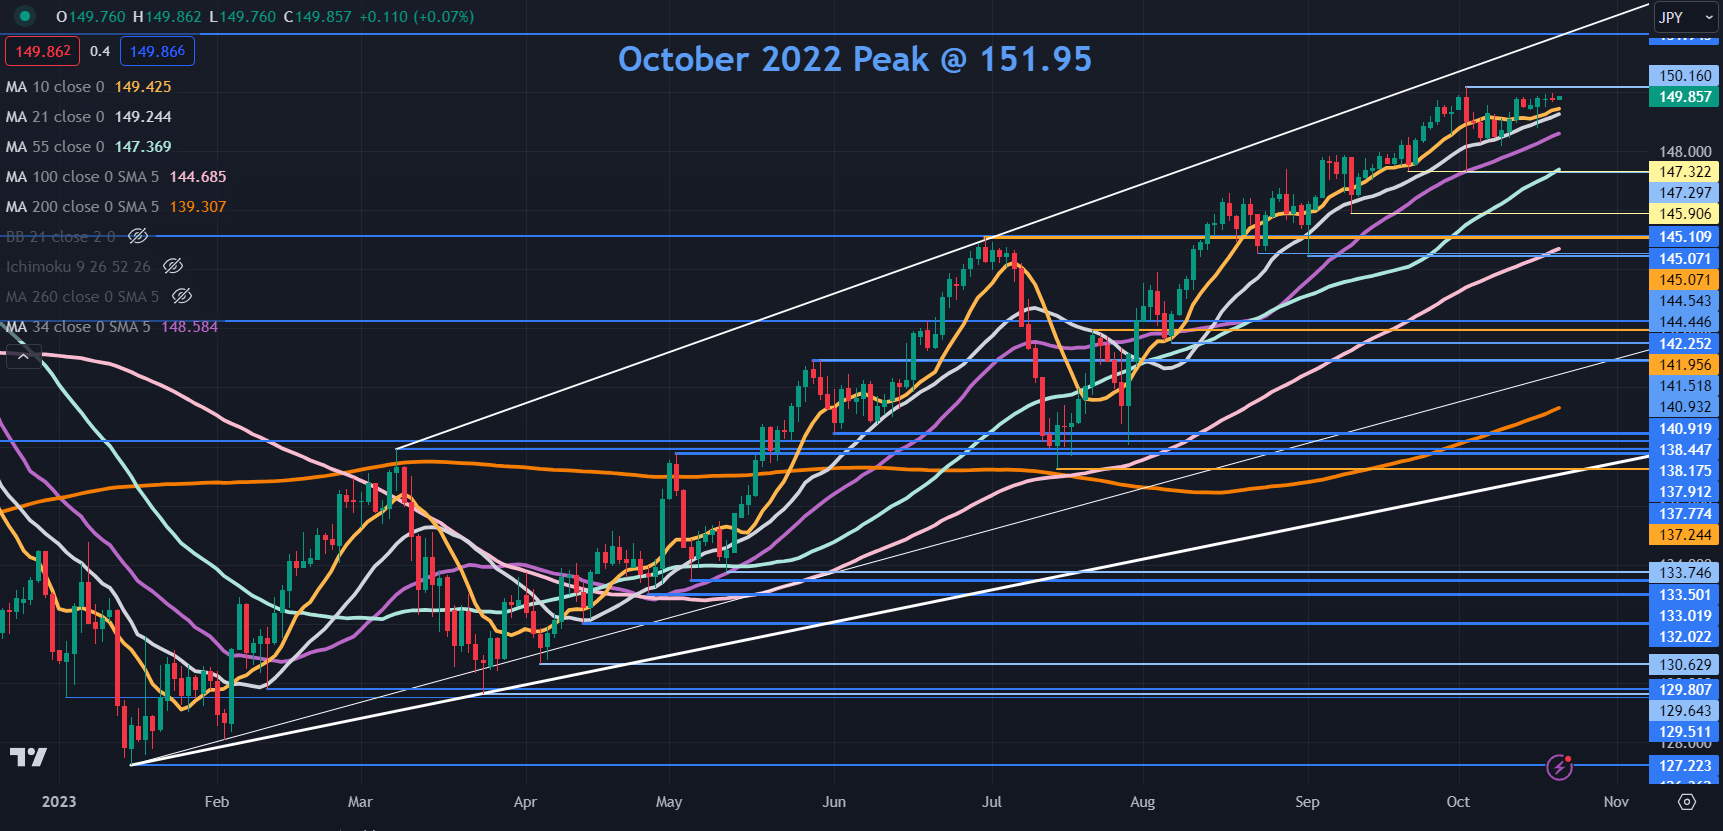
The Japanese Yen is flirting around recent lows with USD/JPY poking above 150 in early Asian trade but unable to overcome the 150.16 high seen earlier this month.

The 10-year Japanese Government Bond (JGB) is near 0.86%, the highest since 2013. The Nikkei news service is reporting that the Bank of Japan is considering tweaking its yield curve control program (YCC).

This follows on from speculation last week that the bank is considering raising its policy rate from below -0.10%.

If USD/JPY makes a clean break above 150 the 33-year high of 151.95 might move into view.

Such a move may also see physical intervention from the BoJ in currency markets. Historically, central bank intervention tends to be most effective when done in combination with supportive fundamental factors.

This places the importance of any BoJ adjustments to the policy rate or YCC at the front of the market’s mind.

Elsewhere, Treasury yields have ticked up to start the week after easing into the weekend with the Federal Reserve now in a blackout period ahead of its Federal Open Market Committee (FOMC) meeting starting October 31st.

The benchmark 10-year note traded at its highest level since 2007, nudging over 5.0% on Friday and remains near there going into Monday’s session.

Before the cone of silence was lowered, Cleveland Federal Reserve President Loretta Mester added to the growing chorus of board members hinting toward a peak in the policy rate when she said, “We are likely near or at a holding point on the funds rate.”

APAC equity indices have followed the Wall Street lead from Friday with all the major markets bathed in a sea of red. India’s stock exchanges have faired a bit better, trading almost flat for the day.

Spot gold has eased to start the week after failing to clear US$ 2,000 on Friday. Crude oil has also given up some of its recent gains as energy markets ponder the geopolitical backdrop in the Middle East.

Looking ahead to this week, the Bank of Canada (BoC) and the European Central Bank (ECB) will be making monetary policy decisions on Tuesday and Thursday respectively while Australia will see crucial 3Q CPI data on Wednesday ahead of US GDP, also on Thursday.

USD/JPY TECHNICAL ANALYSIS UPDATE

USD/JPY may have bullish momentum intact for now as it inches closer to the 12-month high seen earlier this month at 150.16. A break above there could see a run toward the 33-year peak seen at this time last year at 151.95.

A bullish triple moving average (TMA) formation requires the price to be above the short-term SMA, the latter to be above the medium-term SMA and the medium-term SMA to be above the long-term SMA. All SMAs also need to have a positive gradient.

When looking at any combination of the 10-, 21-, 34-, 55-, 100- and 200-day SMAs, the criteria for a TMA have been met and might suggest that bullish momentum is evolving. For more information on trend trading, click on the banner below.

On the downside, support may lie at the recent lows near 147.30 and 145.90 or further down at the breakpoints in the 145.05 – 145.10 area ahead of the prior lows near 144.50 and 141.50.

image1.png

What is Leverage in Forex? Forex Leverage Explained

What is Leverage in Forex? Forex Leverage Explained

Many people are attracted to forex trading due to the amount of leverage that brokers provide. Leverage allows traders to gain more exposure in financial markets than what they are required to pay for. Traders of all levels should have a solid grasp of what forex leverage is and how to use it responsibly. This article explains forex leverage in depth, including how it differs to leverage in stocks, and the importance of risk management.

Leverage in forex fulchrum example showing margin and full trade size

What is leverage in forex trading?

Leverage in forex is a useful financial tool that allows traders to increase their market exposure beyond the initial investment (deposit). This means a trader can enter a position for $10,000 worth of currency and only need $1000, in a ten-to-one leverage scenario. However, it is essential to know that gains AND losses are magnified with the use of leverage. In adverse market scenarios, a trader using leverage might even lose more money than they have as deposit.

Leverage of ten-to-one means that traders can gain exposure to a notional value or trade size, ten times more than the deposit/margin that is required to fund the trade. This can be thought of in a similar fashion to putting a 10% deposit down on a house; you gain access to the entire house while only funding 10%of the full value.

Leverage is usually expressed as a ratio:

Leverage expressed in words Leverage expressed as a ratio
Ten-to-one 10:1
Thirty-to-one 30:1
Fifty-to-one 50:1

The amount of forex leverage available to traders is usually made available through your broker and the amount of leverage will vary according to regulatory standards that preside in different regions.

Leverage in forex vs leverage in shares

Forex leverage differs to the amount of leverage that is offered when trading shares. This is due to the fact that the major FX pairs are liquid and typically exhibit less volatility than even the most frequently traded shares. As a result, hedging risk and getting in and out of trades is more manageable in the $5.1 trillion a day FX market.

Forex for BeginnersHow is forex leverage calculated?

Traders require the following to calculate leverage:

  • The notional value of the trade (trade size)
  • The margin percentage

Brokers often provide traders with a margin percentage to calculate the minimum equity needed to fund the trade. Margin and deposit can be used interchangeably. Once you have the margin percentage, simply multiply this with the trade size to find the amount of equity needed to place the trade.

Equity = margin percentage x trade size

To calculate leverage, simply divide the trade size by the required equity.

Leverage = trade size/ equity

Forex leverage example

Below is a typical example of how to calculate leverage using the above formulas:

  • Trade size: 10 000 units of currency (one mini contract on USD/JPY with a trade size equal to $10 000)
  • Margin percentage: 10%

Equity = margin percentage x trade size

0.1 x $10 000

=$1 000

Leverage = trade size/ equity

$10 000 / $1 000

= 10 times or 10:1

The example highlights the basics of how forex leverage is used when entering a trade. However, it must be noted that traders should not simply calculate the minimum amount needed to enter a trade and then fund the account with that exact amount. Traders must be mindful of margin calls if the position moves in the opposite direction, bringing the account equity below an acceptable level determined by the broker.

Trading forex with leverage has the potential to produce large losses. We have calculated a typical scenario of how the use of excessive leverage can impact a trading account and tabulated the results.

How to manage forex leverage risk

Leverage can be described as a two-edged sword, providing both positive and negative outcomes for forex traders. This is why it is essential to determine the appropriate effective leverage and incorporate sound risk management.

Top traders make use of stops to limit their downside risk when trading forex. At litefinance we recommend risking no more than 1% of the account equity on any single trade and no more than 5% of the account equity for all open trades at any point in time.

Furthermore, successful traders make use of a positive risk-to-reward ratio in an attempt to achieve higher probability trades over time.

It is vital to avoid mistakes with leverage; to understand how to avoid other issues traders might face check our Top Trading Lessons guide.

EUR/USD Forecast – Euro Continues Consolidating In a Flag Pattern

EUR/USD Forecast – Euro Continues Consolidating In a Flag Pattern

Euro vs US Dollar Technical Analysis

The euro pulled back just a bit during the trading session on Friday, but then turned around to show signs of life again. Ultimately, we are still very much in a bearish flag pattern, so therefore I think eventually we will get the ability to short this market on signs of exhaustion. Heading into the weekend, it doesn’t look like we have a whole lot going on, and therefore it’s likely that we have more choppiness ahead of us. All things being equal, the market breaking down below the bottom of the uptrend line of the bearish flag is probably what we will see next.

Advertisement
Know where EUR/USD is headed? Take advantage now with

Trading Derivatives carries a high level of risk to your capital and you should only trade with money you can afford to lose. Trading Derivatives may not be suitable for all investors, so please ensure that you fully understand the risks involved, and seek independent advice if necessary. A Product Disclosure Statement (PDS) can be obtained either from this website or on request from our offices and should be considered before entering into a transaction with us. Raw Spread accounts offer spreads from 0.0 pips with a commission charge of USD $3.50 per 100k traded. Standard account offer spreads from 1 pips with no additional commission charges. Spreads on CFD indices start at 0.4 points. The information on this site is not directed at residents in any country or jurisdiction where such distribution or use would be contrary to local law or regulation.

If that were to happen, then we could see the market drop down to the 1.05 level, which is a large, round, psychologically significant figure. This area has offered a little bit of support recently, and therefore it’s likely that we will continue to see that area offer it yet again. Ultimately though, I do think that we break down through there if the economic situation in the European Union continues. Furthermore, we have seen a lot of inflationary pressure in the United States, suggesting that perhaps the Federal Reserve will stay tight for longer than people wanted.

Looking at the chart, you can see this bearish flag is very prominent, and if we were to break down below the 1.05 level, it opens up the next “FOMO trade”, as we go down to the 1.0250 level, then eventually the parity level, which I think it’s a very real possibility. That being said, if we were to turn around and take out the 50-Day EMA to the upside, then the market is likely to go looking to the 200-Day EMA.

Expect a lot of choppiness, but you should also recognize that any time you get an opportunity to pick “cheap US dollars”, you should probably do so. With the European Union heading into a recession, and of course all of the geopolitical concerns out there, it does make a certain amount of sense that the greenback will continue to attract a lot of attention and therefore people will be more than willing to jump into it.

Brent Crude Oil Set for Second Weekly Advance as Tensions Ramp Up

Brent Crude Oil Set for Second Weekly Advance as Tensions Ramp Up

Fighting Continues on Multiple Fronts as Diplomatic Efforts do Little to Calm Tensions

Recent visits from US President Joe Biden and UK Prime Minister Rishi Sunak have yielded mixed results. After a crucial meeting between Biden and leaders of Arab nations was cancelled earlier this week, discussions between the presidents of the US and Egypt resulted in an agreement to facilitate aid to Gaza via Egypt in a suitable manner. While a definite timeline could not be provided, a White House spokesman confirmed it would occur in the coming days. Iran has spoken out against potential plans of a ground offensive by Israel, warning that doing such could spark ‘pre-emptive action’.

Brent Crude Oil Edges Higher Ahead of the Weekend

Oil prices are on pace to achieve a second successive week of gains. Traders will be mindful of last Friday’s surge in prices as the market geared up for a potential ground offensive into northern Gaza.

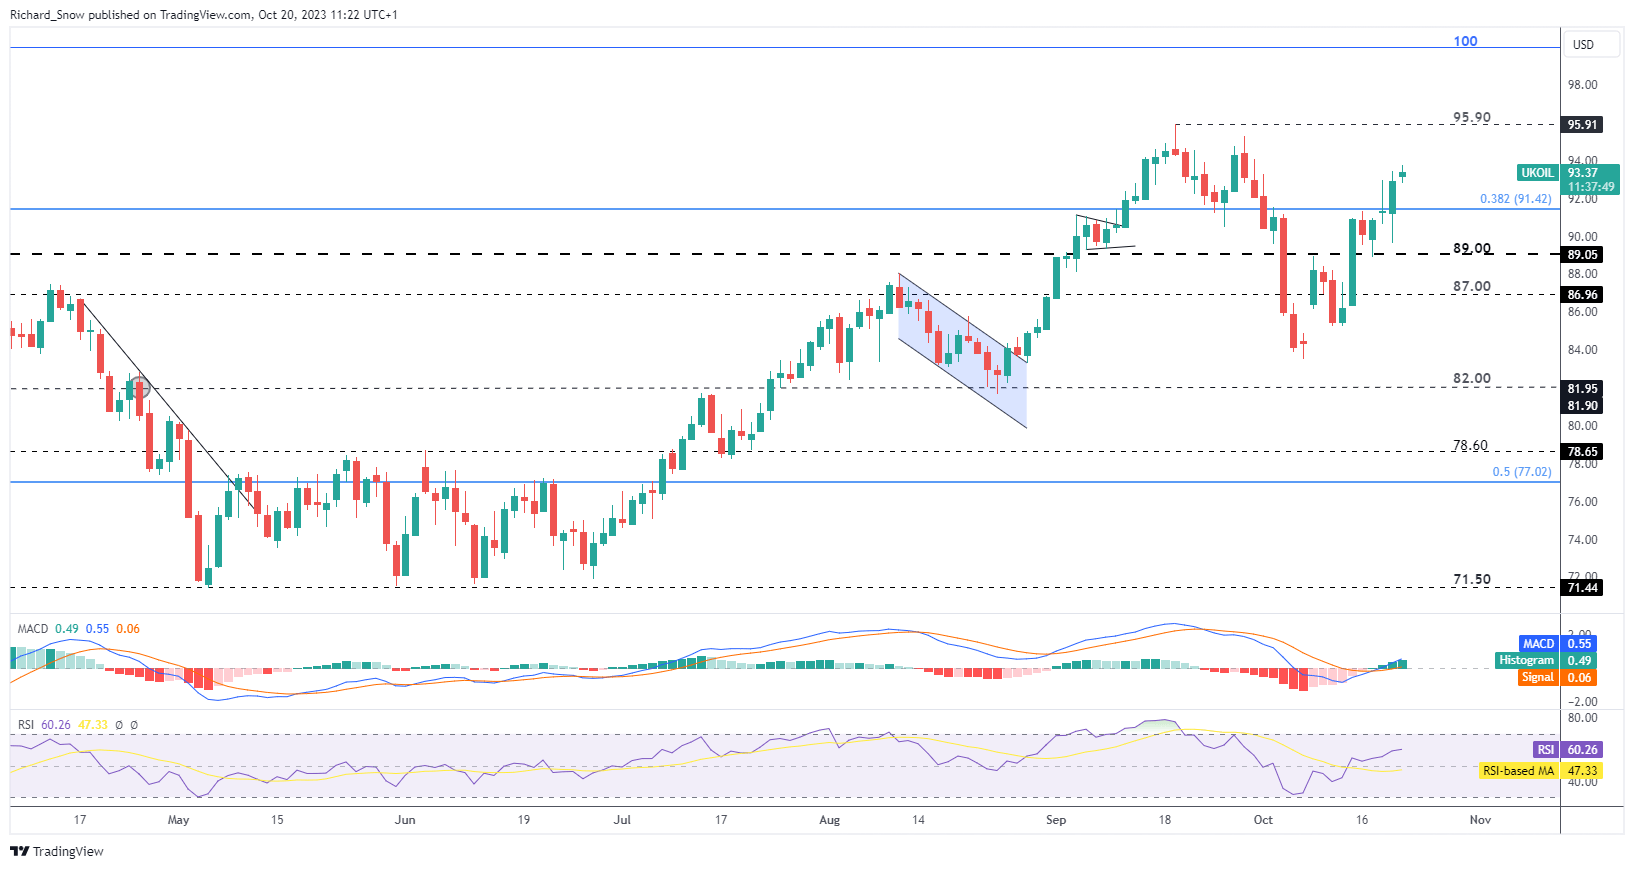
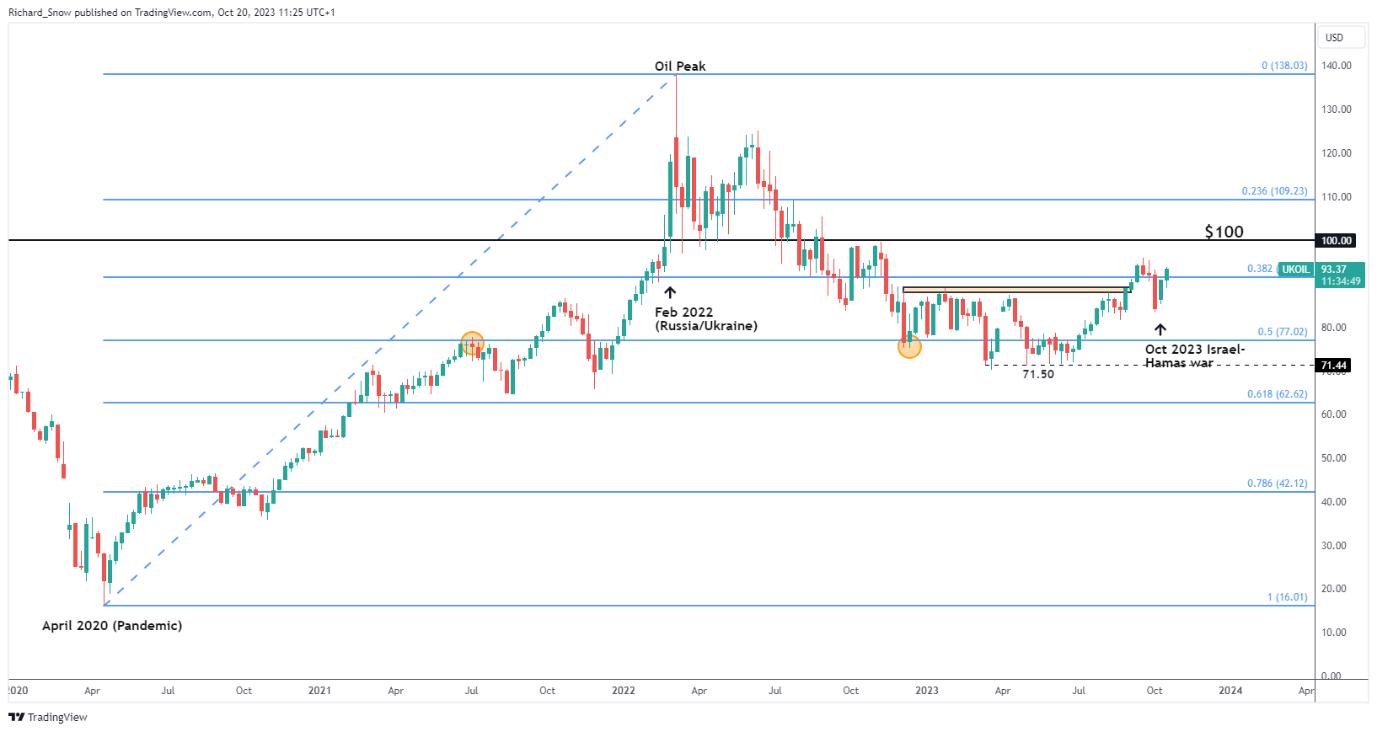
While today’s price action has been calm in relation to one week ago, prices are still edging higher as tensions remain worrisome. Oil now approaches the September swing high around $95.90, with the psychological level of $100 not out of the question further down the line. The effect of the geopolitical conflict more than compensates for the effect rising US yields and a strong dollar typically have on global commodity markets. Support appears around the prior swing lows near $89.00.

Oil (Brent Crude) Daily Chart

image1.png

The weekly chart shows just how far oil prices can rally in the face of global crises and large-scale conflicts. The Russia-Ukraine war amplified the impressive recovery as the world reopened after forced lockdowns in response to the outbreak of Covid-19. Prices have broken above the 38.2% Fibonacci retracement of the broader Covid-inspired move from 2020 to 2022.

Oil (Brent Crude) Weekly Chart

image2.png

IG Client Sentiment Hints at Continued Bullish Momentum as Traders Pile into Shorts

Oil– US Crude:Retail trader data shows 61.31% of traders are net-long with the ratio of traders long to short at 1.58 to 1.

We typically take a contrarian view to crowd sentiment, and the fact traders are net-long suggestsOil– US Crude prices may continue to fall.

The number of traders net-long is 14.65% lower than yesterday and 24.76% lower from last week, while the number of traders net-short is 13.46% higher than yesterday and 57.02% higher from last week.

Nasdaq Index, Dow Jones, S&P 500 News: Wall Street Cautious Amid Surging Yields, Middle East Tensions

Nasdaq Index, Dow Jones, S&P 500 News: Wall Street Cautious Amid Surging Yields, Middle East Tensions

U.S. Stocks React to Powell and Geopolitics

Major U.S. stock indexes are dipping as traders evaluate Federal Reserve Chair Jerome Powell’s remarks on persistent inflation and a likely hold on interest rates in November. Treasury yields are surging, crossing the 5% mark for the first time since 2007. Concurrently, geopolitical tensions are rising. Israel is on high alert due to potential conflict escalation with Hamas, while the U.S. and other nations have urged their citizens to leave Lebanon.

Market Indicators and Federal Reserve

The Dow Jones, S&P 500, and Nasdaq have all opened lower, with the tech-heavy Nasdaq suffering the most significant decline. On the weekly scale, all three indexes are poised for losses. Powell’s speech on Thursday confirmed the Fed’s commitment to controlling inflation but offered no clear path for future rate hikes. Market sentiment appears to be pricing in a hold on rate changes for November.

Trading Derivatives carries a high level of risk to your capital and you should only trade with money you can afford to lose. Trading Derivatives may not be suitable for all investors, so please ensure that you fully understand the risks involved, and seek independent advice if necessary. A Product Disclosure Statement (PDS) can be obtained either from this website or on request from our offices and should be considered before entering into a transaction with us. Raw Spread accounts offer spreads from 0.0 pips with a commission charge of USD $3.50 per 100k traded. Standard account offer spreads from 1 pips with no additional commission charges. Spreads on CFD indices start at 0.4 points. The information on this site is not directed at residents in any country or jurisdiction where such distribution or use would be contrary to local law or regulation.

Geopolitical Unrest in the Middle East

Israel has ordered an evacuation in Kiryat Shmona near the Lebanon border due to intensifying shelling and escalating tensions with Hezbollah. The evacuation adds another layer of uncertainty to global markets, already concerned with the Israel-Hamas conflict. Multiple nations have called on their citizens to leave Lebanon.

Corporate Earnings and Market Moves

Various stocks are also moving premarket, with SolarEdge Technologies’ shares plunging after revising its third-quarter guidance. Meanwhile, Schlumberger and Intuitive Surgical reported mixed earnings, affecting their stock prices. These corporate earnings further contribute to market volatility.

Short-Term Outlook

Given Powell’s cautious stance and the rising geopolitical tensions, market sentiment is bearish. Traders are also keeping an eye on corporate earnings, adding another element of unpredictability.

Technical Analysis

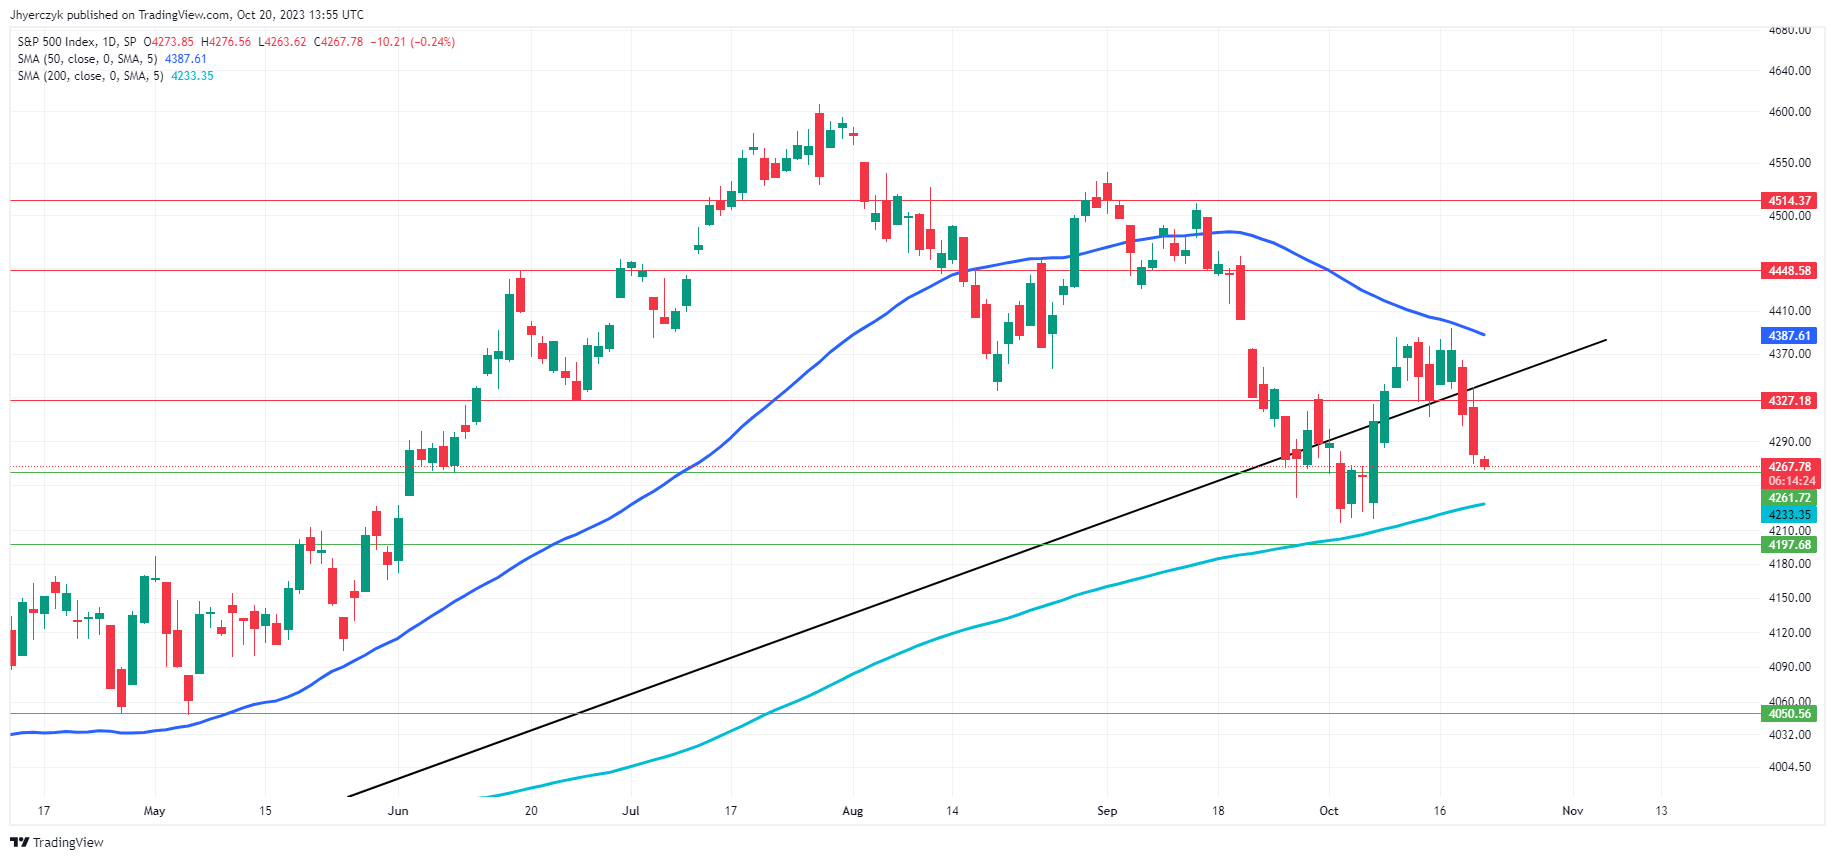
Daily S&P 500 IndexThe current daily price of the S&P 500 Index is 4265.03, slightly below its 50-day moving average of 4233.34 but above its 200-day moving average of 4177.26. This indicates short-term volatility but longer-term stability.

The price is hovering above the main support level at 4197.68 but below the minor resistance level at 4327.18, suggesting a trading range scenario. Given that the price is near the minor support at 4261.72, it serves as a crucial pivot point for traders.

Overall, early market sentiment is neutral to bearish with traders keying on the market’s reaction to the 200-day moving average. There could be a techniclal bounce on the first test of this level, but if it fails then look for the selling to possibly lead to the start of an acceleration to the downside.

Mixed S&P 500 Results Set Stage for ‘Magnificent Seven’

Mixed S&P 500 Results Set Stage for ‘Magnificent Seven’

Third-Quarter U.S. Earnings Season Ramps Up

The U.S. earnings season for the third quarter has shifted into high gear, with investors and traders eagerly watching each announcement. According to recent LSEG data, S&P 500 companies are estimated to show a 2.2% year-over-year earnings increase for the quarter. As some of the most influential companies across various sectors such as finance, tech, and healthcare step up to reveal their financial health, the data released will inevitably set the stage for market movements in the closing months of the year.

Upbeat Earnings

There’s good news for those bullish on the financial sector. Bank of America’s stock gained 2.3% after beating quarterly expectations, propelling the S&P 500’s financial sector upwards by 0.6%. Charles Schwab also gave investors reason to smile with a 4.7% share price increase, as the brokerage posted a smaller-than-expected decline in quarterly profits. Procter & Gamble’s stock rode a similar wave, gaining 2.6% after it surpassed market expectations for quarterly sales. These performances hint at an undercurrent of resilience in various sectors, despite broader market volatility.

Downbeat Earnings

However, it hasn’t been smooth sailing for everyone. Goldman Sachs, a major player in the financial world, saw its shares fall by 1.6% despite a less severe drop in third-quarter profits than analysts had feared. United Airlines took a more significant hit, with its stock plummeting by 9.7% due to a pessimistic outlook for fourth-quarter profits, thereby affecting the S&P 500 passenger airlines index which dropped by 5.6%. Morgan Stanley had a tough day as well, with its shares closing 6.8% lower due to sluggish deal-making activities. Blackstone, the world’s largest manager of alternative assets, also reported a steeper-than-expected 12% year-on-year decline in distributable earnings.

Future Earnings

Looking ahead, market participants are directing their attention to the “Magnificent Seven”—Apple, Microsoft, Alphabet, Amazon, Nvidia, Tesla, and Meta Platforms. These giants have been the primary drivers of the S&P 500’s 12% gains this year. However, with their average forward P/E ratio standing at a lofty 33.5, compared to the S&P 500’s 18.3, the pressure is on for these behemoths to deliver robust earnings, especially as rising bond yields make equities less attractive.

Closing Thoughts

In a nutshell, the current earnings season has revealed a mixed bag of results that are shaping market sentiment in real-time. While there have been notable bright spots providing a bullish outlook for certain sectors, downbeat performances act as a cautionary signal.

The forthcoming earnings from the market’s top performers are set to play a crucial role in steering market sentiment and trends. With valuations high, the stakes are elevated, making the next wave of corporate earnings releases even more critical in shaping the market’s end-of-year narrative.

USD/CAD Price Forecast: Bulls Lack Conviction Above the 1.3700 Handle

USD/CAD Price Forecast: Bulls Lack Conviction Above the 1.3700 Handle

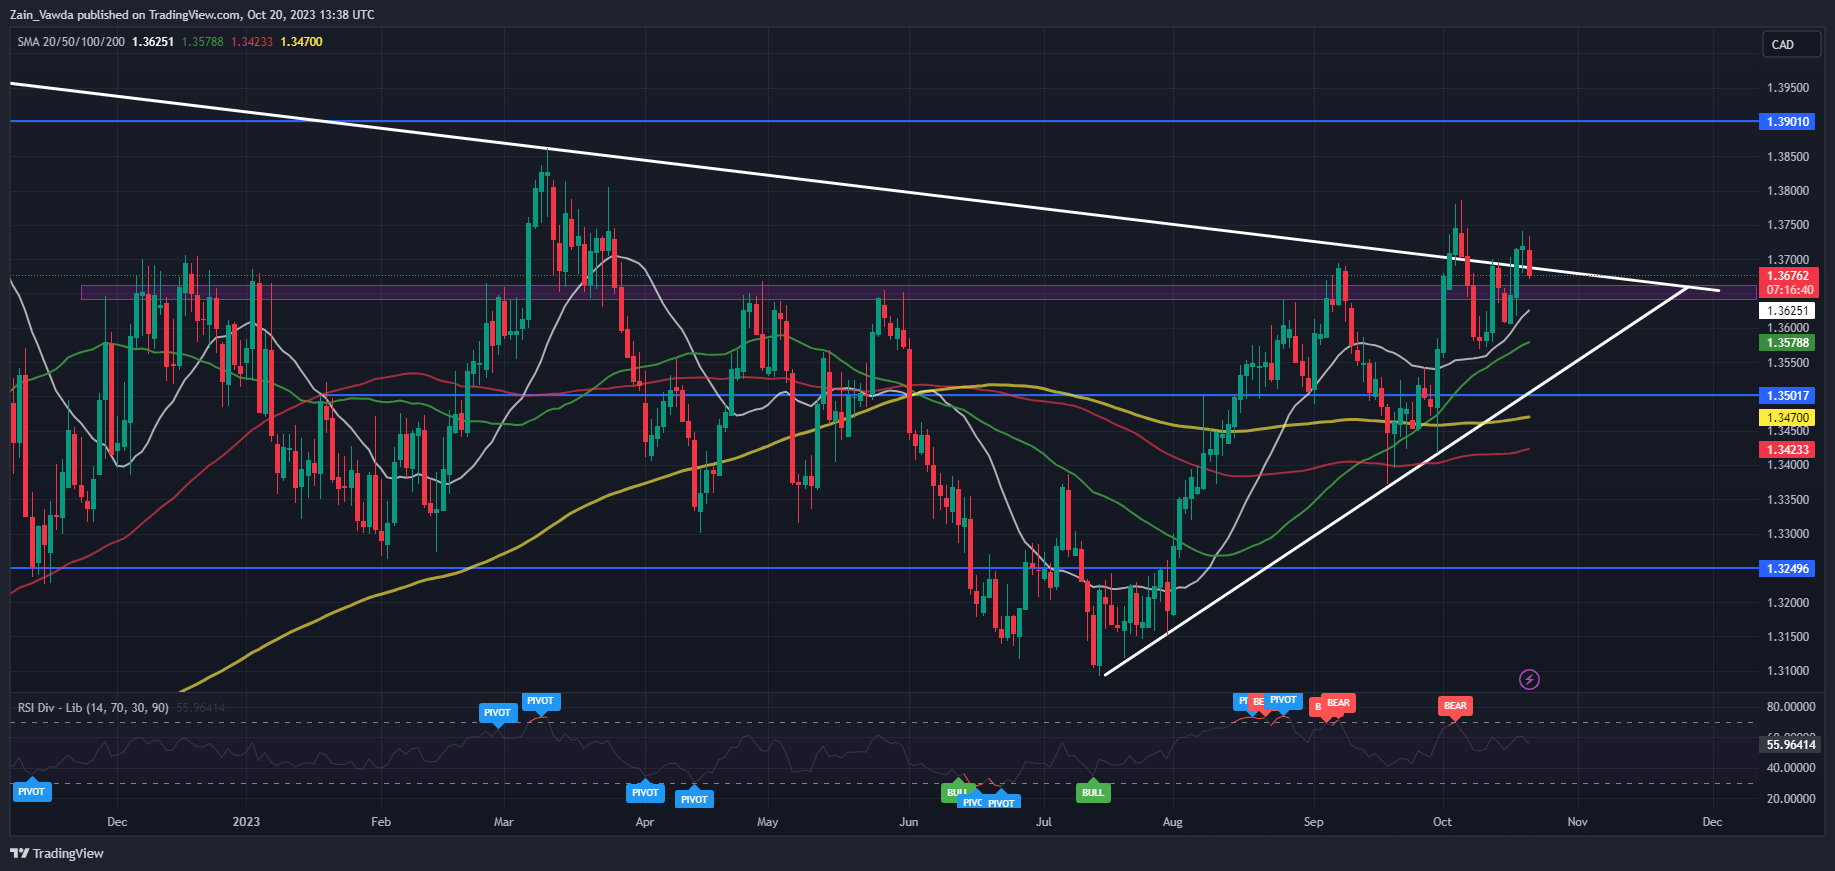
USDCAD price action continues to frustrate and confuse market participants as the usually trending pair has remained relatively rangebound for the past two weeks. The pair has struggled to break out of the 1.3570-1.3780 mark (most recent high and low) as the stronger Dollar has kept the bulls interested. The higher oil price seems to be helping the loonie and keeping USDCAD from advancing beyond the 1.3700 level for now.

Are you just starting your Trading Journey? Fear Not, DailyFX has you covered with the best tips and tricks for beginner traders. Download the Free Guide Below!!

CANADIAN RETAIL SALES DATA AND BANK OF CANADA

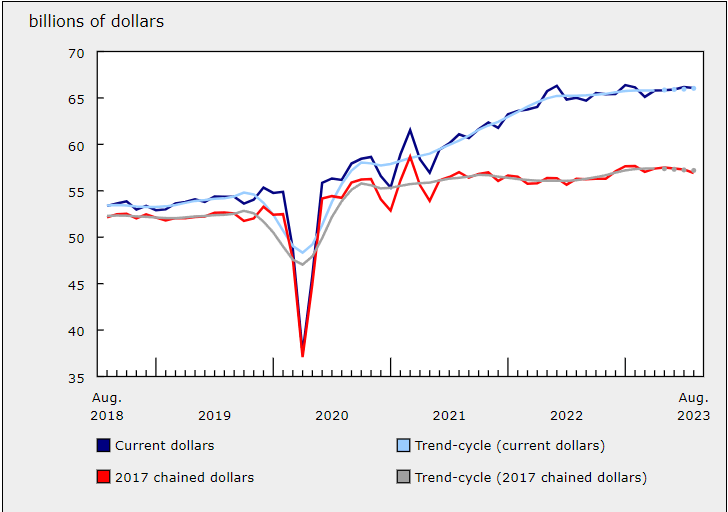
Canadian Retail Sales appeared to stagnate is September while the August print was revised from a previous -0.3% to a print 0f -0.1%. The August retail turnover however should be taken with a pinch of salt given the port strikes in British Columbia. 12% of surveyors reported lower business activity because of issues with supply chain logistics caused by the strikes.

image1.png

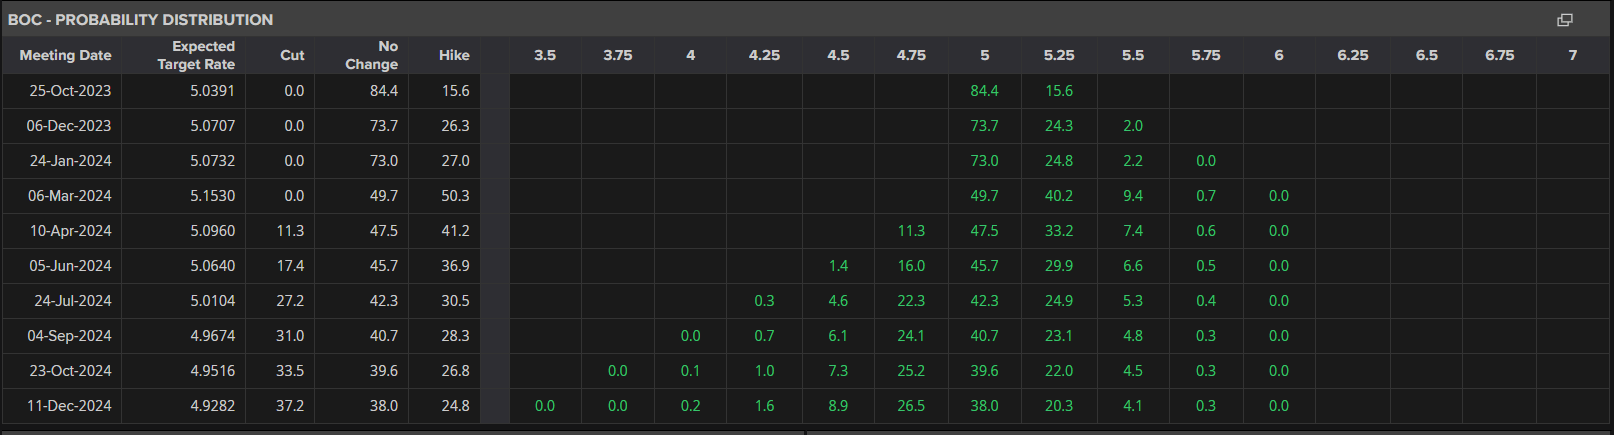
A positive for the Bank of Canada (BoC) as Canadian inflation slowed down in September despite the increase in fuel prices. The Core and Headline rate coming in below expectation and will certainly help given the pessimistic tone we heard recently from Deputy Governor Vincent. The inflation release and stagnation in Retail Sales should surely mean a pause from the BoC at next week meeting. Markets participants are currently pricing in an 84.1 chance that rates will be held steady and just a 15.9% chance of a 25bps hike. The BoC meeting is scheduled for next week Wednesday, October 25 at 14h00 GMT.

image2.png

Looking for actionable trading ideas? Download our top trading opportunities guide packed with insightful tips for the fourth quarter!

TECHNICAL ANALYSIS USDCAD

USDCAD failed in its attempts to pierce through the 1.3700 resistance area. This is the second failed attempt in the last two weeks, the previous of which fell just short around the 1.36920 mark.

At the moment it really is a tug of war between USD and CAD bulls which seem to be canceling each other out. On the surface it does appear the USD is a more attractive proposition but given the current climate the CAD has been able to hold its own. The CAD is largely deriding its strength from higher oil prices, as the drop in inflation and stagnation in retail sales should’ve have aided the bulls in facilitating a break above the 1.3700 mark.

In other words, the longer there is concern about escalation in the Middle East the US Dollar and Oil prices are likely to remain supported. This in turn could mean more rangebound price action for USDCAD. An improvement in sentiment however could be just what the Doctor ordered for CAD bulls to look at a push toward the 1.3500 mark and potentially lower.

Key Levels to Keep an Eye On:

Support levels:

  • 1.3625
  • 1.3579
  • 1.3500

Resistance levels:

  • 1.3700
  • 1.3780
  • 1.3900

USD/CAD Daily Chart

IG CLIENT SENTIMENT

Taking a look at the IG client sentiment data and we can see that retail traders are currently net SHORT with 67% of Traders holding short positions.

For Tips and Tricks on How to use Client Sentiment Data, Get Your Free Guide Below