Bitcoin (BTC) Pumping Back to ETF Rumor High, No Smoke Without Fire?

Bitcoin (BTC) Pumping Back to ETF Rumor High, No Smoke Without Fire?

The growing belief that a spot Bitcoin ETF is a matter of when not if, is pushing the largest cryptocurrency by market capitalization ever higher this week. On Monday a false rumor that the BlackRock ETF had been permissioned by the SEC sent BTC spiraling higher before the rumor was quickly proven to be false. The market sell-off however was limited and today Bitcoin traded back at Monday’s high of around $30k as markets continue to price in the probability that one or more spot Bitcoin ETFs will be announced soon.

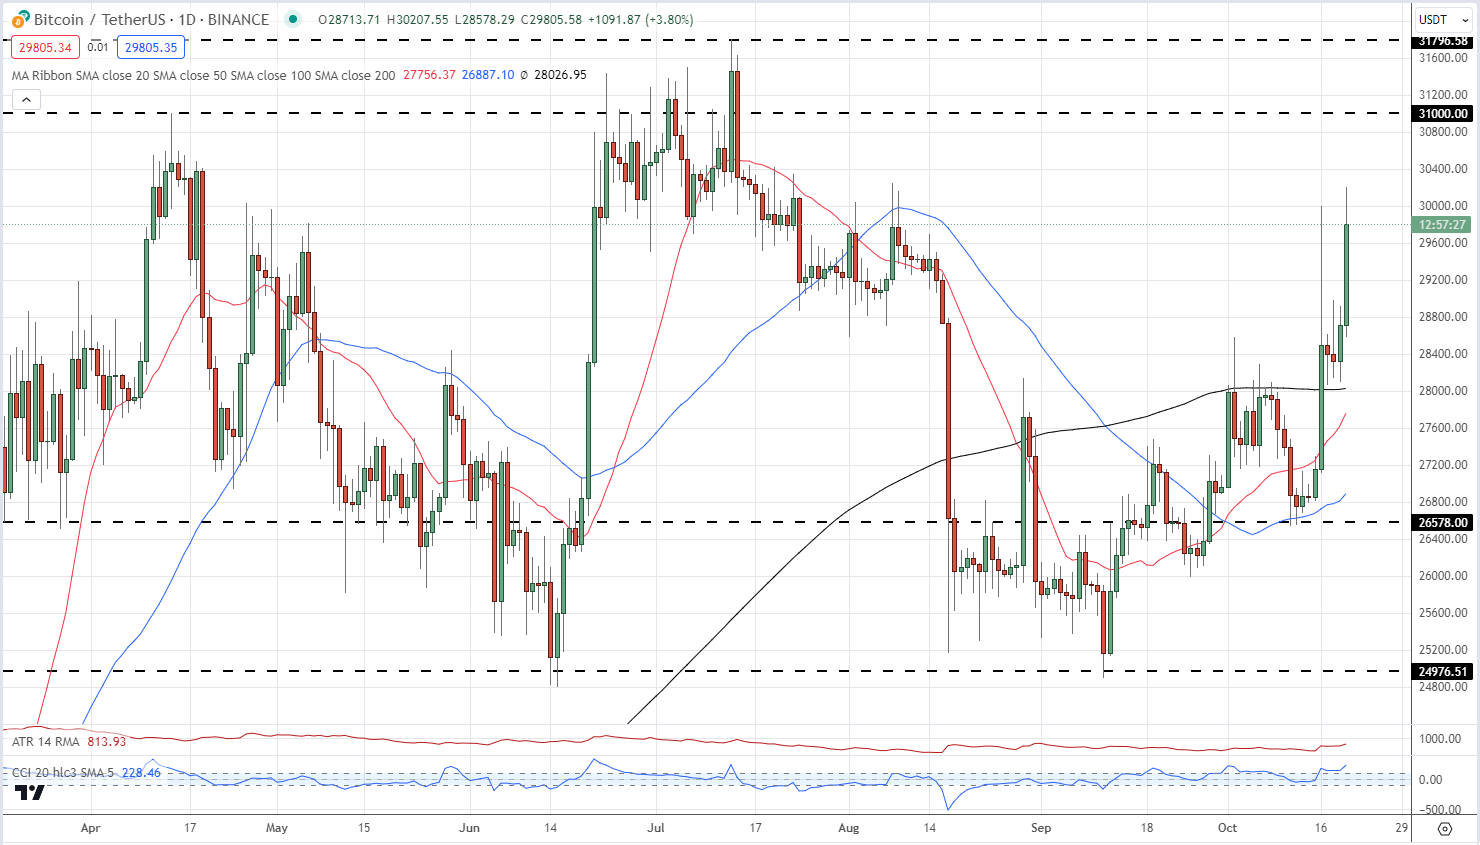
While the fundamental backdrop for Bitcoin may be built on growing hope, the technical picture has turned bullish this week. The long-dated moving average (200-dsma) has been broken convincingly and has now turned from resistance to support. The midweek price action saw this moving average hold firm and today’s rally confirms that $28k should now be seen as support in the near-term at least. A series of higher lows and higher highs underpins the bullish outlook. The next level of resistance is seen around $31k before the 2023 high print at $31,796 comes into play.

Bitcoin (BTC/USD) Daily Price Chart – October 20, 2023

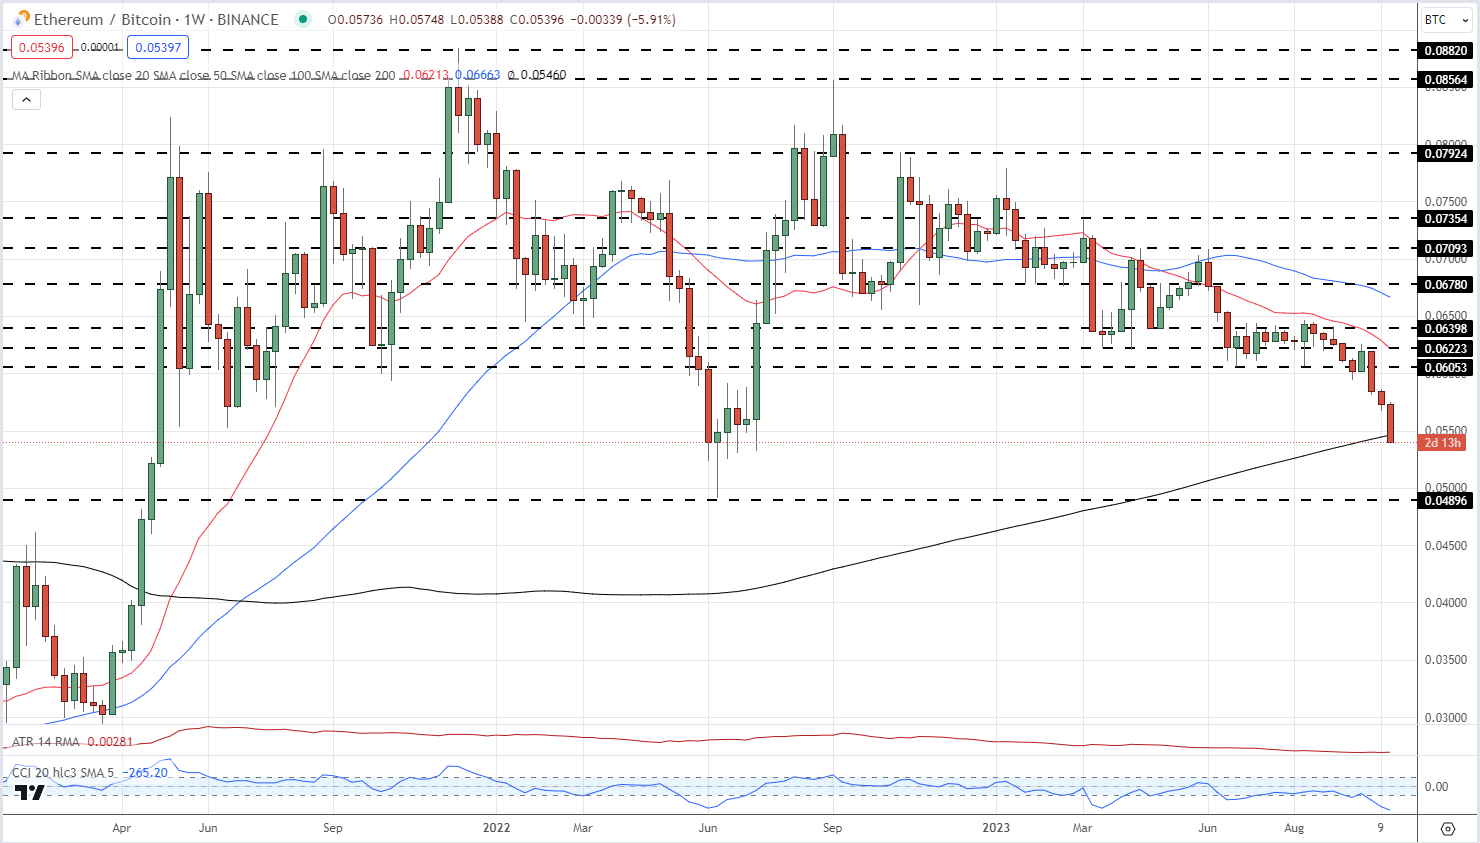
image1.pngBitcoin has rallied in excess of 80% this year and remains the dominant cryptocurrency coin by a wide margin. Bitcoin makes up just under 51.5% of the total market capitalization, currently USD1.14 trillion, with Ethereum second at 17.3%. Bitcoin has also outperformed Ethereum by a margin as well and with horizontal support still a little bit away, BTC may well continue to outperform the market in the short term.

Ethereum/Bitcoin Weekly Price Chart – October 20, 2023

image2.pngWhat is your view on Bitcoin – bullish or bearish?? You can let us know via the form at the end of this piece or you can contact the author via Twitter @nickcawley1.

Nasdaq 100, Dow Jones, S&P 500 News: Rising 10-Year Yields, Mixed Earnings Reports Spell Caution

Nasdaq 100, Dow Jones, S&P 500 News: Rising 10-Year Yields, Mixed Earnings Reports Spell Caution

Stock Market Reaction to Rising Treasury Yields and Earnings Reports

Stock futures signaled a cautious cash market open on Friday, influenced heavily by the 10-year Treasury yield crossing the 5% threshold for the first time since 2007. Dow Jones Industrial Average futures slipped by 0.12%, while S&P 500 and Nasdaq 100 futures were down by 0.19% and 0.29%, respectively.

After-Hours Volatility

In after-hours trading, SolarEdge saw its shares plummet by 20% after the solar company revised its Q3 revenue guidance downwards, citing “substantial unexpected” order cancellations from European distributors. This dragged down peers Enphase Energy and First Solar, which lost 14% and 4.9% in share value, respectively. Shares of Intuitive Surgical and CSX also experienced a decline, as both companies failed to meet analysts’ expectations on revenue for Q3.

Trading Derivatives carries a high level of risk to your capital and you should only trade with money you can afford to lose. Trading Derivatives may not be suitable for all investors, so please ensure that you fully understand the risks involved, and seek independent advice if necessary. A Product Disclosure Statement (PDS) can be obtained either from this website or on request from our offices and should be considered before entering into a transaction with us. Raw Spread accounts offer spreads from 0.0 pips with a commission charge of USD $3.50 per 100k traded. Standard account offer spreads from 1 pips with no additional commission charges. Spreads on CFD indices start at 0.4 points. The information on this site is not directed at residents in any country or jurisdiction where such distribution or use would be contrary to local law or regulation.

Treasury Yields and Investment Strategies

The 10-year Treasury yield reached a significant milestone, crossing the 5% mark for the first time in 16 years. This event has caught traders’ attention, as higher yields could indicate looming changes in Federal Reserve policy. Investors looking for fixed-income portfolio opportunities may consider adding longer-dated bonds to lock in attractive yields and manage reinvestment risk. This strategy is helping to drive down demand for equities.

Federal Reserve’s Stance

The market appeared skittish after Federal Reserve Chair Jerome Powell’s recent remarks. Although he did not provide explicit guidance on future rate hikes, futures trading reflected a 92% probability that rates would remain unchanged in November. Powell’s emphasis on the need to bring inflation down adds another layer of complexity to rate hike expectations.

Short-Term Outlook

As the market digests the impact of rising Treasury yields and mixed earnings reports, a bearish short-term outlook is forming. Investors and traders should pay close attention to upcoming earnings from major financial institutions and oilfield services companies to gauge market sentiment better.

Technical Analysis

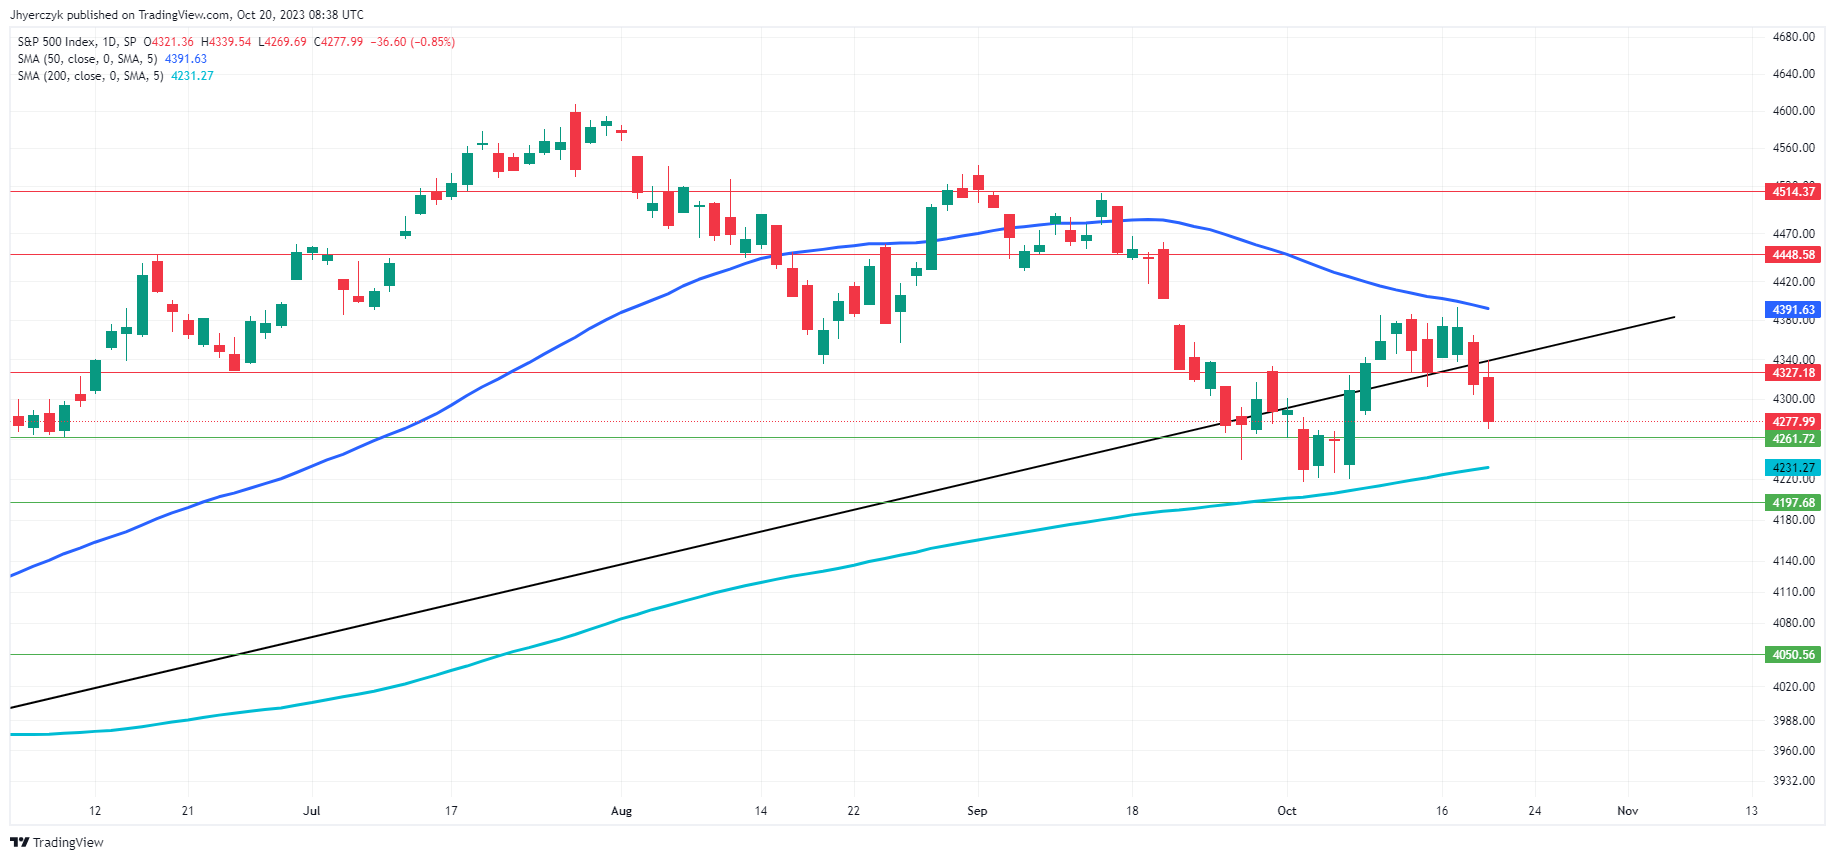
Daily S&P 500 IndexThe S&P 500 Index is currently trading above its 200-day moving average of 4231.27 but below its 50-day moving average of 4391.63. This indicates a mixed market sentiment: bullish in the longer term, as it’s above the 200-day moving average, but bearish in the shorter term, given its position below the 50-day moving average.

The index is also hovering near its minor support level of 4261.72. If it fails to hold this level, the index could test the main support at 4197.68. Overall, the market sentiment leans more towards caution or bearishness in the immediate term.

Oil Prices Forecast: Traders Tense as Israel-Gaza Conflict Amplifies Supply Worries

Oil Prices Forecast: Traders Tense as Israel-Gaza Conflict Amplifies Supply Worries

Overview

Oil markets are bracing for turbulence as escalating Israel-Gaza tensions compound supply concerns. Brent and U.S. West Texas Intermediate (WTI) futures posted gains, fueled by geopolitical anxieties and supply-demand dynamics.

Geopolitical Risks

Brent crude touched $93.32 a barrel, rising 1%, while WTI was up 1.6% at $90.78 per barrel as of 05:04 GMT on Friday. The Israel-Gaza conflict is stoking fears that hostilities may widen across the Middle East, a region crucial for oil production. Israeli Defence Minister Yoav Gallant’s recent comments further amplified concerns about a looming ground invasion of Gaza. Additionally, missile interceptions by the U.S. in Yemen toward Israel ratchet up regional tension, elevating crude oil risk premiums.

Trading Derivatives carries a high level of risk to your capital and you should only trade with money you can afford to lose. Trading Derivatives may not be suitable for all investors, so please ensure that you fully understand the risks involved, and seek independent advice if necessary. A Product Disclosure Statement (PDS) can be obtained either from this website or on request from our offices and should be considered before entering into a transaction with us. Raw Spread accounts offer spreads from 0.0 pips with a commission charge of USD $3.50 per 100k traded. Standard account offer spreads from 1 pips with no additional commission charges. Spreads on CFD indices start at 0.4 points. The information on this site is not directed at residents in any country or jurisdiction where such distribution or use would be contrary to local law or regulation.

Supply Cuts and Low Inventories

Beyond geopolitical events, supply cuts from top producers like Saudi Arabia and Russia are keeping the market tight. These cuts, slated to extend through year-end, are supporting oil prices alongside dwindling inventories, particularly in the United States. Washington aims to purchase 6 million barrels for its Strategic Petroleum Reserve in December and January, underscoring the urgency to bolster emergency stockpiles.

Other Market Influences

Though the U.S. temporarily lifted sanctions on OPEC member Venezuela, this policy shift hasn’t assuaged market worries. OPEC+ sources suggest that any increase in Venezuelan production would likely be gradual, offering limited immediate relief to the tense oil markets.

Short-term Forecast

Given the escalating geopolitical risks and supply constraints, the short-term outlook for oil markets is bullish. WTI could aim for late-September highs of $95.03 a barrel if it breaks resistance at $92.48, suggesting the road ahead is paved for further gains.

Technical Analysis

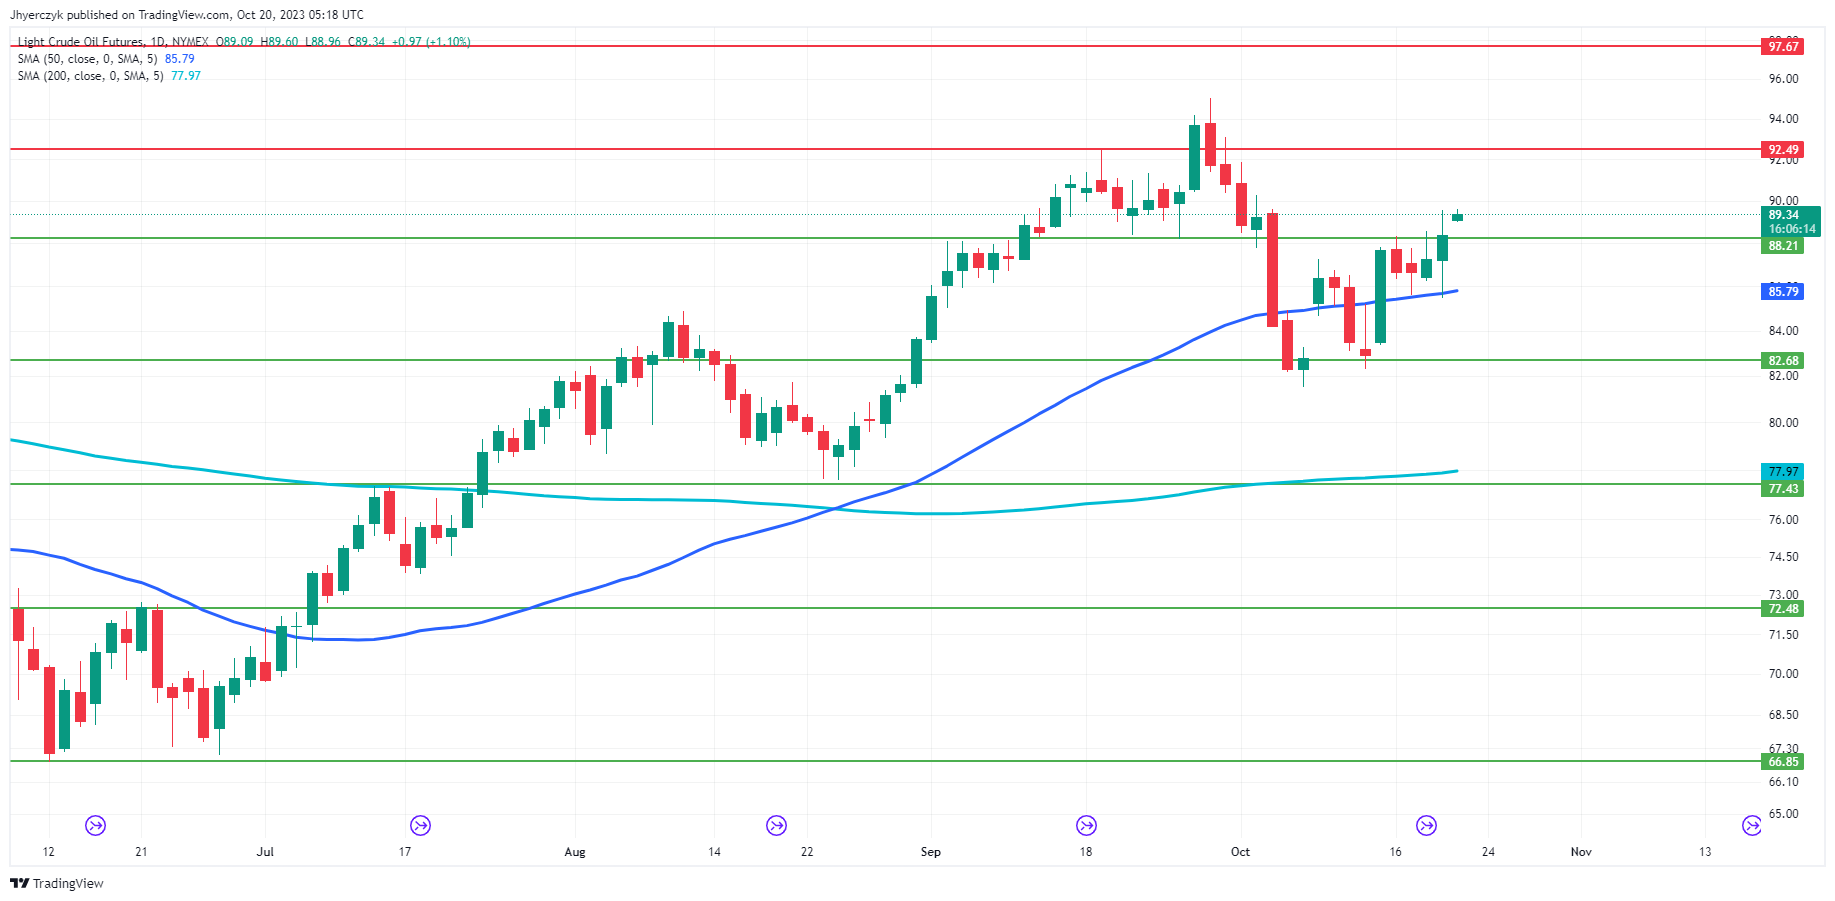
Daily Light Crude Oil FuturesLight Crude Oil Futures are trading at $89.33, which is above both the 50-day moving average of $85.79 and the 200-day moving average of $77.97. The asset is also slightly higher than the previous daily close of $88.37.

With the minor support at $88.21 and main support at $83.68 acting as strong floors, and minor and main resistance levels at $92.49 and $97.67 respectively, the market is bullish in the short term.

DAX Index: German Producer Prices, Car Registrations, and the Middle East in Focus

DAX Index: German Producer Prices, Car Registrations, and the Middle East in Focus

DAX Thursday Overview

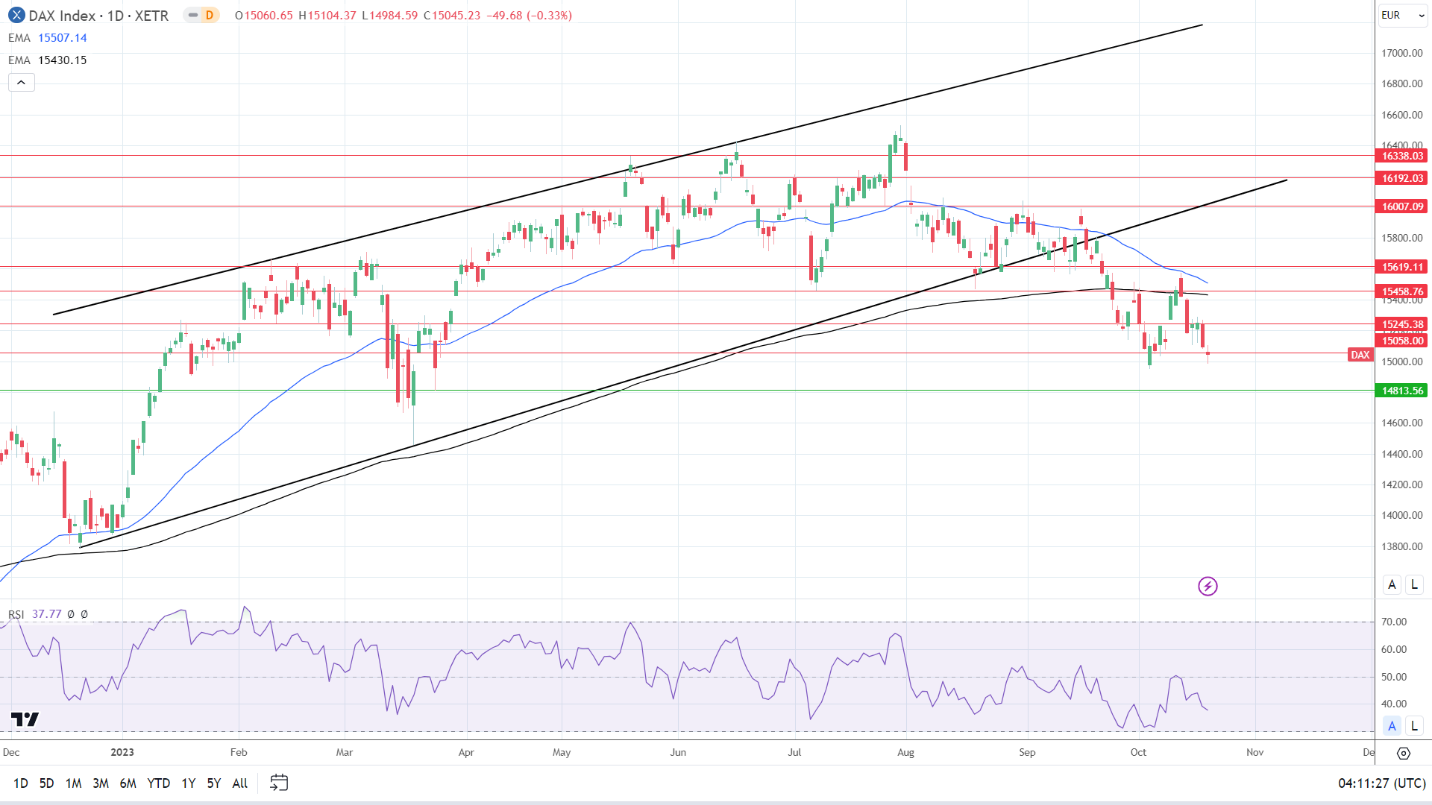
On Thursday, the DAX fell by 0.33%. Following a 1.03% slide on Wednesday, the DAX ended the day at 15,045.

Corporate Earnings and Bond Yields Left the DAX in the Red

Corporate earnings, the Middle East conflict, and uncertainty toward monetary policy weighed on riskier assets.

Trading Derivatives carries a high level of risk to your capital and you should only trade with money you can afford to lose. Trading Derivatives may not be suitable for all investors, so please ensure that you fully understand the risks involved, and seek independent advice if necessary. A Product Disclosure Statement (PDS) can be obtained either from this website or on request from our offices and should be considered before entering into a transaction with us. Raw Spread accounts offer spreads from 0.0 pips with a commission charge of USD $3.50 per 100k traded. Standard account offer spreads from 1 pips with no additional commission charges. Spreads on CFD indices start at 0.4 points. The information on this site is not directed at residents in any country or jurisdiction where such distribution or use would be contrary to local law or regulation.

US jobless claims signaled a tighter US labor market. Tight labor market conditions support a more hawkish Fed interest rate trajectory to curb wage growth and spending. Dovish Fed chatter has eased bets on a Fed rate hike. However, the Fed is signaling a higher-for-longer rate path to tackle inflation.

10-year US Treasuries rose to 4.996% on Thursday, impacting the equity markets. Fed Chair Powell spoke after the European closing bell but failed to support the appetite for US-listed stocks.

The Dow and the S&P 500 fell by 0.75% and 0.86%. The Nasdaq Composite Index declined by 0.96%

The Thursday Market Movers

The continued uptrend in US Treasury yields weighed on tech stocks. Infineon tech was among the worst performers, sliding by 3.39%.

Auto stocks also suffered heavy losses as investors reacted to disappointing earnings from Renault. Continental tumbled by 4.45%, with BMW sliding by 2.66%. Volkswagen and Daimler Truck Holding saw losses of 2.16% and 2.13%. Porsche and Mercedes Benz Group ended the session down 1.23% and 1.14%.

However, SAP rallied 5.07% on the Q3 earnings beat.

Friday Focus: German PPI Numbers and the Middle East

German producer prices will draw investor interest on Friday. Economists forecast producer prices to increase by 0.4% in September (Aug: +0.3%). However, economists predict producer prices to decline by 14.2% year-over-year (Aug: -12.6%). An unexpected monthly fall in producer prices would fuel fears about a German recession. A fall in producer prices would reflect a weak demand environment.

German car registration numbers also warrant consideration. Another rise in registrations may signal an improving consumer sentiment trend.

Away from the numbers, ECB Executive Board member Elizabeth McCaul is on the calendar to speak on Friday. Support for further interest rate hikes would test the buyer appetite for DAX-listed stocks.

However, investors must monitor news updates from the Middle East. An escalation in the conflict would affect market risk appetite.

Fed Speakers to Wrap Up a Busy Week

FOMC commentary warrants consideration on Friday. FOMC member Patrick Harker is on the calendar to speak. A dovish outlook on interest rates would support the appetite for riskier assets. This week, Patrick Harker favored a hold on interest rates, suggesting similar guidance.

FOMC member Loretta Mester will speak after the European closing bell.

The futures markets point to a testy Friday session. The DAX and the Nasdaq mini were down 77 and 43 points, respectively.

Short-Term Forecast

German recession jitters and Fed policy uncertainty remain headwinds for the DAX. The Middle East conflict and the threat of other nations joining the conflict add to the negative bias for riskier assets. The market mood exposes the DAX to disappointing corporate earnings and sub-15,000.

DAX Technical Indicators

Daily Chart

The DAX sat below the 50-day and 200-day EMAs, affirming bearish price signals.

A drop below 15,000 would support a move toward the 14,814 support level. Weak German producer prices, corporate earnings, and the Middle East conflict remain focal points. A break above the 15,058 resistance level would support a move toward the 15,245 resistance level.

A de-escalation in the Middle East conflict and better-than-expected corporate earnings would support a positive session.

The 14-day RSI reading of 37.77 suggests a DAX drop below 15,000 before entering oversold territory.

DAX Daily Chart sends bearish price signals.
DAX 201023 Daily Chart

4-Hourly Chart

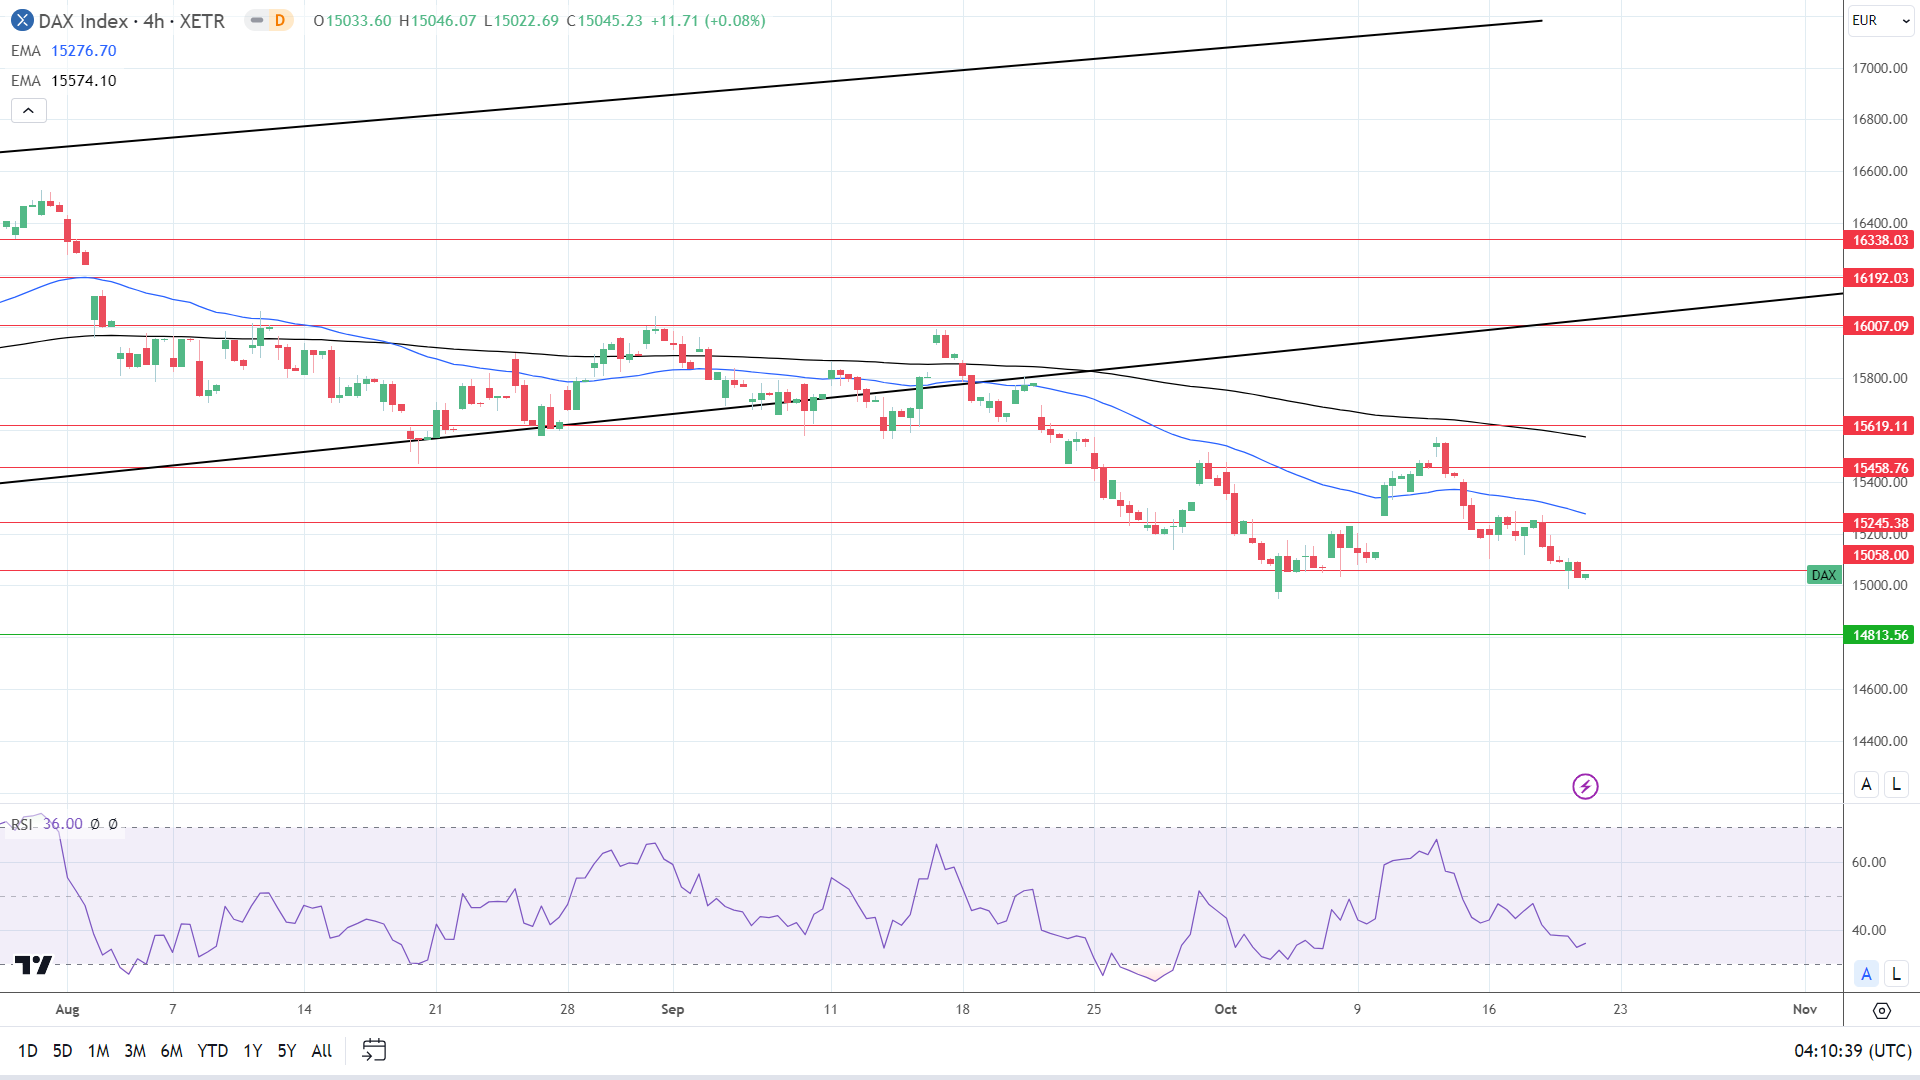
The DAX rests below the 50-day and 200-day EMAs, reaffirming bearish price signals. A DAX above the 15,058 resistance level would support a move toward the 15,245 resistance level and 50-day EMA.

However, a fall below 15,000 would give the bears a run at the 14,814 support level.

The 36.00 14-4 hour RSI reading suggests a DAX fall below 15,000 before entering oversold territory.

4-Hourly Chart affirms bearish price signals.
DAX 201023 4-Hourly Chart
EUR/USD Forecast: German Producer Prices and Central Bank Chatter in Focus

EUR/USD Forecast: German Producer Prices and Central Bank Chatter in Focus

Thursday Overview

On Thursday, the EUR/USD gained 0.43%. Reversing a 0.38% loss from Wednesday, the EUR/USD ended the day at $1.05823. The EUR/USD fell to a low of $1.0581 before rising to a high of $1.06164.

German Producer Prices and the ECB in Focus

The German economy is in the spotlight again on Friday. German producer prices will give investors a snapshot of the demand environment across the manufacturing sector. If producer prices unexpectedly decline, the numbers could further contribute to the pessimistic outlook for the German economy.

Trading Derivatives carries a high level of risk to your capital and you should only trade with money you can afford to lose. Trading Derivatives may not be suitable for all investors, so please ensure that you fully understand the risks involved, and seek independent advice if necessary. A Product Disclosure Statement (PDS) can be obtained either from this website or on request from our offices and should be considered before entering into a transaction with us. Raw Spread accounts offer spreads from 0.0 pips with a commission charge of USD $3.50 per 100k traded. Standard account offer spreads from 1 pips with no additional commission charges. Spreads on CFD indices start at 0.4 points. The information on this site is not directed at residents in any country or jurisdiction where such distribution or use would be contrary to local law or regulation.

Economists forecast producer prices to increase 0.4% in September (Aug: +0.3%). However, economists predict producer prices to decline by 14.2% year-over-year (Aug: -12.6%).

Euro area car registration numbers for September also warrant consideration. A slide in car registrations would add to the negative outlook for the euro area economy.

Beyond the numbers, ECB commentary may move the dial. ECB Executive Board member Elizabeth McCaul is on the calendar to speak on Friday. Comments favoring a higher-for-longer rate path would support buyer demand.

However, news updates on the Middle East conflict will continue to impact the global financial markets. An escalation in the conflict would fuel demand for the US dollar.

FOMC Members to Conclude a Busy Week for the US Dollar

The Fed pivot away from a rate hike is almost complete. On Thursday, Fed Chair Powell poured ice water on expectations of a Fed interest rate hike. However, Powell left the door ajar for more rate hikes, leaving the onus on FOMC members to close the door.

FOMC members Patrick Harker and Loretta Mester are on the calendar to speak on Friday. Dovish comments on interest rate plans will likely test the buyer appetite for the US dollar.

In recent speeches, Patrick Harker leaned in favor of holding rates unchanged. Loretta Mester must deliver a convincing case to hike rates to impact the EUR/USD.

Short-Term Forecast:

Near-term EUR/USD trends hinge on market sentiment toward the euro area economy and central bank guidance. With the US economy in better shape, the EUR/USD may face strong resistance at $1.06. The Middle East conflict is another consideration.

EUR/USD Price Action

Daily Chart

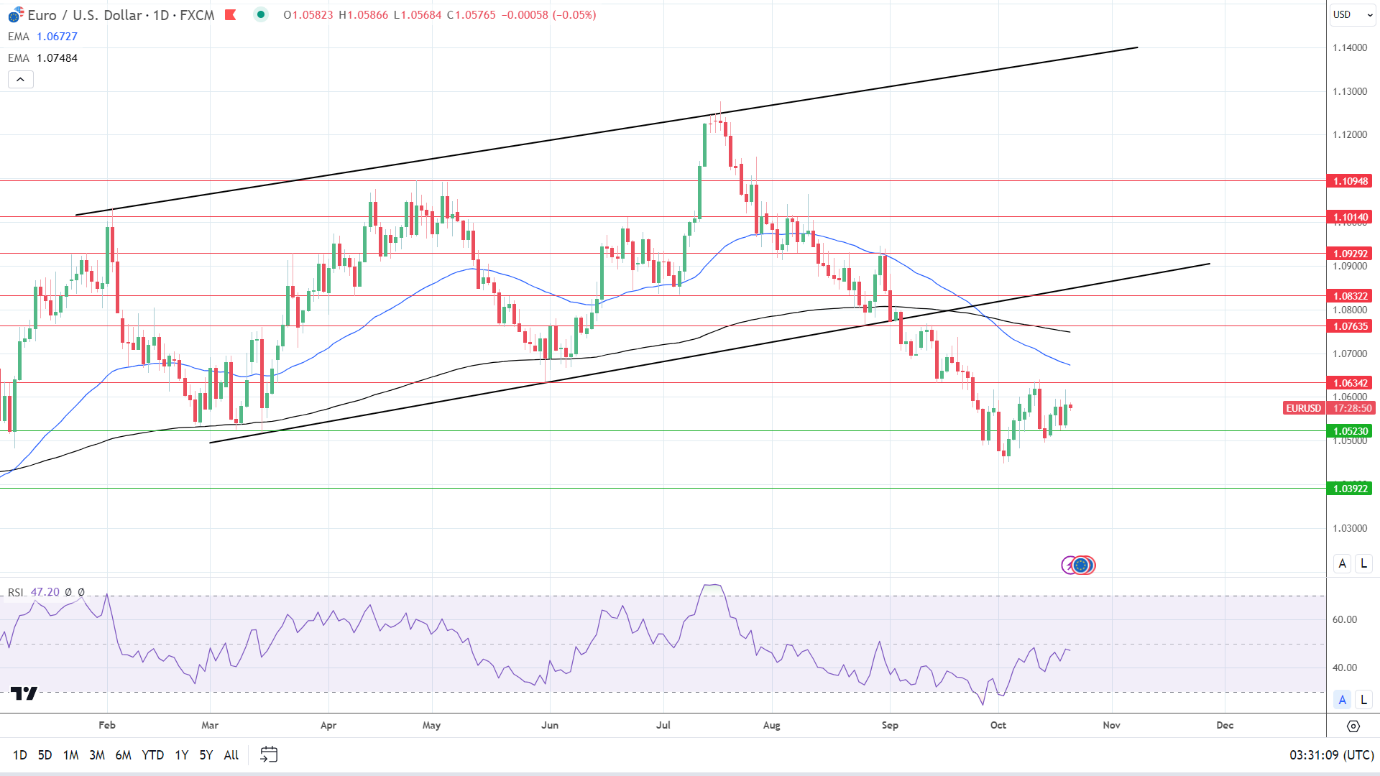
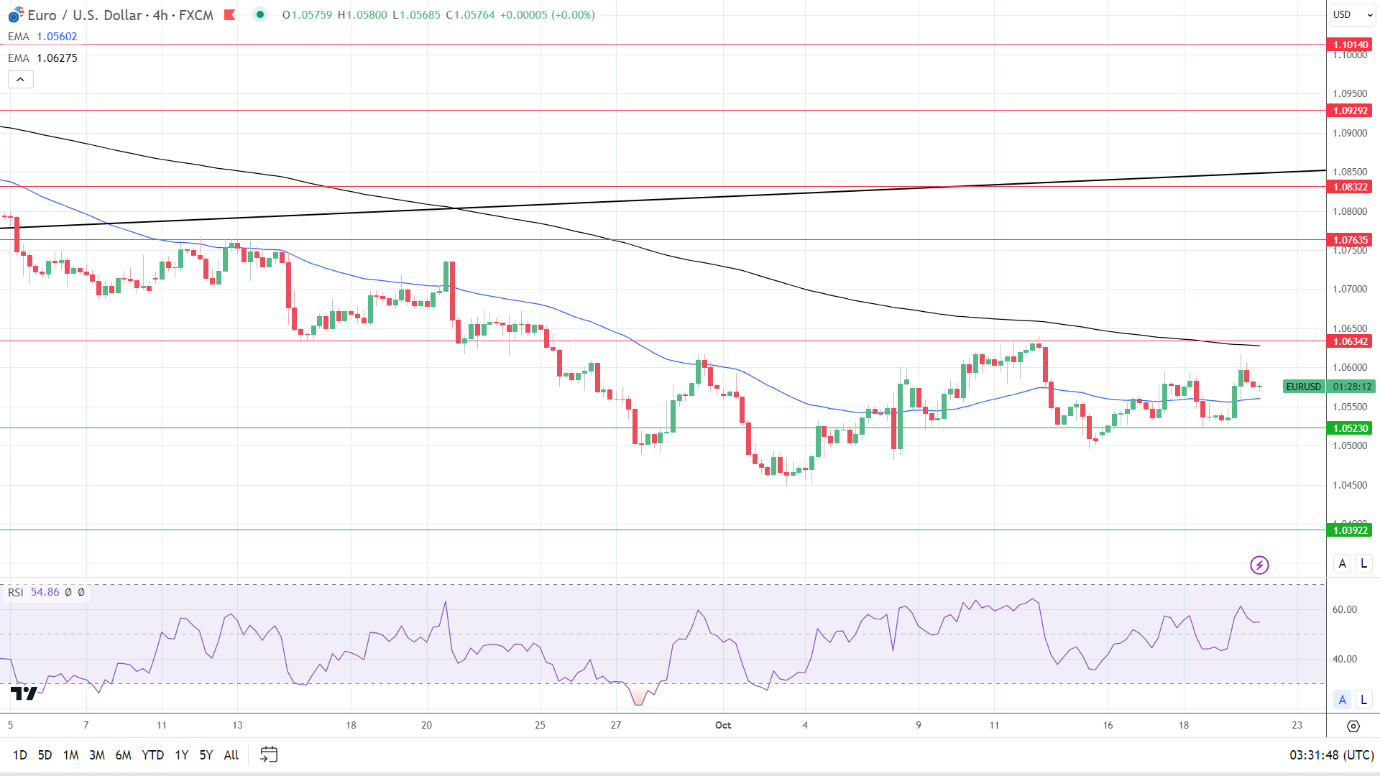
The EUR/USD sat below the 50-day and 200-day EMAs, affirming bearish price signals.

A EUR/USD break above the $1.06342 resistance level would give the bulls a run at the 50-day EMA.

Better-than-expected German producer prices and dovish Fed comments would support a positive session.

However, an escalation in the Middle East conflict or a slide in German producer prices would impact the buyer appetite for the EUR/USD.

A EUR/USD drop below $1.05500 would bring the $1.05230 support level into play.

The 14-period Daily RSI, 47.20, suggests a EUR/USD break below the $1.05230 support level before entering oversold territory.

EUR/USD Daily Chart sends bearish price signals.
EURUSD 201023 Daily Chart

4-Hour Chart

The EUR/USD holds above the 50-day EMA while hovering below the 200-day EMA, sending bullish near-term but bearish longer-term price signals.

A EUR/USD return to $1.06 would support a move to the 200-day EMA and $1.06342 resistance level. However, the EUR/USD may face selling pressure at the $1.06342 resistance level. The 200-day EMA is confluent with the resistance level,

A break below the 50-day EMA would bring the $1.05230 support level into play.

The 14-period RSI on the 4-hour chart, 54.86, suggests a EUR/USD move to the 200-day EMA before entering overbought territory.

4-Hourly Chart sends bullish near-term price signals.
EURUSD 201023 4 Hourly Chart
Silver Prices Forecast: Bullish Outlook for XAG/USD as Geopolitics and Fed Policy Intersect

Silver Prices Forecast: Bullish Outlook for XAG/USD as Geopolitics and Fed Policy Intersect

Overview

Silver (XAG/USD) prices, influenced by heightened geopolitical tensions and monetary policy speculations, are on track to record their second weekly gain. Investor sentiment has been significantly impacted by the Middle East conflict and the Federal Reserve’s ambiguous stance on future rate hikes.

Geopolitical Influence

The Israeli Defense Minister’s statements on the escalating Middle East conflict have fueled investor concerns over a broader regional crisis. These geopolitical uncertainties have propelled silver, a traditional safe haven, to gain 0.68% this week.

Trading Derivatives carries a high level of risk to your capital and you should only trade with money you can afford to lose. Trading Derivatives may not be suitable for all investors, so please ensure that you fully understand the risks involved, and seek independent advice if necessary. A Product Disclosure Statement (PDS) can be obtained either from this website or on request from our offices and should be considered before entering into a transaction with us. Raw Spread accounts offer spreads from 0.0 pips with a commission charge of USD $3.50 per 100k traded. Standard account offer spreads from 1 pips with no additional commission charges. Spreads on CFD indices start at 0.4 points. The information on this site is not directed at residents in any country or jurisdiction where such distribution or use would be contrary to local law or regulation.

Federal Reserve Factors

Fed Chair Jerome Powell’s recent comments have eased market fears about immediate rate hikes. Though he highlighted the central bank’s commitment to its 2% inflation target, Powell sidestepped making concrete policy predictions, leading to subdued rate hike expectations for the remainder of the year.

Economic Indicators

Notably, Powell acknowledged the declining pace of inflation and a tight labor market, but remained noncommittal on future policy direction. Market data suggests slowing inflation and robust job creation, giving the Fed room for deliberation on its next move.

Short-Term Outlook

Given the Fed’s cautious stance and ongoing geopolitical risks, silver is likely to remain a bullish asset in the short term, particularly as higher interest rates increase the opportunity cost of holding the metal.

By aligning market expectations and geopolitical events, silver’s current trajectory seems resilient against potential downturns, keeping the short-term outlook bullish.

Technical Analysis


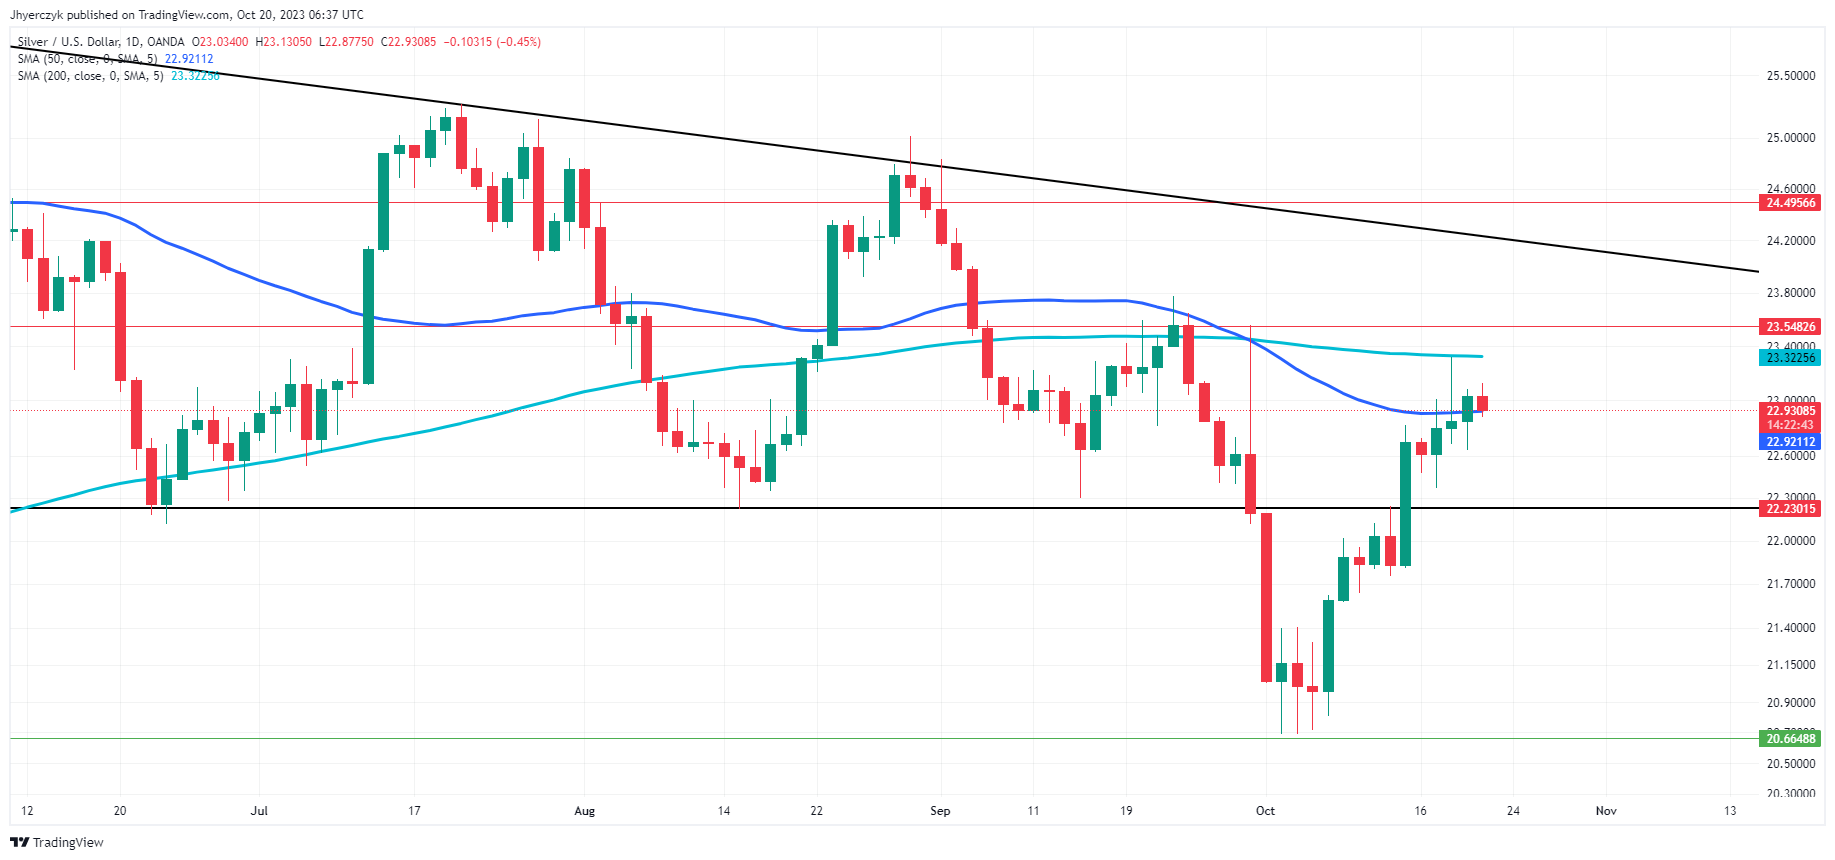
Daily Silver (XAG/USD)The current daily price of Silver (XAG/USD) at $22.95 is slightly above its 50-day moving average of $22.92, indicating a potential for short-term bullish momentum. However, it remains below the 200-day moving average of $23.32, suggesting a longer-term bearish outlook.

The asset is trading within a narrow range defined by trend line support at $22.23 and resistance at $24.24. Breaking either of these could trigger an acceleration in the respective direction.

Additionally, the market is hovering near minor resistance at $22.55, which could serve as a crucial pivot point. Based on these technical indicators, the market sentiment appears cautiously bullish in the short term but requires breaking above key resistance levels for confirmation.

Gold Prices Forecast: XAU/USD Surges as Middle East Tensions, Fed Uncertainty Loom

Gold Prices Forecast: XAU/USD Surges as Middle East Tensions, Fed Uncertainty Loom

Gold’s Safe Haven Status Reaffirmed

Amid escalating tensions in the Middle East and an uncertain outlook from the Federal Reserve, gold (XAU/USD) prices are rallying.

Spot gold and December Comex gold futures both notched gains, echoing the precious metal’s reputation as a go-to safe haven during geopolitical unrest. Israeli Defense Minister Yoav Gallant’s recent comments hint at a ground invasion into Gaza, fueling fears of a broader regional conflict and boosting safe-haven buying of gold.

Trading Derivatives carries a high level of risk to your capital and you should only trade with money you can afford to lose. Trading Derivatives may not be suitable for all investors, so please ensure that you fully understand the risks involved, and seek independent advice if necessary. A Product Disclosure Statement (PDS) can be obtained either from this website or on request from our offices and should be considered before entering into a transaction with us. Raw Spread accounts offer spreads from 0.0 pips with a commission charge of USD $3.50 per 100k traded. Standard account offer spreads from 1 pips with no additional commission charges. Spreads on CFD indices start at 0.4 points. The information on this site is not directed at residents in any country or jurisdiction where such distribution or use would be contrary to local law or regulation.

Uncertainty Around Fed Policy

Investors are also keeping a close eye on the Federal Reserve. Chairman Jerome Powell’s recent speech to the Economic Club of New York provided neither a clear bullish nor bearish signal on interest rates. While Powell didn’t entirely rule out further rate hikes, the market interpreted his remarks as diminishing the likelihood of immediate action. This sentiment led to a reduction in futures market bets on a November or even December rate hike.

Powell’s Inflation Watch

Despite acknowledging some progress in curbing inflation, Powell remained steadfast in pursuing the central bank’s 2% inflation target. In his remarks, Powell underlined that although the pace of inflation has decelerated, it is still too early to claim victory. A series of interest rate hikes since March 2022 has managed to bring the benchmark rate to its highest in 22 years. The market, however, anticipates the Fed might go easy on additional rate hikes.

Gold and the Rising Benchmark Rate

Higher interest rates usually increase the opportunity cost of holding non-yielding assets like gold. Dallas Fed President Lorie Logan hinted that the central bank is in no rush to change its current policy, corroborated by the CME FedWatch tool showing market expectations for the Fed to maintain current rates.

Short-Term Outlook

Given the murky waters surrounding the Fed’s future policies and mounting geopolitical tensions, the short-term outlook for gold is bullish. Investors are likely to continue flocking to this safe haven until there’s more clarity on both fronts.

Technical Analysis

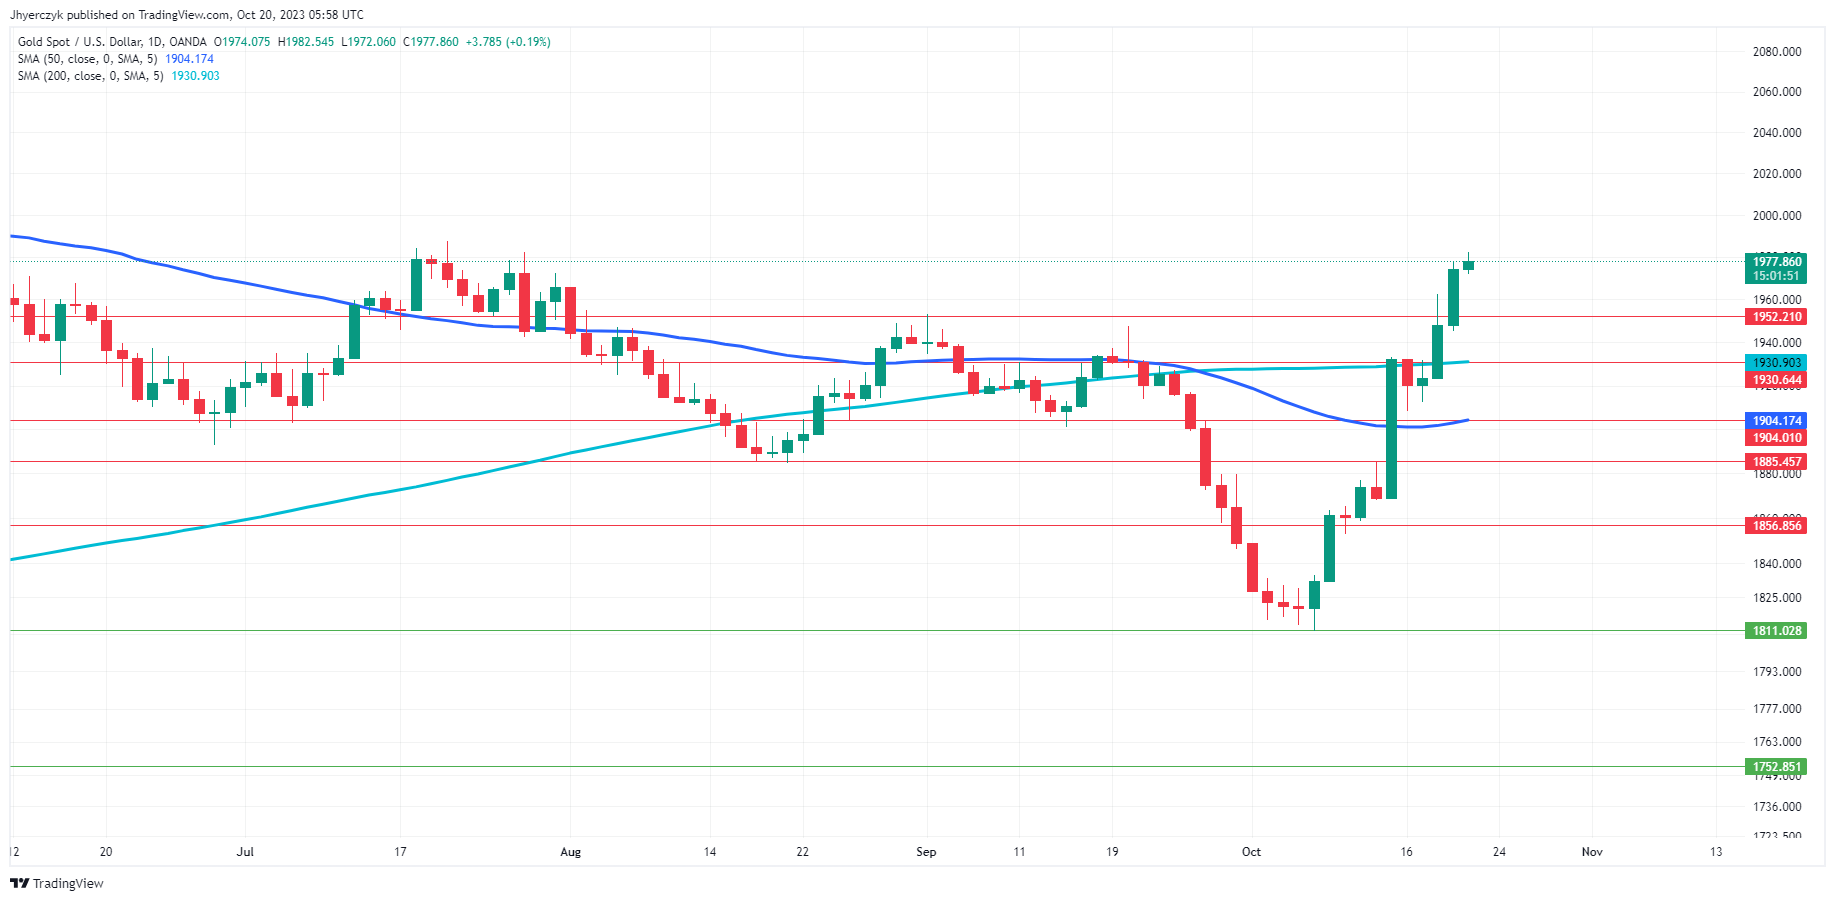
Daily Gold (XAU/USD)The current daily price of Gold (XAU/USD) at 1978.36 is trading above both the 200-day moving average of 1930.90 and the 50-day moving average of 1904.17, indicating bullish momentum.

The asset has also surpassed both minor and main resistance levels at 1952.21 and 1930.64, respectively, reinforcing the bullish sentiment.

Surpassing key resistance levels and trading above major moving averages usually signals a strong uptrend. Given this data, the market sentiment for gold appears to be decidedly bullish.

UK Retail Sales Fall by 0.9% in September, Sending Recession Signals

UK Retail Sales Fall by 0.9% in September, Sending Recession Signals

UK Retail Sales

UK retail sales declined by 0.9% in September after rising by 0.4% in August. Retail sales ex-fuel slid by 1.0% vs. +0.6% in August. Economists forecast retail sales and retail sales ex-fuel to fall by 0.2% and 0.4%, respectively.

Trading Derivatives carries a high level of risk to your capital and you should only trade with money you can afford to lose. Trading Derivatives may not be suitable for all investors, so please ensure that you fully understand the risks involved, and seek independent advice if necessary. A Product Disclosure Statement (PDS) can be obtained either from this website or on request from our offices and should be considered before entering into a transaction with us. Raw Spread accounts offer spreads from 0.0 pips with a commission charge of USD $3.50 per 100k traded. Standard account offer spreads from 1 pips with no additional commission charges. Spreads on CFD indices start at 0.4 points. The information on this site is not directed at residents in any country or jurisiction where such distribution or use would be contrary to local law or regulation.

  • Non-food store sales volumes fell by 1.9%. Retailers attributed the fall to higher living costs and warm weather.
  • Non-store retailing declined by 2.2%.
  • However, food store sales increased by 0.2%, with automotive fuel sales rising by 0.8%.
  • In the third quarter, retail sales were down 0.8% compared with the previous quarter.

The larger-than-expected fall in retail sales supports increasing fear of a UK economic recession. An elevated interest rate environment has affected the UK housing market and consumer sentiment. Sticky inflation and softer wage growth combined with the housing sector woes suggest a pullback in consumption. UK private consumption contributes over 60% to the UK economy.

Notably, the retail sales figures may ease pressure on the Bank of England to raise interest rates. Softer wage growth may force consumers to cut spending on non-essential items, easing demand-driven inflationary pressures.

GBP/USD Reaction to the UK Retail Sales Report

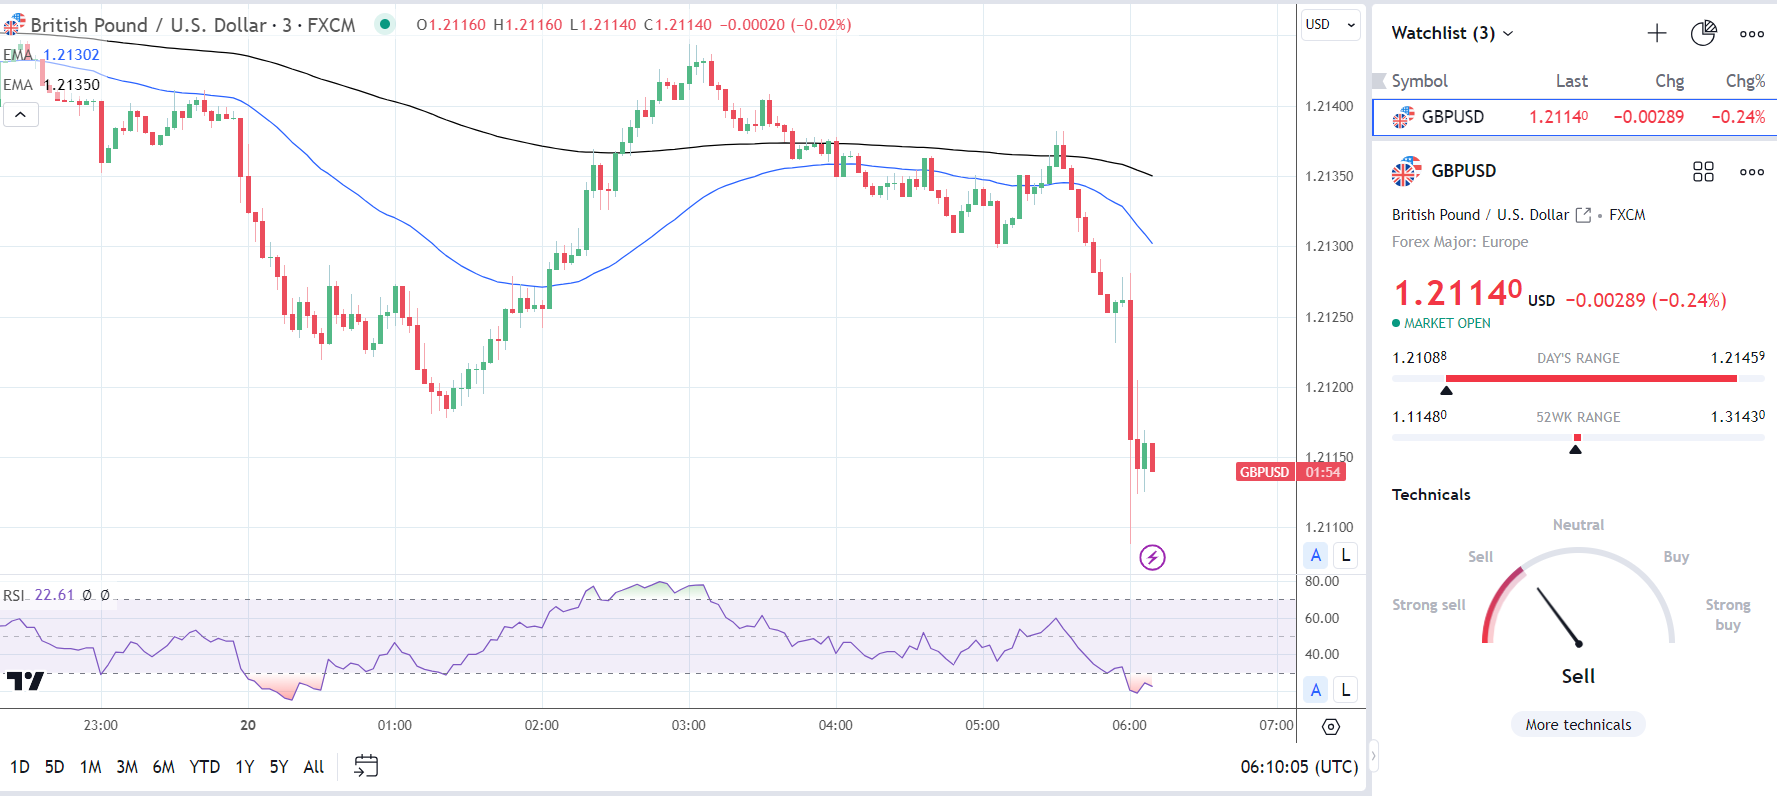
Before the retail sales report, the GBP/USD rose to a high of $1.21459 before declining to a low of $1.21178.

However, in response to the retail sales figures, the GBP/USD rose to a high of $1.21281 before sliding to a low of $1.21088.

This morning, the GBP/USD was down 0.24% to $1.21140.

GBP/USD reacts to UK Retail Sales slide.
201023 GBPUSD 3 Minute Chart

Next Up

FOMC members Patrick Harkin and Loretta Mester are on the calendar to speak. Dovish outlooks toward Fed interest rate moves could impact the buying appetite for the US dollar.

In recent speeches, Patrick Harker favored leaving interest rates unchanged at the next meeting. There are no US economic indicators for investors to consider on Friday.

US Dollar Setups: EUR/USD Battles Channel Resistance while USD/JPY Stays Put

US Dollar Setups: EUR/USD Battles Channel Resistance while USD/JPY Stays Put

EUR/USD FORECAST – TECHNICAL ANALYSIS

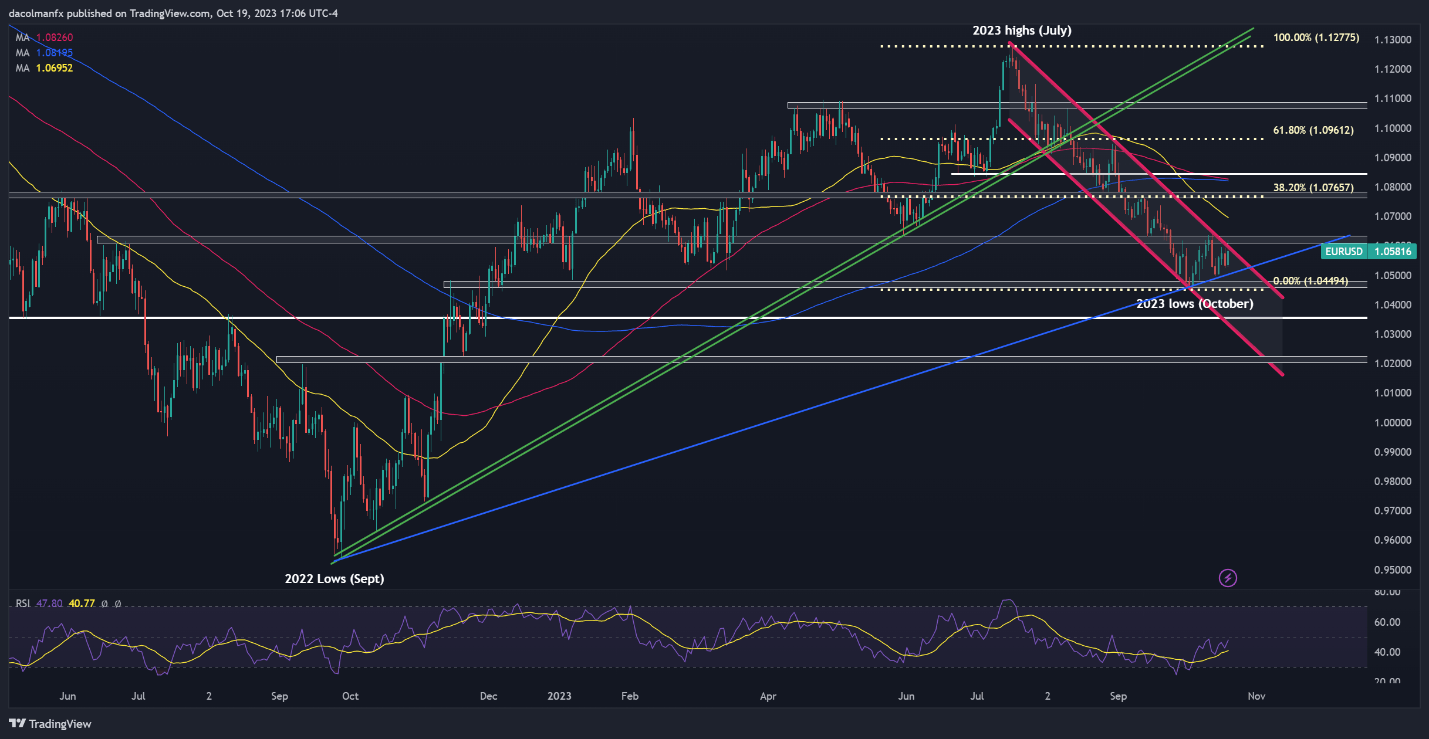
EUR/USD rebounded on Thursday after a subdued performance during the previous trading session, but gains were capped by soaring U.S. Treasury rates, a hostile market environment that appears to have prevented the pair from clearing technical resistance around the 1.0600 handle.

With U.S. yields on a bullish tear and geopolitical tensions in the Middle East on the rise, the euro will struggle to maintain a sustained upward course. This means that the direction of travel is likely to be lower for the exchange rate.

In terms of technical analysis, if EUR/USD fails to push higher and resumes its decline, we could see a move towards trendline support at 1.0500. This floor could provide stability and ease the selling pressure, but if it caves in, prices could be on their way to the 2023 lows at 1.0448. On further weakness, the focus shifts to 1.0350.

Conversely, if sentiment shifts in favor of the bulls and EUR/USD takes out overhead resistance at 1.0600/1.0625, buyers may regain control of price action, paving the way for a rally towards 1.0765, the 38.2% Fibonacci retracement of the July/October slump.

Eager to gain insights into the euro’s future direction and the fundamental drivers that will shape the outlook in the months ahead? Explore the details in our free Q4 trading forecast!

EUR/USD TECHNICAL CHART

A screen shot of a graph  Description automatically generated

USD/JPY FORECAST – TECHNICAL ANALYSIS

USD/JPY lacked directional conviction on Thursday, despite the surge in U.S. rates. While rising U.S. Treasury yields offered support to the U.S. dollar, the yen experienced heightened demand due to escalating geopolitical tensions in the Middle East. This juxtaposition created a neutral trading environment for the exchange rate. Although both the yen and the U.S. dollar are commonly perceived as safe-haven assets, the yen tends to be favored during periods of elevated market uncertainty.

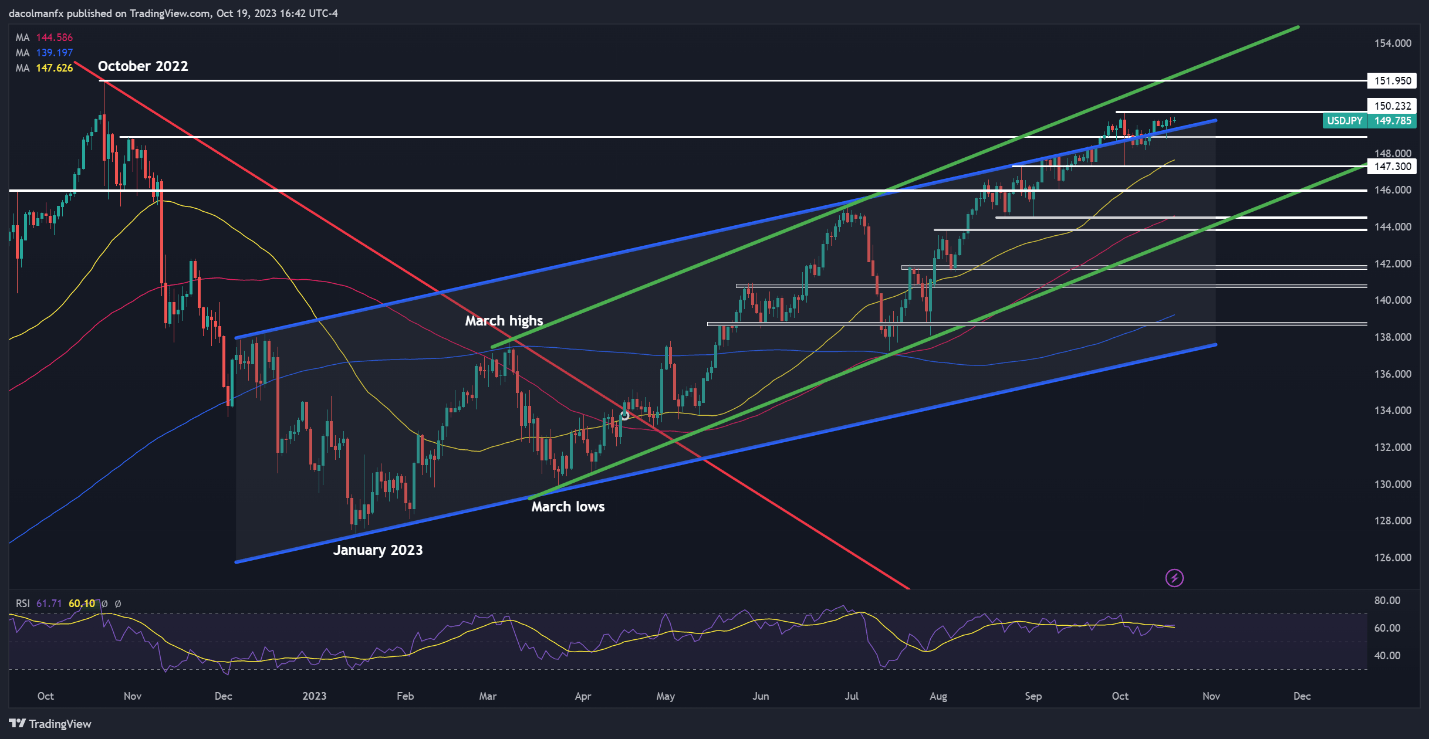
From a technical analysis perspective, USD/JPY remains firmly entrenched in a robust uptrend, although it appears to be undergoing a phase of consolidation at the moment. In any case, caution is warranted given the pair’s proximity to the critical 150.00 level. In 2022 and 2023, the Japanese government took steps to defend the country’s currency against further depreciation when this threshold was breached.

In the event that Tokyo decides not to intervene for now and USD/JPY breaks above 150.00 decisively, upward momentum could gather pace, setting the stage for a rally towards the 2022 highs at 151.95. On further strength, the bulls may muster the impetus to challenge channel resistance near 152.30.

On the other hand, if prices get rejected lower and initiate a pullback, initial support is found within the range of 149.25 to 148.90. Clearing this floor might attract fresh sellers to the market, creating favorable conditions for a potential descent toward 147.30, followed by 146.00.

For a thorough analysis of the Japanese yen’s fundamental and technical prospects, download the Q4 trading forecast today.

USD/JPY TECHNICAL CHART

A screen shot of a graph  Description automatically generated


Japanese Yen Scoping 150 Plus as US Dollar Consolidates. Higher USD/JPY?

Japanese Yen Scoping 150 Plus as US Dollar Consolidates. Higher USD/JPY?

USD/JPY is nervously nudging toward 150 with markets wary of potential intervention from the Bank of Japan (BoJ) should the Yen rapidly weaken.

The US Dollar has been clocking up the gains against most currencies this week with Treasury yields racing to new heights, particularly in the back end of the curve.

These moves have seen the closely watched 2s 10s yield curve become less inverted in what is referred to as a bear steepening. It is called this due to the capital loss seen on the 10-year bond as its yield goes higher.

At the same time, Japanese Government Bond (JGB) yields have also edged up, testing the bandwidth that the BoJ will allow as they try to maintain yield curve control, albeit with some flexibility.

10-year JGBs nudged 0.86% overnight and remain near there going into Friday’s trading session, the highest yield on the bond since 2013.

At the same time, the 10-year Treasury note eclipsed 5.00% yesterday and has out-accelerated the JGB yield increase, potentially further underpinning USD/JPY as illustrated in the chart below.

USD/JPY AND JP-US 10-YEAR BOND SPREAD
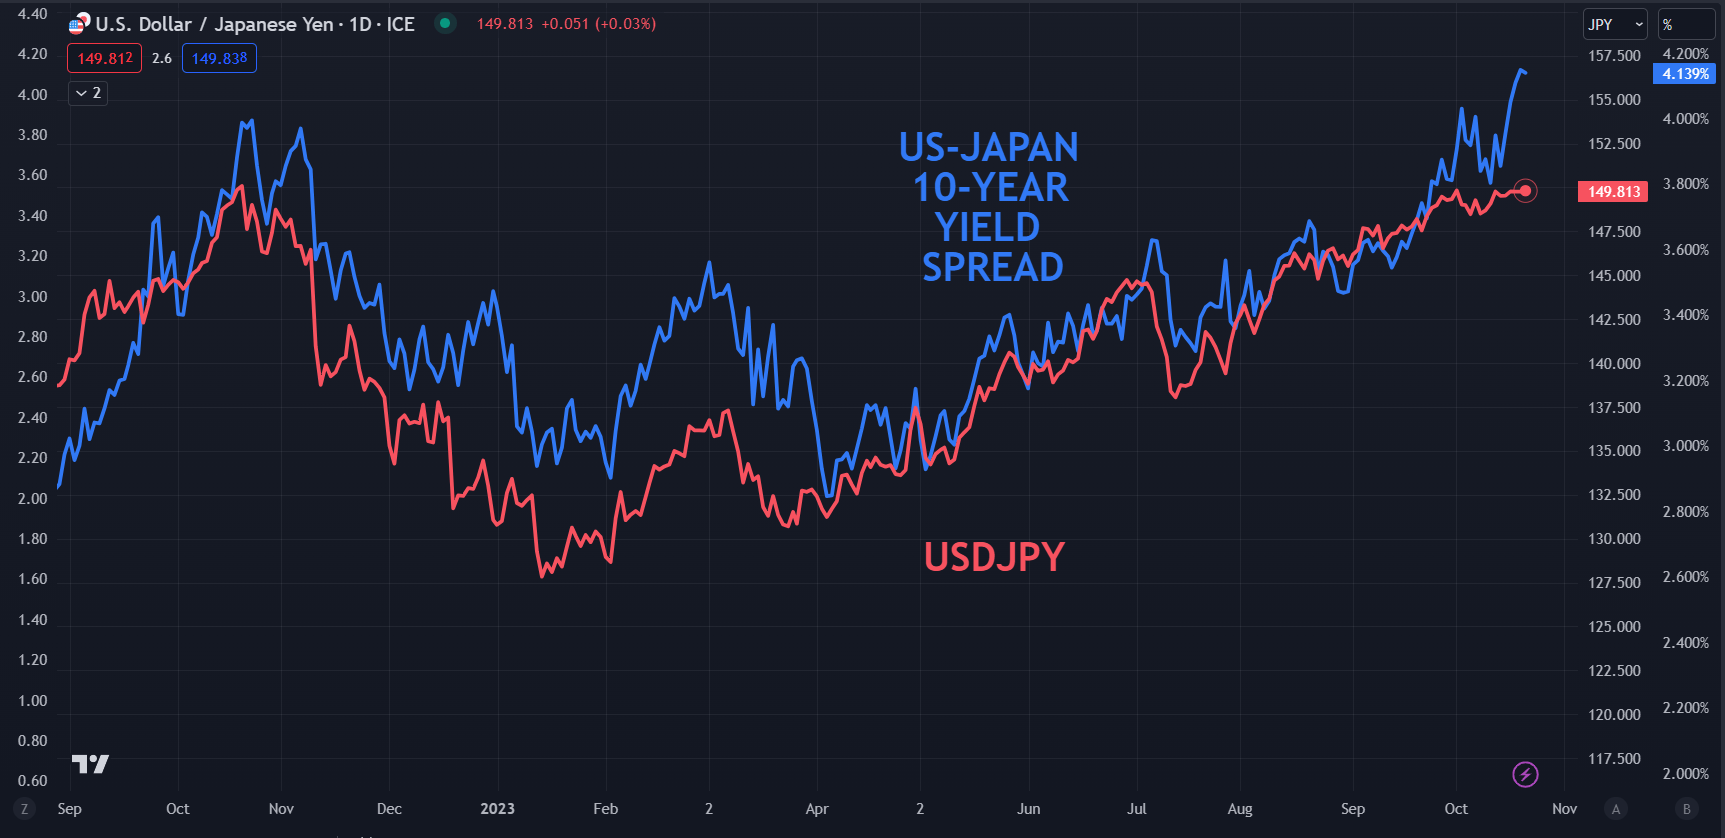
image1.png

The BoJ will hold its monetary policy meeting on October 31st and the market is speculating on further tightening.

The BoJ has a policy rate of -0.10% and is maintaining yield curve control (YCC) by targeting a non-specific band around zero for Japanese Government Bonds (JGBs) out to 10 years.

The band was previously of +/- 0.50% before the bank changed tack and introduced some flexibility.

Many market participants are looking toward a possible shift in YCC but the zero interest rate policy might also come under the microscope after comments by a former board member at the BoJ, Makoto Sakurai on Thursday.

He said that he thinks that the bank is more likely to abandon negative interest rates before any further adjustments to YCC.

Mr Sakurai noted last year that the bank might loosen YCC controls months before the BoJ adjusted it.

In any case, the yield differential appears to be supportive of USD/JPY for now, but the question remains, will the BoJ sell USD/JPY if it breaks higher?

USD/JPY TECHNICAL ANALYSIS UPDATE

USD/JPY is inching closer to the 12-month high seen earlier this month at 150.16. A break above there could see a run toward the 33-year peak seen at this time last year at 151.95.

A bullish triple moving average (TMA) formation requires the price to be above the short-term SMA, the latter to be above the medium-term SMA and the medium-term SMA to be above the long-term SMA. All SMAs also need to have a positive gradient.

When looking at any combination of the 10-, 21-, 34-, 55-, 100- and 200-day SMAs, the criteria for a TMA have been met and might suggest that bullish momentum is evolving. For more information on trend trading, click on the banner below.

On the downside, support may lie at the recent lows near 147.30 and 145.90 or further down at the breakpoints in the 145.05 – 145.10 area ahead of the prior lows near 144.50 and 141.50.
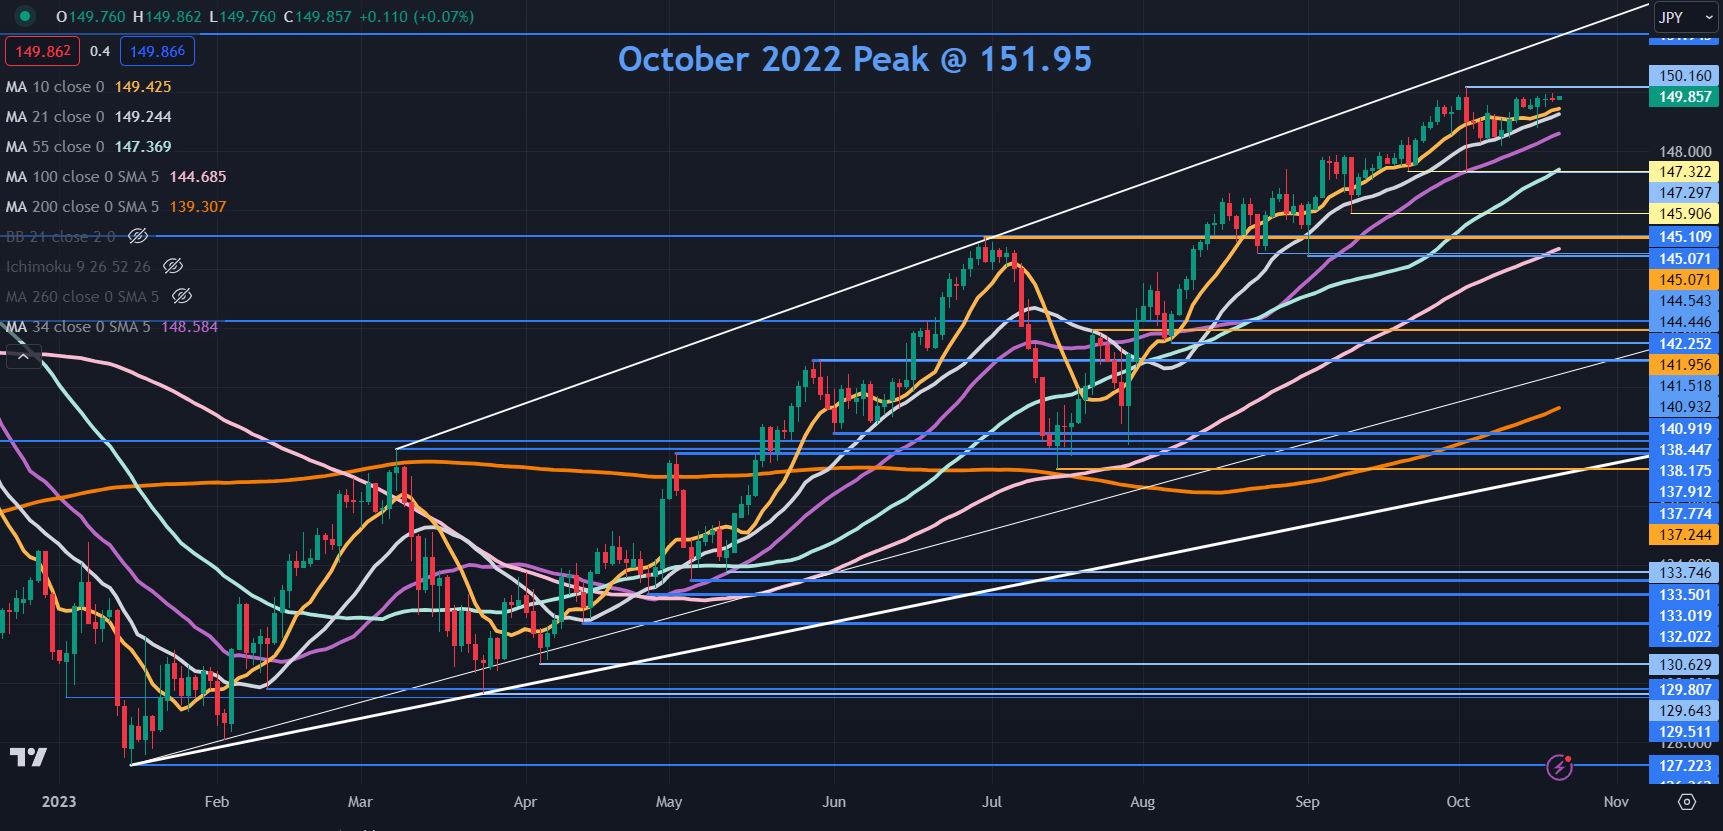

image2.png