Gold Prices Forecast: XAU/USD Defies Rising Treasury Yields Amid Middle East Tensions

Gold Prices Forecast: XAU/USD Defies Rising Treasury Yields Amid Middle East Tensions

Mixed Economic Indicators and Interest Rate Speculation

Gold (XAU/USD) prices are proving resilient despite the tug-of-war between a strong U.S. dollar and climbing Treasury yields. Hovering near a 2.5-month high, the precious metal is basking in its role as a safe-haven asset, thanks to increasing Middle East tensions. Investors are closely monitoring Fed Chair Jerome Powell’s upcoming speech for further cues on interest rate policy.

Impact of Domestic Data on Market Outlook

On the domestic front, recent economic data has shown mixed signals. Housing starts were slower than expected in September, while retail sales exceeded forecasts. These developments have thrown some investors into a state of caution regarding the trajectory of interest rates. Meanwhile, markets are pricing in a 94% chance of rate stabilization in the Fed’s November 1 meeting, although speculation of a December hike has gained traction.

Trading Derivatives carries a high level of risk to your capital and you should only trade with money you can afford to lose. Trading Derivatives may not be suitable for all investors, so please ensure that you fully understand the risks involved, and seek independent advice if necessary. A Product Disclosure Statement (PDS) can be obtained either from this website or on request from our offices and should be considered before entering into a transaction with us. Raw Spread accounts offer spreads from 0.0 pips with a commission charge of USD $3.50 per 100k traded. Standard account offer spreads from 1 pips with no additional commission charges. Spreads on CFD indices start at 0.4 points. The information on this site is not directed at residents in any country or jurisdiction where such distribution or use would be contrary to local law or regulation.

Gold’s Resilience Amid Rising Treasury Yields

Traders are navigating a complex landscape as Treasury yields reach fresh multi-year highs. The 10-year yield has recently eclipsed 4.9%, a level not seen since 2007, making non-yielding gold less attractive. Despite this, gold has surged nearly 8% from its seven-month low in early October, showing remarkable resilience amid an uncertain backdrop.

The Fed’s Current Stance and Market Sentiment

Fed officials have recently signaled a more dovish approach, hinting that rate hikes may be off the table for now. This comes as higher Treasury yields contribute to tightening economic conditions. Given the fluctuations in Treasury yields and the Fed’s current stance, market participants are keenly awaiting Powell’s speech for more clarity.

Short-Term Forecast: Bullish

For the short term, market sentiment leans bullish for gold, especially if geopolitical strife continues to escalate. However, a de-escalation in the Middle East and hawkish shifts from the Fed could quickly reverse these gains. Keep an eye on Powell’s upcoming remarks for further insight into the interest rate landscape.
Technical Analysis
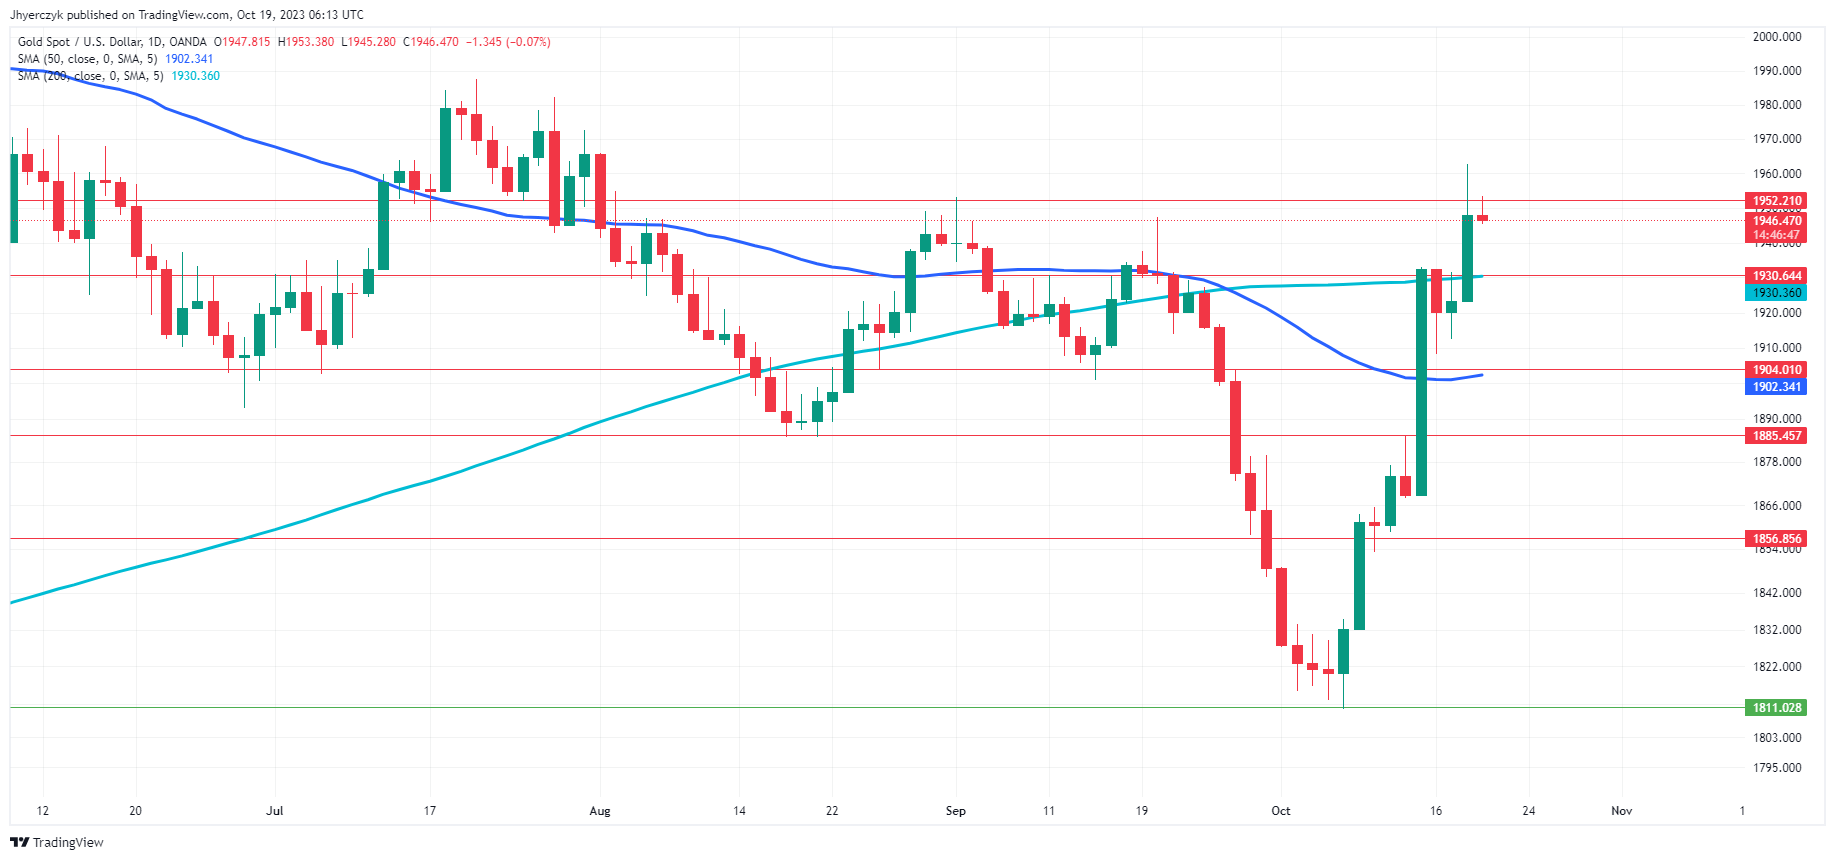
Daily Gold (XAU/USD)The current daily price of gold at 1946.37 is positioned above both the 200-day moving average of 1930.35 and the 50-day moving average of 1902.33, indicating a bullish trend in the market.

However, it is slightly below the minor resistance level of 1952.21, which could serve as a ceiling in the near term. There is a minor support at 1811.03 that serves as a downside buffer.

The fact that the daily price is above the major moving averages suggests bullish market sentiment for gold (XAU/USD).

NASDAQ Index, SP500, Dow Jones Forecasts – Stocks Retreat As Geopolitical Issues Bite

NASDAQ Index, SP500, Dow Jones Forecasts – Stocks Retreat As Geopolitical Issues Bite

SP500 is losing ground as traders focus on geopolitical issues. Oil prices are moving higher, so Fed may be forced to be more hawkish to fight inflation. The disappointing performance of Morgan Stanley stock, which is down by more than 7% after the earnings report, has also hurt market sentiment today. The pullback is broad, and the majority of market segments are moving lower. Energy stocks are among the gainers today due to rising oil prices. Consumer Defensive stocks have also enjoyed some support amid rising demand for safe-haven assets.

In case SP500 settles below the support at 4335 – 4350, it will head towards the next support level, which is located in the 4260 – 4280 range.

Trading Derivatives carries a high level of risk to your capital and you should only trade with money you can afford to lose. Trading Derivatives may not be suitable for all investors, so please ensure that you fully understand the risks involved, and seek independent advice if necessary. A Product Disclosure Statement (PDS) can be obtained either from this website or on request from our offices and should be considered before entering into a transaction with us. Raw Spread accounts offer spreads from 0.0 pips with a commission charge of USD $3.50 per 100k traded. Standard account offer spreads from 1 pips with no additional commission charges. Spreads on CFD indices start at 0.4 points. The information on this site is not directed at residents in any country or jurisdiction where such distribution or use would be contrary to local law or regulation.

NASDAQ

NASDAQ
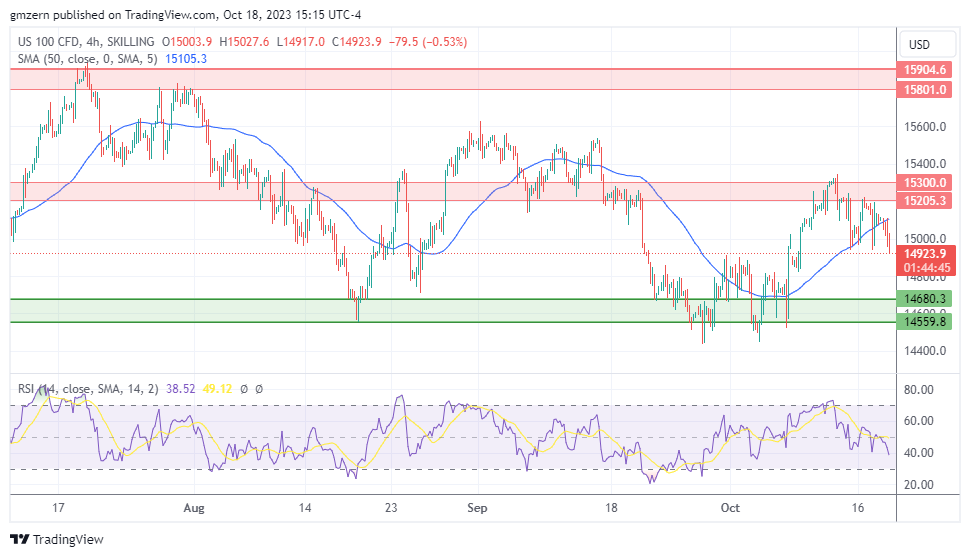
NASDAQ 181023 4h ChartNASDAQ is also moving lower as traders focus on rising Treasury yields. The rising tensions between U.S. and China, which may hurt the profits of tech companies, serve as an additional bearish catalyst for the tech-heavy NASDAQ index.

If NASDAQ stays below the 15,000 level, it will head towards the support at 14,560 – 14,680.

Dow Jones

Dow Jones
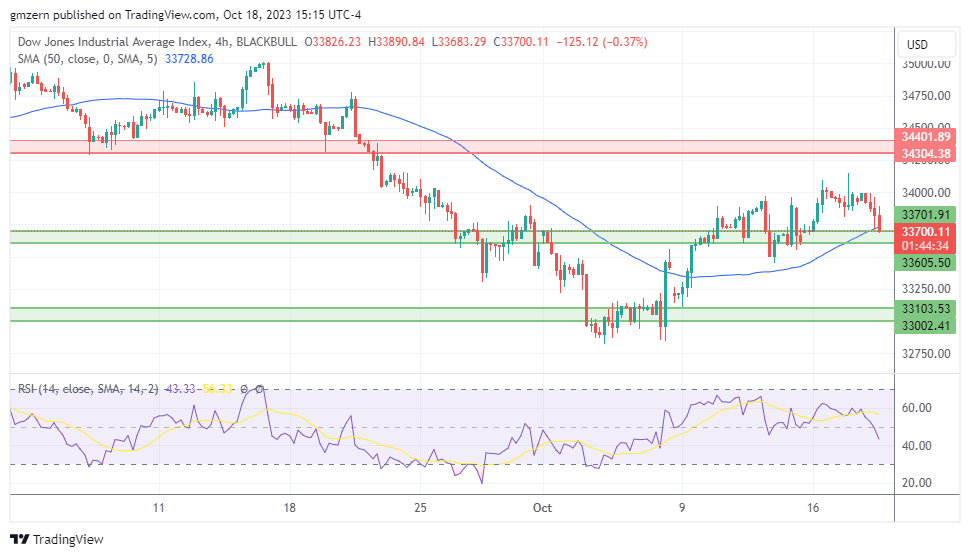
Dow Jones 181023 4h ChartDow Jones tests support at 33,600 – 33,700 amid a broad pullback in the equity markets. Most Dow Jones components are moving lower, but Procter & Gamble gained 2.7% as traders reacted to the strong earnings report.

If Dow Jones declines below the 33,600 level, it will move towards the next support, which is located in the 33,000 – 33,100 range.

Euro Forecast: EUR/USD Hindered by Resistance, EUR/AUD Still in Bullish Trend

Euro Forecast: EUR/USD Hindered by Resistance, EUR/AUD Still in Bullish Trend

EUR/USD TECHNICAL ANALYSIS

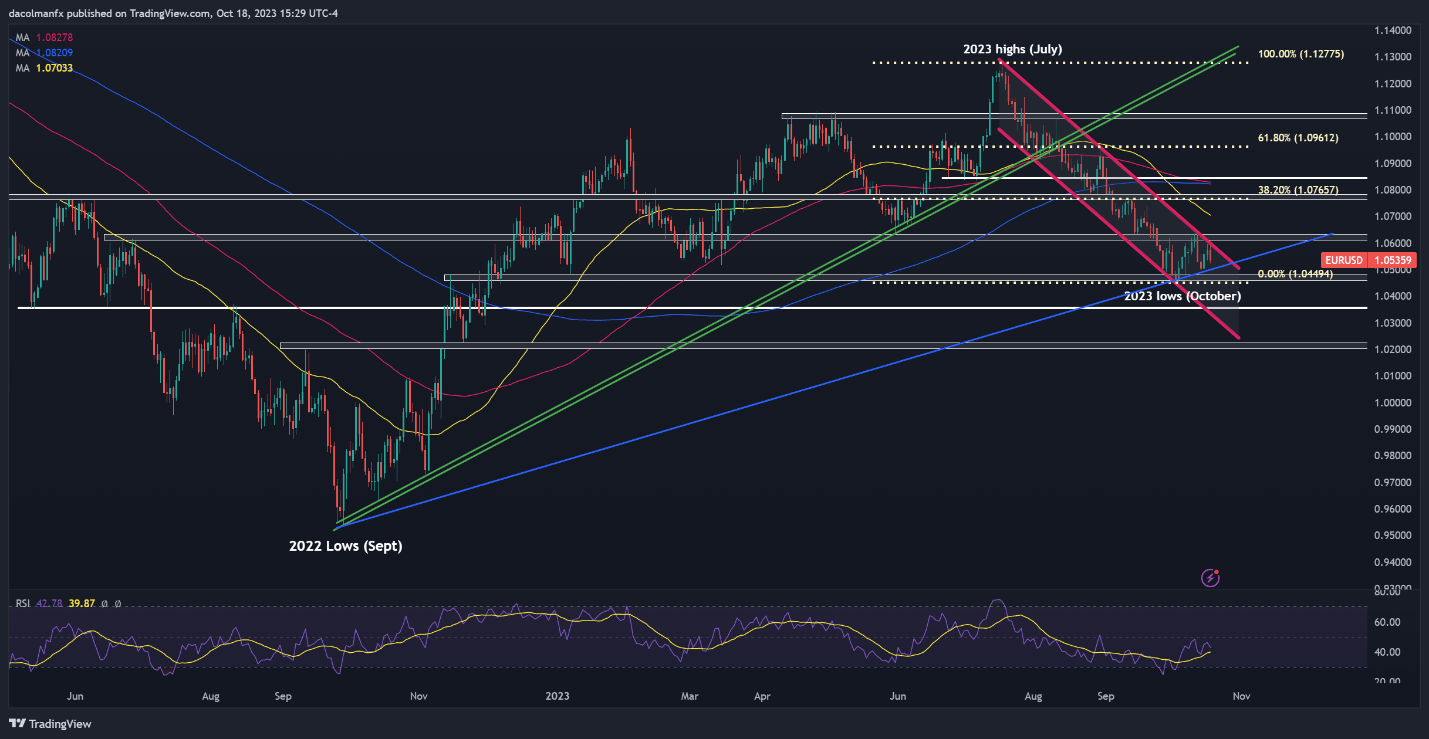
EUR/USD pulled back on Wednesday after failing to clear channel resistance located just below the 1.0600 handle, thereby putting an end to a two-day winning streak. The retreat was amplified by the broad-based strength of the U.S. dollar, driven by the substantial rise in U.S. government yields. For context, the entire U.S. Treasury curve shifted upwards, with the 10-year note soaring past 4.90%, its highest level since 2007.

With U.S. yields steadily increasing due to the resilience of the U.S. economy, and geopolitical tensions in the Middle East on the rise, the euro is likely to maintain a bearish bias against the greenback in the near term, with fresh 2023 lows possibly just around the corner.

From a technical standpoint, if EUR/USD deepens its retrenchment in the days ahead, trendline support at 1.0500 could provide stability to the market and ease the downward pressure, but in case of a breakdown, the pair is likely to gravitate towards its 2023 trough at 1.0448. On further weakness, sellers could steer the exchange rate towards an important floor near 1.0350.

On the flip side, if sentiment shifts in favor of the bulls and prices resume their recovery, overhead resistance extends from 1.0600 to 1.0625. Successfully piloting above this technical barrier could reinforce upward momentum, paving the way for a rally towards 1.0765, the 38.2% Fibonacci retracement of the July/October sell-off.

Wondering where the euro is headed and what fundamental drivers will be important in the months ahead. Discover the answers in our free Q4 trading forecast. Get your copy now!

EUR/USD TECHNICAL CHART

A screen shot of a graph  Description automatically generated

EUR/AUD TECHNICAL ANALYSIS

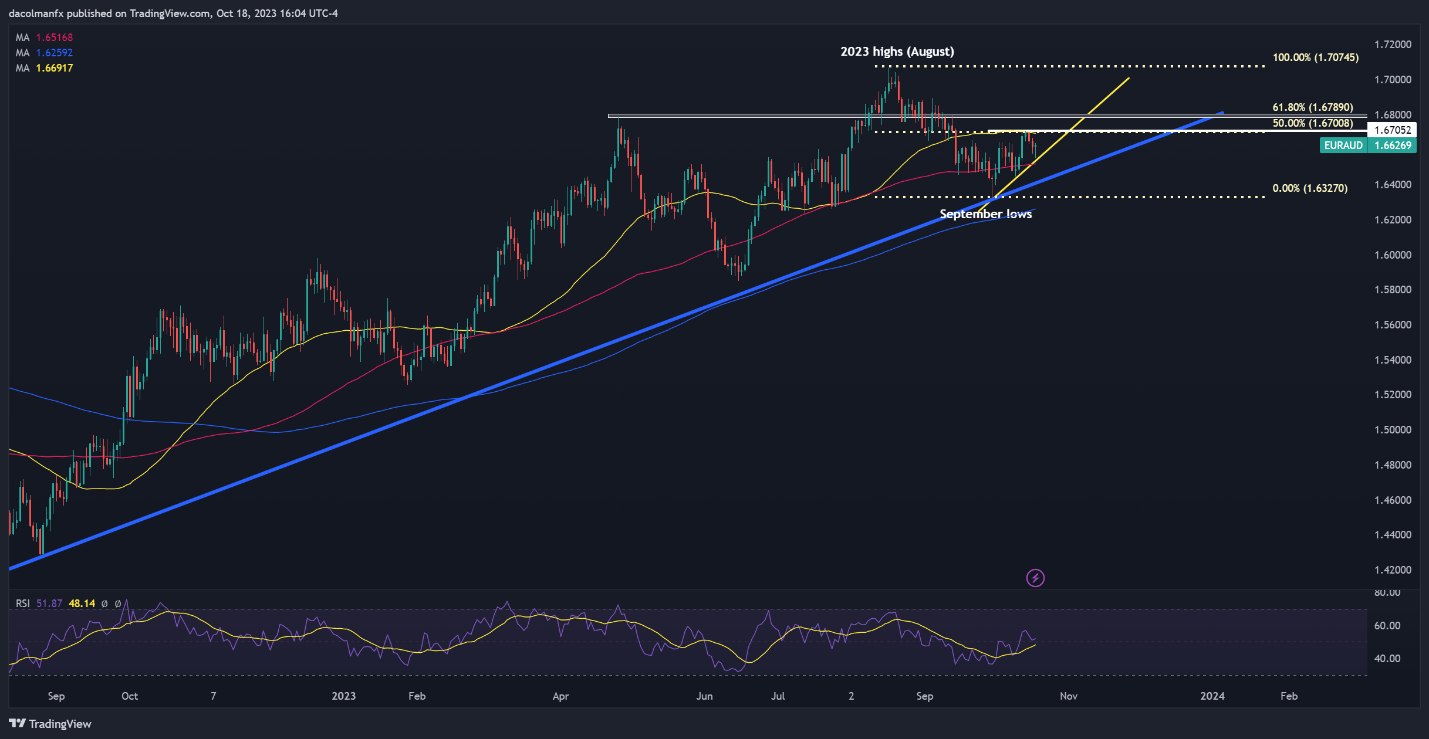
EUR/AUD fell towards multi-month lows in late September, but started to rebound soon after. Negative market sentiment in the face of heightened geopolitical tensions in the Middle East reinforced the pair’s recovery, pushing prices towards the 50-day simple moving average and the 50% Fibonacci retracement of the August/September decline, an area that currently presents a formidable hurdle for the bulls (~1.6700)

Looking ahead, it is essential for traders to keep a watchful eye on two critical technical zones: overhead resistance around 1.6700 and short-term trendline support at 1.6545, which also roughly coincides with the 100-day simple moving average.

When considering potential outcomes, a resistance breakout could send EUR/AUD towards 1.6790 (corresponding to the 61.8% Fibonacci retracement). In the event of sustained strength, the spotlight will shift to this year’s peak. Conversely, if support is breached, sellers may be emboldened to drive prices towards 1.6400. Below that threshold, attention will shift to the lows observed in September.

Curious about the influence of retail positioning on the short-term outlook for the euro? Our sentiment guide holds the answers you’re looking for. Don’t miss out, download it right away!

EUR/AUD TECHNICAL CHART

A screenshot of a computer  Description automatically generated


Australian Dollar Drops on Mixed Jobs Data Ahead of CPI. Where to for AUD/USD?

Australian Dollar Drops on Mixed Jobs Data Ahead of CPI. Where to for AUD/USD?

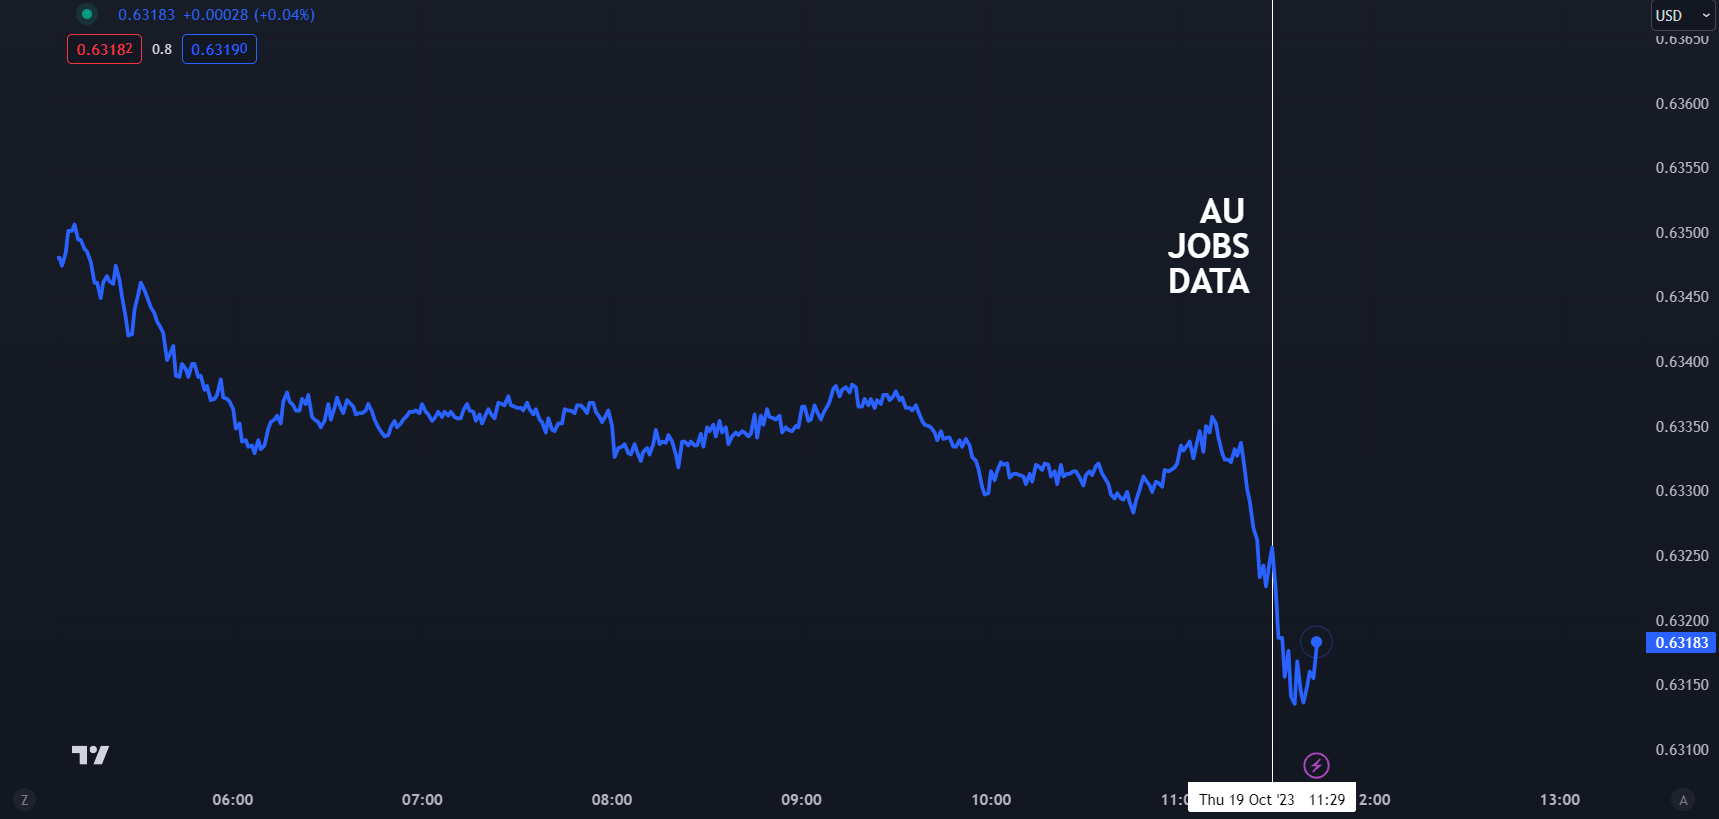
The Australian Dollar weakened today after a mixed reading from the latest employment report from the Australian Bureau of Statistics (ABS). It had already appeared vulnerable going into the figures.

The unemployment rate came in at 3.6% in September, below the 3.7% anticipated and prior. 6.7k Australian jobs were added in the month, which was less than the 20k expected to be added and 64.9k previously.

Unfortunately, 39.9k full time jobs were lost while 46.5k part time roles were added and the participation rate fell from 67.0% to 66.7%, assisting the headline unemployment rate to inch lower.

The RBA left rates unchanged earlier this month at 4.10% but there have been some notable developments since then.

It started with Reserve Bank of Australia (RBA) Assistant Governor Chris Kent on Wednesday last week.

While he highlighted the problems around the time lags in the transmission effect of monetary policy, he went on to say, “Some further tightening may be required to ensure that inflation, that is still too high, returns to target.”

Then earlier this week, the RBA meeting minutes were released, and they showed that the board was far closer to hiking than the statement on monetary policy said at the time.

Specifically, the minutes stated, “The Board has a low tolerance for a slower return of inflation to target than currently expected. Whether or not a further increase in interest rates is required would, therefore, depend on the incoming data and how these alter the economic outlook and the evolving assessment of risks.”

Compounding the hawkish tilt, RBA Governor Michele Bullock spoke at a summit yesterday and pointed to the problems of external events triggering inflation when they arrive one after the other.

She said, “the problem is we’ve had shock after shock after shock. The more that keeps inflation elevated, even if it’s from supply shocks, the more people adjust their thinking.”

Before adding, “And the more people adjust their inflation expectations, the more entrenched inflation is likely to become. So that’s the challenge.”

All of this brings next Wednesday’s Australian CPI data for the third quarter into sharp focus for the Aussie Dollar.

A Bloomberg survey of economists is anticipating headline inflation to be 5.2% year-on-year against 6.0% previously, well above the RBA’s mandated target of 2 – 3%.

A wide variation from expectations could trigger a bout of volatility for AUD/USD.

In the near term, Treasury yields have been climbing higher, underpinning the US Dollar and this may see AUD/USD test lower levels if yields continue higher.

AUD/USD PRICE REACTION TO JOBS DATA

image1.png

AUD/USD TECHNICAL ANALYSIS UPDATE

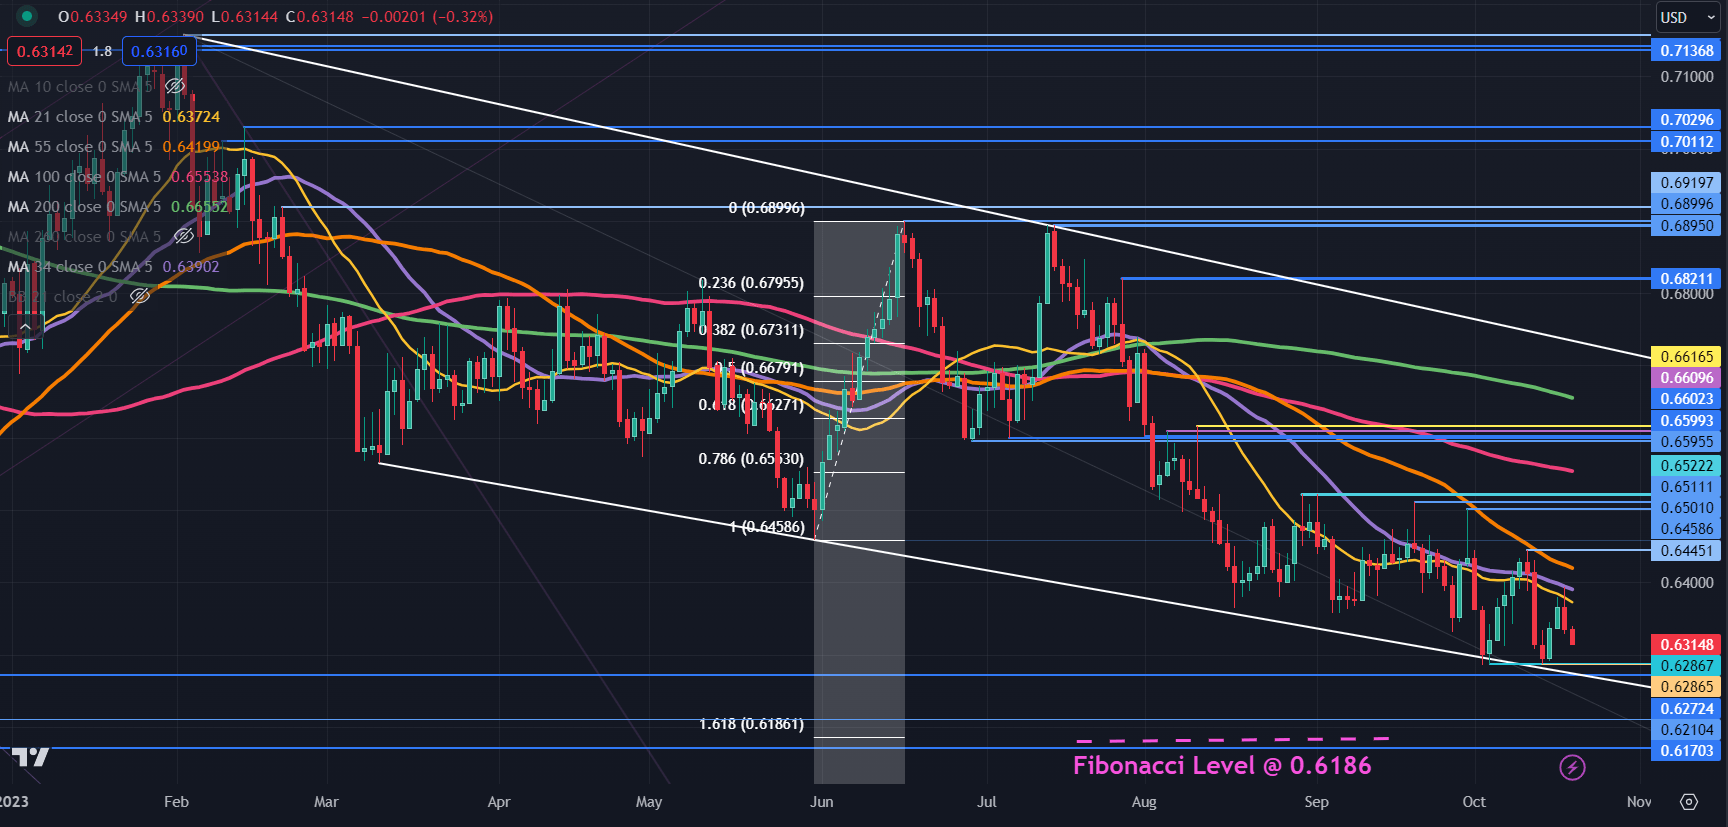
AUD/USD bounced off the low of 0.6286 to start the week and if the price fails to move below that level, a Double Bottom might be in place.

Overall, it remains in a descending trend channel and bearish momentum might be intact for now.

A bearish triple moving average (TMA) formation requires the price to be below the short-term Simple Moving Average (SMA), the latter to be below the medium-term SMA and the medium-term SMA to be below the long-term SMA. All SMAs also need to have a negative gradient.

When looking at any combination of the 21-, 34-, 55- 100- and 200-day SMAs, the criteria for a bearish TMA have been met and might suggest that bearish momentum is evolving.

Get My Guide

Last Wednesday’s high of 0.6445 coincided with the 55-day Simple Moving Average (SMA) and that level may offer resistance ahead of a cluster of prior peaks in the 0.6500 – 0.6510 area.

Further up, the 0.6600 – 0.6620 area might be another resistance zone with several breakpoints and previous highs there.

On the downside, support may lie near the previous lows of 0.6286, 0.6272 and 0.6170.

The latter might also be supported at 161.8% Fibonacci Extension level at 0.6186.

AUD/USD DAILY CHART

image2.png

How I Use RSI

How I Use RSI

The Relative Strength Index (RSI) is a simple oscillator that is used to measure speed or inertia of a given price move. The objective is to identify times when market may be in an overbought / oversold condition. While the concept is quite simple, the indicator is often times the most miss-used and under-utilized oscillator.

Before we begin, it’s worth nothing that all oscillators are backwards looking- that is they are giving you a description of historical price action – not forward looking. It is with this humble regard that we approach momentum studies and while there is much we can derive from this indicator, never base a trade solely on one technical factor. Rather this should be used as a tool within a broader technical approach to price action. Now, lets dive in.

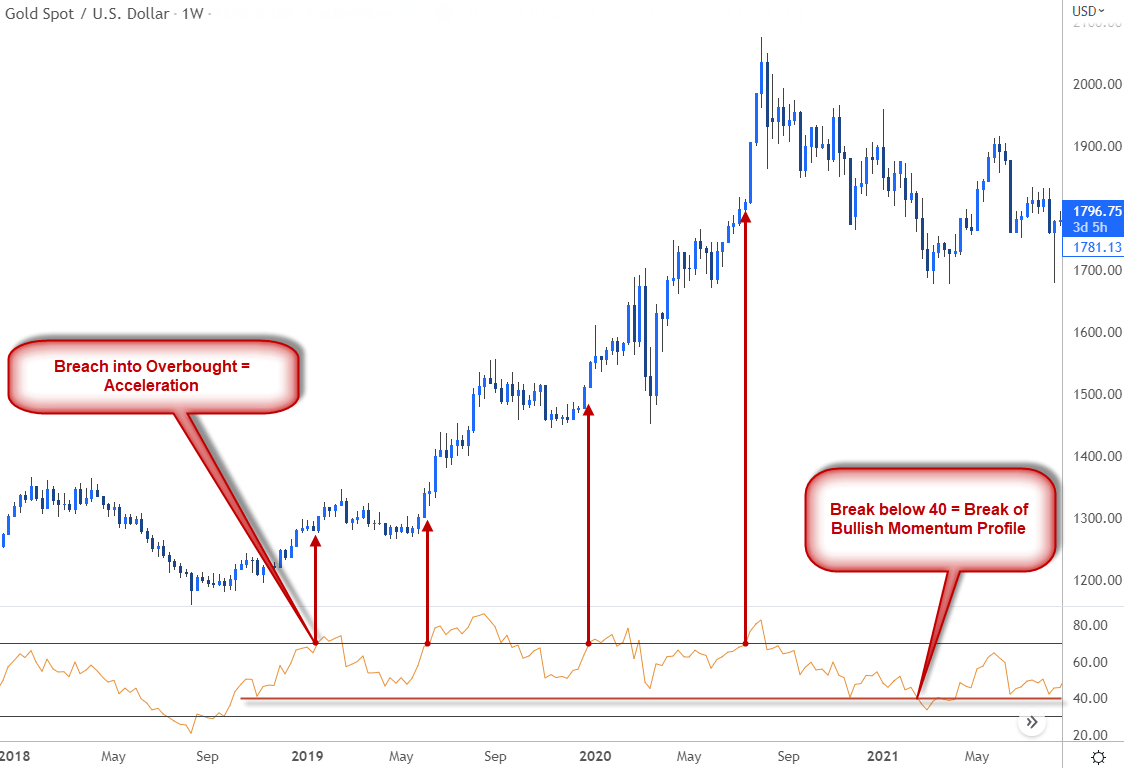
Everyone has heard of a market that is overbought or oversold – typically an RSI reading above 70 is considered to be overbought and below 30, oversold. But what does this mean for us from a trading standpoint? The misconception is that an overbought / oversold reading IS in itself the signal is one of the first major pit-falls of this indicator. A simple historical study of price action shows that often times the market has the most thrust when markets are trading above 70 in RSI and within a broader uptrend. Likewise, the largest declines can often be seen after momentum has broken below 30 within the confines of downtrends.

Gold Price Chart – XAU/USD Weekly

image1.png

The key is to remember that RSI has no time value – markets can remain in an overbought / oversold condition for an indefinite time period. In fact, the sharpest part of the rally or decline is often times after momentum has broken into the extreme. The signal, that exhaustion may be ahead is the return from the extreme- IE back the move back above 30 / back below 70. Recognizing this simple fact can help you avoid trying to call the high or fade something just because of a stretch in to momentum.

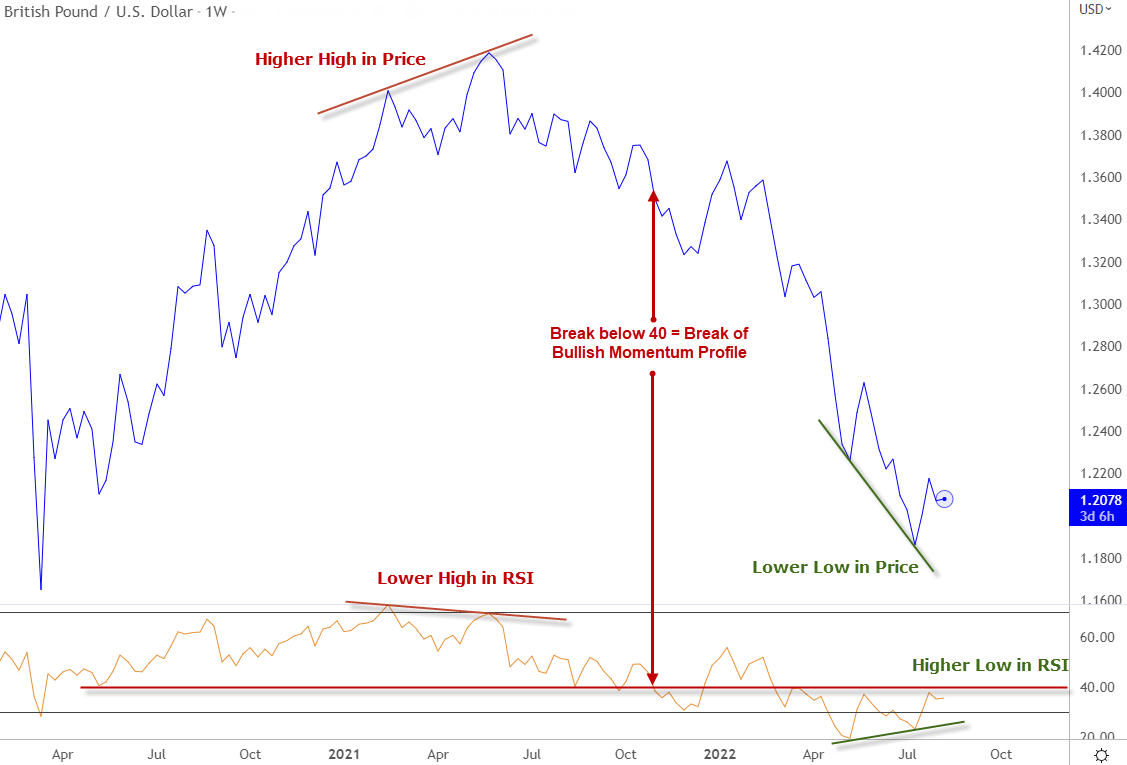
Another aspect of RSI that is often overlooked is what I call the momentum profile. A basic rule of thumb is that in strong bull-markets, RSI should typically hold above 40 – likewise in a bearish trends the oscillator will tend to find resistance at ahead of 60. These subtle tendencies can be very useful in assessing the broader directional bias from a moment standpoint and whether a move is corrective within a broader trend or a larger reversal.

Sterling Price Chart – GBP/USD Weekly

image2.png

A note on divergence – Divergence is a phenomena where a new extremes in price are not reflected in the oscillator. This tendency can often times help identity market turns / reversals. However its important to note that it is the candle close that matters – not the wicks (high / low). An easy way to help filter out the noise is to simply consider divergences on a line chart, taking account only the period close. The Sterling chart above illustrates both bullish / bearish divergence signals and shifts in the broader momentum profile. It’s worth noting that the closer the divergence reference points are to 50- the stronger the signal. So in this example, the bearish divergence seen in 2021 would be interpreted as a stronger signal than that of this year’s rebound in GBP/USD.

Bottom line : All oscillators should be used in as a compliment to a broader trade strategy and there should never be an over-reliance on any one indicator other than price. That said, momentum can be an extremely useful tool when used properly and offers much more insight than simple overbought / oversold readings within the confines of a given trend. Forget the cookie-cutter explanations – knowing how a given indicator behaves to real-life price action is the key to effectively utilizing them as part of you trading strategy.

US Indices Ahead of Powell; S&P 500 & Nasdaq Price Setups

US Indices Ahead of Powell; S&P 500 & Nasdaq Price Setups

US equity indices will be looking for cues from US Federal Reserve Chair Jerome Powell who is scheduled to speak later Thursday. That’s because, over the past couple of weeks, there has been a distinct shift in Fed rhetoric, even from some of the hawkish members. Several Fed officials have indicated a pause in hiking interest rates given the tightening in financial conditions as a result of the surge in Treasury yields.

Minutes of the September FOMC meeting outlined the case for proceeding carefully in determining the extent of additional tightening, noting that participants generally judged that risks had become more two-sided. Pricing for the Fed terminal rate has reduced following the recent comments from Fed officials.

Markets have been grappling with a mix of factors, including mounting tensions in the Middle East, elevated US yields, third-quarter earnings season, light equities positioning, and generally positive seasonality. Participants will be looking for a justification of the dovish market pricing from Powell’s tone and comments.

S&P 500 240-Minute Chart

image1.png

S&P 500: Capped at vital resistance

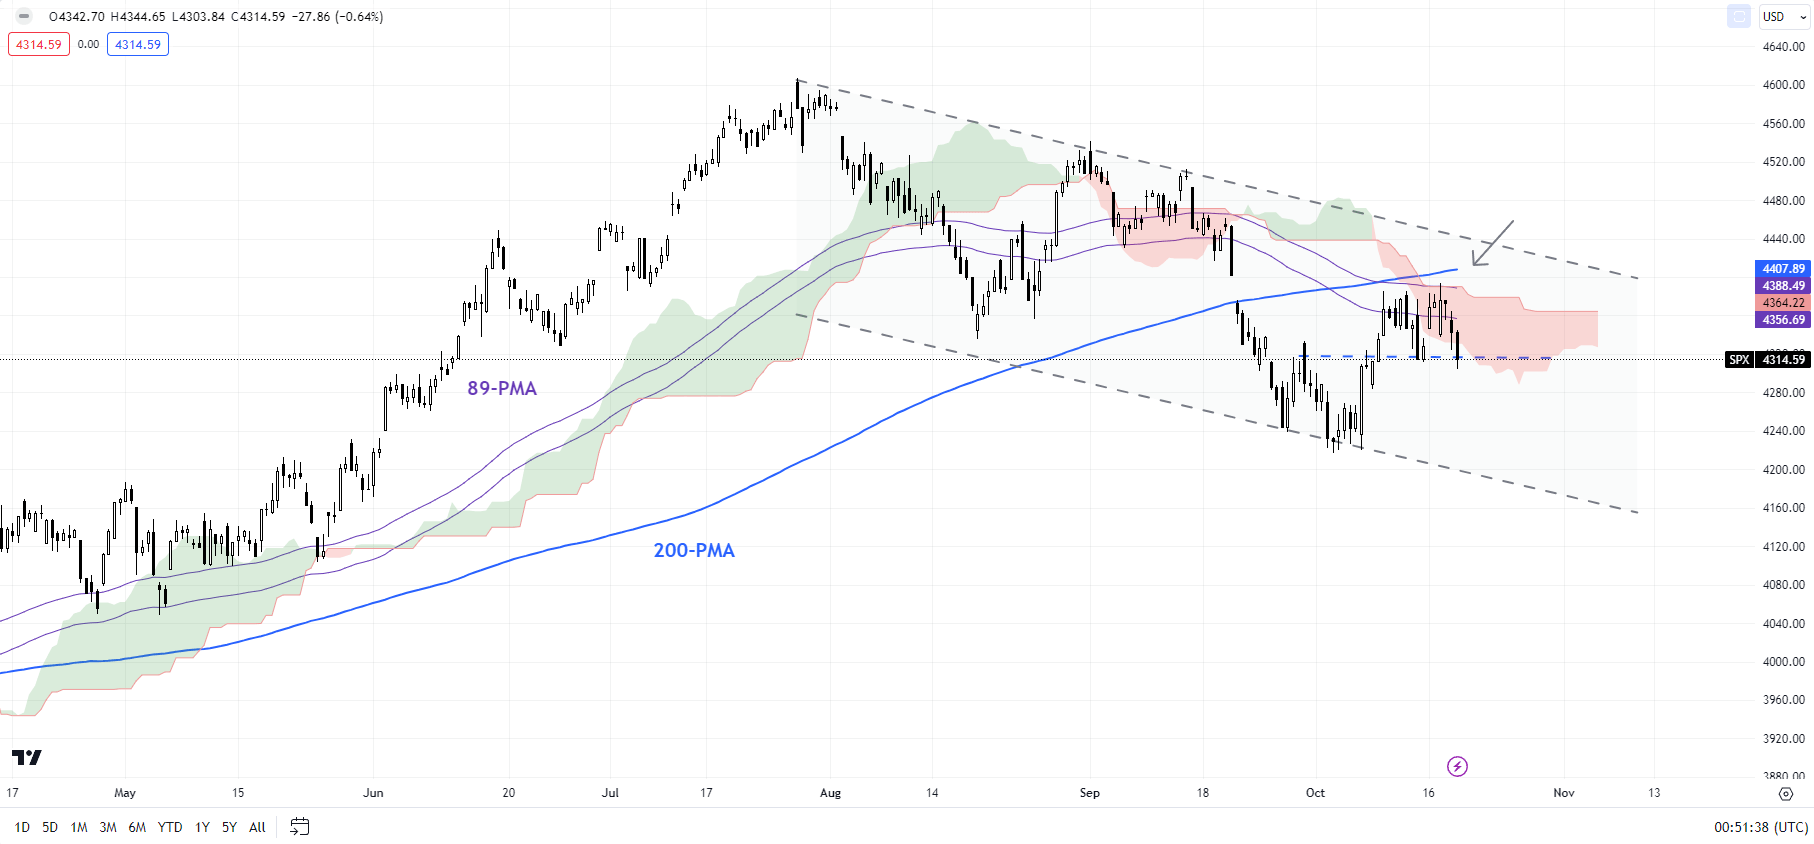
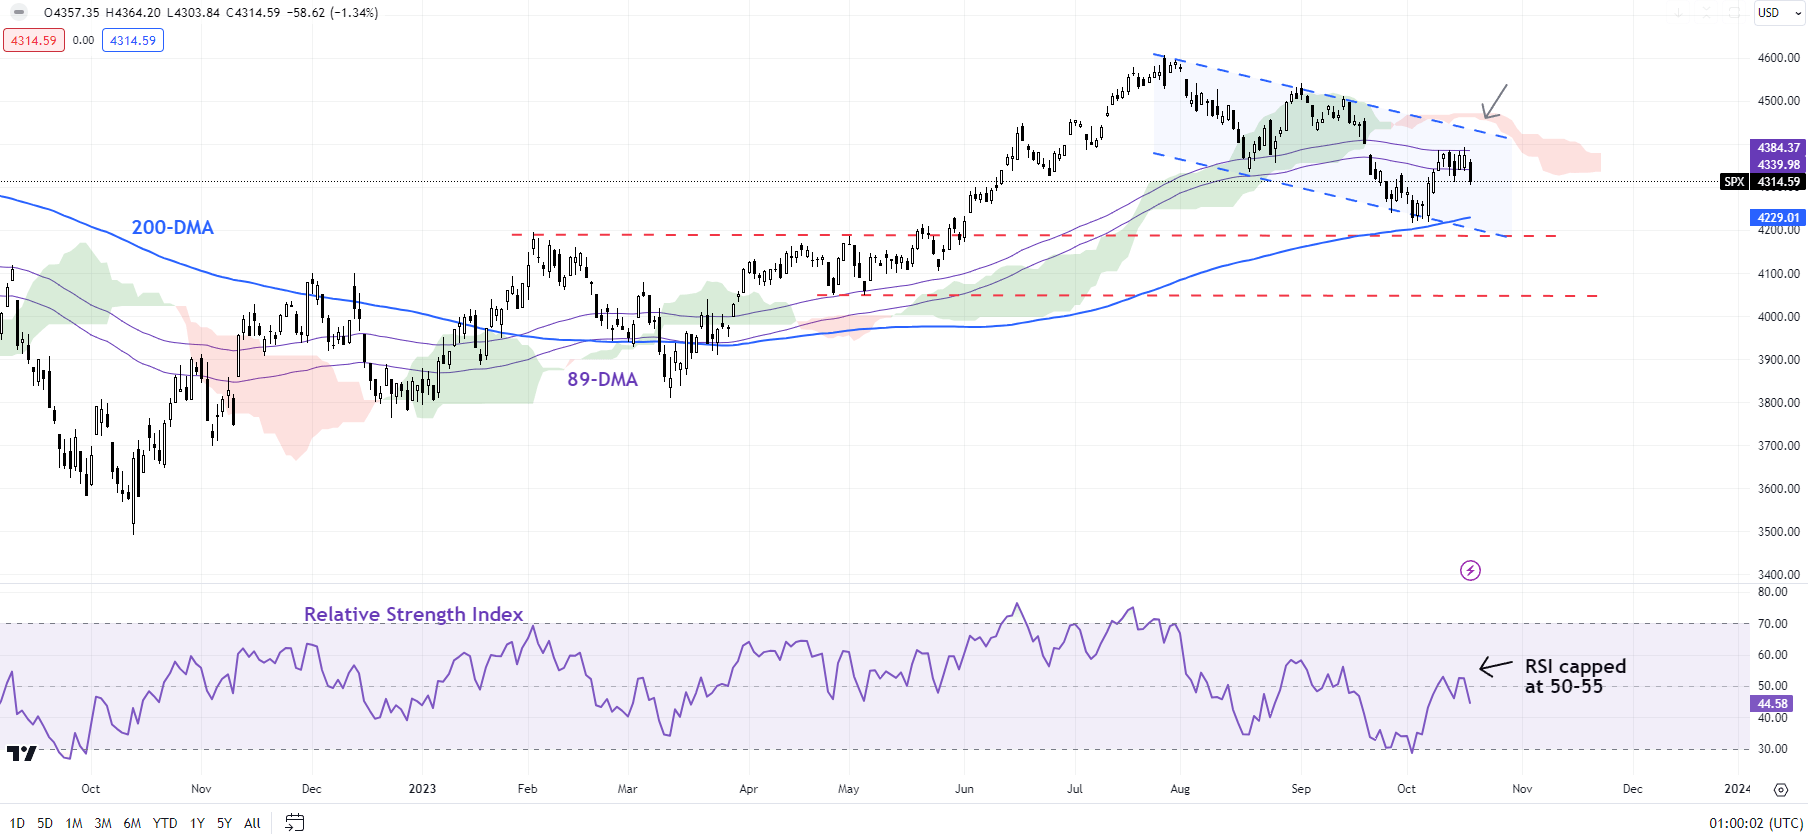
On technical charts, the S&P 500 index has pulled back from key converged resistance on the 200-period moving average the upper edge of the Ichimoku cloud on the 240-minute charts, and the 89-day moving average. While the price action is still unfolding, the recent price action raises the odds that the near-term trend is at best sideways, as highlighted in the previous update. See “S&P 500 & Nasdaq Rebound from Key Support; How Much More Upside?” published October 10.

Looking for actionable trading ideas? Download our top trading opportunities guide packed with insightful tips for the fourth quarter!

The index has been nicely guided lower by a declining channel since July, with the cloud structure also changing in recent months, as highlighted in late September. See “US Indices Risk Support Test After Hawkish Fed: S&P 500, Nasdaq Price Action,” published September 21.

It is now testing a key cushion at Friday’s low of 4377. Any break below could pave the way toward the early October low of 4215. Any break below the 200-day moving average could expose the downside initially toward the end-April low of 4050.

S&P 500 Daily Chart

image2.png

Zooming out from a multi-week perspective, the weakness since August reinforces the broader fatigue, as pointed out in previous updates. See “US Indices Hit a Roadblock After Solid Services Print: S&P 500, Nasdaq,” published September 7; “US Indices Rally Beginning to Crack? S&P 500, Nasdaq Price Setups,” published August 3; “S&P 500, Nasdaq 100 Forecast: Overly Optimistic Sentiment Poses a Minor Setback Risk,” published July 23.

Nasdaq 100 Daily Chart

image3.png

Nasdaq 100: Channel resistance holds

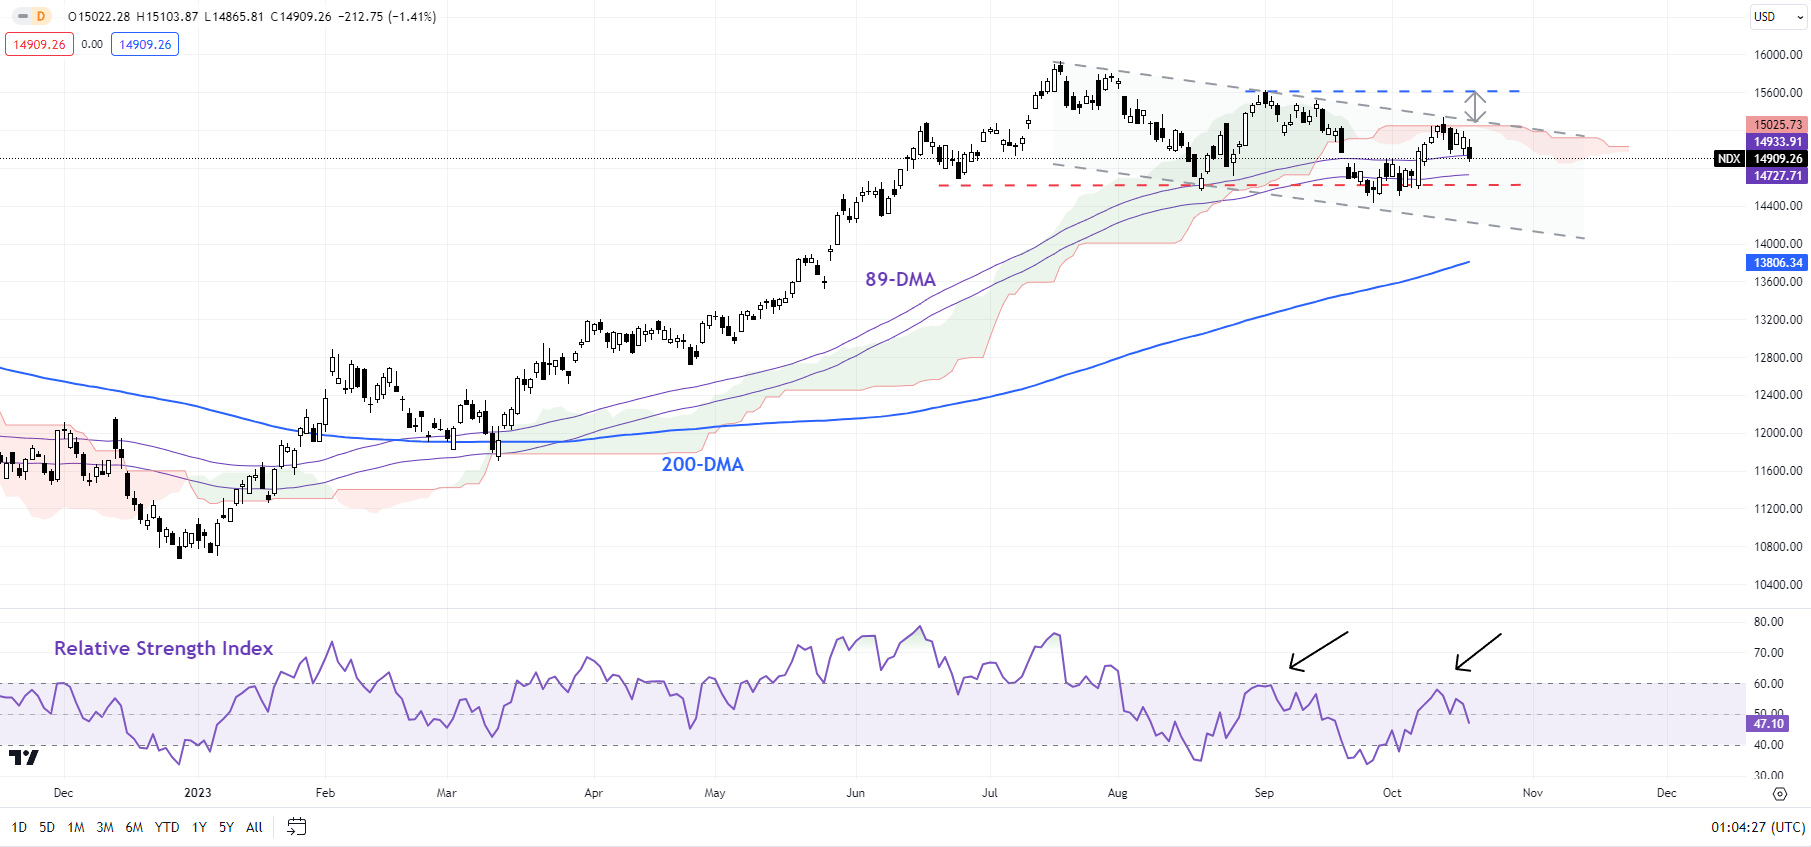
The Nasdaq 100 index has retreated from a stiff hurdle on the upper edge of a declining channel since July, not too far from the early-September high of 15618 and the July high of 15932. While the price action is still unfolding, the lower high created last week raises the risk of a retest of the September low of 14435. This support is crucial as any break below would disrupt the higher-highs-higher-lows sequence established since the start of the year.

From a big-picture perspective, as highlighted in arecent update, the momentum on the monthly charts has been feeble compared with the huge rally since late 2022, raising the risk of a gradual weakening, similar to the gradual drift lower in gold since May. For more discussion, see “Is Nasdaq Following Gold’s Footsteps? NDX, XAU/USD Price Setups,” published August 14.

Japanese Yen Teeters Near New Lows as Risks Accelerate Globally. Higher USD/JPY?

Japanese Yen Teeters Near New Lows as Risks Accelerate Globally. Higher USD/JPY?

The Japanese Yen appears to be looking to test the Bank of Japan’s (BoJ) resolve on Thursday while risk and growth-aligned assets are under pressure with the Middle East conflict weighing on sentiment.

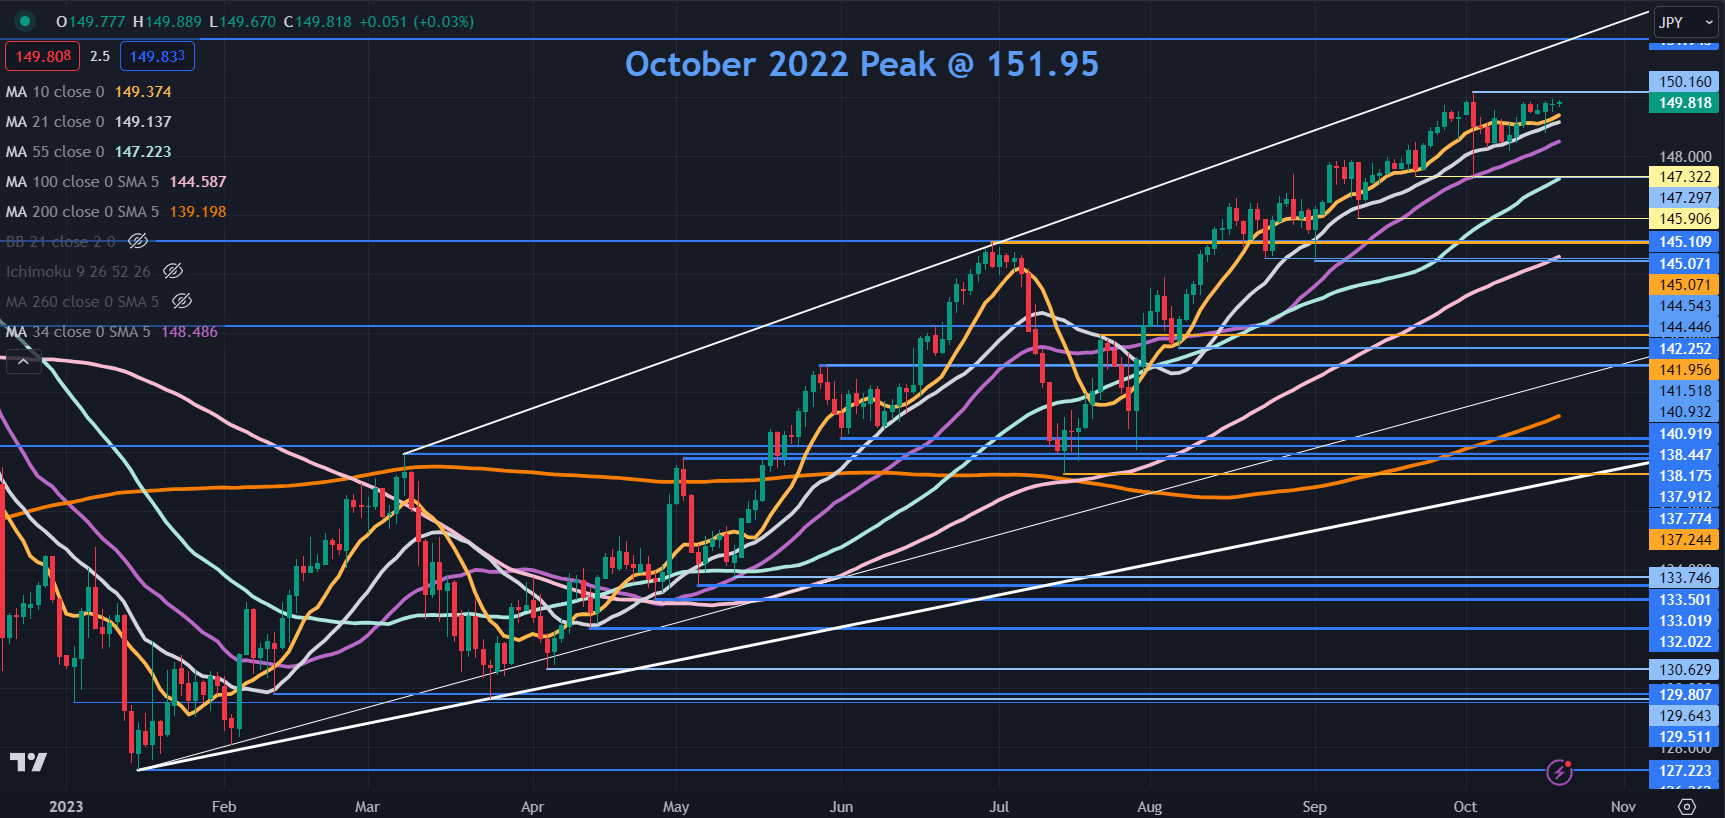
USD/JPY is bumping up against the high for the year of 150.16 which was seen earlier this month. The bid tone for the exchange rate comes with the US Dollar seeing strength across the board as Treasury yields soar going into the latter part of the week.

The benchmark 10-year note traded to its highest yield since 2007 in Asia today as it scopes a move potentially above 5%.

After the commentary from several Fed speakers over the last week or so, attention will turn to Fed Chair Jerome Powell when he delivers an address on Thursday to the Economic Club of New York later today.

With US government bond yields racing north in the last few sessions, any comments around the impact for the Fed funds target rate could see heightened volatility.

Back in Japan, former board member at the BoJ Makoto Sakurai made comments today that he thinks that the bank is more likely to abandon negative interest rates before any further adjustments to yield curve control (YCC).

Mr Sakurai noted last year that the bank might loosen YCC controls months prior to the bank doing so. Yields on 10-year Japanese Government Bonds (JGB) nudged 0.84% today, the highest since 2013.

The BoJ will hold its monetary policy meeting on October 31st.

Elsewhere, crude oil has eased today after punching to a 2-week high overnight. The US Treasury Department announced that they will suspend sanctions on Venezuelan oil, gas, gold and bonds.

Spot gold also spiked above US$ 1,962 as the uncertainty surrounding diplomatic efforts in the Middle East assisted haven flows.

The Australian Dollar sunk after a mixed jobs report that saw the unemployment rate ease to 3.6% from 3.7%. The gains were made in part-time jobs while full-time jobs dropped on a lower participation rate.

APAC equities followed Wall Street’s lead lower with most of the major indices down over 1.5%. Futures are indicating a tough day ahead for equity markets in general across Europe and North America.

Aside from Fed Chair Powell’s speech, the US will also see data on jobs and home sales.

USD/JPY TECHNICAL ANALYSIS SNAPSHOT

USD/JPY is inching closer to the 12-month high seen at the start of October and a break above there could see a run toward the 33-year peak seen at this time last year at 151.95.

Such a move risks the possibility of the Bank of Japan (BoJ) physically intervening in the foreign exchange market.

A bullish triple moving average (TMA) formation requires the price to be above the short-term SMA, the latter to be above the medium-term SMA and the medium-term SMA to be above the long-term SMA. All SMAs also need to have a positive gradient.

When looking at any combination of the 10-, 21-, 34-, 55-, 100- and 200-day SMAs, the criteria for a TMA have been met and might suggest that bullish momentum is evolving. For more information on trend trading, click on the banner below.

On the downside, support may lie at the recent lows near 147.30 and 145.90 or further down at the breakpoints in the 145.05 – 145.10 area ahead of the prior lows near 144.50 and 141.50.

image1.png

Bitcoin, Ethereum Trends Diverge; BTC/USD & ETH/USD Price Setups

Bitcoin, Ethereum Trends Diverge; BTC/USD & ETH/USD Price Setups

BITCOIN: Takes on vital resistance

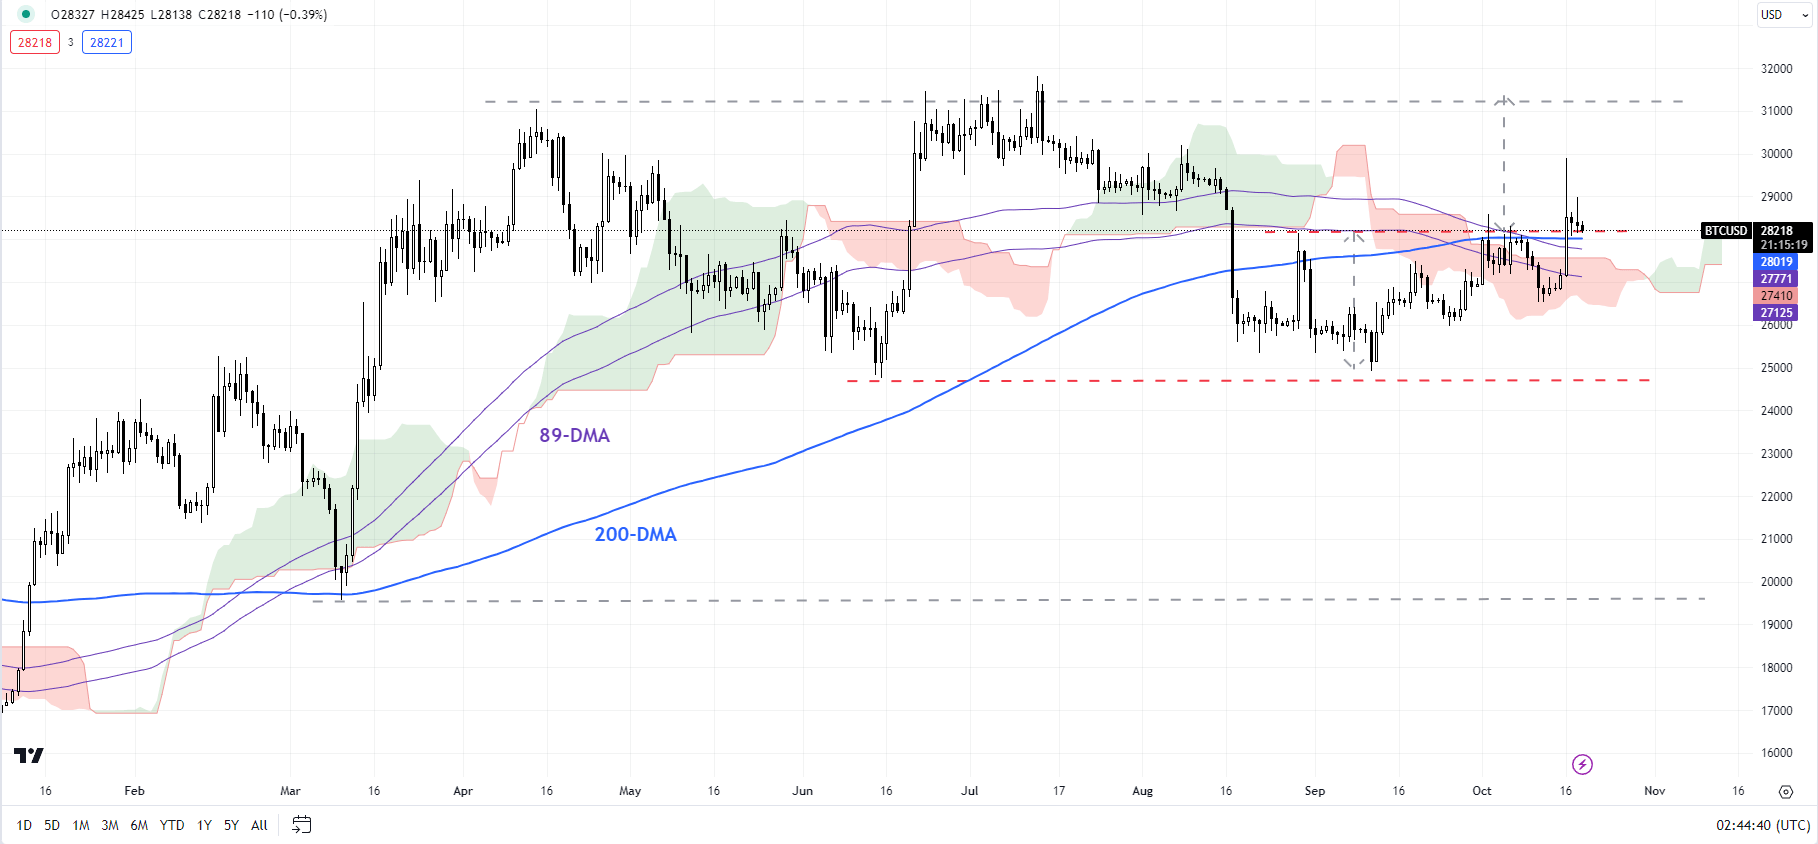
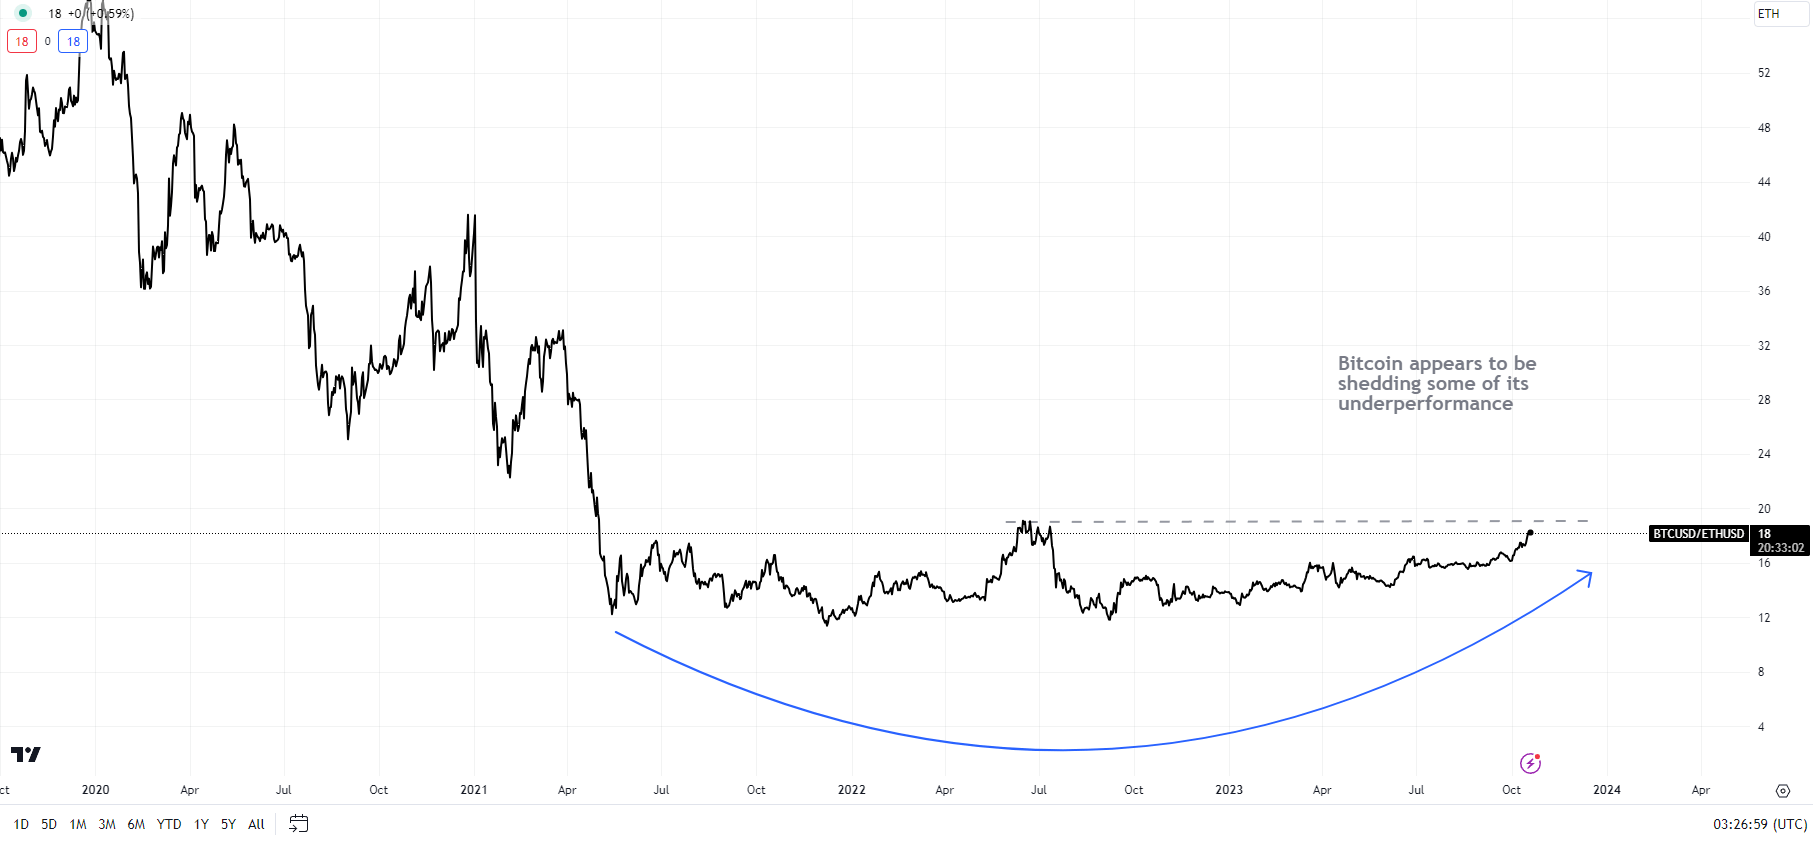
Bitcoin continues to be well supported, now testing a formidable resistance on the 200-day moving average, roughly coinciding with the end-August high of 28150. This follows a hold last month above strong support at the June low of 24750, which has kept intact the higher-top-higher-bottom formation since the end of 2022. Importantly, this keeps alive the possibility of an extended recovery given the 2021-2022 decline and the possibility of Bitcoin shedding some of its underperformance Vs Ethereum in recent years.

BTC/USD Daily Chart

image1.png

Any decisive break above 28150 could clear the path toward the July high of 31800, which would be a significant resistance to crack. A cross-over would trigger a double bottom (the 2023 lows) and importantly reinforce the bullish medium-term trajectory, first highlighted earlier this year – see “Bitcoin Technical Outlook: BTC/USD Turns Bullish”, published January 18.

BTC/USD Vs ETH/USD Daily Chart

image2.png

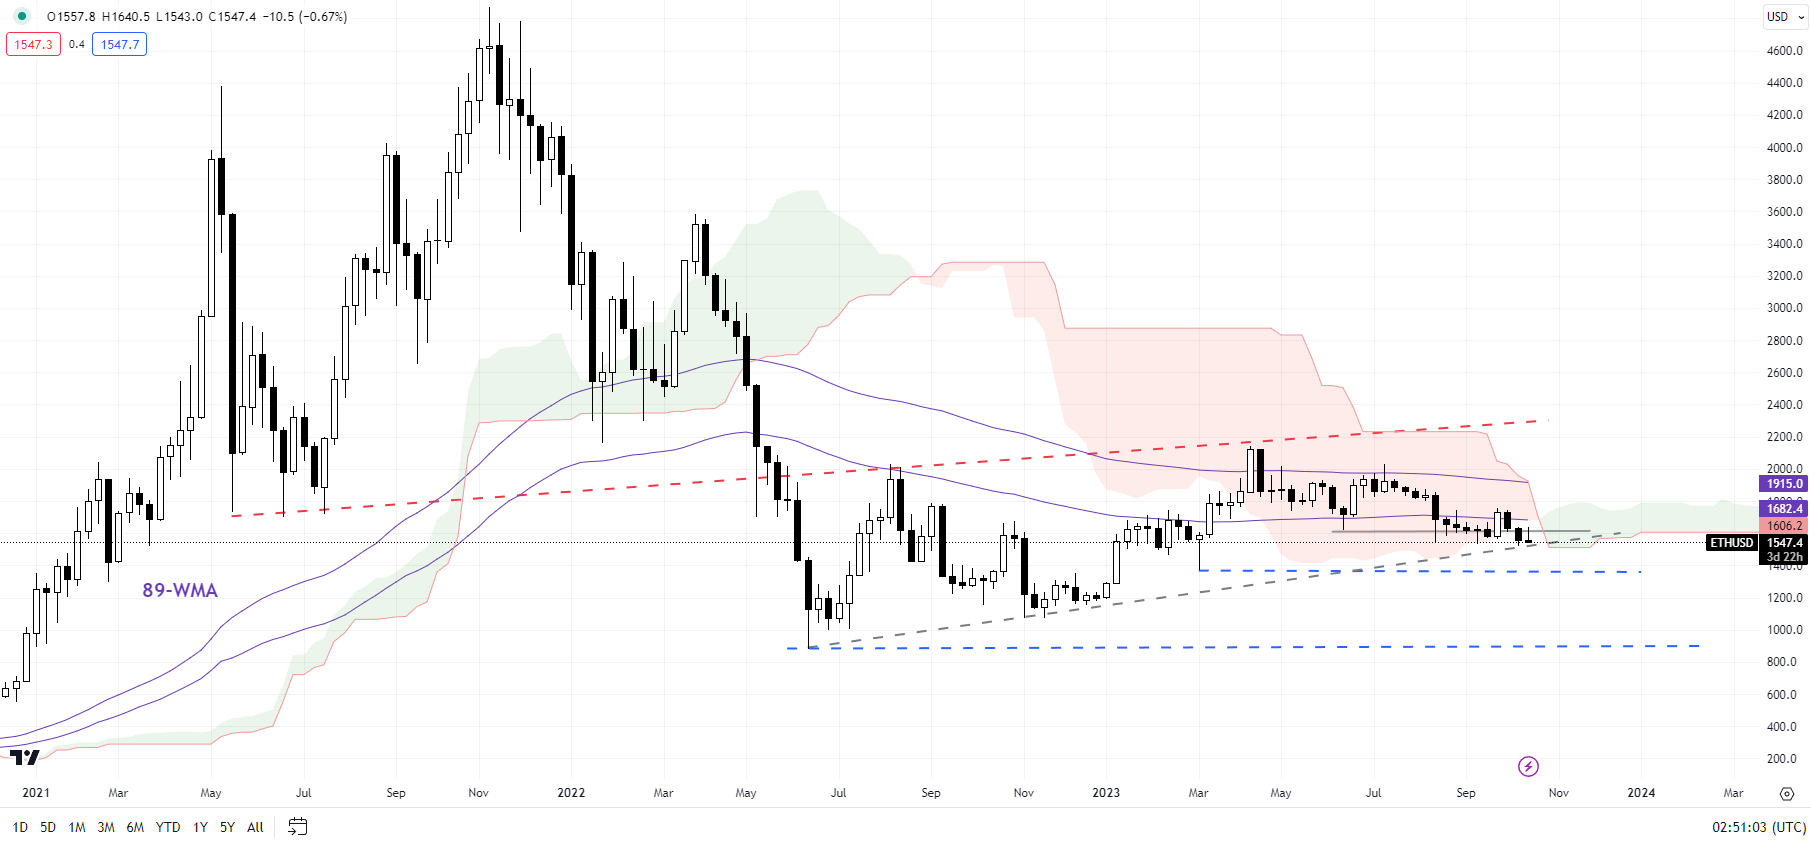
The potential price objective of the double bottom pattern (the June and the September lows) works out to around 39000. Such a move would imply a break above the 89-week moving average and a cross above the upper edge of the Ichimoku cloud on the weekly charts – for the first time since 2022. For the bullish view to unfold, BTC/USD needs to stay above the June low of 24750.

ETHEREUM: Beginning to look vulnerable

The lack of a meaningful upward momentum in recent weeks raises the risk of Ethereum staging a secondary/lower high on the weekly charts, relative to early 2023. This would be the first time since the recovery started in late 2022 that the higher-highs-higher-lows sequence would be broken. ETH/USD in August fell below crucial support on the 200-day moving average for the first time since January.

ETH/USD Weekly Chart

image3.png

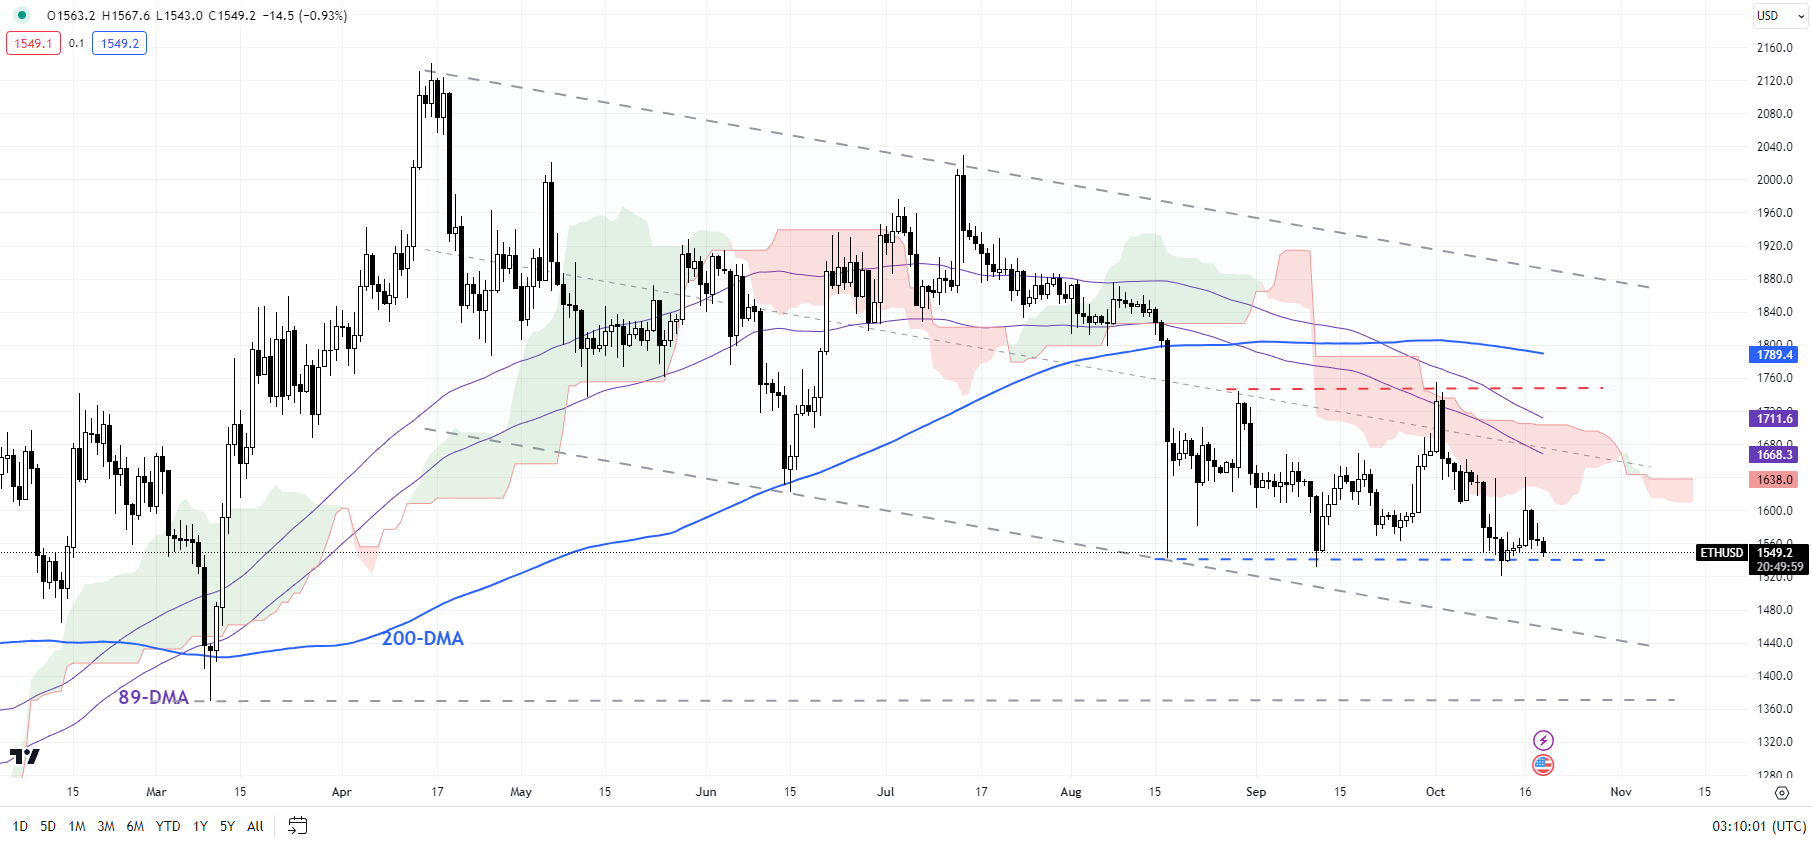
As highlighted in the previous update, the retreat from key resistance on the 89-day moving average earlier this month coupled with the subsequent fall below the June low keeps the bearish bias intact. ETH/USD is now attempting to break below the key cushion at the August low of 1550. A decisive break below could initially pave the way toward the lower edge of a downtrend channel since April (now at about 1450), potentially the October low of 1370.

ETH/USD Daily Chart

image4.png

On the weekly charts, ETH/USD has been under the influence of the bearish Ichimoku cloud cover and appears to be now succumbing to the cloud pressure. For the immediate downside risks to fade, Ethereum needs to surpass 1750, including the end of August and the early-October highs.

Gold Price Forecast – Gold Markets Rally Again

Gold Price Forecast – Gold Markets Rally Again

Gold Market Technical Analysis

Gold has rallied significantly during the trading session again on Wednesday, as we are breaking above the $1950 level. The market is likely to continue seeing a lot of “FOMO” coming into the picture. The market is now breaking above the previous triangle, and therefore we have completely reversed. At this point, we need to pay close attention to the bond market, and of course the interest rates in America. Furthermore, we also have to think about the geopolitical issues that are currently going on, and what that may do for gold.

Trading Derivatives carries a high level of risk to your capital and you should only trade with money you can afford to lose. Trading Derivatives may not be suitable for all investors, so please ensure that you fully understand the risks involved, and seek independent advice if necessary. A Product Disclosure Statement (PDS) can be obtained either from this website or on request from our offices and should be considered before entering into a transaction with us. Raw Spread accounts offer spreads from 0.0 pips with a commission charge of USD $3.50 per 100k traded. Standard account offer spreads from 1 pips with no additional commission charges. Spreads on CFD indices start at 0.4 points. The information on this site is not directed at residents in any country or jurisdiction where such distribution or use would be contrary to local law or regulation.

Gold is something that people will run to in order to gain safety, and after the recent surge it looks like that might be part of what’s going on. After all, interest rates have risen over the last couple of days, but gold has risen at the same time. This can and will happen from time to time, so although there is typically a negative correlation between rates and gold, that doesn’t mean you can simply trade based upon that negative correlation. After all, there is the possibility that multiple things are going on at the same time, which you can clearly guess is the case at the moment.

Underneath, we have the 200-Day EMA offering support, which is also right around the bottom of the last couple of candlesticks, so it all ties together quite nicely. If we were to break down below there, then the market is likely to go much lower, but right now it looks like that will not be the case. The size of the candlestick for the day does suggest that we have plenty of momentum, but it may be very noisy along the way.

If we continue to go higher, then it’s possible that the market goes looking to reach the $2000 level, which of course is a large, round, psychologically significant figure, and an area that has offered quite a bit of resistance previously. That could be a situation where it makes for a nice target as well, so keep that in the back of your mind. Either way, it looks like the buyers are starting to pick up momentum yet again.

US Dollar Index News: DXY Faces Headwinds with: China, Geopolitical Risk in Focus

US Dollar Index News: DXY Faces Headwinds with: China, Geopolitical Risk in Focus

Dollar’s Momentum Checked by Geopolitical Events and China Data

The U.S. dollar’s recent rally showed signs of stalling as better-than-expected economic growth in China and geopolitical tensions in Gaza weighed on the currency. China’s Q3 GDP outperformed market expectations, growing 1.3%, while industrial output increased and unemployment rates dropped. Meanwhile, the conflict between Israel and Hamas added an element of caution among traders.

Currency Dynamics

At 13:13, the U.S. Dollar Index, which measures the greenback against six major currencies, was up marginally at 106.303. This comes after the index recently touched an 11-month high of 107.34. While currencies like China’s yuan and the Australian and New Zealand dollars initially strengthened, they later pared their gains.

Trading Derivatives carries a high level of risk to your capital and you should only trade with money you can afford to lose. Trading Derivatives may not be suitable for all investors, so please ensure that you fully understand the risks involved, and seek independent advice if necessary. A Product Disclosure Statement (PDS) can be obtained either from this website or on request from our offices and should be considered before entering into a transaction with us. Raw Spread accounts offer spreads from 0.0 pips with a commission charge of USD $3.50 per 100k traded. Standard account offer spreads from 1 pips with no additional commission charges. Spreads on CFD indices start at 0.4 points. The information on this site is not directed at residents in any country or jurisdiction where such distribution or use would be contrary to local law or regulation.

Rate Uncertainty

Economic data from the U.S. painted a mixed picture. Retail sales for September increased by 0.7%, significantly outpacing the 0.3% forecast. Despite this positive data, the future of Federal Reserve interest rate policy remains uncertain. The market is pricing a 90% chance of rates remaining unchanged in November, but expectations for a December rate hike have increased.

Short-Term Forecast: Cautiously Bullish

The U.S. dollar appears poised for modest gains in the near term, albeit with potential headwinds from geopolitical risks and global economic data. With both bullish and bearish factors in play, traders should proceed with caution.

Technical Analysis

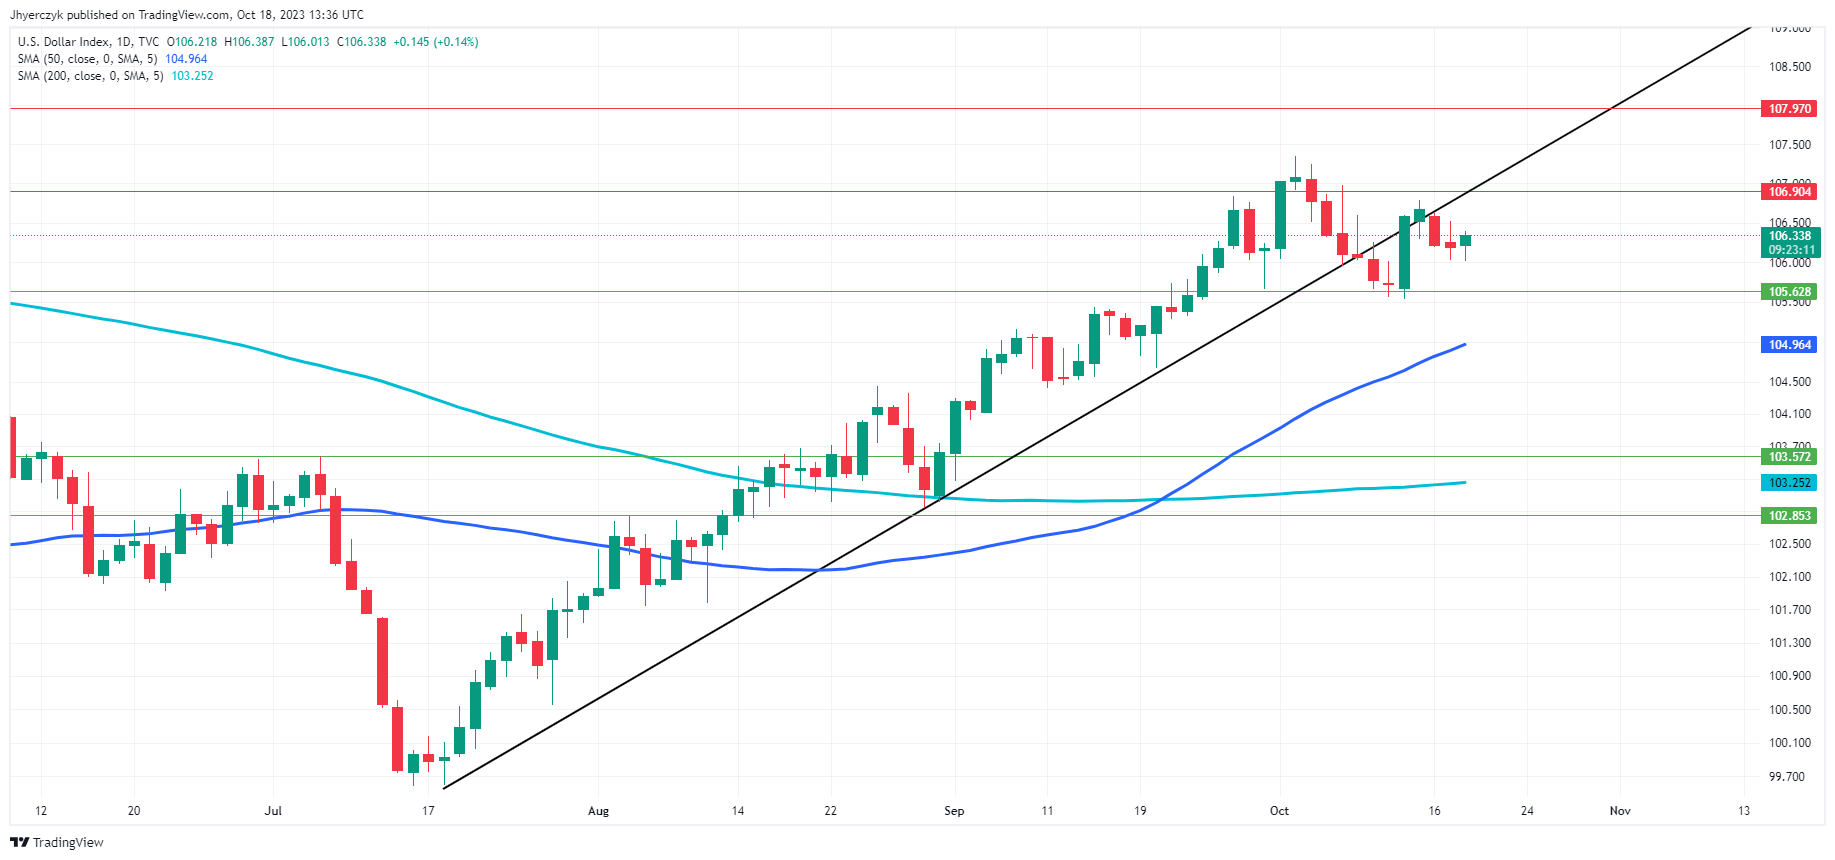
Daily US Dollar Index (DXY)The 200-day moving average for the U.S. Dollar Index (DXY) is at 103.252 and the 50-day moving average is at 104.964. The current daily price of 106.341 is above both these averages, suggesting bullishness both in the long-term and short-term perspectives.

It’s hovering just above minor support at 105.628 and is approaching minor resistance at 106.904. While the asset is well above the main support level of 103.573, it is yet to challenge the main resistance at 107.970. Given these factors, the market sentiment for the U.S. Dollar Index appears cautiously bullish.