GBP to USD Forecast: UK Inflation Rate Runs Hotter-Than-Expected at 6.7%

GBP to USD Forecast: UK Inflation Rate Runs Hotter-Than-Expected at 6.7%

Overview of the Tuesday Session

On Tuesday, the GBP/USD declined by 0.24%. Partially reversing a 0.57% gain from Monday, the GBP/USD pair ended the day at $1.21827. The GBP to USD pair rose to a high of $1.22163 before falling to a low of $1.21327.

UK Inflation in the Spotlight

UK inflation figures for September were in the spotlight on Wednesday.

Trading Derivatives carries a high level of risk to your capital and you should only trade with money you can afford to lose. Trading Derivatives may not be suitable for all investors, so please ensure that you fully understand the risks involved, and seek independent advice if necessary. A Product Disclosure Statement (PDS) can be obtained either from this website or on request from our offices and should be considered before entering into a transaction with us. Raw Spread accounts offer spreads from 0.0 pips with a commission charge of USD $3.50 per 100k traded. Standard account offer spreads from 1 pips with no additional commission charges. Spreads on CFD indices start at 0.4 points. The information on this site is not directed at residents in any country or jurisdiction where such distribution or use would be contrary to local law or regulation.

The UK annual inflation rate held steady at 6.7% vs. a forecast of 6.6%. Core inflation also beat forecasts. The core inflation rate softened from 6.2% to 6.1%. Economists forecast a core inflation rate of 6.0%.

According to the Office for National Statistics,

  • The Consumer Price Index including, owner occupiers’ housing costs, increased by 6.3% year-over-year. (Aug: 6.3%).
  • Core CPIH also rose at the same rate as in August, up 5.9% in 12 months to September.
  • The annual rate of food and non-alcoholic beverages softened from 13.6% to 12.2%.
  • Motor fuel prices made the largest upward contribution to the annual inflation rates.
  • Year-over-year, motor fuel prices fell by 9.7% compared with a 16.4% decline in August. Rising petrol and diesel prices impacted motor fuel inflation rates.

UK wage growth figures from Tuesday eased pressure on the Bank of England (BoE) to push interest rates higher. However, sticky inflation will leave rate hikes on the table despite softer wage growth.

Bank of England Governor Andrew Bailey and Chief Economist Huw Pill recently discussed how finely balanced interest rate decisions will be. The mixed reports will leave the GBP/USD facing BoE monetary policy uncertainty.

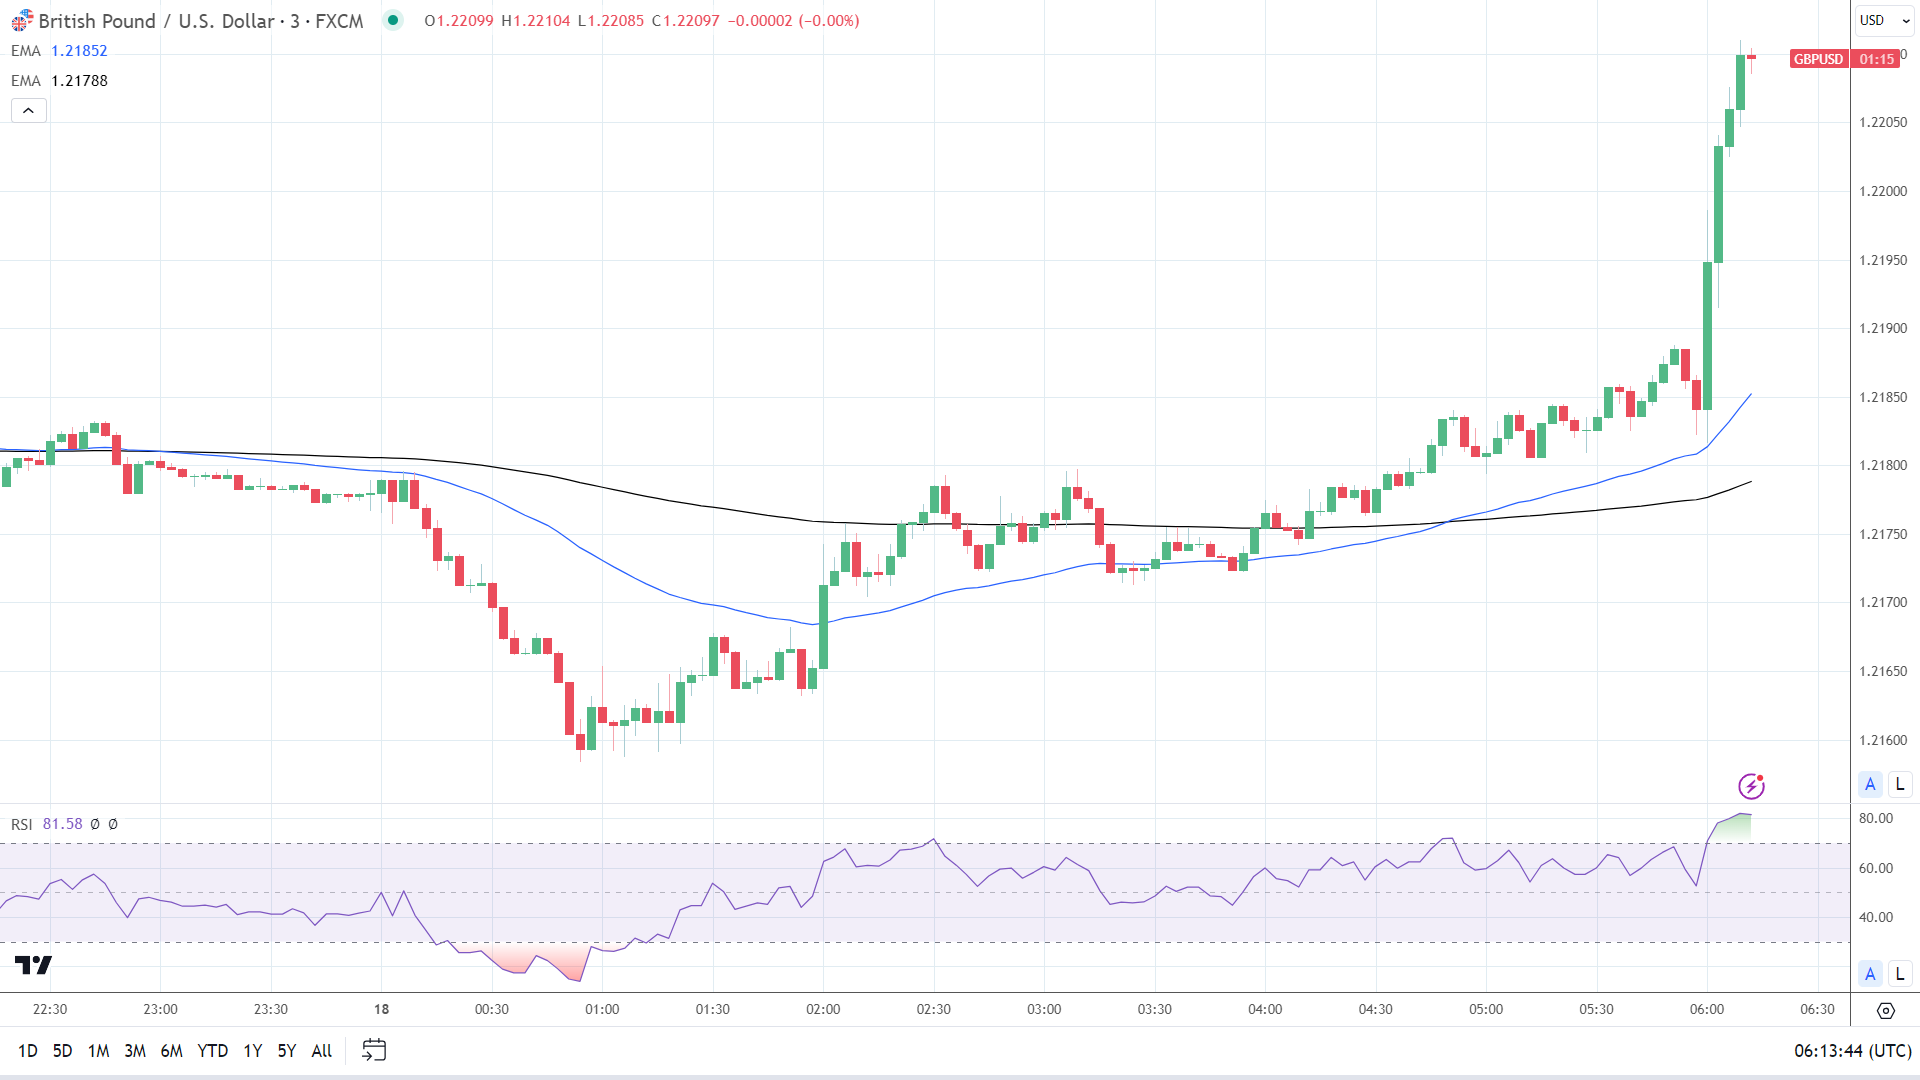
The GBP/USD reacted to the inflation report, rallying from 1.21841 to a post-stat high of $1.22110.
 

A graph with different colored lines Description automatically generated

The Fed, the Middle East, and the Housing Sector in Focus

US housing sector data will draw investor interest on Wednesday. A marked deterioration in housing sector conditions could reignite fear of a hard landing.

The US housing sector contributes less than 20% to the US economy. However, a deteriorating housing sector environment impacts consumer confidence and spending. US private consumption accounts for over 65% of the US economy. A weak consumption outlook may ease pressure on the Fed to lift interest rates.

After better-than-expected US retail sales figures on Tuesday, FM member commentary needs consideration. FOMC Members Christopher Waller, John Williams, Michelle Bowman, and Patrick Harker are on the economic calendar to speak. Reaction to the retail sales report will draw investor interest.

Away from the economic calendar, the Middle East conflict and US President Joe Biden visit will be focal points. An escalation in the conflict would drive buyer demand for the US dollar.

Short-Term Forecast

Sticky inflation may force the BoE to lift rates higher despite softer wage growth figures. Dovish Fed commentary could tilt monetary policy divergence toward the Pound. However, geopolitical tension remains a headwind for the GBP/USD.

GBP to USD Price Action
 

A graph of stock market Description automatically generated


Daily Chart

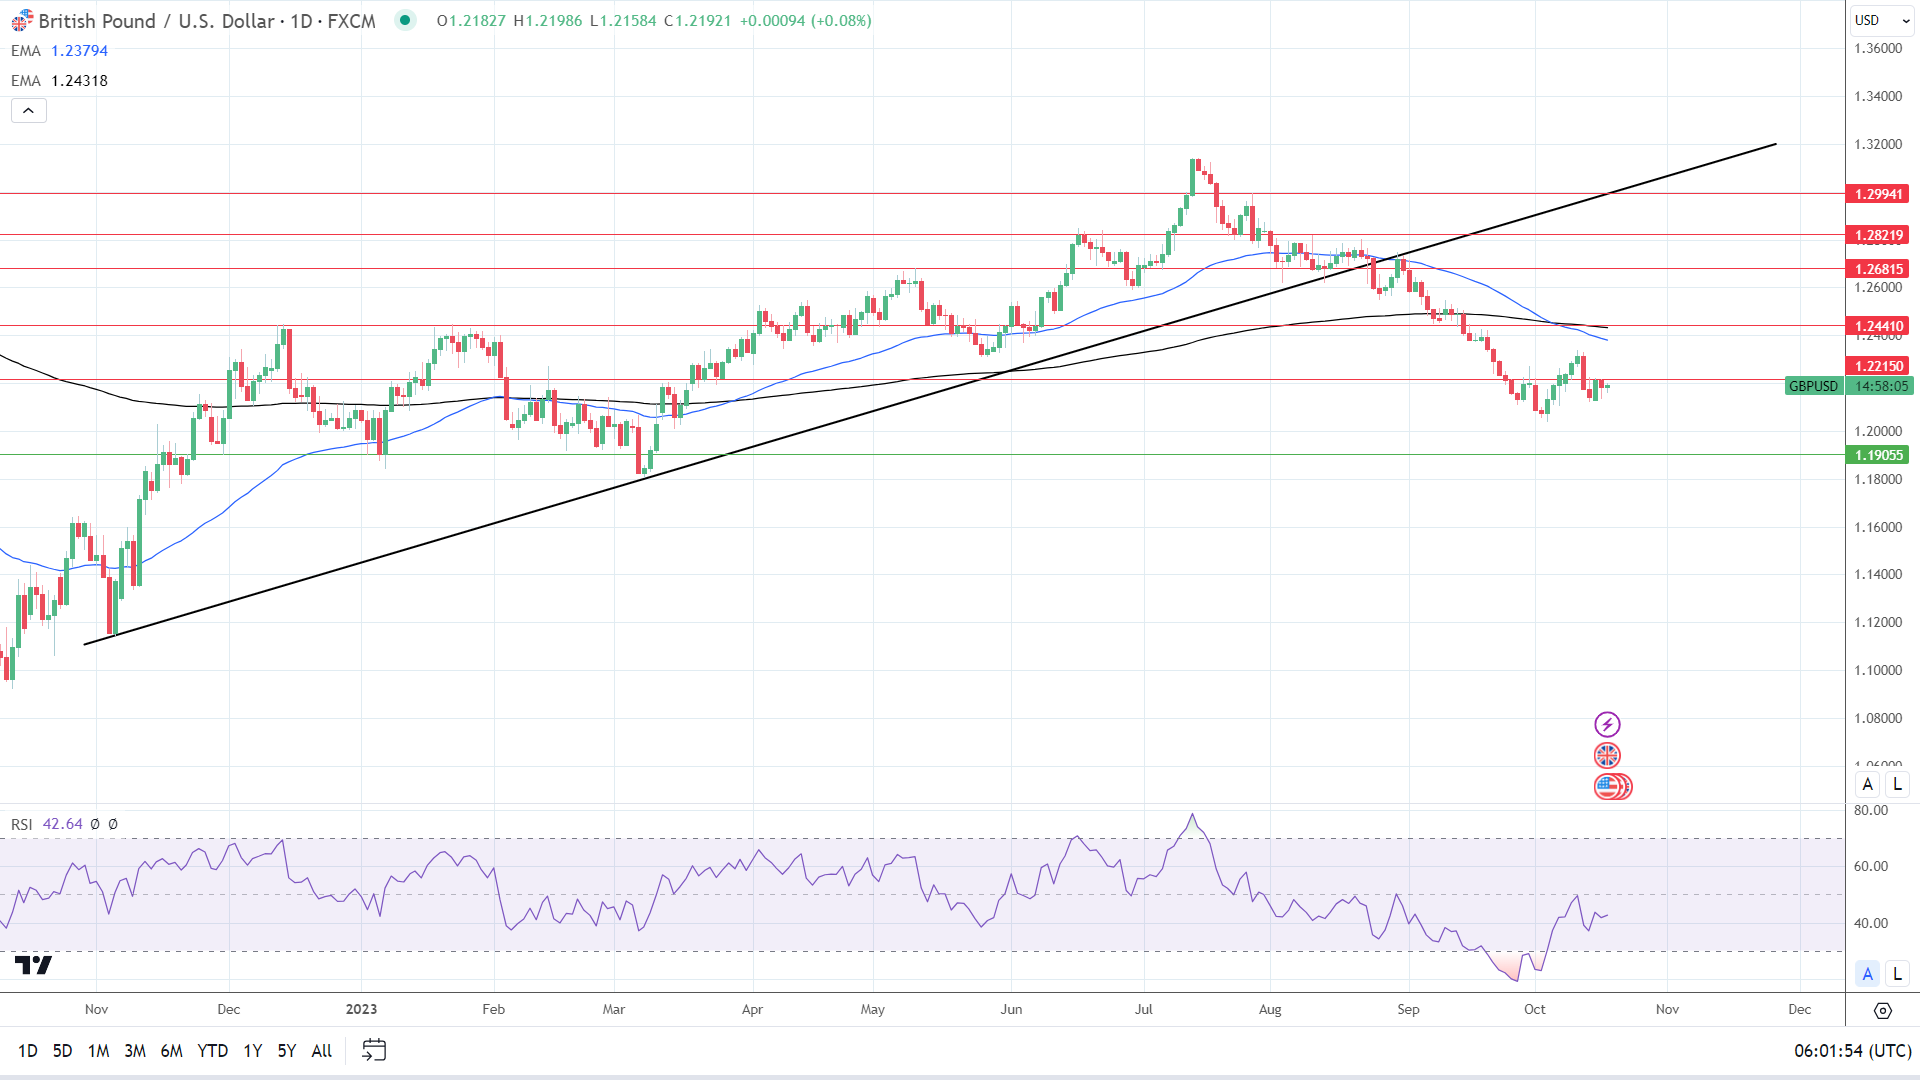
The GBP/USD pair sat below the 50-day and 200-day EMAs, sending bearish price signals.

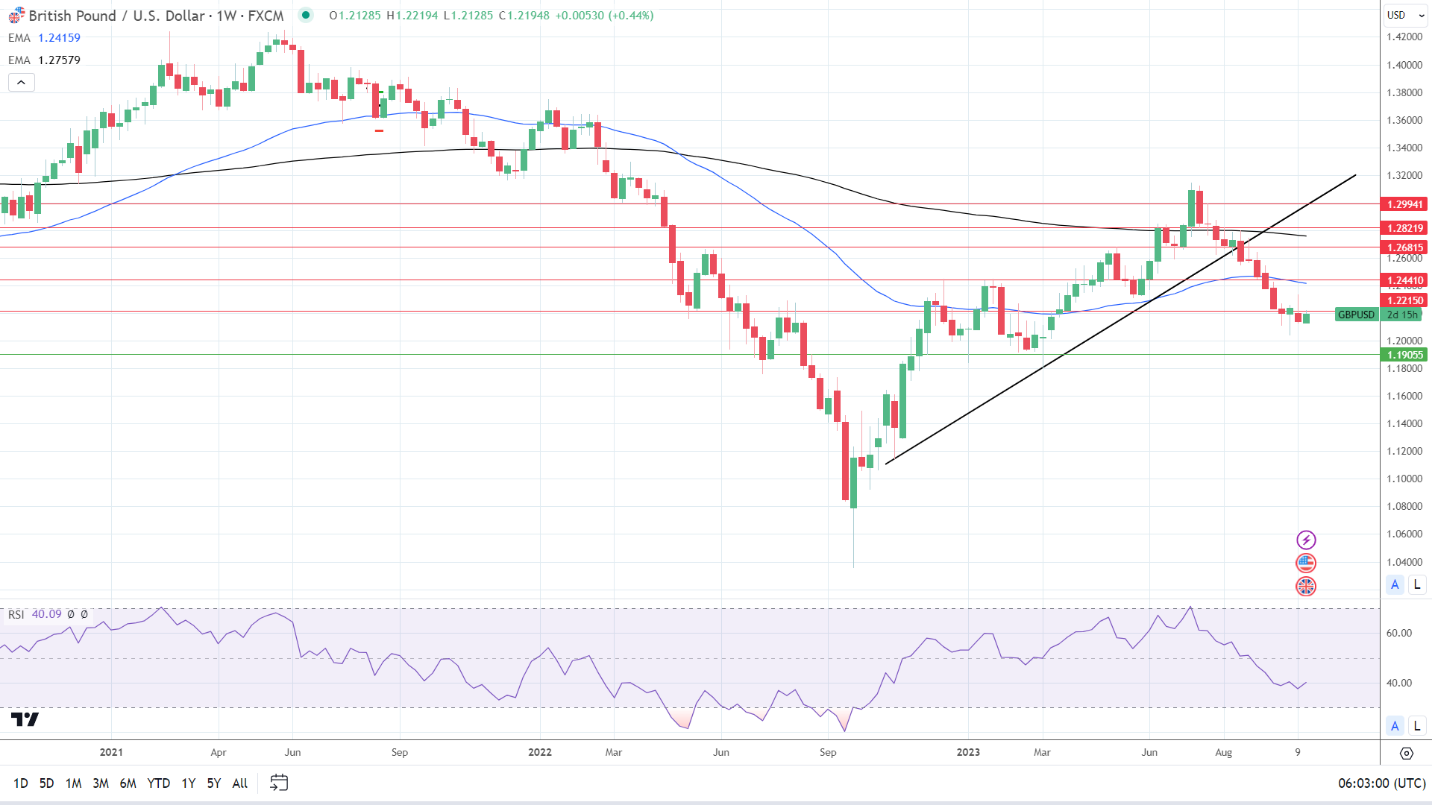
Hawkish Fed commentary and concerns over the Middle East conflict would pressure the GBP/USD. A fall below the session low of $1.21500 would bring sub-$1.21 and the $1.19055 support level into view.

However, a de-escalation in the Middle East and dovish Fed chatter would support a break above the $1.22150 resistance level. A move through the $1.22150 resistance level would give the bulls a run at the 50-day EMA.

The 14-period daily RSI reading of 42.64 suggests a GBP/USD fall below $1.21 before entering oversold territory.
 

A graph of stock market Description automatically generated


4-Hourly Chart

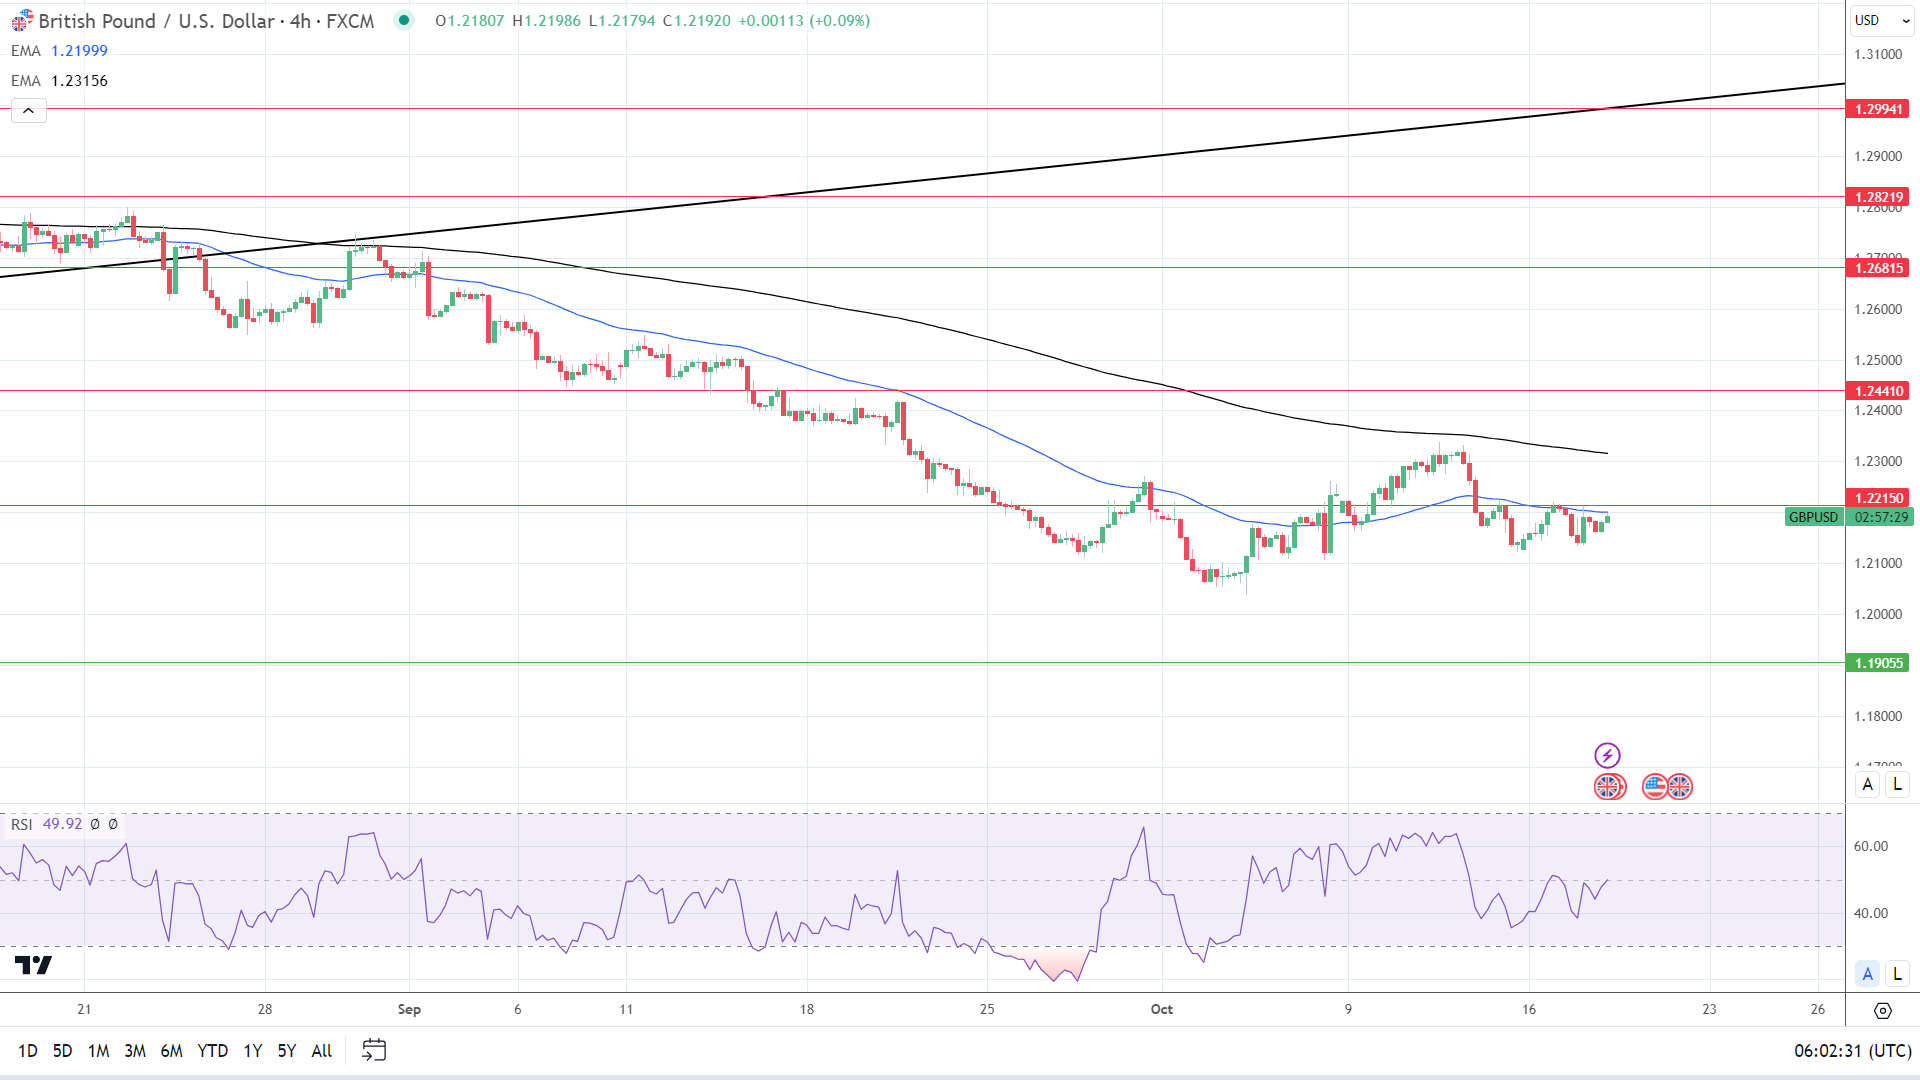
The GBP/USD hovers below the 50-day and the 200-day EMAs, reaffirming bearish price signals.

A GBP/USD breakout from the 50-day EMA and the $1.22150 resistance level would support a move toward the 200-day EMA.

However, failure to break above the 50-day EMA would leave sub-$1.21 and the $1.19055 support level in view.

With an RSI reading of 49.92 for the 14-period 4-hourly Chart, the GBP/USD could drop below $1.21 before entering oversold territory.

 

A graph of stock market Description automatically generated


China Economy Expands by 1.3% in Q3 Compared with 0.8% in Q2

China Economy Expands by 1.3% in Q3 Compared with 0.8% in Q2

Chinese Economy Slowed Less Than Expected in Q3:

Economic indicators from China beat expectations on Wednesday, raising hopes of a turnaround in the Chinese economy.

The economy expanded by 4.9% in the third quarter year-over-year compared with 6.3% in the previous quarter. Economists forecasted growth of 4.4%. Economic activity picked up in the third quarter. The economy grew by 1.3% quarter-on-quarter vs. 0.8% in Q2. Economists predicted growth of 1.0%.

Retail sales and unemployment figures signaled a sharp pickup in activity in September. Retail sales rose by 5.5% in September year-over-year vs. 4.6% in August. Notably, the unemployment rate fell from 5.2% to 5.0%.

Industrial production increased by 4.5% compared with 4.5% in August.

The latest figures suggest stimulus measures from Beijing have been effective in weathering the economic storm.

The Aussie Dollar Reaction to the China Numbers

Before the numbers, the AUD/USD rose to a pre-data high of $0.63670 before falling to a low of $0.63509.

However, in response to the numbers from China, the Aussie dollar fell to a post-stat low of $0.63510 before rising to a high of $0.63751.

This morning, the Aussie dollar was up 0.09% to $0.63705.

AUD/USD responds to better-than-expected economic indicators from China.
181023 AUDUSD 3 Minute Chart

Next Up:

US housing sector data and Fed speeches will garner interest on Wednesday. After the hotter-than-expected US retail sales report, Fed speeches may have more sway on the markets.

Voting members Michelle Bowman, Patrick Harker, Christopher Waller, and John Williams may influence the market bets on Fed rate hikes.

However, investors must monitor news updates on the Middle East conflict. An escalation would fuel a market wide flight to safety and dampen optimism from the China data.

Australian Dollar Forecast: AUD/USD Extends Recovery but Outlook Remains Murky

Australian Dollar Forecast: AUD/USD Extends Recovery but Outlook Remains Murky

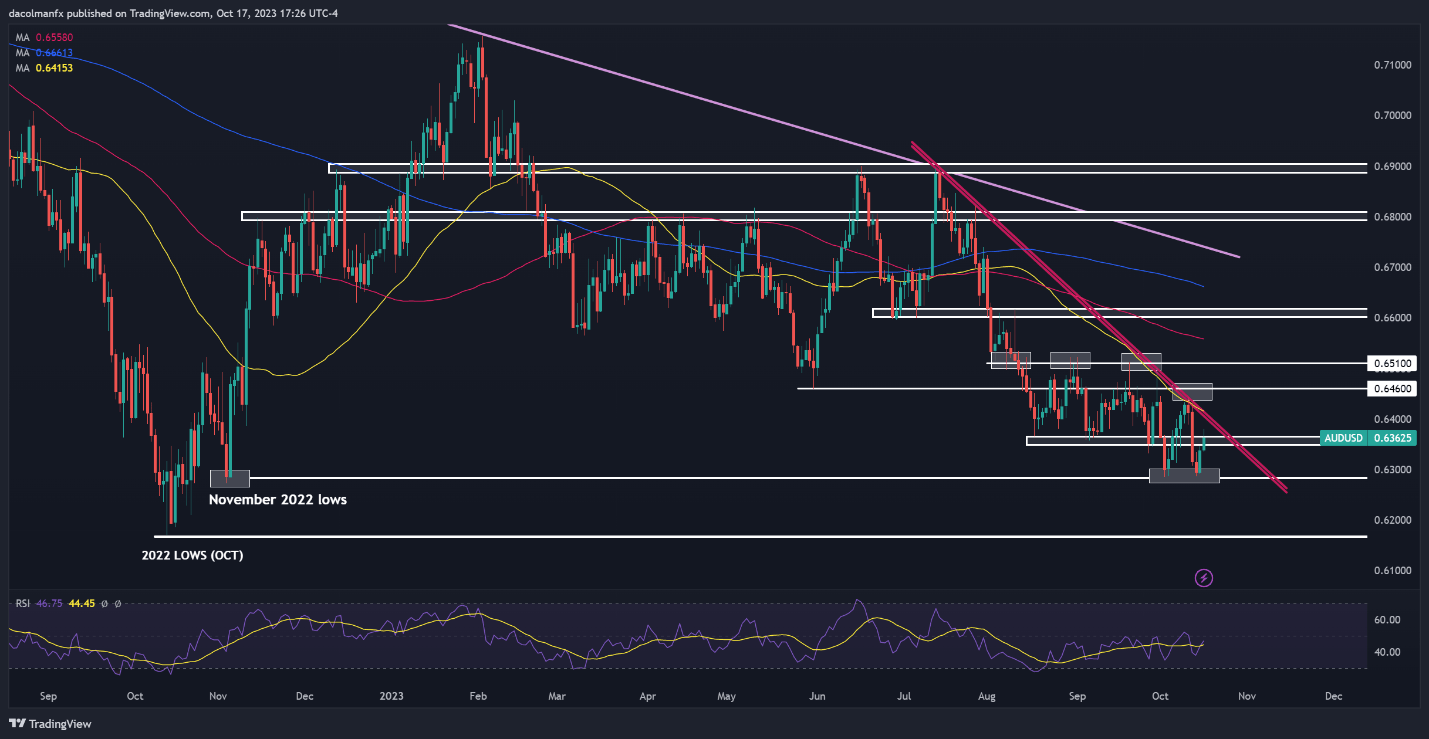
AUD/USD extended its recovery on Tuesday, rising for the second day in a row and breaking above technical resistance in the 0.6350 area. Despite today’s price action, the Australian dollar maintains a negative profile against the U.S. dollar when evaluated through a combination of technical and fundamental analysis.

From a technical vantage point, the continuous sequence of lower highs and lower lows, coupled with the pair’s location below crucial moving averages and beneath a key descending trendline that has been shaping market trends since July, collectively strengthen the earlier assessment of a bearish outlook.

In the realm of fundamentals, the surge in U.S. Treasury yields, fueled by the remarkable resilience of the U.S. economy, and the Fed’s determination to keep interest rates high for an extended period of time in pursuit of price stability create a difficult and rather hostile environment for the Aussie.

The geopolitical climate in the Middle East is also a source of vulnerability for the Australian currency. Although Israel has so far postponed its potential invasion of the Gaza Strip, a ground incursion into the coastal enclave remains a strong possibility in the coming days.

Any escalation of the Israeli-Hamas clash could raise the geopolitical temperature in the region, especially if it draws in other actors like Iran. This scenario could lead to episodes of flight to safety and increased market turbulence, triggering a sell-off in riskier currencies.

Want to stay well-informed about the Australian Dollar’s future and the key market catalysts to watch? All the answers are in our Q4 trading guide. Don’t wait – grab your copy now!

Focusing on technical analysis, AUD/USD rebounded from support around the 0.6300 handle earlier in the week, clearing a key ceiling in the 0.6350 area in subsequent trading sessions. If the pair manages to hold above this region in the coming days, buyers could become emboldened to initiate an assault on trendline resistance at 0.6415. On further strength, we could see a move to 0.6460, followed by 0.6510.

Conversely, if sellers stage a comeback and spark a bearish reversal, initial support lies at 0.6350, but further losses may be in store on a push below this threshold, with the next downside target located in the 0.6300/0.6285 range. Further down the line, the focus shifts to last year’s low near 0.6170.

Interested in learning how retail positioning can shape the short-term trajectory of the Australian Dollar? Our sentiment guide has the information you need—download it now!

AUD/USD TECHNICAL CHART

A screenshot of a graph  Description automatically generated


Gold Price Hangs Tough as Treasury Yields Rise and US Dollar Firms. Higher XAU/USD?

Gold Price Hangs Tough as Treasury Yields Rise and US Dollar Firms. Higher XAU/USD?

The gold price is holding the high ground on perceived haven status despite the return on US government bonds rising to multi-year peaks.

The monetary policy-sensitive 2-year Treasury note traded at 5.24% overnight for the first time since 2006 after red-hot economic data forced the market to re-examine its outlook for the Federal Reserve’s tightening cycle.

US retail sales expanded by 0.7% month-on-month in September, a beat on the 0.3% forecast and slightly stronger than the burgeoning 0.6% for August.

Treasury yields raced higher across the curve with the 5- and 7-year bonds seeing the largest run-up, adding around 15 basis points each. The benchmark 10-year note traded within a whisker of the 4.88% seen earlier this month, the highest since 2007.

In the aftermath, the US Dollar has seen some gains against the Sterling, Yen and Canadian Dollar going into Wednesday’s session and it is mostly steady elsewhere. The Aussie Dollar is a notable exception where the RBA has signalled a more hawkish stance over the last 24 hours.

For gold, the increase in return of a risk-free, or at least a very low-risk, asset like Treasury bonds might normally challenge the price of the precious metal.

However, the unnerving geopolitical backdrop evolving in the Middle East may have seen some support for the perceived haven status for the yellow metal. The situation there appears to be continually evolving and a resolution seems a long way off.

For more information on how to trade the news, click through on the banner below.

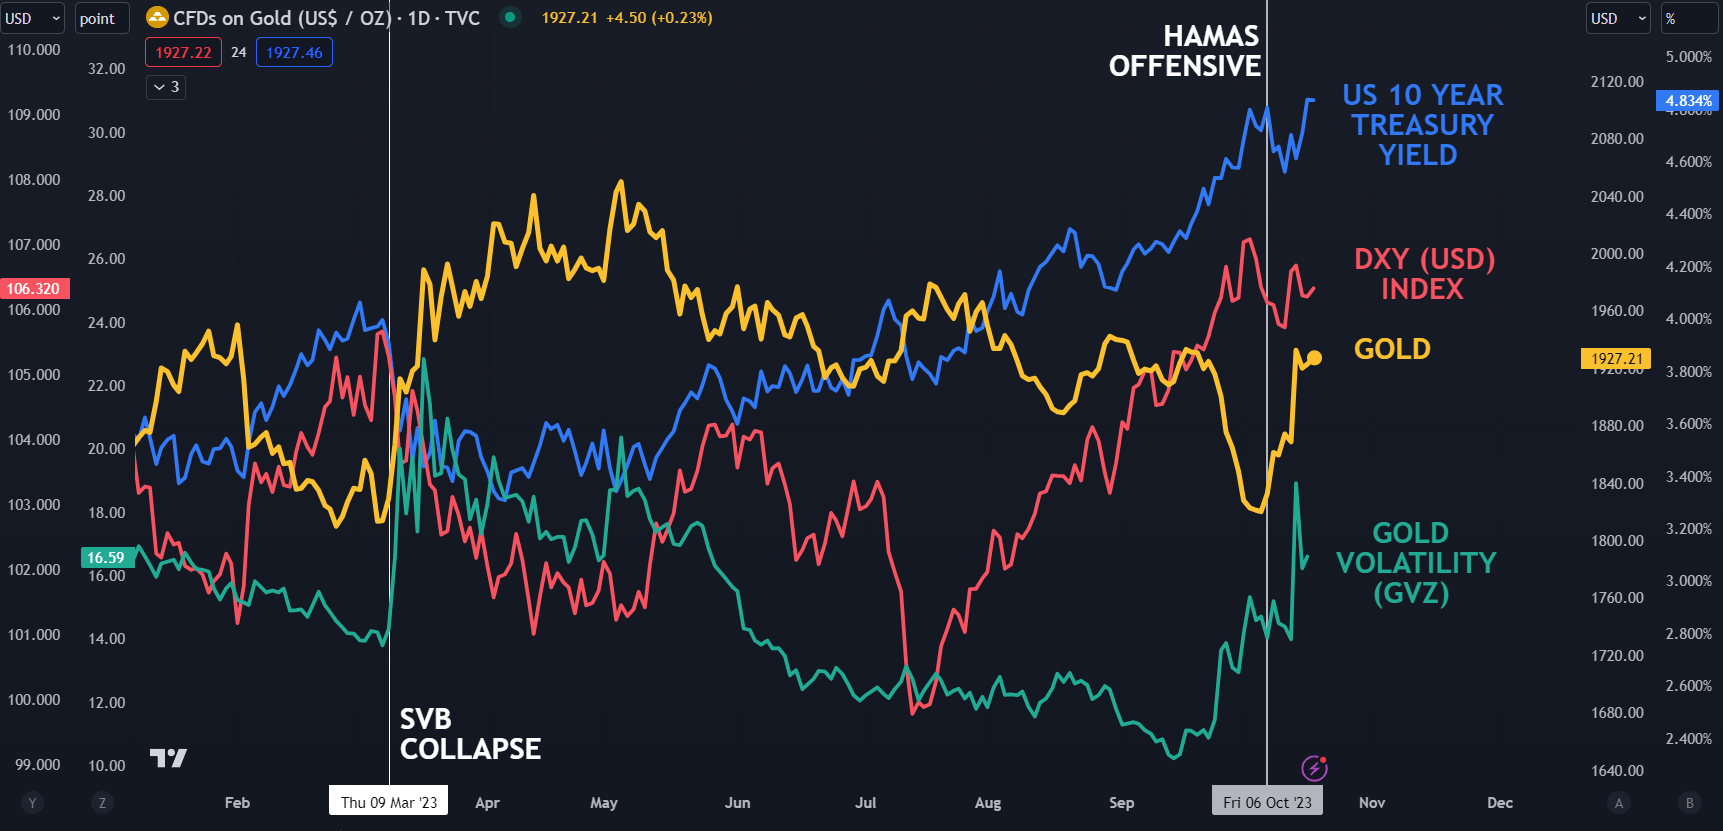
The conflict saw volatility tick higher as measured by the GVZ index, but it has since eased in the last few days. Treasuries were initially bought at the outbreak of the war, pushing yields lower, but that has since reversed.

Looking at the chart below, the rising 10-year Treasury yields and an uptick in the DXY (USD) index are yet to impact the gold price but it might be worth watching should those markets move abruptly.

The GVZ index measures volatility in the gold price in a similar way that the VIX index gauges volatility in the S&P 500.

SPOT GOLD, DXY (USD) INDEX, US 10-YEAR TREASURY AND GVZ INDEX

image1.png

Australian Dollar Jumps After China GDP Beat; What’s Next for AUD/USD?

Australian Dollar Jumps After China GDP Beat; What’s Next for AUD/USD?

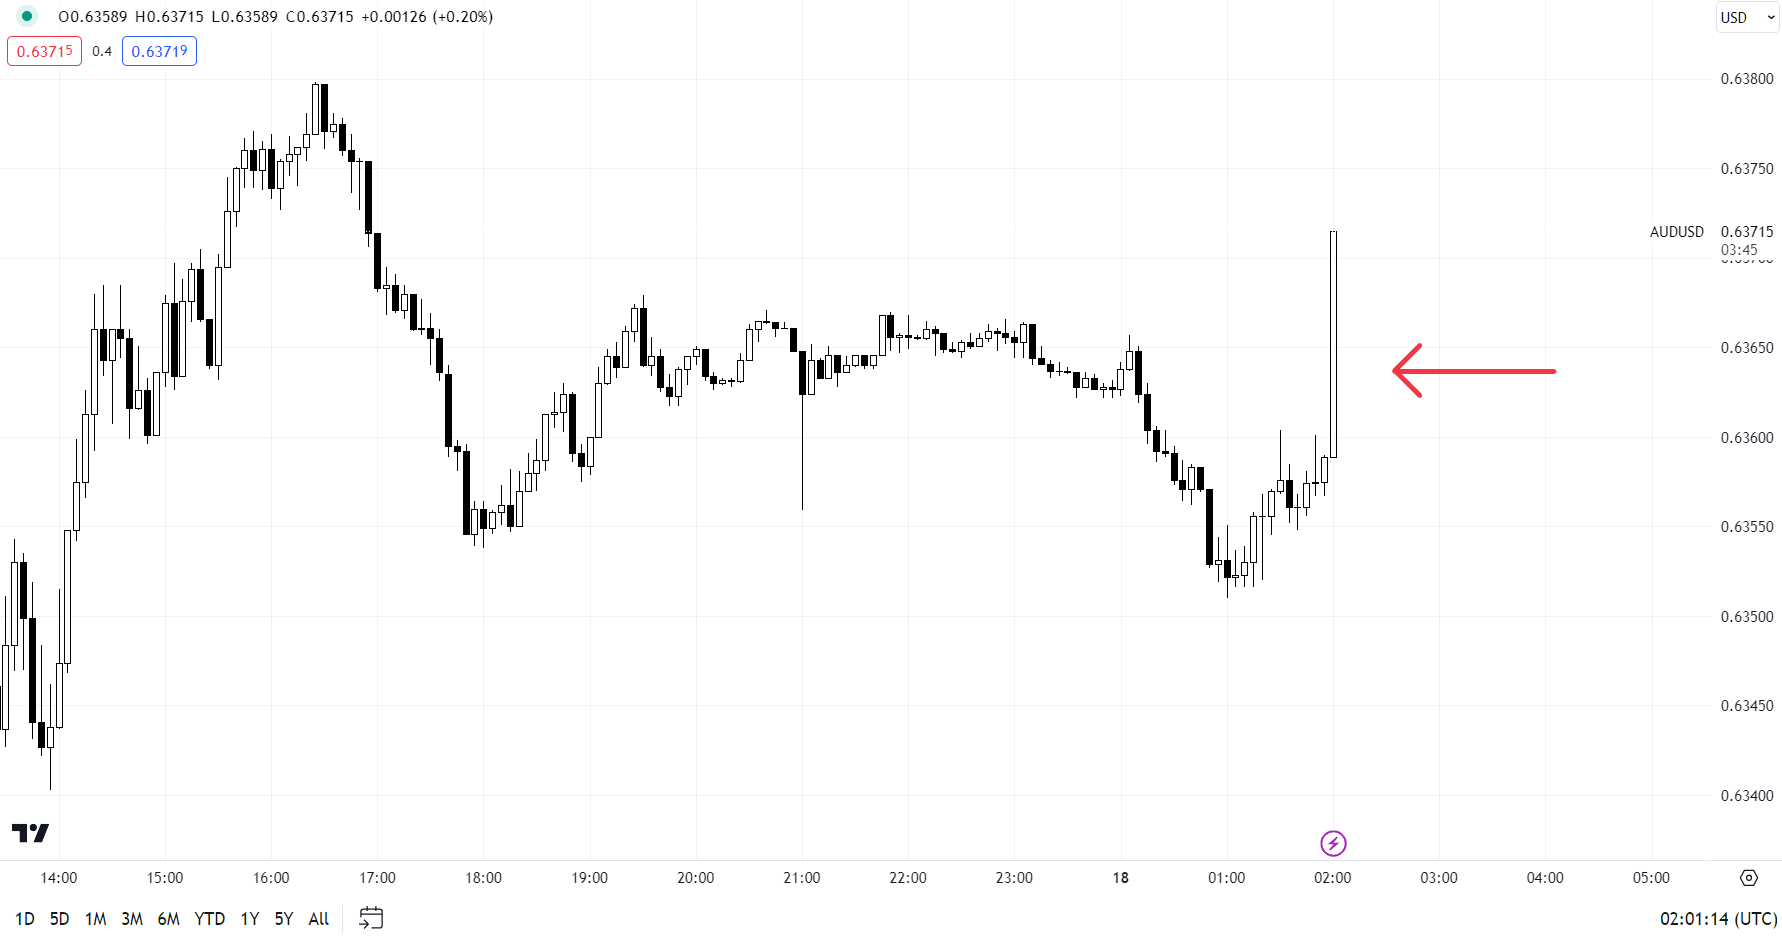
The Australian dollar jumped against the US dollar after the Chinese economy grew more than expected in the July-September quarter.

The Chinese economy grew 4.9% on-year in the July-September quarter, Vs 4.4% expected and 6.3% in the previous quarter. Industrial production grew 4.5% on-year in September, Vs 4.3% expected and 4.5% in August. Retail sales grew 5.5% on-year, Vs 4.9% expected and 4.6% in August. Fixed asset investment grew 3.1% on-year in the January-September period Vs 3.2% expected.

The better-than-expected China data is likely to provide some comfort to investors after inflation data released last week showed domestic demand remains under pressure, suggesting that the economic turnaround could be longer than initially expected. Improving macro data since last month has raised hopes that growth in the second-largest economy could be bottoming, thanks to a series of support/stimulus measures announced by China in recent months.

AUD/USD 5-minute Chart

image1.png

Meanwhile, minutes of the RBA’s October 3 meeting published on Tuesday showed the Board was concerned that inflation wasn’t cooling as hoped, and reiterated that some further tightening may be required. They stressed that they have a very low tolerance for slower return of inflation back to target.

RBA Governor Michele Bullock reiterated the hawkish bias early Wednesday, saying authorities will respond with policy if inflation stays higher than expected. The key focus is now on Australian jobs data is due on Thursday and will likely provide cues heading into the RBA policy meeting next month.

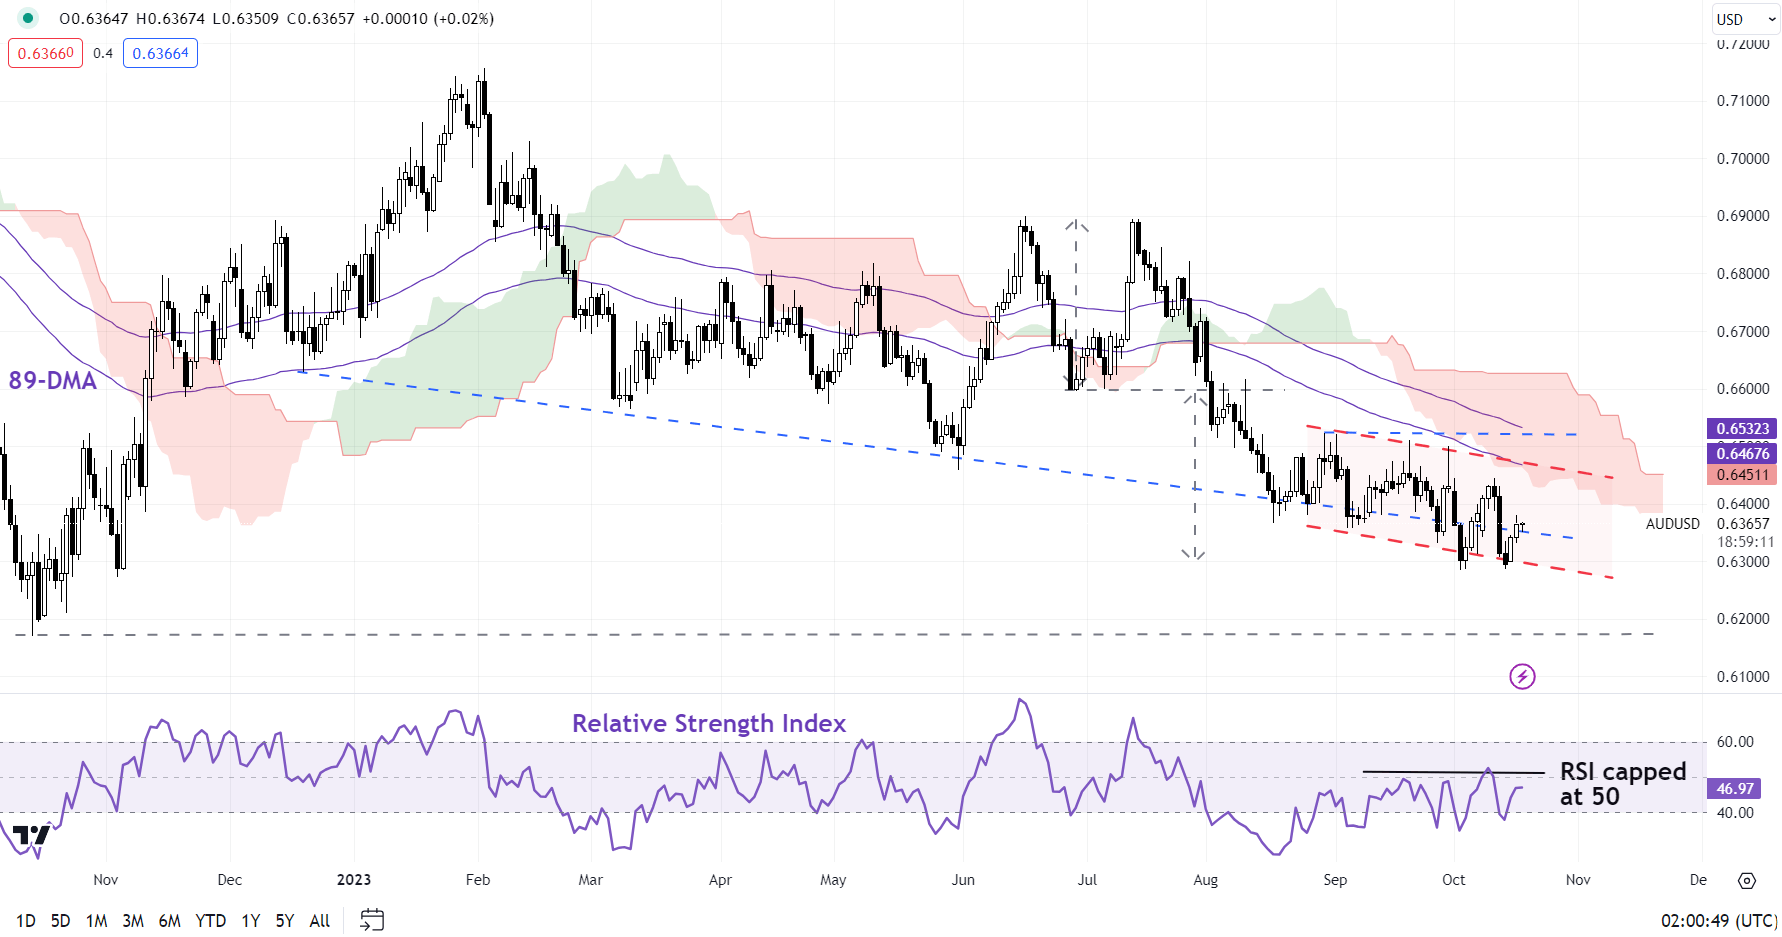
AUD/USD Daily Chart

image2.png

On technical charts, AUD/USD has been holding above support on the lower edge of a declining channel since August, around minor support at the early-October low of 0.6285. While the pair may have stabilized in recent weeks, the short-term downside risks won’t be eliminated unless AUD/USD breaks above resistance at the end-August high of 0.6525.

Given concerns that the Middle East conflict could widen, the bar appears to be rather high for the pair to witness a sustained rebound. The 14-day Relative Strength Index has been capped at 50-55 suggesting the broader trend remains down. Subsequent barrier is on the upper edge of the Ichimoku cloud on the daily charts.

US Dollar Steadies as Treasury Yields Surge, WTI Crude Gains and EUR/USD Firms

US Dollar Steadies as Treasury Yields Surge, WTI Crude Gains and EUR/USD Firms

The US Dollar has slipped through the Asian session after making some headway overnight on the back of Treasury yields pushing toward multi-year peaks.

US retail sales rose by 0.7% month-on-month in September, higher than the 0.3% anticipated and slightly better than the burgeoning 0.6% for August.

Treasury yields leapt higher across the curve with the 5- and 7-year bonds seeing the largest gains, adding around 15 basis points each.

The monetary policy-sensitive 2-year Treasury note traded at 5.24% overnight for the first time since 2006 while the benchmark 10-year note traded within a whisker of the 4.88% seen earlier this month, the highest since 2007.

Despite the run-up in yields, spot gold rallied to a 1-month peak above US$ 1,940 as the fallout from the rocket attack on a Palestinian hospital continues with both sides blaming each other.

The meeting between US President Joe Biden and Arab leaders has been put on ice and crude oil added over 2% as it eyes the highs seen last week.

The WTI futures contract traded up to US$ 88.80 bbl while the Brent contract touched US$ 92.18 bbl. Both contracts have eased going into the European session.

AUD/USD has been a notable mover in the last few sessions after yesterday’s hawkish RBA meeting minutes were backed up by RBA Governor Michele Bullock’s comments at a summit today. Interest rate markets now have a 25 basis point hike priced in by the end of 3Q 2024.

China’s GDP also assisted the Aussie Dollar after it came in at 1.3% quarter-on-quarter for 3Q, above the 0.9% forecast and 0.8% prior.

Chinese President Xi Jinping spoke at the Belt and Road forum in Beijing and talked up the initiative, adding that restrictions on foreign investment for manufacturing will be eased.

Meanwhile, China’s property sector continues to provide an anxious backdrop for investors with Country Garden bond holders yet to receive their latest coupon payments so far today.

APAC equities have had a mostly lacklustre day following on from Wall Street’s lead although China’s CSI 300 index has traded over 0.5% lower despite the upbeat GDP figures there.

The Bank of Japan lent into the bond market today to curd rising Japanese Government Bond (JGB) yields. The 10-year JGB nudged over 0.81% in pre-Japan trade for the first time since 2013. USD/JPY has had a quiet day trading above 149.50.

Looking ahead, after UK and Euro-wide inflation data, the US will see housing starts and building permits figures for September.

UR/USD TECHNICAL ANALYSIS

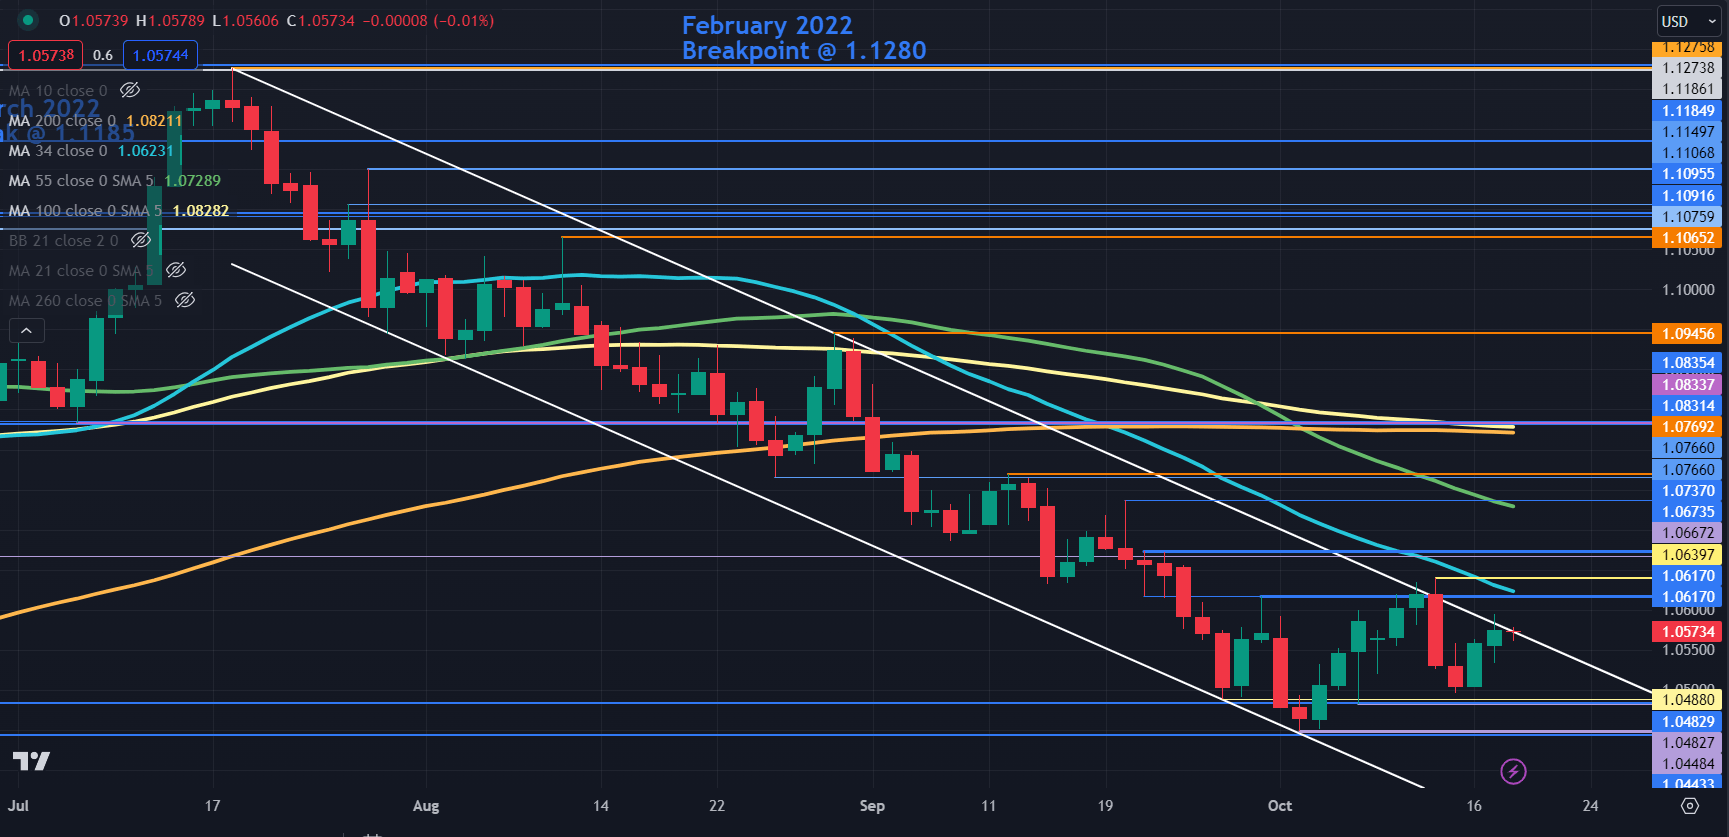
EUR/USD steadied again today after it nudged higher overnight, testing the upper band of a descending trend channel.

A clean break above the trend line might signal that the overall bearish run might be pausing and a possible reversal may unfold if that were to occur.

To learn more about breakout trading, click on the banner below.

Nearby resistance could be at the breakpoint and prior high near 1.0620 which coincides with the 34-day simple moving average (SMA).

Similarly, resistance could be at another prior peak at 1.0673 which is near the 55-day SMA.

Above those levels, the 100- and 200-day SMAs may offer resistance near the breakpoint at 1.0830.

On the downside, support might lie near the breakpoints and lows of early 2023 that were tested recently with 1.0480 and 1.0440 as potential levels of note.

EUR/USD DAILY CHART

image1.png

Chart Created in TradingView

New Zealand Dollar Up After China Data Beat; NZD/USD, EUR/NZD, GBP/NZD, AUD/NZD

New Zealand Dollar Up After China Data Beat; NZD/USD, EUR/NZD, GBP/NZD, AUD/NZD

The New Zealand dollar recouped early losses on Wednesday against the US dollar after the Chinese economy grew faster than expected. Industrial output and retail sales also beat expectations, keeping alive hopes that growth in the world’s second-largest economy could be bottoming. For more details, see “Australian Dollar Jumps After China GDP Beat; What’s Next for AUD/USD?” published October 18.

NZD is attempting to regain some of Tuesday’s sharp losses caused after New Zealand inflation moderated more than expected in the third quarter, reducing the need for further imminent tightening. Inflation remains well above the Reserve Bank of New Zealand’s target of 1%-3%, suggesting interest rates could remain higher for longer to ensure inflation returns to the target range. Moreover, escalating tensions in the Middle East have kept risk appetite in check, weighing on the risk-sensitive NZD.

NZD/USD Daily Chart

image1.png

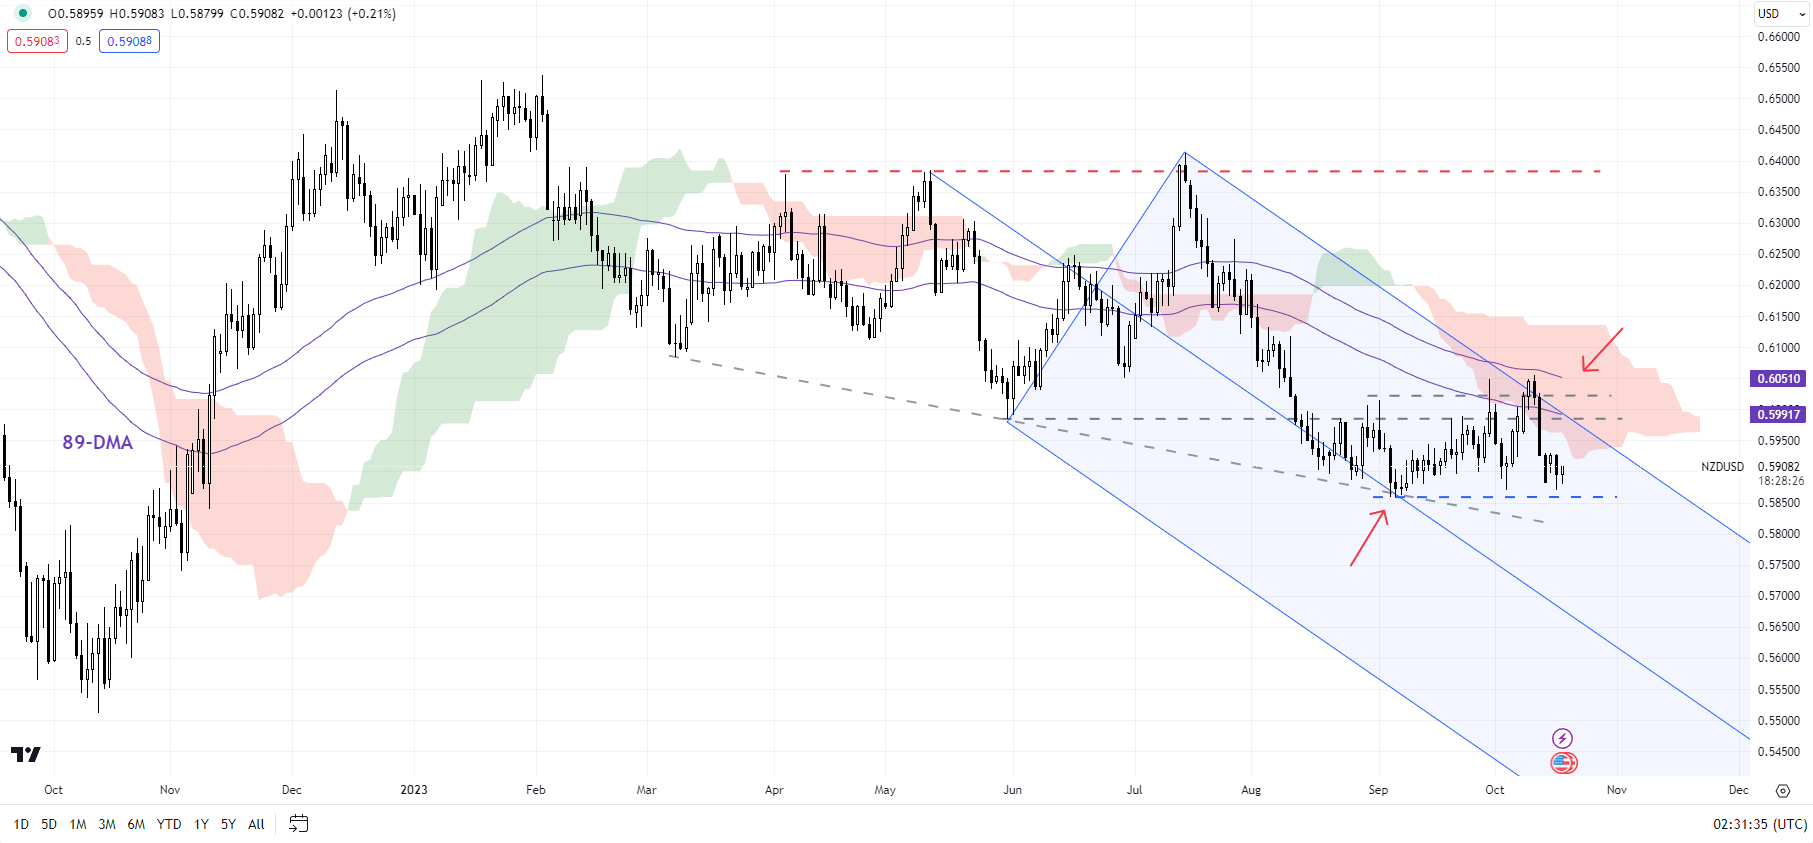
NZD/USD: Setting a base?

On technical charts, NZD/USD’s hold in recent weeks above the September low of 0.5850 is an encouraging sign for bulls. However, NZD/USD needs to cross above the immediate hurdle at 0.6000-0.6050, including the early-September high and the early-October high, for immediate downside risks to fade. Such a break could pave the way toward the 200-day moving average (now at about 0.6150). On the downside, a crack under 0.5850 could open the door toward the November 2022 low of 0.5750.

Discover the power of crowd mentality. Download our free sentiment guide to decipher how shifts in NZD/USD’s positioning can act as key indicators for upcoming price movements.

EUR/NZD Daily Chart

image2.png

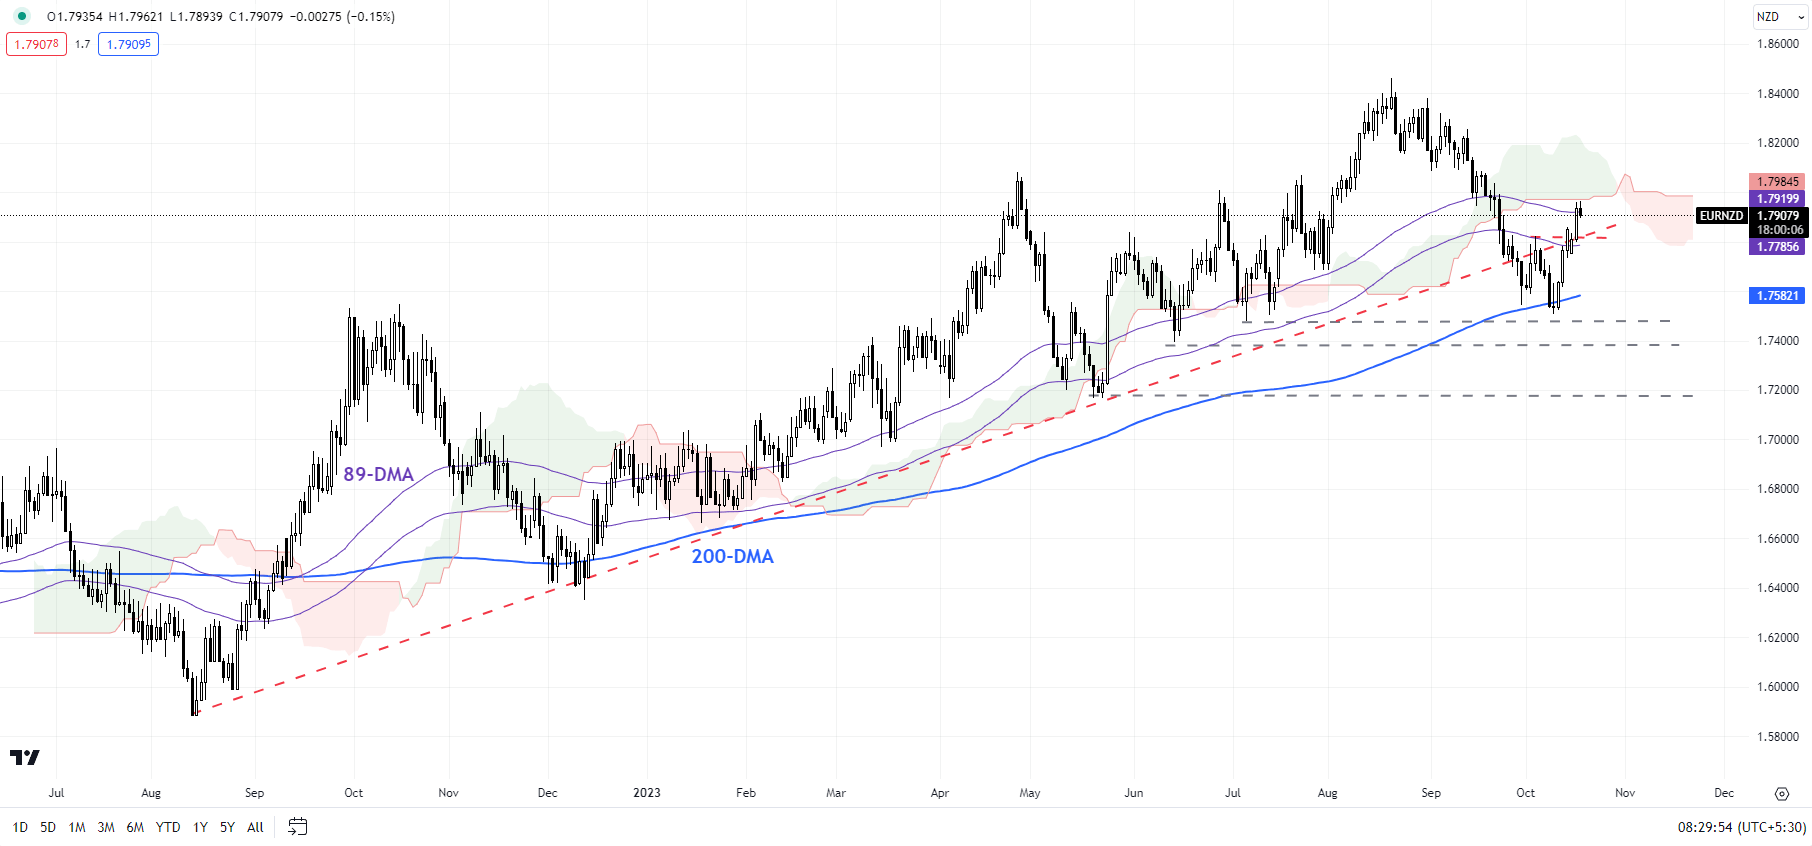
EUR/NZD: 200-DMA holds for now

EUR/NZD has rebounded from quite a strong cushion on the 200-day moving average. However, the upside could be capped as it nears a vital ceiling on the 89-day moving average, coinciding with the upper edge of the Ichimoku cloud on the daily charts. EUR/NZD would need to clear the cloud, at minimum, for the immediate downside risks to dissipate. Next support is at the June low of 1.7400 followed by the May low of 1.7150.

AUD/NZD Daily Chart

image3.png

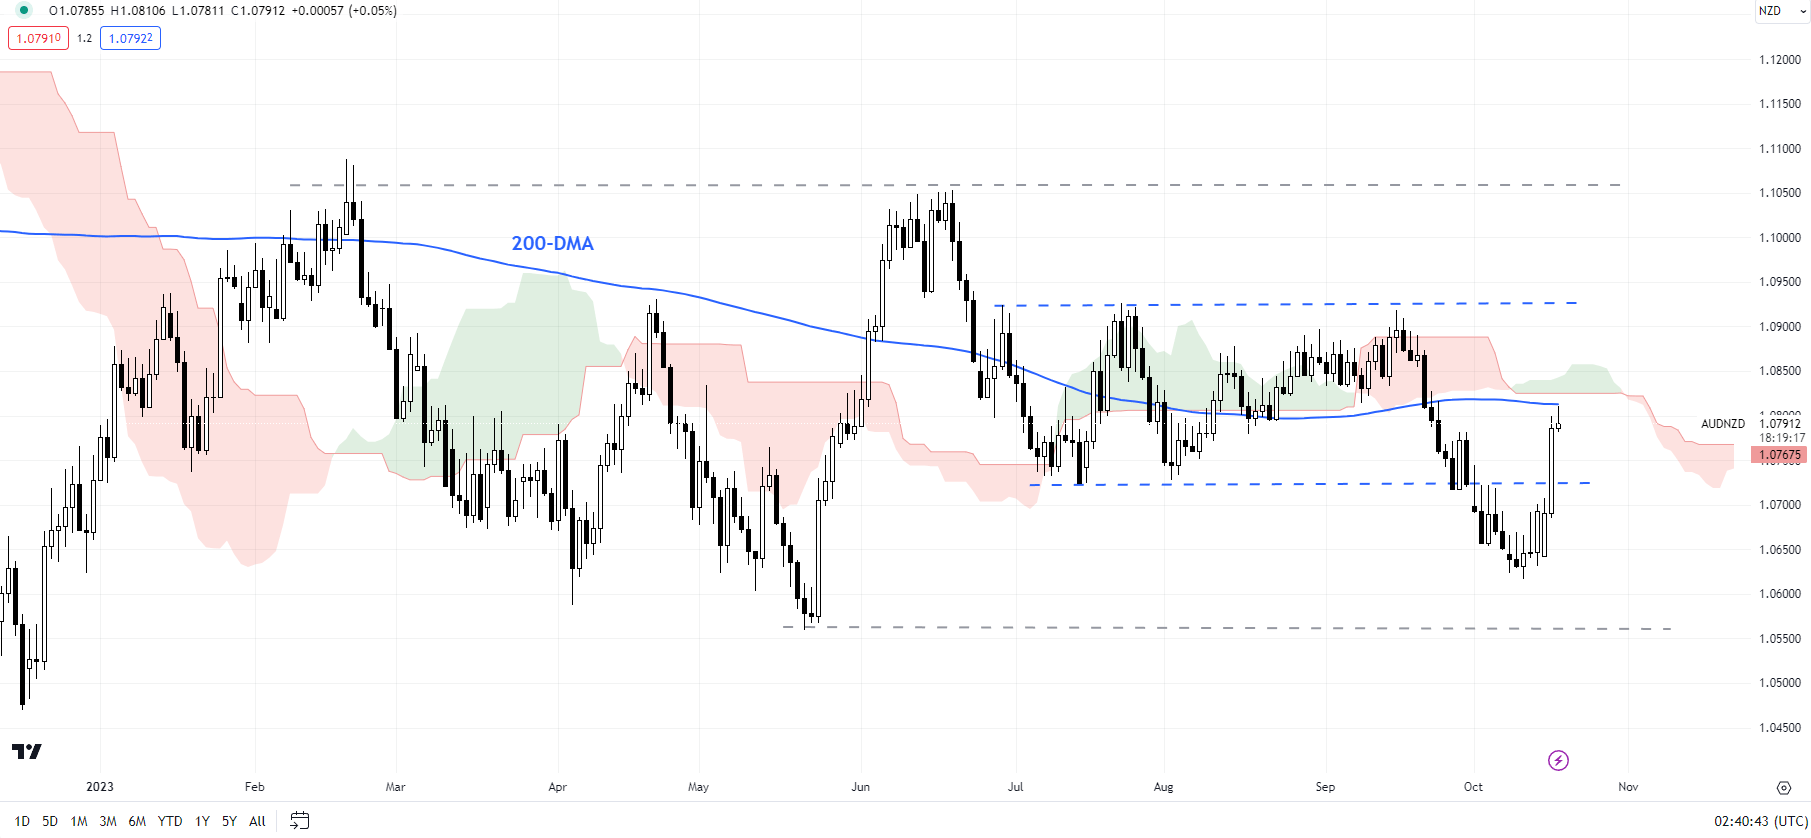
AUD/NZD: In search of a clear direction

The failure to hold losses after last month’s break below key support at the July low of 1.0720 confirms that AUD/NZD remains largely directionless. The broader range established is 1.05-1.11. A break above 1.11 or a break below 1.05 is needed for AUD/NZD to start trending again.

GBP/NZD Daily Chart

image4.png

GBP/NZD: Rebound could run out of steam

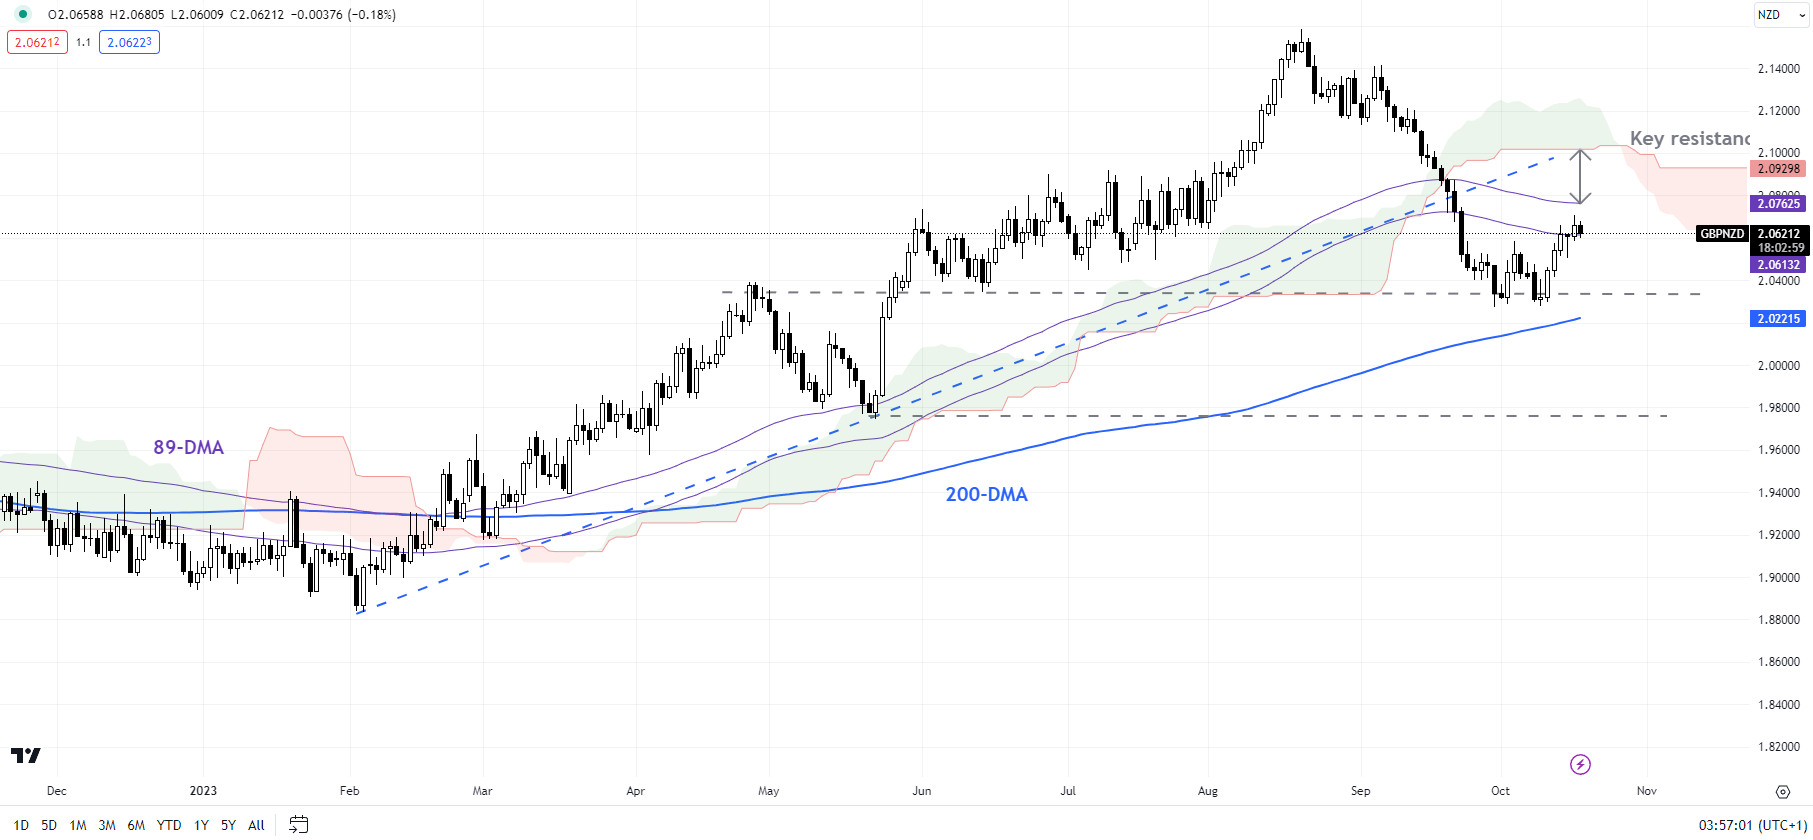
GBP/NZD’s rebound could soon run out of steam as it nears stiff resistance on the 89-day moving average, slightly under another significant hurdle on the Ichimoku cloud on the daily charts. This follows a break below key support on an uptrend line from February, confirming that the upward pressure has faded in the interim. Any break below the September low of 2.0275 could open the way toward the May low of 1.9750.

GBP Breaking News: Pound Unmoved After UK CPI Beat

GBP Breaking News: Pound Unmoved After UK CPI Beat

GBPUSD FUNDAMENTAL BACKDROP

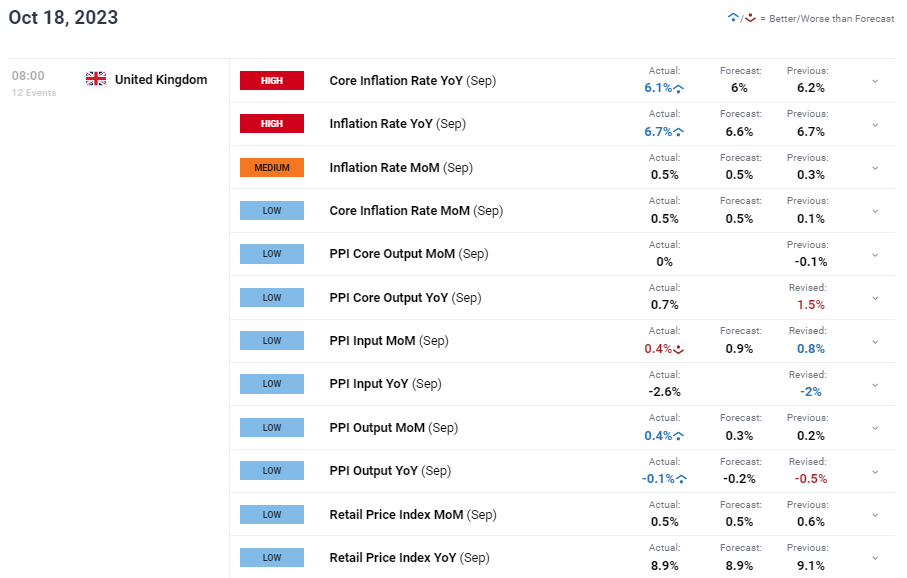
UK CPI data (see economic calendar below) showed a continued decline in both headline and core inflation respectively despite actual figures marginally beating forecasts. Overall the report is largely in line with expectations but shows some resilience of inflationary pressures within the UK economy. Higher crude oil prices saw motor fuel being the largest upward contributor to the change in annual rates, while moderating pressures arose from food and non-alcoholic beverages and furniture and household goods (Source: ONS).

A decline in PPI is promising and being a leading indicator for CPI, could see future CPI figures fall as well. The BoE will look at this closely ahead of the November meeting.

GBP/USD ECONOMIC CALENDAR (GMT +02:00)

image1.png

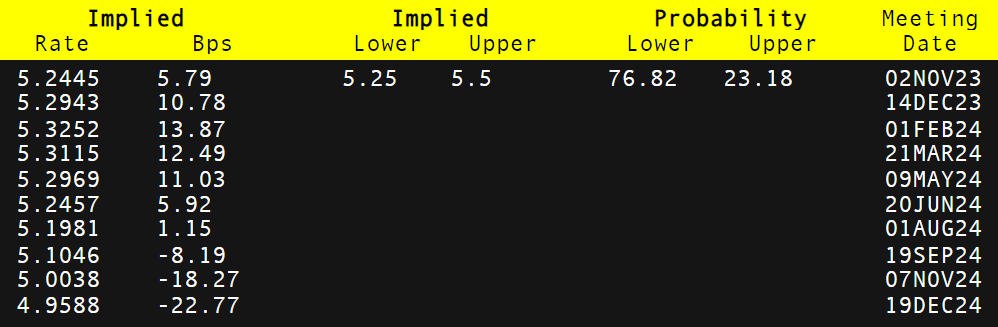
The British pound found some support post-announcement against the US dollar but little change was seen in money market pricing expectations (refer to table below). Bank of England (BoE) rate projections remain in favor of a pause in the November meeting and with global central banks likely adopting the same standpoint due to escalating geopolitical tensions in the Middle East, incoming data will be closely monitored to gauge the BoE’s next steps – jobs data due on October 24 next week.

BANK OF ENGLAND INTEREST RATE PROBABILITIES

image2.png

TECHNICAL ANALYSIS

GBP/USD DAILY CHART

image3.png

Chart prepared by Warren Venketas, IG

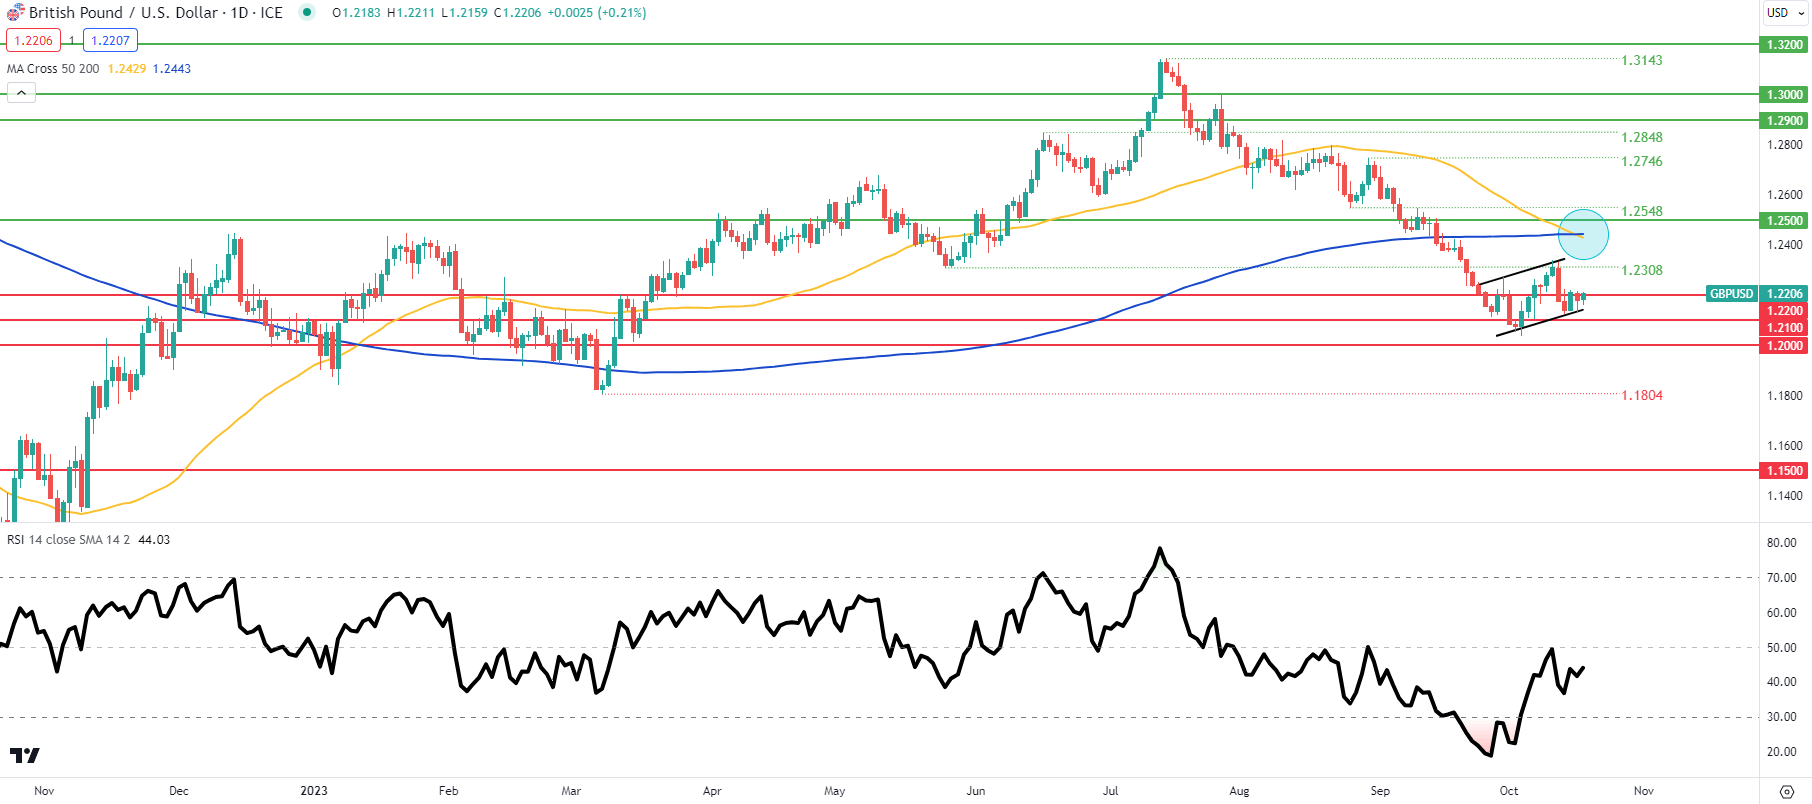
Price action on the daily cable chart shows the pair trading within a bear flag formation (black) around the 1.2200 psychological level. Bears will be hopeful that the addition of a death cross (blue) could spark a break below flag support and push the pair lower towards subsequent support zones. From a momentum perspective, the Relative Strength Index (RSI) supplements this outlook with levels under the midpoint meaning a preference towards the downside.

Key resistance levels:

  • 50-day MA (yellow)/200-day MA (blue)
  • Flag resistance
  • 1.2308

Key support levels:

  • 1.2200
  • Flag support
  • 1.2100
  • 1.2000
  • 1.1804

BEARISH IG CLIENT SENTIMENT (GBP/USD)

IG Client Sentiment Data (IGCS) shows retail traders are currently net LONG on GBP/USD with 69% of traders holding long positions (as of this writing).

US Retail Sales Beat Expectations, Fueling Market Optimism Amid Rate Hikes

US Retail Sales Beat Expectations, Fueling Market Optimism Amid Rate Hikes

U.S. Retail Sector Shows Resilience Amid Rate Hikes

The U.S. retail and food services sector posted stronger-than-expected performance in September 2023. According to advance estimates, sales reached $704.9 billion, marking a 0.7% increase from the previous month and a 3.8% year-over-year rise. Adjustments have been made for seasonal variation, holidays, and trading days, but not price changes. The total sales for the July to September 2023 quarter also rose 3.1% compared to the same period last year.

The Retail Picture

Retail trade sales mirrored the general trend, rising by 0.7% from August and by 3.0% compared to last year. The highlight of the report was the performance of nonstore retailers and food services, which showed significant year-over-year growth. Nonstore retailers, including e-commerce platforms, experienced an 8.4% uptick, while food services and drinking places recorded a robust 9.2% increase.

Investor Sentiment and Market Reaction

The buoyant retail numbers have significant implications for investors, given that consumer spending accounts for approximately two-thirds of the U.S. economy. Better-than-expected retail data have been a cornerstone in the economy’s resilience against higher interest rates and have buoyed the stock market, particularly the S&P 500, which is up around 13% year-to-date.

Balancing Inflation and Economic Stability

However, the retail data has a double-edged sword effect. A stronger-than-expected number could fan inflationary concerns and put pressure on the Federal Reserve to maintain elevated interest rates. On the flip side, weaker numbers would raise concerns about the U.S. economy’s stability, especially when borrowing costs are already at their highest levels in decades.

Short-Term Forecast

In summary, the current retail sales data paint a broadly bullish picture for the U.S. economy and market sentiment. However, these numbers also put the Federal Reserve in a tight spot, balancing the risks of inflation and economic downturn. Therefore, investors should keep a close eye on consumer spending trends and Federal Reserve actions in the coming weeks.

EUR/USD Forecast – Euro Continues to Consolidate

EUR/USD Forecast – Euro Continues to Consolidate

Euro vs US Dollar Technical Analysis

The euro initially fell a bit during the trading session on Tuesday, but then turned around to show signs of life again. Now it looks like we can continue to bounce around in this channel, which of course could end up being a major part of a bearish flag. With this being the case, I think you’ve got a situation where we could bounce a little bit from here, only to see the market show a significant amount of resistance above. Ultimately, I do think that the euro has a lot to prove, due to the fact that we not only have US dollar strength in general, but we also have to worry about the European Union slipping into a recession.

Trading Derivatives carries a high level of risk to your capital and you should only trade with money you can afford to lose. Trading Derivatives may not be suitable for all investors, so please ensure that you fully understand the risks involved, and seek independent advice if necessary. A Product Disclosure Statement (PDS) can be obtained either from this website or on request from our offices and should be considered before entering into a transaction with us. Raw Spread accounts offer spreads from 0.0 pips with a commission charge of USD $3.50 per 100k traded. Standard account offer spreads from 1 pips with no additional commission charges. Spreads on CFD indices start at 0.4 points. The information on this site is not directed at residents in any country or jurisdiction where such distribution or use would be contrary to local law or regulation.

The ECB is likely to start loosening its monetary policy much quicker than the Federal Reserve, and that is being shown on this chart. The 50-Day EMA is approaching the top of the flag part of the pattern, so that’ll be interesting to see if it comes into play. A rally from here could reach the 1.0650 level and not even change the overall attitude of the market. Alternatively, if the market were to break down below the 1.05 level, it would kick off a significant amount of momentum to the downside, which is a very real possibility as well.

In the meantime, I would anticipate that this market bounces around in a bit of a grind, as investors are starting to pay close attention to earnings calls on Wall Street, but also have an eye on the bond market as the yields in the United States continue to climb. The geopolitical situation going on in the Middle East of course has a lot to say as well, as the US dollar is considered to be a safety currency, which might come into vogue again, as there are so many things that concern yourself with. At this point, I still think this favors a “fade the rally” type of approach to the currency pair as we are still very much in the midst of a nasty downturn.