DAX Index: US Retail Sales, Fed Rate Hike Bets, and the Middle East in the Spotlight

DAX Index: US Retail Sales, Fed Rate Hike Bets, and the Middle East in the Spotlight

DAX Monday Overview

On Monday, the DAX gained 0.34%. Partially reversing a 1.55% slide from Friday, the DAX ended the day at 15,238.

Hopes of Containing the Middle East Conflict Delivered Late Support

It was a testy start to the Monday session. Fears of an escalation in the Middle East conflict weighed on riskier assets early in the European session. German wholesale prices added to the negative sentiment.

Trading Derivatives carries a high level of risk to your capital and you should only trade with money you can afford to lose. Trading Derivatives may not be suitable for all investors, so please ensure that you fully understand the risks involved, and seek independent advice if necessary. A Product Disclosure Statement (PDS) can be obtained either from this website or on request from our offices and should be considered before entering into a transaction with us. Raw Spread accounts offer spreads from 0.0 pips with a commission charge of USD $3.50 per 100k traded. Standard account offer spreads from 1 pips with no additional commission charges. Spreads on CFD indices start at 0.4 points. The information on this site is not directed at residents in any country or jurisdiction where such distribution or use would be contrary to local law or regulation.

A more marked decline in wholesale prices aligned with expectations of a German economic recession. Trade data for the Eurozone came in weaker than forecasted, contributing to the morning losses.

However, hopes of diplomatic efforts to contain the Middle East conflict shifted investor sentiment later in the session.

Dovish Fed commentary contributed to the late recovery. FOMC voting member Patrick Harker continued to support a Fed hold on interest rates.

US equities ended the Monday session in positive territory. The Dow and the S&P 500 gained 0.93% and 1.06%, with NASDAQ Composite Index rising by 1.20%.

The Monday Market Movers

Bank stocks led the Monday session. Commerzbank and Deutsche Bank rallied by 4.82% and 1.73%, respectively. News of RBC upgrading UBS to outperform drove demand for bank stocks.

However, Sartorius AG continued to see heavy losses, falling 3.23%. On Friday, Sartorius AG tumbled by 13.28% as investors responded to the downward revision to its full-year forecast.

Euro Area Economic Sentiment and the ECB in Focus

ZEW Economic Sentiment figures for Germany and the Eurozone will draw investor interest on Tuesday. A larger-than-expected fall in the German sentiment figures will test the buying appetite for DAX-listed stocks.

Economists forecast the German ZEW Economic Sentiment Index to fall from -79.4 to -80.8 in October.

With the German economy in the spotlight, ECB commentary also warrants consideration. ECB Executive Board members Luis de Guindos and Kerstin af Jochnick are on the calendar to speak. Hawkish comments on interest rates would pressure the DAX.

US Retail Sales and Fed Speeches May Fuel Fed Rate Hike Bets

However, US retail sales figures and Fed speeches may have more impact on riskier assets.

Better-than-expected consumer spending figures could reignite bets on a Fed interest rate hike. Economists forecast retail sales to increase by 0.3% in September vs. +0.6% in August.

With the US economy in focus, Fed speeches need consideration. The recent CPI Report and a pickup in consumer spending could pressure the Fed into a rate hike.

FOMC members Thomas Barkin, Michelle Bowman, and John Williams are on the calendar to speak.

However, investors must monitor news updates from the Middle East. An escalation in the conflict would fuel a flight to safety and leave the DAX in negative territory.

The futures markets are pointing to a mixed Tuesday session. The DAX is up 14 points, while the NASDAQ mini was down 20 points.

Short-Term Forecast

Near-term trends for the DAX hinge on news updates on the Middle East conflict and Fed interest rate expectations. An escalation in the conflict and better-than-expected US retail sales figures would leave the DAX under pressure.

DAX Technical Indicators

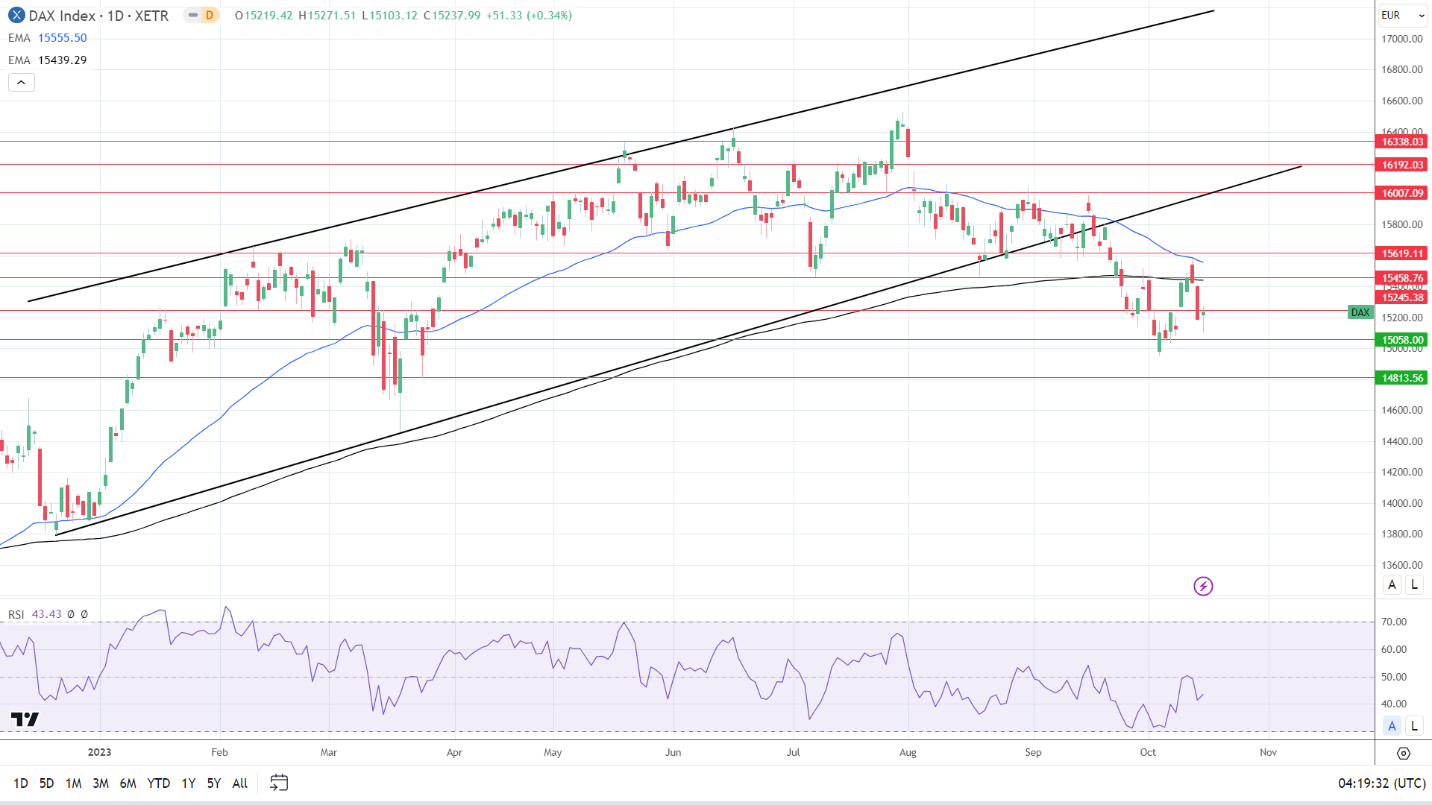
Daily Chart

The DAX remained below the 50-day and 200-day EMAs, sending bearish price signals.

A move through the 15,245 resistance level would give the bulls a run at the 200-day EMA and 15,459 resistance level. Selling pressure will likely cap the upside at 15,450. The 200-day EMA is confluent with the 15,459 resistance level.

However, better-than-expected US retail sales and hawkish Fed commentary would pressure the DAX.

Failure to break above the 15,245 resistance level would leave the 15,058 support level in play.

The 14-day RSI reading of 43.43 supports a DAX move to the 15,058 support level before entering oversold territory.

DAX Daily Chart sends bearish price signals.
DAX 171023 Daily Chart

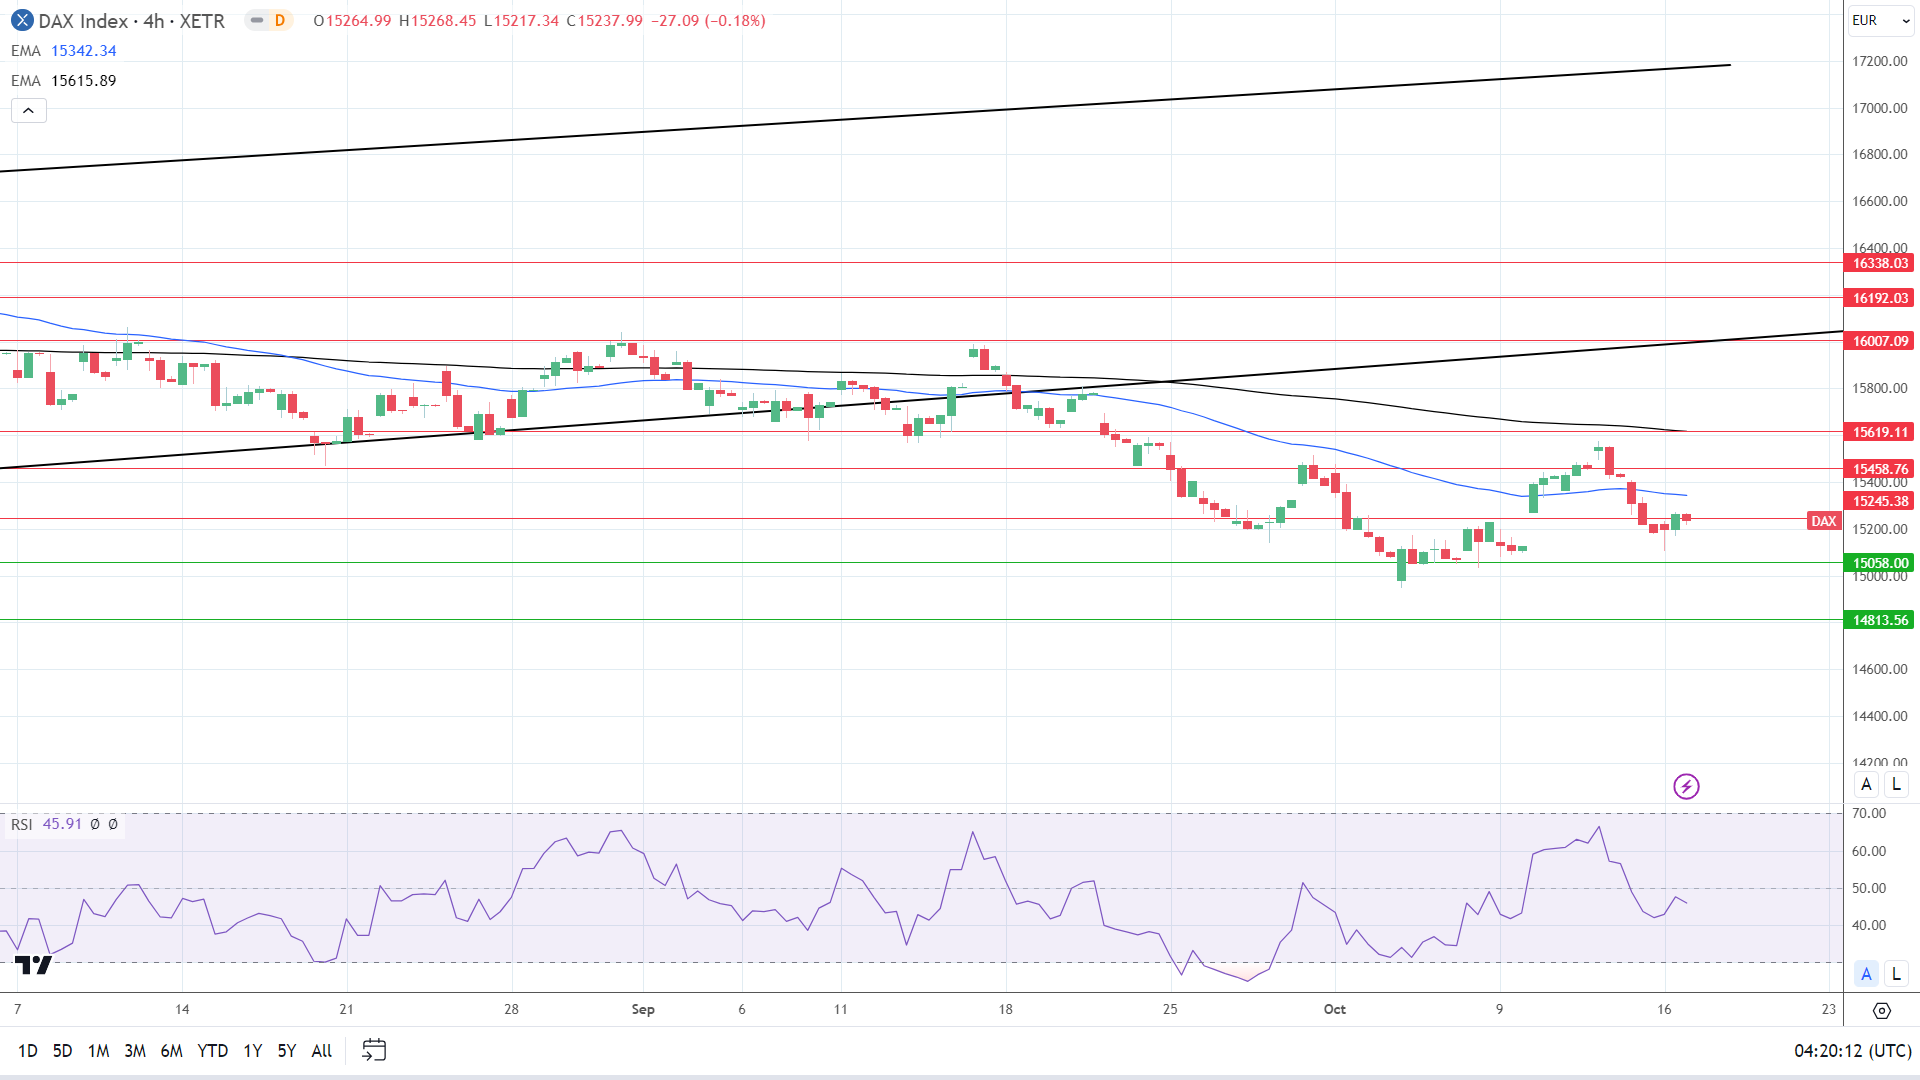
4-Hourly Chart

The DAX remains below the 50-day and 200-day EMAs, affirming bearish price signals. A DAX breakout from the 15,245 resistance level would give the bulls a run at the 50-day EMA.

However, a fall below 15,200 would support a move to the 15,058 support level.

The 45.91 14-4 hour RSI reading indicates a DAX move to the 15,058 support level before entering oversold territory.

4-Hourly Chart affirms bearish price signals.
DAX 171023 4-Hourly Chart
EUR/USD Forecast: Middle East Updates and US Retail Sales Focal Points

EUR/USD Forecast: Middle East Updates and US Retail Sales Focal Points

Monday Overview

On Monday, the EUR/USD gained 0.51%. Reversing the 0.20% loss from Friday, the EUR/USD ended the day at $1.05602. The EUR/USD fell to a low of $1.05084 before rising to a high of $1.05627.

German and Eurozone ZEW Economic Sentiment and the ECB in Focus

The German economy is in the spotlight again on Tuesday. ZEW Economic Sentiment figures for October will garner investor interest. With the markets expecting a German recession, a slump in sentiment toward the economy would pressure the EUR/USD.

Trading Derivatives carries a high level of risk to your capital and you should only trade with money you can afford to lose. Trading Derivatives may not be suitable for all investors, so please ensure that you fully understand the risks involved, and seek independent advice if necessary. A Product Disclosure Statement (PDS) can be obtained either from this website or on request from our offices and should be considered before entering into a transaction with us. Raw Spread accounts offer spreads from 0.0 pips with a commission charge of USD $3.50 per 100k traded. Standard account offer spreads from 1 pips with no additional commission charges. Spreads on CFD indices start at 0.4 points. The information on this site is not directed at residents in any country or jurisdiction where such distribution or use would be contrary to local law or regulation.

Economists forecast the German ZEW Economic Sentiment Index to fall from -79.4 to -80.8.

Beyond the economic indicators, ECB commentary also needs consideration. ECB Executive Board members Kerstin af Jochnick and Luis de Guindos are on the calendar to speak. Hawkish comments would support the buying appetite for the EUR/USD.

However, investors must monitor news updates from the Middle East throughout the day. An escalation in the Middle East conflict would fuel demand for the safety of the US dollar.

Fed Speeches and US Retail Sales in the Spotlight

Later today, US retail sales will garner investor attention. Hotter-than-expected retail sales figures will likely fuel bets on a Fed interest rate hike. Economists forecast retail sales to increase by 0.3%. In August, retail sales rose by 0.6%.

An uptrend in consumer spending would fuel demand-driven inflation and pressure the Fed to lift interest rates. Higher interest rates would impact borrowing costs and disposable income. A pullback in spending on non-essential items would soften demand-driven inflationary pressures.

With consumption in the spotlight, FOMC member speeches also warrant consideration. FOMC Members John Williams, Thomas Barkin, and Michelle Bowman are on the calendar to speak. Hawkish forward guidance would pressure the buying appetite for the EUR/USD.

Short-Term Forecast:

The EUR/USD trends hinge on the Middle East conflict and Fed interest rate hike bets. A pickup in US consumer spending and an escalation in the Middle East conflict could reignite talk about EUR/USD parity.

EUR/USD Price Action

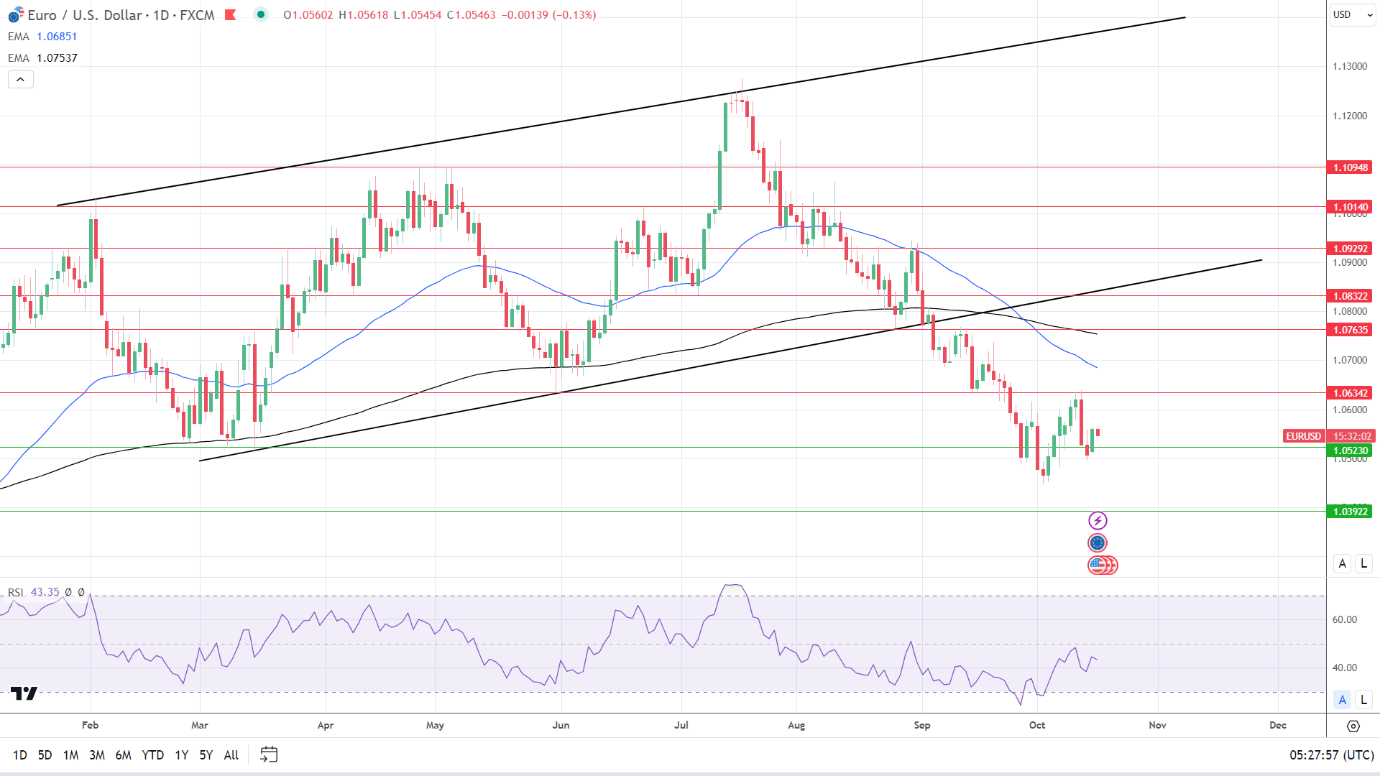
Daily Chart

The EUR/USD remained below the 50-day and 200-day EMAs, sending bearish price signals.

A EUR/USD break below the $1.05230 support level would bring $1.04500 and the $1.03922 support level into view. US retail sales, hawkish Fed comments, and an escalation in the Middle East would impact the appetite for the EUR/USD.

On the other hand, easing geopolitical tensions and dovish Fed commentary would support a move toward the $1.06342 resistance level.

The 14-period Daily RSI, 43.35, supports a EUR/USD break below the $1.05230 support level before entering oversold territory.

EUR/USD Daily Chart sends bearish price signals.
EURUSD 171023 Daily Chart

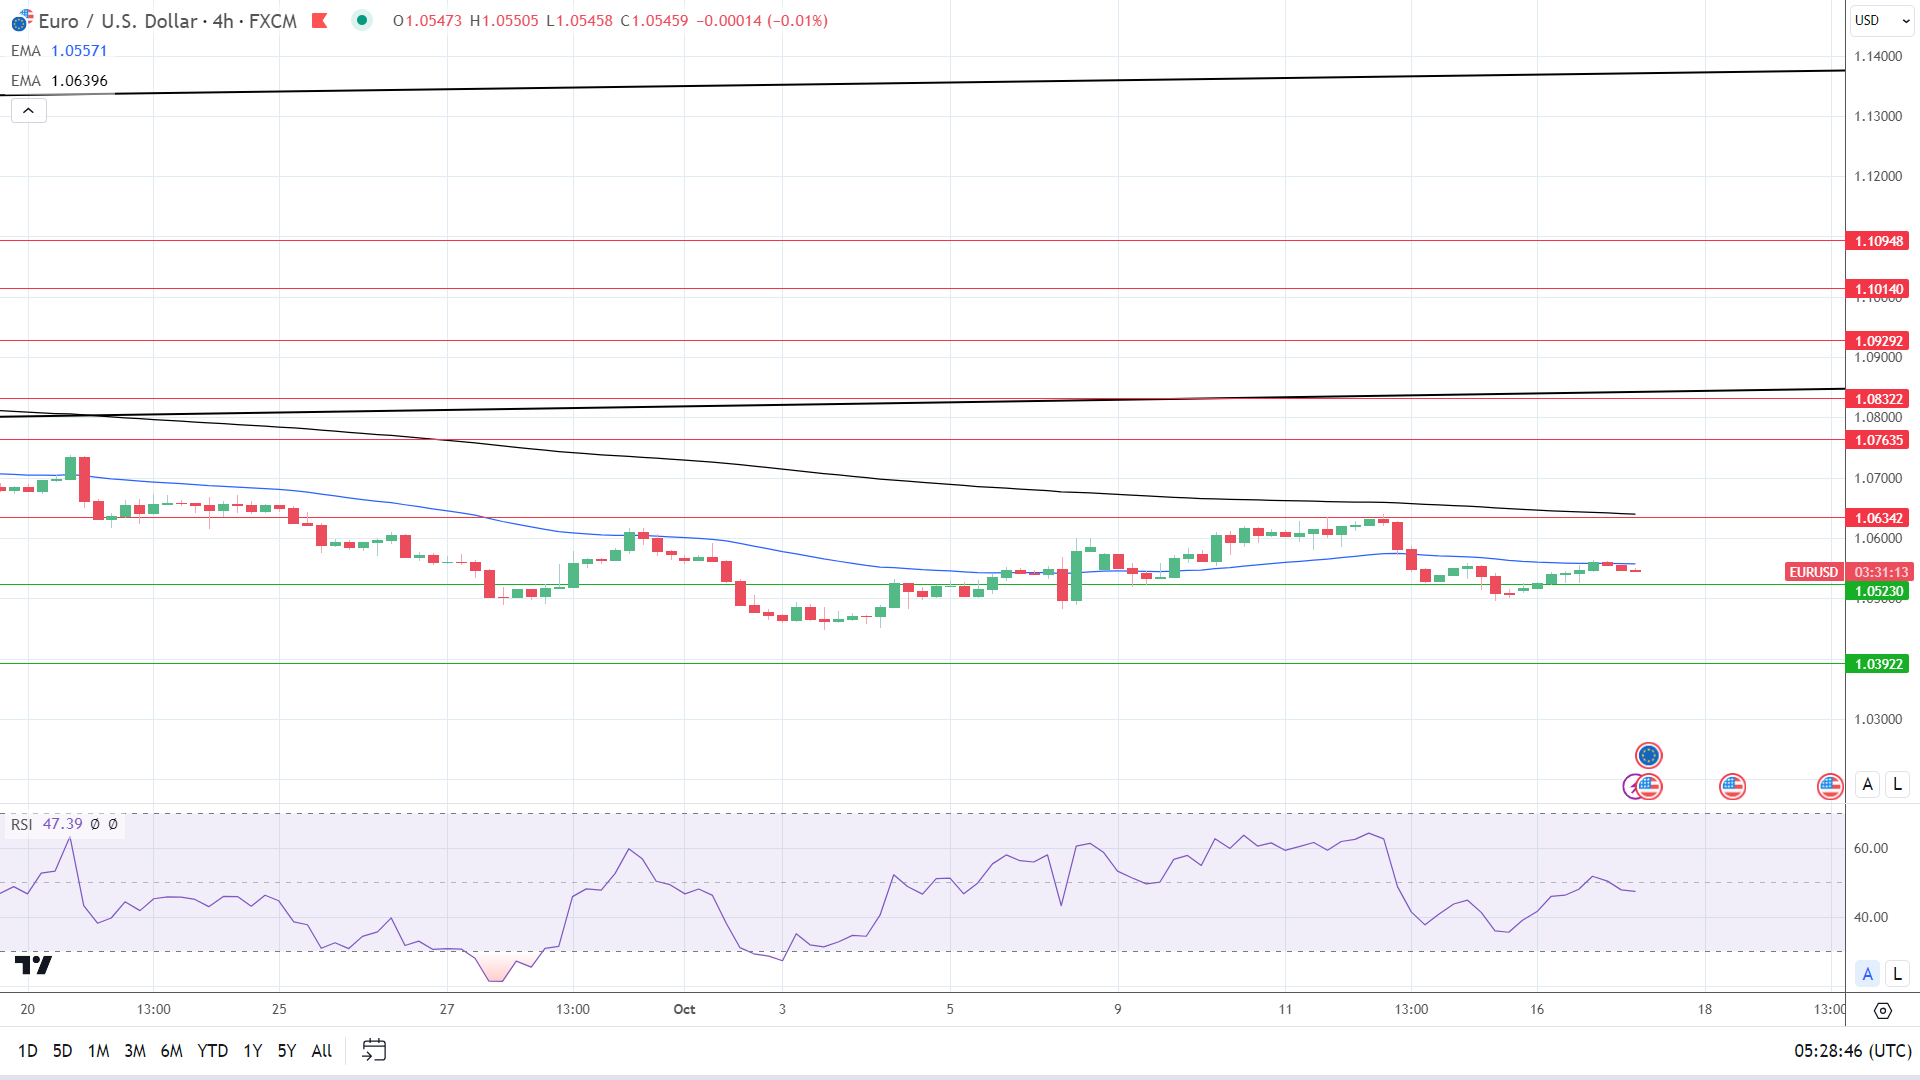
4-Hour Chart

The EUR/USD sits below the 50-day and the 200-day EMAs, reaffirming bearish price signals. A EUR/USD break below the $1.05230 support level would give the bulls a run at $1.04500.

However, a breakout from the 50-day EMA would support a move toward the $1.06342 resistance level and 200-day EMA. Selling pressure will likely intensify at $1.06340. The 200-day EMA is confluent with the $1.06342 resistance level.

The 14-period RSI on the 4-hour chart, 47.39, supports a EUR/USD break below $1.05230 support level before entering oversold territory.

4-Hourly Chart affirms bearish price signals.
EURUSD 171023 4 Hourly Chart
Silver Prices Forecast: XAG/USD Sways Between Fed Policy and Middle East Unrest

Silver Prices Forecast: XAG/USD Sways Between Fed Policy and Middle East Unrest

Silver Prices Under the Dual Influence of Fed Policy and Middle East Tensions

Silver prices (XAG/USD) are caught in a whirlwind of shifting financial and geopolitical currents, most notably the looming decisions by the U.S. Federal Reserve and escalating conflict in the Middle East.

Federal Reserve and Economic News

The financial markets are on high alert as they anticipate Federal Reserve Chair Jerome Powell’s speech this week, a decisive factor that could influence interest rate policies. The greenback and Treasury yields have strengthened, putting downward pressure on silver. The rising yields and strong U.S. economic data, notably in retail and industrial sectors, present a headwind for silver prices. Market participants see only a 10% likelihood of a Fed rate hike in November, suggesting that any upside surprise in U.S. economic data could further suppress silver’s value.

Trading Derivatives carries a high level of risk to your capital and you should only trade with money you can afford to lose. Trading Derivatives may not be suitable for all investors, so please ensure that you fully understand the risks involved, and seek independent advice if necessary. A Product Disclosure Statement (PDS) can be obtained either from this website or on request from our offices and should be considered before entering into a transaction with us. Raw Spread accounts offer spreads from 0.0 pips with a commission charge of USD $3.50 per 100k traded. Standard account offer spreads from 1 pips with no additional commission charges. Spreads on CFD indices start at 0.4 points. The information on this site is not directed at residents in any country or jurisdiction where such distribution or use would be contrary to local law or regulation.

Middle-Eastern Dynamics

On the geopolitical front, the conflict between Israel and Hamas intensifies. President Joe Biden is set to visit Israel, underscoring the gravity of the situation. This conflict has led to spikes in silver prices, viewed as a safe haven during uncertain times. As Israel preps for a potential ground invasion into Gaza, market watchers predict that such a move could catalyze another surge in silver prices.

Yield and Inflation Factors

Yields on the 10-year and 2-year Treasury notes are rising, impacting the opportunity cost of holding silver, a non-yielding asset. Fed officials, like Philadelphia Federal Reserve President Patrick Harker, have indicated that interest rates could remain steady, given the already heightened Treasury yields, which aim to curb inflation and stimulate the economy.

Short-Term Forecast

In the short term, the market sentiment for silver is highly uncertain, tinged with both bullish and bearish indicators. On one hand, Fed policy and robust U.S. economic data could suppress prices. On the other, escalating Middle East tensions could provide upward momentum. Traders must navigate these conflicting currents carefully.

Given the competing influences of Federal Reserve policies and mounting geopolitical tensions in the Middle East, the market sentiment leans more towards uncertainty rather than a clear bullish or bearish outlook.

Technical Analysis

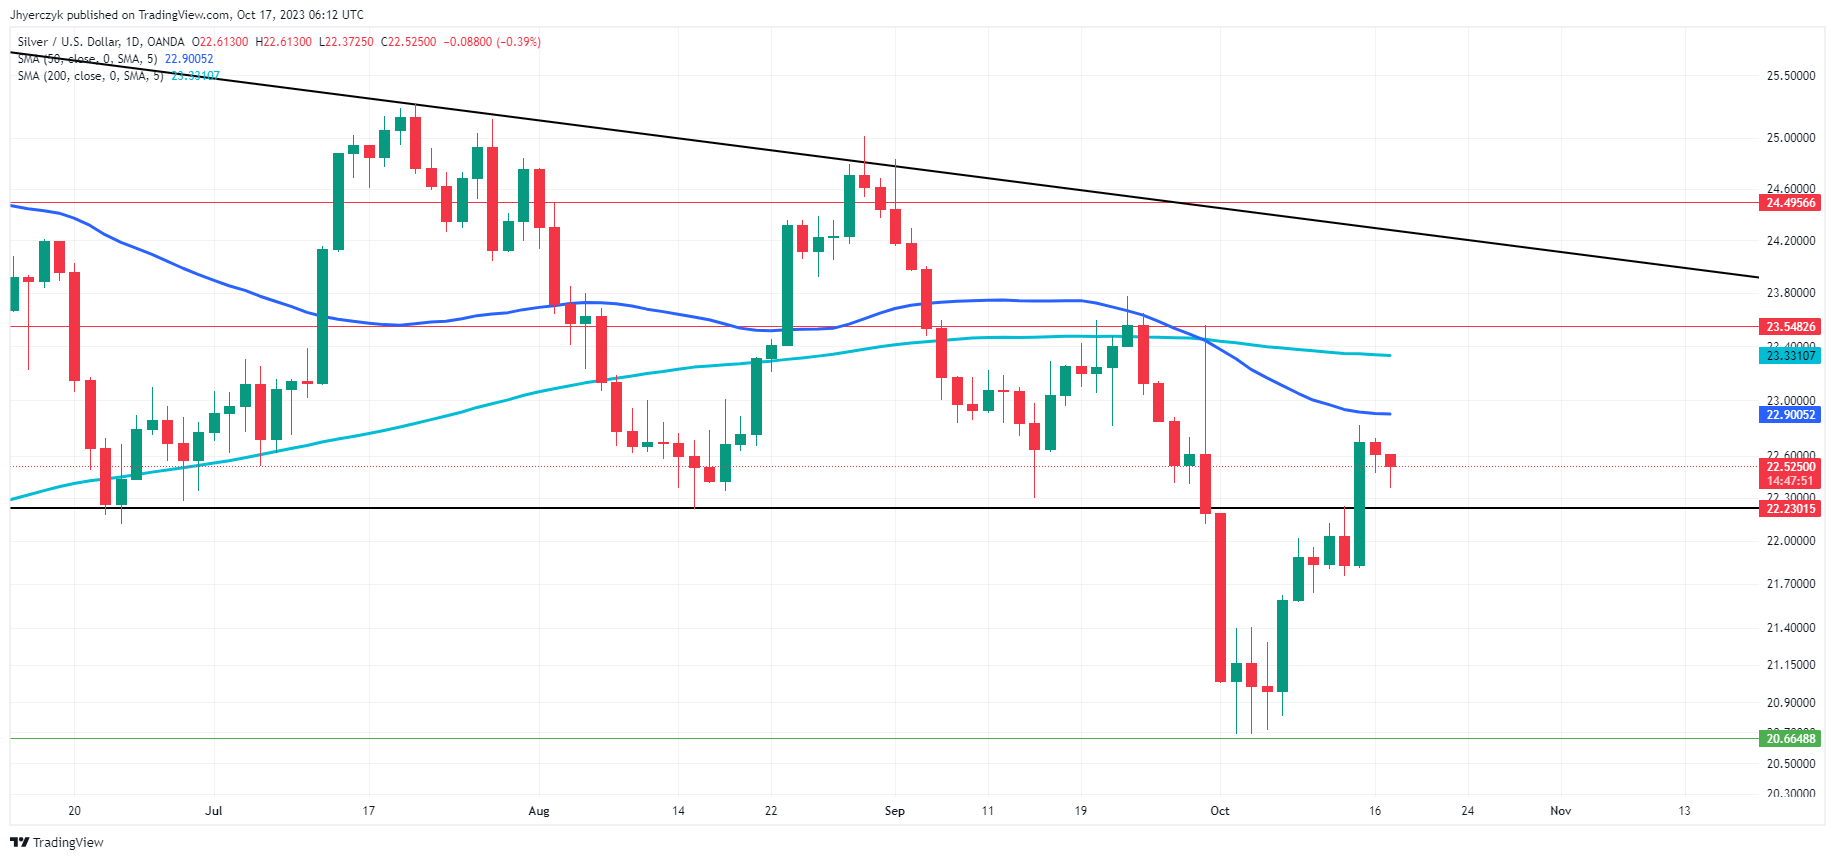
Daily Silver (XAG/USD)The current Daily price of gold (XAG/USD) at 22.51 is below both the 200-day moving average of 23.33 and the 50-day moving average of 22.90, signaling a bearish sentiment. The asset is trading just above its trend line support at 22.23, dangerously close to a level that, if broken, could trigger a downside acceleration.

With minor and main support levels at 20.66 and 19.90, respectively, there’s cushion for potential declines. On the upside, overcoming trend line resistance at 24.28 and minor resistance at 23.55 could change the narrative, but the main resistance at 24.49 stands as a significant barrier.

Overall, the market sentiment leans bearish.

Gold Prices Forecast: XAU/USD in a Tug-of-War Between Fed Policy and Geopolitics

Gold Prices Forecast: XAU/USD in a Tug-of-War Between Fed Policy and Geopolitics

Gold Market Maneuvers Amid Multiple Variables

Gold prices (XAU/USD) are facing a tumultuous landscape, pulled in opposite directions by U.S. economic indicators and geopolitical undercurrents. The market has its eyes peeled for President Biden’s trip to Israel this week, which is part of an effort to mitigate Middle Eastern tensions. However, gold still struggles to sustain bullish momentum, falling for the second consecutive session.

Impact of Treasury Yields and the U.S. Dollar

The rise in U.S. Treasury yields to a week-high and a firming dollar are posing challenges for gold, a non-yielding asset. Yields are edging higher ahead of a string of U.S. economic data, including retail sales and industrial production. Inflation data from last week did little to support gold, despite coming in slightly above market expectations. The market is eagerly awaiting Federal Reserve Chair Jerome Powell’s speech later this week, seeking clarity on the Fed’s future rate policy.

Trading Derivatives carries a high level of risk to your capital and you should only trade with money you can afford to lose. Trading Derivatives may not be suitable for all investors, so please ensure that you fully understand the risks involved, and seek independent advice if necessary. A Product Disclosure Statement (PDS) can be obtained either from this website or on request from our offices and should be considered before entering into a transaction with us. Raw Spread accounts offer spreads from 0.0 pips with a commission charge of USD $3.50 per 100k traded. Standard account offer spreads from 1 pips with no additional commission charges. Spreads on CFD indices start at 0.4 points. The information on this site is not directed at residents in any country or jurisdiction where such distribution or use would be contrary to local law or regulation.

Geopolitical Factors Add Complexity

The ongoing conflict between Israel and Hamas had initially propelled gold prices to over three-week highs. However, the golden luster seems to be fading as investors digest Secretary of State Antony Blinken’s recent statements and await President Biden’s diplomatic intervention. Market participants are also monitoring a possible ground invasion by Israel, an event that could substantially boost gold prices in the short term.

Shifting Market Sentiment and Speculation

Fed officials, including Philadelphia Federal Reserve President Patrick Harker, suggest that the current level of interest rates could be sufficient to ease inflation and impact the economy positively. Market speculation about Powell’s Thursday speech is rampant, with traders looking for cues that could sway the dollar and, in turn, gold prices. Meanwhile, COMEX speculators have increased their net short positions, adding to the metal’s downward pressure.

Near-Term Outlook: Bearish Undertones Persist

In the short term, the gold market appears to be bearish, primarily due to the conflicting forces of geopolitical tensions and economic indicators. Unless there is a significant escalation in the Middle East or a drastic change in the Federal Reserve’s tone, gold prices are likely to remain under pressure. Keep an eye on U.S. Treasury yields and Powell’s upcoming speech for more definitive directional cues.

Technical Analysis

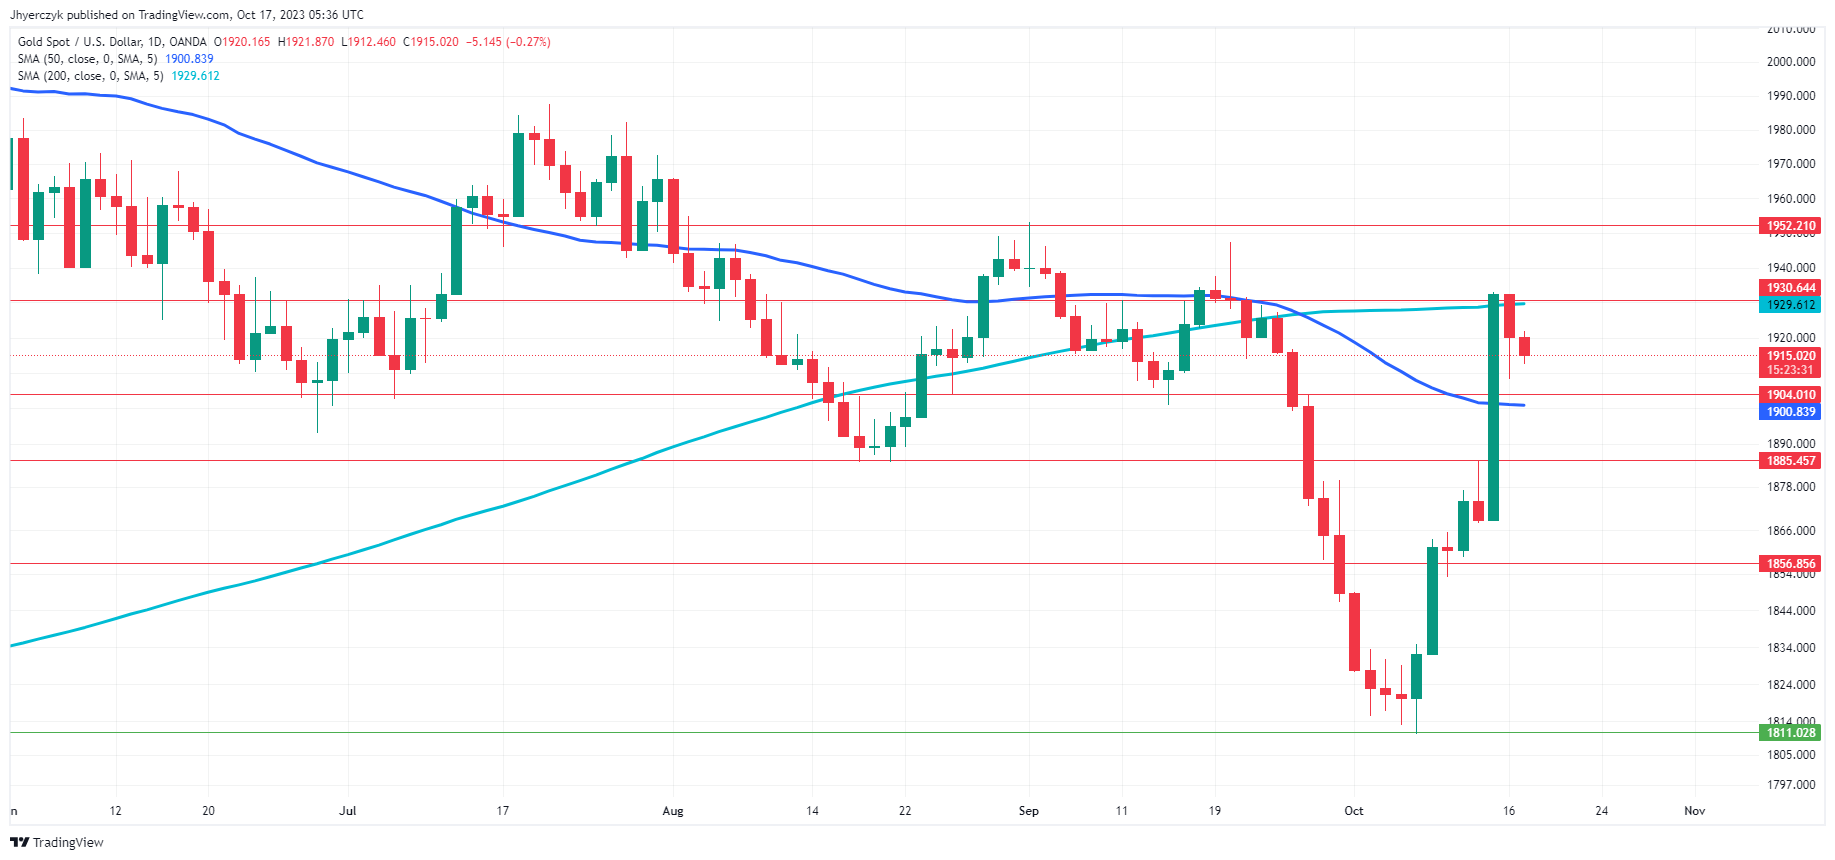
Daily Gold (XAU/USD)The current daily price of gold (XAU/USD) is $1915.20, which is below the 200-day moving average of $1929.61, suggesting the market faces resistance at this level. Additionally, the asset is above the 50-day moving average of $1900.84, indicating some bullish momentum.

Though the asset has pulled back slightly from its previous close of $1920.17, it’s still within striking distance of minor resistance at $1930.64 and comfortably above main support at $1752.85.

Given its position relative to these key technical indicators and levels, the market sentiment appears to be cautiously bullish but with resistance overhead. Nonetheless, due to the recent powerful short-covering rally, the market is vulnerable to a near-term correction.

Oil Prices Forecast: Eased Venezuelan Sanctions and OPEC Cuts Fuel WTI Volatility

Oil Prices Forecast: Eased Venezuelan Sanctions and OPEC Cuts Fuel WTI Volatility

The oil market is navigating a maze of geopolitical moves and policy changes, with key players like Venezuela, the Middle East, and Saudi Arabia stirring the pot. Prices are swinging as traders weigh factors like the U.S. easing off on Venezuelan sanctions, escalating conflicts in the Middle East, and falling Saudi exports.

Venezuela: A Glimmer of Supply Increase

U.S.-Venezuela relations are warming up as both countries reach an understanding that could ease sanctions on the oil-rich nation. With the U.S. curbing Venezuela’s oil exports since 2019 to punish President Maduro’s regime for election irregularities and human rights violations, any slackening of these sanctions could be a windfall for oil supply. Yet, there’s a caveat—Venezuela’s oil sector has been marred by lack of investment, implying a gradual, rather than immediate, impact on oil production.

Trading Derivatives carries a high level of risk to your capital and you should only trade with money you can afford to lose. Trading Derivatives may not be suitable for all investors, so please ensure that you fully understand the risks involved, and seek independent advice if necessary. A Product Disclosure Statement (PDS) can be obtained either from this website or on request from our offices and should be considered before entering into a transaction with us. Raw Spread accounts offer spreads from 0.0 pips with a commission charge of USD $3.50 per 100k traded. Standard account offer spreads from 1 pips with no additional commission charges. Spreads on CFD indices start at 0.4 points. The information on this site is not directed at residents in any country or jurisdiction where such distribution or use would be contrary to local law or regulation.

The Middle East: A Volatile Power Keg

Oil prices remain susceptible to fluctuations driven by the instability in the Middle East. The ongoing conflict between Israel and Hamas pushed Brent up by 7.5% last week. Iran’s looming threat of a broader conflict and President Biden’s upcoming high-stakes visit to Israel add more complexity to the region. The consequences of these geopolitical risks are far-reaching and could potentially lead to spikes in oil prices.

Saudi Arabia: Cutting Supply, Solidifying Prices

Saudi Arabia’s crude oil exports have dwindled to their lowest in over two years, marking a 7.1% decrease to 5.58 million barrels per day. Coordinated voluntary supply cuts with Russia further reduce global oil availability. Coupled with the U.S. sanctions on Russian oil tankers violating the $60/barrel limit, it’s evident that the OPEC+ alliance is aiming to maintain a firm price floor for oil.

Russian Involvement

Russian President Vladimir Putin has indicated that OPEC+ supply cuts are likely to continue until 2024 and beyond. Russia’s dialogue with Iran, Israel, and other Middle-East nations highlights its increasing geopolitical influence, which could have ramifications for oil supply and demand dynamics.

Short-term Forecast: A Balancing Act

The tug-of-war between supply and demand continues. While easing sanctions on Venezuela hint at a bearish trend, escalating conflicts in the Middle East and Saudi Arabia’s export cuts paint a bullish picture. Overall, the oil market is poised for a period of heightened volatility, making it crucial for traders to keep a vigilant eye on these geopolitical hotspots.

Technical Analysis

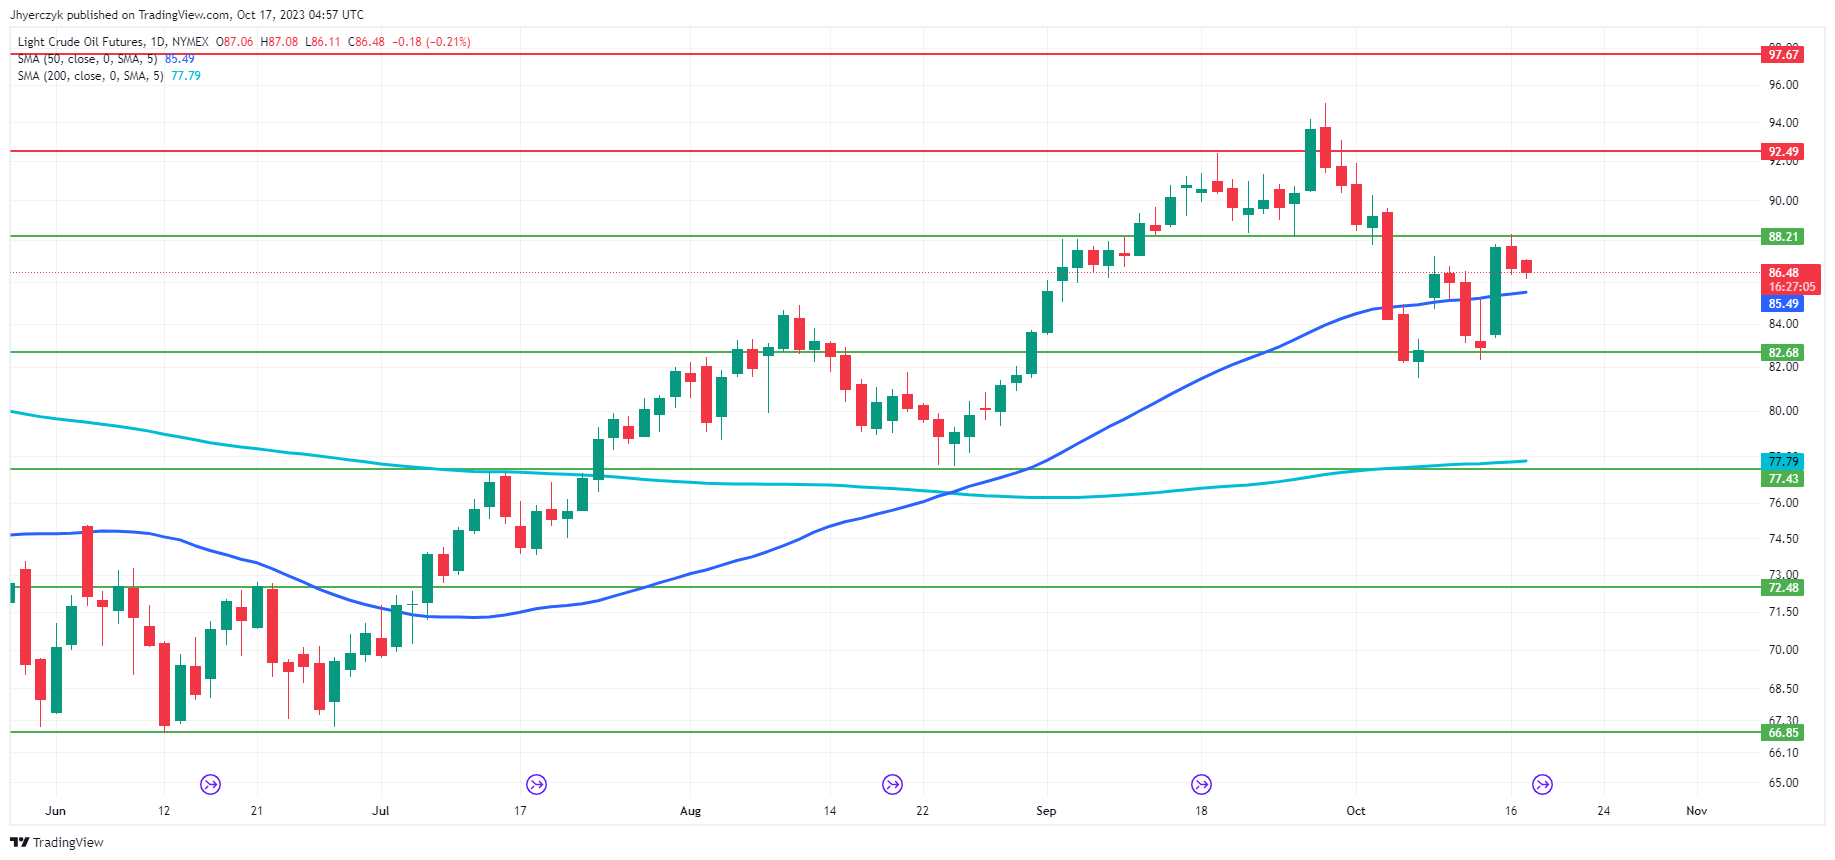
Daily Light Crude Oil FuturesThe current daily price of light crude oil futures at 86.48 is situated above the 200-day moving average of 77.79, which is typically an indicator of a bullish underlying trend in the long term. However, it falls just above the 50-day moving average of 85.49, suggesting that the asset is in a short-term bullish phase as well.

The price hovers above the main support level of 82.68 and below the minor resistance of 88.21. Given this configuration, the market sentiment seems to be cautiously bullish, both in the short and long term.

Despite the bullish outlook, conditions could shift quickly to weaker if the selling pressure is strong enough to take out the 50-day moving average. Trader reaction to this level at $85.49 is likely to set the tone on Tuesday.

Crude Oil Trading Strategies and Tips

Crude Oil Trading Strategies and Tips

WHY TRADE CRUDE OIL AND HOW DOES CRUDE OIL TRADING WORK?

Crude oil is the world economy’s primary energy source, making it a very popular commodity to trade. A naturally occurring fossil fuel, it can be refined into various products like gasoline (petrol), diesel, lubricants, wax and other petrochemicals. It is highly demanded, traded in volume, and extremely liquid. Oil trading therefore involves tight spreads, frequent chart patterns, and high volatility.

Brent crude is the world’s benchmark for oil with almost two thirds of oil contracts traded being Brent oil. WTI is America’s benchmark oil, it is a slightly sweeter and lighter oil compared to Brent.

CRUDE OIL TRADING BASICS: UNDERSTANDING WHAT AFFECTS PRICE MOVEMENTS

When trading oil, the two major focal points are, as with many commodities, supply and demand. Whether there was an economic report like a news event or press release or tensions in the Middle East, the two factors that will be taken into consideration is how supply and demand is affected, because this will affect the price.

Supply Factors

  • Outages or maintenance in key refineries around the globe, whether it’s the Forties pipeline in the North Sea or the Port Arthur refinery in Texas, must be monitored because of the effect it can have on the supply of oil. War in the Middle East leads to concerns about supply. For example, when the Libyan Civil war began in 2011, prices had seen a 25% rise from in the space of a couple of months.
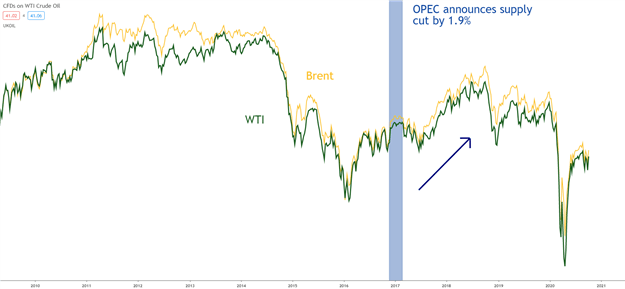
  • OPEC (Organization of the Petroleum Exporting Countries) production cuts or extensions lead to changes in the price of oil. For example, back in 2016 when the cartel had announced their decision to curb global supply by 1.9% (see chart below), the price of oil has risen from $44/bbl to as much as $80/bbl.

WTI and Brent Crude price reaction to OPEC supply cut:
  • Oil Suppliers: Similarly, with understanding the importance of OPEC, it is also worth knowing who the top global oil suppliers are, and this information can be fond from the EIA website.

Demand Factors

  • Seasonality: Hot summers can lead to increased activity and higher oil consumption. Cold winters cause people to consume more oil products to heat their houses.
  • Oil Consumers: The largest consumers of oil have typically been developed nations such as the U.S. and European countries. However, in recent times there has been a surge in oil consumption in Asian countries, namely China and Japan. As such, it is important for traders to pay attention to the level of demand from these nations, alongside their economic performance. Any slowdown could affect oil prices and demand may fall.
  • Correlation to Global Growth: The chart below shows the largely positive correlation between the price of crude oil and global growth. The Chinese and US economies being the two largest in the world are a great barometer for global growth. The chart includes their respective major stock indices which move in line with crude oil prices – when the equity indices fall, the price of crude oil tends to fall and vice versa.

WTI and Brent Crude positive correlation with FTSE China A50 and S&P 500 chart representation:
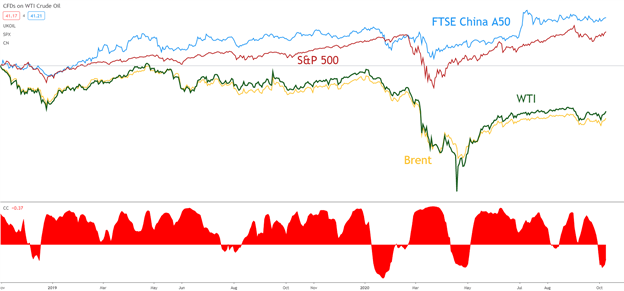
Chart prepared by Warren Venketas, TradingView

  • Alternative Energy: While fossil fuels such as oil and gas continue to dominate cleaner energy sources, there is an incessant push towards sustainability on a global scale. This will definitely impact crude oil prices going forward which makes this a key factor to monitor in a crude oil trading strategy.

The impact of derivatives on the traditional valuations of crude oil have been thought by many to have destabilized the asset class. Simply put, the oil futures are thought to have reflected higher proportions of noise which do not reflect the fundamental data at the time. This is contentious within the investing community with some in disagreement with the above rationale, but it cannot be ignored that large speculative traders are becoming more influential with the flourishing derivative market.

Want to know more about oil? Here are 8 Surprising Crude Oil Facts Every Trader Should Know !

HOW TO TRADE OIL: TOP TIPS AND STRATEGIES

Expert oil traders generally follow a strategy. They will understand the fundamental factors that affect the price of oil and use a trading strategy that suits their trading style. Each trading strategy is different, risk management is an important component to consistent trading, like the effective use of leverage and avoiding top trading mistakes.

A comprehensive crude oil trading strategy could include:

  1. Fundamental Analysis
  2. Technical Analysis
  3. Risk Management

Once a trader understands the fundamental supply and demand factors that affect the price of oil, he/she can look for entries into the market using technical analysis. Then, when a buy or sell signal has been identified using technical analysis, the trader can implement the proper risk management techniques. Let’s go through an example using the steps outlined above:

  1. Fundamental Analysis

On the 30th of November 2017, OPEC and Russia agreed to extend an oil production cut, which lead to a decrease in supply. The basic theory of supply and demand suggests that a decrease in supply should be succeeded by an increase in demand and consequently price. This is the fundamental analysis a trader would need to incorporate into their strategy in order to identify potential buy signals in the market.

WTI daily chart highlighting supply cut:
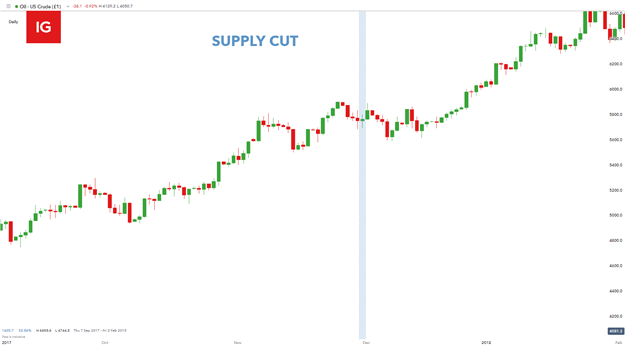
Chart prepared by Warren Venketas, IG

2. Technical Analysis

The next step would be to analyze the chart using technical analysis. There are a variety of technical indicators and price patterns a trader can use to look for signals to enter the market. There is no need to use many technical indicators, one that you understand well will do the job. A common yet very effective way to begin analyzing any chart is to identify the overall trend of the market. In this example, the implementation of simple price action is used to identify higher highs and higher lows which is suggestive of a preceding upward trend. This falls in line with our fundamental expectation of further upward price movement.

WTI daily chart showing preceding upward trend:
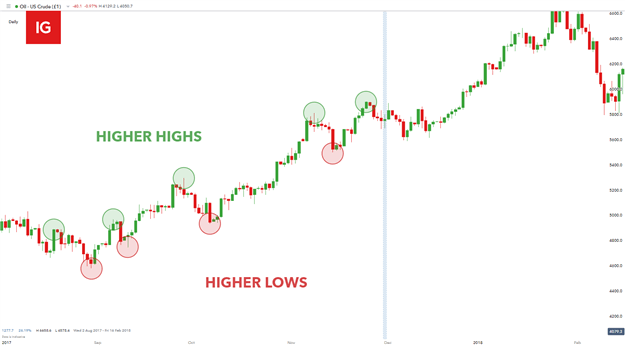
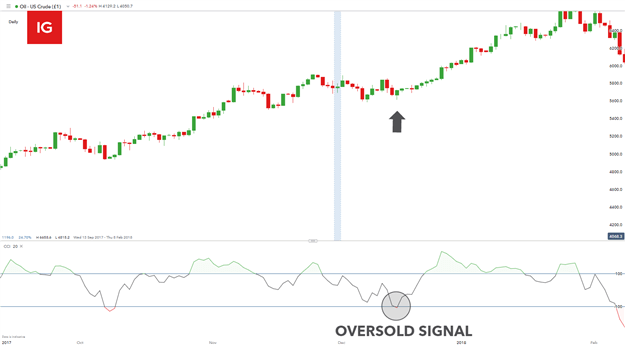
Once the bullish trend has been confirmed, the next step in the trading strategy would be to recognize possible entry points. Again, there are multiple tools and techniques to locate entry points but this example uses the Commodity Channel Index (CCI) indicator which moves into oversold territory shortly after the fundamental supply cut announcement was made. An oversold signal on the CCI advocates further price appreciation and the possibility of a long (buy) entry.

WTI daily chart with CCI indicator:
3. Risk Management

The final step in any trading strategy would be to employ sound risk management to every trade. At DailyFX we support the 1:2 risk-reward ratio guideline which basically means that the target level should be roughly two times more than the position stop-loss level. To manage risk, the trader could look to set a take-profit above the recent high and set a stop-loss at the recent low.

In this example, a recent swing low ($49.30) has been identified as stop level which is approximately $8 away from the entry price ($57.20). There is no recent high which in this case which would allow for a target projection using basic math. With the stop distance being roughly $8 away from entry, a 1:2 projection could seee initial resistance at the $73 level.

WTI daily chart with 1:2 risk-reward ratio:
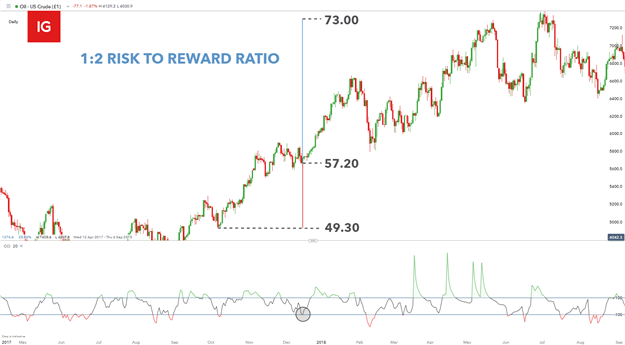
This sample trade would illustrate a positive risk to reward ratio. We researched millions of live trades in a variety of markets and discovered a positive risk to reward ratio was a key element to consistent trading. Additionally, at DailyFX, we recommend risking less than 5% of capital on all open trades.

ADVANCED TIPS FOR OIL TRADING

Advanced traders can incorporate additional information when setting up trades. Traders sometimes look at the futures curve to forecast future demand, CFTC speculative positioning to understand the current market dynamic and can use options to take advantage of forecasted high volatility moves or to hedge current positions.

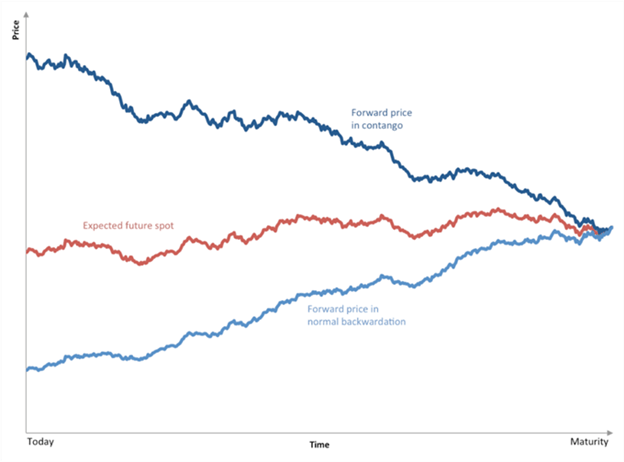
Futures Curve: The shape of the futures curve is important for commodity hedges and speculators. As such, when investors analyze the curve, they look for two things, whether the market is in contango or backwardation:

  1. Contango: This is a situation in which the futures price of a commodity is above the expected spot price, as investors are willing to pay more for a commodity at some point in the future than the actual expected price. This typically signals a bearish structure.
  2. Backwardation: This is a situation when the spot price is above the forward price for a commodity. This typically signals a bullish structure.
CFTC/Speculative Positioning:

The Commodity Future Trading Commission Report (CFTC) is important when trading crude oil futures. It provides traders with information related to market dynamics and therefore s can be a good way to gain a sense of where oil prices are heading. Movements in the CFTC managed money net positions typically precede the move in oil prices.

Trading via futures and options

Buying futures and options, a trader must use the appropriate exchange for the oil benchmark he/she wants to trade. Most exchanges have criteria for who is allowed trade on them, so the majority of futures speculation is undertaken by professionals.

Oil Investing

Instead of trading the individual market, a trader can get exposure to oil through shares of oil companies or through energy-based exchange traded funds (ETFs). The price of oil companies and ETFs are heavily influenced by the price of oil.

Major Oil/Energy ETFs:

  • Energy Select Sector SPDR (XLE)
  • Vanguard Energy ETF (VDE)
  • United States Energy Fund (USO)

KEY REPORTS EVERY OIL TRADER SHOULD FOLLOW

Weekly updates on the amount of crude oil inventories in the U.S. are very important pieces of data for oil traders – the release of which frequently leads to a bout of volatility. The inventory data is an important barometer for oil demand. For example, if weekly inventories are increasing, this would suggest that demand for oil is dropping, while a drop in inventories suggests that oil demand is outstripping supply.

  1. American Petroleum Institute (API): The API produces a weekly statistical report, which highlights the most important petroleum products that account for more than 80% of total refinery production, while crude oil inventories are also included. This data is typically released on Tuesday at 16:30ET/21:30 London time.
  2. Department of Energy (DoE/EIA): Much like the API report, the DoE report provides information on the supply of oil and the level of inventories of crude oil and refined products. This is announced on Wednesday at 10:30ET/15:30 London time.

USING SOCIAL MEDIA TO TRADE CRUDE OIL

Over the years, social media has become an increasingly useful platform to share ideas, pass on information and receive breaking news. This is the case for oil traders using #OOTT, which stands for the “Organization of Oil Traders” on Twitter. Here traders and industry leaders provide breaking news and key reports related to the oil market.

US Dollar Index News: DXY Near 1-Week High Amid Middle East Unrest, Rate Hike Odds

US Dollar Index News: DXY Near 1-Week High Amid Middle East Unrest, Rate Hike Odds

US Dollar Index Wavers Amid Middle East Tensions and Rate Outlook

The US Dollar Index (DXY) was caught in a delicate balance this Monday as geopolitical unrest in the Middle East heightened and investors awaited a pivotal speech from Federal Reserve Chair Jerome Powell. The dollar remained near a one-week high against a basket of currencies, reflecting a cautiously risk-averse market sentiment.

Geopolitical Pressures

The ongoing conflict between Israel and Hamas has been contributing to market volatility, directing flows toward traditional safe-haven assets like the dollar. Israeli forces continued their military activities in Gaza, further straining diplomatic efforts for a ceasefire. These geopolitical tensions provided a boost to the dollar index, which eased only slightly to 106.47.

Trading Derivatives carries a high level of risk to your capital and you should only trade with money you can afford to lose. Trading Derivatives may not be suitable for all investors, so please ensure that you fully understand the risks involved, and seek independent advice if necessary. A Product Disclosure Statement (PDS) can be obtained either from this website or on request from our offices and should be considered before entering into a transaction with us. Raw Spread accounts offer spreads from 0.0 pips with a commission charge of USD $3.50 per 100k traded. Standard account offer spreads from 1 pips with no additional commission charges. Spreads on CFD indices start at 0.4 points. The information on this site is not directed at residents in any country or jurisdiction where such distribution or use would be contrary to local law or regulation.

Currency Dynamics

The Euro and Yen also responded to the tumultuous backdrop. The Euro stayed close to a one-week low, last trading 0.27% higher at $1.0536. On the other hand, the yen could become a casualty in the event of a further escalation in the Middle East conflict. Analysts warn that carry trades funded by the yen might unravel, particularly as the currency is near potential intervention levels around 150.

Rate Outlook

Investors are keenly awaiting Powell’s speech for insights into the Fed’s interest rate trajectory. Markets largely anticipate the Fed to maintain the current rates through November, but there’s a 32% chance of a rate hike in December, according to the CME FedWatch tool. This comes after last week’s data showed consumer prices rising more than expected in September.

Short-Term Forecast: Neutral

With geopolitical tensions and monetary policy serving as strong influencers, the short-term outlook for the DXY leans neutral. Investors will be closely watching Powell’s speech and developments in the Middle East to gauge the dollar’s next move.

Technical Analysis

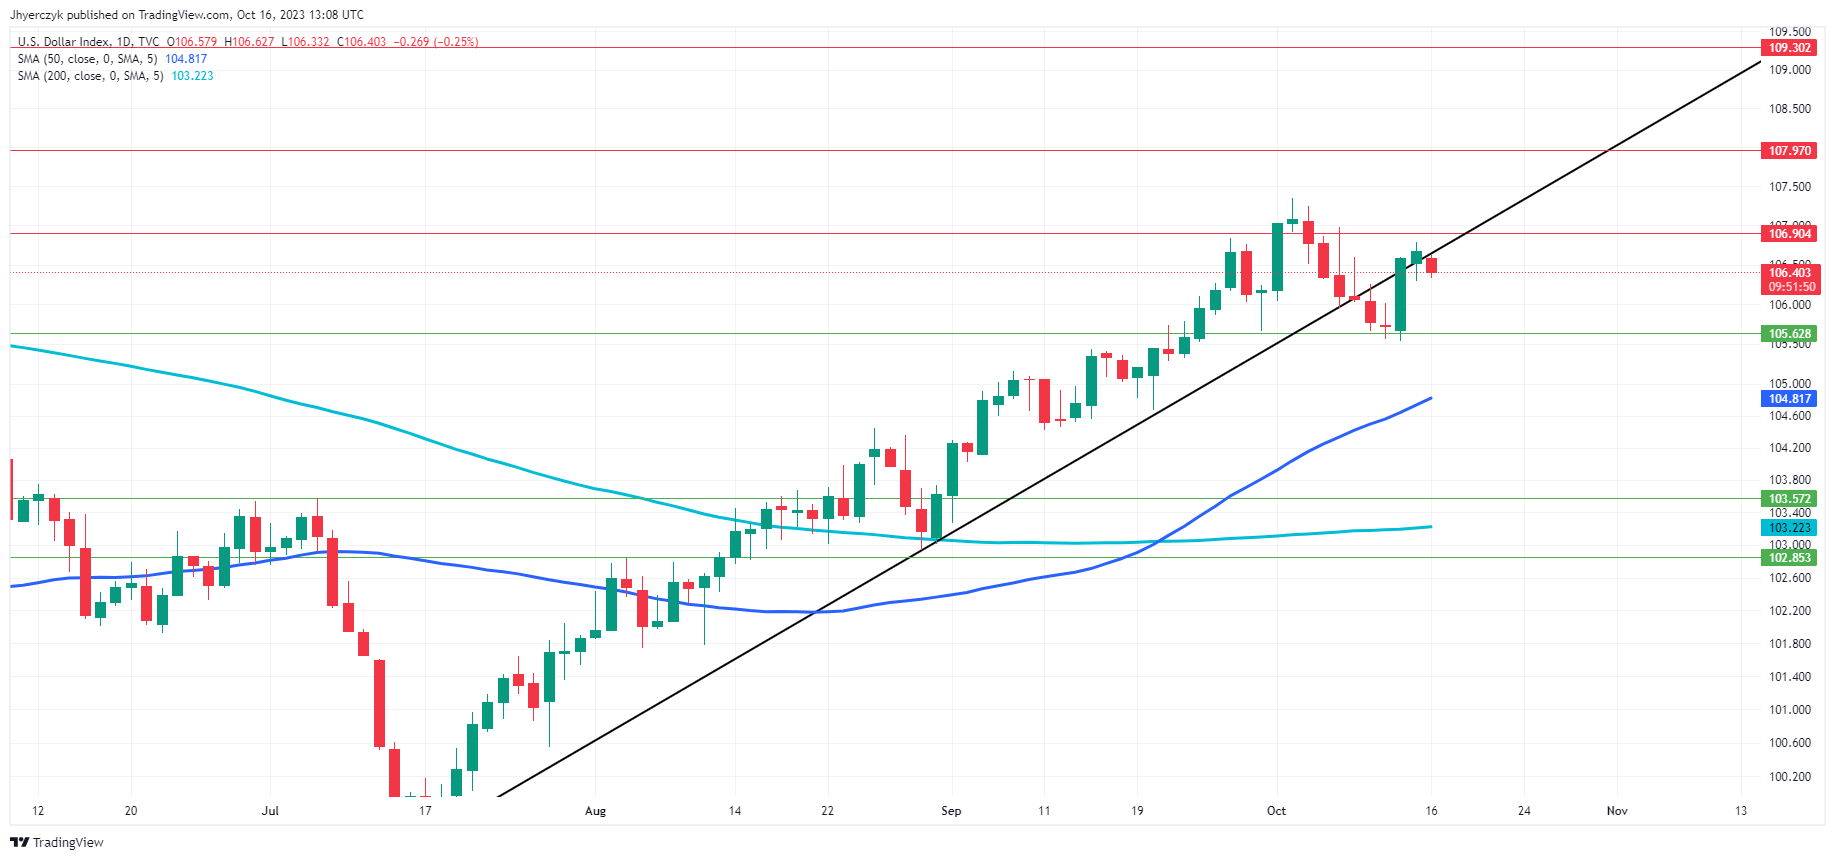
Daily US Dollar Index (DXY)The current Daily price of the US Dollar Index (DXY) at 106.385 is positioned above its 200-day moving average of 103.223 and its 50-day moving average of 104.817. This suggests that the asset is experiencing bullish momentum in both the short and long terms.

The asset also stands above its main support level at 103.572 but slightly below its minor resistance level of 106.904.

With trend line support set at 106.647, the market appears poised for a potential breakout to the upside. Overall, based on these indicators, the current market sentiment for DXY could be considered bullish.

If there is no follow-through to the upside then look for the selling to extend into the 50-day moving average at 104.817.

Natural Gas Prices Forecast: Bearish Weather and European Dip Pressure Futures

Natural Gas Prices Forecast: Bearish Weather and European Dip Pressure Futures

Natural Gas Futures Slip Amid Bearish Weather and European Price Dip

U.S. natural gas futures started the week on a back foot, shedding nearly 3% as traders weighed bearish weather forecasts and falling gas prices in Europe. The market’s trajectory appeared firmly influenced by weakening demand and an oversupplied scenario. November futures were last seen at $3.142, marking a decline of $0.094 or -2.90% as of 11:58 GMT.

The European Effect

European factors played a significant role in influencing U.S. prices. Both Dutch and British wholesale gas markets retreated from last week’s highs, pressured by abundant LNG supplies and favorable storage levels. Dutch November gas contracts fell to 52.45 euros per MWh, and Britain’s day-ahead contract decreased to 128.00 p/therm. This marks a sharp turnaround from the previous rally ignited by geopolitical unrest and colder weather.

Trading Derivatives carries a high level of risk to your capital and you should only trade with money you can afford to lose. Trading Derivatives may not be suitable for all investors, so please ensure that you fully understand the risks involved, and seek independent advice if necessary. A Product Disclosure Statement (PDS) can be obtained either from this website or on request from our offices and should be considered before entering into a transaction with us. Raw Spread accounts offer spreads from 0.0 pips with a commission charge of USD $3.50 per 100k traded. Standard account offer spreads from 1 pips with no additional commission charges. Spreads on CFD indices start at 0.4 points. The information on this site is not directed at residents in any country or jurisdiction where such distribution or use would be contrary to local law or regulation.

Weather and Demand Woes

Compounding the downward pressure, weather forecasts for the U.S. offer no bullish reprieve. Contrary to last week, lower heating demand forecasts and warmer temperature projections for late October and early November signal weakening demand. The frost observed recently is expected to be short-lived, reverting to seasonal norms by week’s end.

Supply Side Factors

On the supply front, uncertainties loom as Chevron’s Australian LNG facilities face potential strikes. Further, Israel’s halt in gas exports to Egypt through a key pipeline and damage to the Balticconnector gas pipeline have stirred supply concerns. However, these are offset by European storage inventories at record levels and ongoing supply expected to meet demand until 2025-26.

Short-term Outlook: Bearish

Given the factors of falling European prices, bearish weather forecasts, and unresolved supply-side uncertainties, the near-term outlook for U.S. natural gas futures is decidedly bearish. Traders should eye Chevron’s labor negotiations and weather updates for any disruptive cues, but for now, the trend is downward.

Technical Analysis

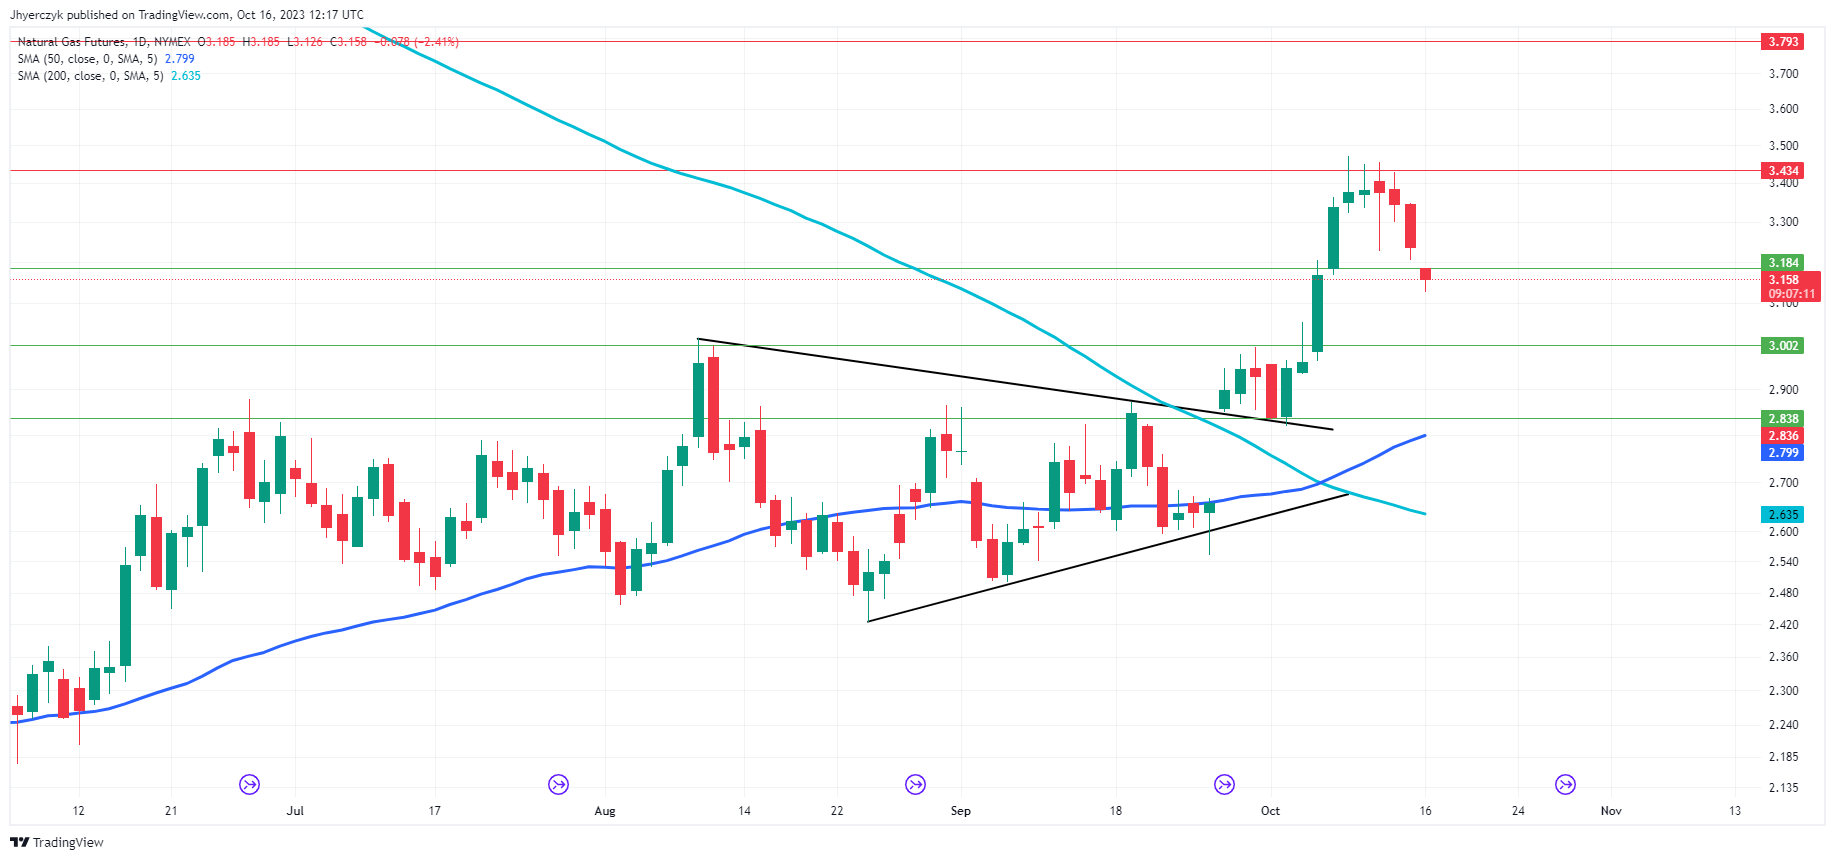
Daily Natural GasThe current daily price of natural gas at 3.162 sits above both its 200-day moving average of 2.635 and its 50-day moving average of 2.799, signaling overall bullish momentum.

However, the price is below the minor support level of 3.184 and has retreated from the previous daily price of 3.236, indicating short-term selling pressure. It remains above the main support level of 3.002, offering a cushion against a deeper decline.

Given these factors, the market sentiment for natural gas could be interpreted as cautiously bullish, but vulnerable to a steep short-term break given the position of the 50-day moving average.

Oil Prices Forecast: Eased Venezuelan Sanctions and OPEC Cuts Fuel WTI Volatility

Crude Oil Price Forecast – Crude Oil Markets Continue to Look for Higher Levels

WTI Crude Oil (US) Technical Analysis

The West Texas Intermediate Crude Oil market has initially pulled back just a bit during the trading session on Monday, as it looks like we have momentum coming back into the market. The $90 level underneath continues offer a significant amount of support, and I think it probably only takes a certain amount of time before looking to the $95 level. The $95 level was important in the past as it offered a certain amount of resistance previously.

Trading Derivatives carries a high level of risk to your capital and you should only trade with money you can afford to lose. Trading Derivatives may not be suitable for all investors, so please ensure that you fully understand the risks involved, and seek independent advice if necessary. A Product Disclosure Statement (PDS) can be obtained either from this website or on request from our offices and should be considered before entering into a transaction with us. Raw Spread accounts offer spreads from 0.0 pips with a commission charge of USD $3.50 per 100k traded. Standard account offer spreads from 1 pips with no additional commission charges. Spreads on CFD indices start at 0.4 points. The information on this site is not directed at residents in any country or jurisdiction where such distribution or use would be contrary to local law or regulation.

If we can break above that $95 level, then it’s likely that the market could go much higher. If we break above there, then the market is likely to see a move toward the $100 level. A pull back below the $90 level could open up a move down to the 50-Day EMA, but either way, I look at short-term pullbacks as simply a buying opportunity in a market that has much further to go due to geopolitical unrest, and of course the supply chain issue.

Brent Crude Oil (UK) Technical Analysis

Brent initially pulled back during the trading session on Monday as well, as it looks like the $90 level has come into the picture to show signs of support. The $95 level above will be your target, and if we can break above there, then we could go to the $100 level yet again. On the other hand, if we turn around and break down below the $90 level, then it’s possible that we could see this market pullback toward the 50-Day EMA.

Ultimately, I do think that the crude oil markets have more buyers than sellers over the longer term, as we will have to worry about the supply and of course a lot of geopolitical concerns that will cause quite a bit of noisy behavior. Regardless, I think that you have to look at pullbacks as buying opportunities, and shorting this market is probably going to continue to be almost impossible. Not only do we have the Middle East tensions, but the production cuts continue to cause issues as well, as both Russia and Saudi Arabia have agreed to the 1 million barrel production cut per day.

Gold Price Forecast – Gold Pulls Back to Moving Average

Gold Price Forecast – Gold Pulls Back to Moving Average

Gold Market Technical Analysis

Gold markets have pulled back a bit during the trading session on Monday, as the overbought condition from Friday abated. That being said, it looks like the 200-Day EMA is of course offering a little bit of support, so it will attract a certain amount of attention. Ultimately, if we break down below the 200-They EMA, it’s likely that the market will continue to correct, at least to the $1900 level.

Trading Derivatives carries a high level of risk to your capital and you should only trade with money you can afford to lose. Trading Derivatives may not be suitable for all investors, so please ensure that you fully understand the risks involved, and seek independent advice if necessary. A Product Disclosure Statement (PDS) can be obtained either from this website or on request from our offices and should be considered before entering into a transaction with us. Raw Spread accounts offer spreads from 0.0 pips with a commission charge of USD $3.50 per 100k traded. Standard account offer spreads from 1 pips with no additional commission charges. Spreads on CFD indices start at 0.4 points. The information on this site is not directed at residents in any country or jurisdiction where such distribution or use would be contrary to local law or regulation.

All of that being said, it is difficult to go short of a market that rallied 3 ½% during the previous session. At this point, I think we are overbought, but whether or not we get a true correction remains to be seen. In fact, I would not be comfortable shorting this market until we break down below the $1900 level again. Alternatively, if we turn around a break above the $1950 level, gold could go looking to the $2000 level after that.

It’s probably worth noting that we are at the apex of the previous triangle, so we are essentially in an area where the market is going to be doing a lot of fighting. Because of this, I would be very cautious about putting a lot of money into the market, and I would also keep a close eye on interest rates in America, because the higher they go, the lower gold goes, at least that’s the typical correlation. It certainly has been the way the market has been behaving recently, so it is something worth paying attention to.

The size of the candlestick on Friday is very telling, and of course volume spiked as well. It is because of this that I think the market is trying to do everything he can to change directions, but the question at this point is whether or not it can break through all of that previous noise? Pay attention to the peripheral markets, meaning the bond markets, and how they behave, as well as the US dollar. It’s worth noting that the US dollar can and will rise right along with gold at times, especially in geopolitical situations like we have now. In other words, you can’t just trade the “higher dollar, lower gold” scenario. You need to be a bit more nimble.