Gold Price Forecast – Gold Markets Continue to Stabilize at a Crucial Juncture

Gold Price Forecast – Gold Markets Continue to Stabilize at a Crucial Juncture

Gold Market Technical Analysis

Gold market has pulled back just a bit during the trading session on Tuesday in the early hours, only to turn around and show signs of life. Ultimately, the market is likely to see a lot of interest in this area, because we are right at the apex of the major triangle that we broke down from. If we break higher from here, it’s likely that the market will try to get to the $1975 level, and then eventually the $2000 level after that.

Trading Derivatives carries a high level of risk to your capital and you should only trade with money you can afford to lose. Trading Derivatives may not be suitable for all investors, so please ensure that you fully understand the risks involved, and seek independent advice if necessary. A Product Disclosure Statement (PDS) can be obtained either from this website or on request from our offices and should be considered before entering into a transaction with us. Raw Spread accounts offer spreads from 0.0 pips with a commission charge of USD $3.50 per 100k traded. Standard account offer spreads from 1 pips with no additional commission charges. Spreads on CFD indices start at 0.4 points. The information on this site is not directed at residents in any country or jurisdiction where such distribution or use would be contrary to local law or regulation.

That being said, we are sitting just above the 200-Day EMA indicator, and therefore we should have a certain amount of support. However, if we were to break down below the 200-Day EMA, then the market could drop down to the $1900 level. Underneath there, then it’s possible that the market could go much lower, perhaps trying to fill the gap in the futures contract.

Recently, the market has shown its bullish pressure, but over the last couple of candlesticks, we have seen the market to simply sit there and digest that noise. Ultimately, I think this shows that the market is getting ready to make some type of bigger move, but we will have to wait and see whether or not we break higher, or if we break lower. It should be somewhat obvious when it happens, and as a result it’s likely that we have the majority of traders just simply sitting here in more or less a “wait and see” attitude.

All things being equal, this is a market that I think will have to prove itself one direction or the other, then it’s your job to simply follow what happens. Pay attention to the bond markets, because if the interest rates in the United States start to climb again, that could work against the value of gold, and of course falling interest rates could push gold higher. In general, this is a situation where you have to see momentum jump back into the market before you get involved. Between now and then, it’s simply a waiting game.

US Dollar Index News: Strong Retail Sales Ignite DXY Amid Geopolitical Risks

US Dollar Index News: Strong Retail Sales Ignite DXY Amid Geopolitical Risks

US Dollar Firms Up on Bullish Retail Sales

The U.S. Dollar Index saw a modest uptick, gaining 0.22% to 106.108, after the release of stronger-than-expected retail sales data for September. Despite geopolitical concerns in the Middle East and an array of speeches from central bank officials lined up this week, including from Fed Chair Powell, the dollar showed resilience.

Investor Focus on Monetary Policy

Investors are keenly waiting for Fed Chair Jerome Powell’s speech on Thursday for cues on the monetary policy direction. While the rate-setting Federal Open Market Committee is unlikely to hike rates in its Oct 31-Nov 1 meeting, Powell’s remarks could set the tone for future actions. Philadelphia Fed President Patrick Harker has already indicated reluctance towards any near-term rate increases.

Trading Derivatives carries a high level of risk to your capital and you should only trade with money you can afford to lose. Trading Derivatives may not be suitable for all investors, so please ensure that you fully understand the risks involved, and seek independent advice if necessary. A Product Disclosure Statement (PDS) can be obtained either from this website or on request from our offices and should be considered before entering into a transaction with us. Raw Spread accounts offer spreads from 0.0 pips with a commission charge of USD $3.50 per 100k traded. Standard account offer spreads from 1 pips with no additional commission charges. Spreads on CFD indices start at 0.4 points. The information on this site is not directed at residents in any country or jurisdiction where such distribution or use would be contrary to local law or regulation.

Retail Sales Defy Economic Concerns

September retail sales outperformed expectations, surging 0.7% month-on-month and 3.8% year-on-year, offering some cushion to fears of a weakening economy. The data, unadjusted for inflation, reveal that consumer spending is keeping pace with inflation, which rose 0.4% in September.

Currency Market Sentiments

The dollar’s future seems locked in a range, impacted by various factors. Strong economic data could provide a tailwind, but a less aggressive Fed stance might limit gains. Meanwhile, the yen hovers close to 150 per dollar, raising concerns about potential intervention from Japanese authorities.

Short-Term Forecast

The robust retail sales data paints a bullish picture for the U.S. dollar in the short term. However, geopolitical risks and upcoming central bank speeches could add volatility. Investors should keep an eye on the Fed’s tone for a more definitive direction.

Technical Analysis

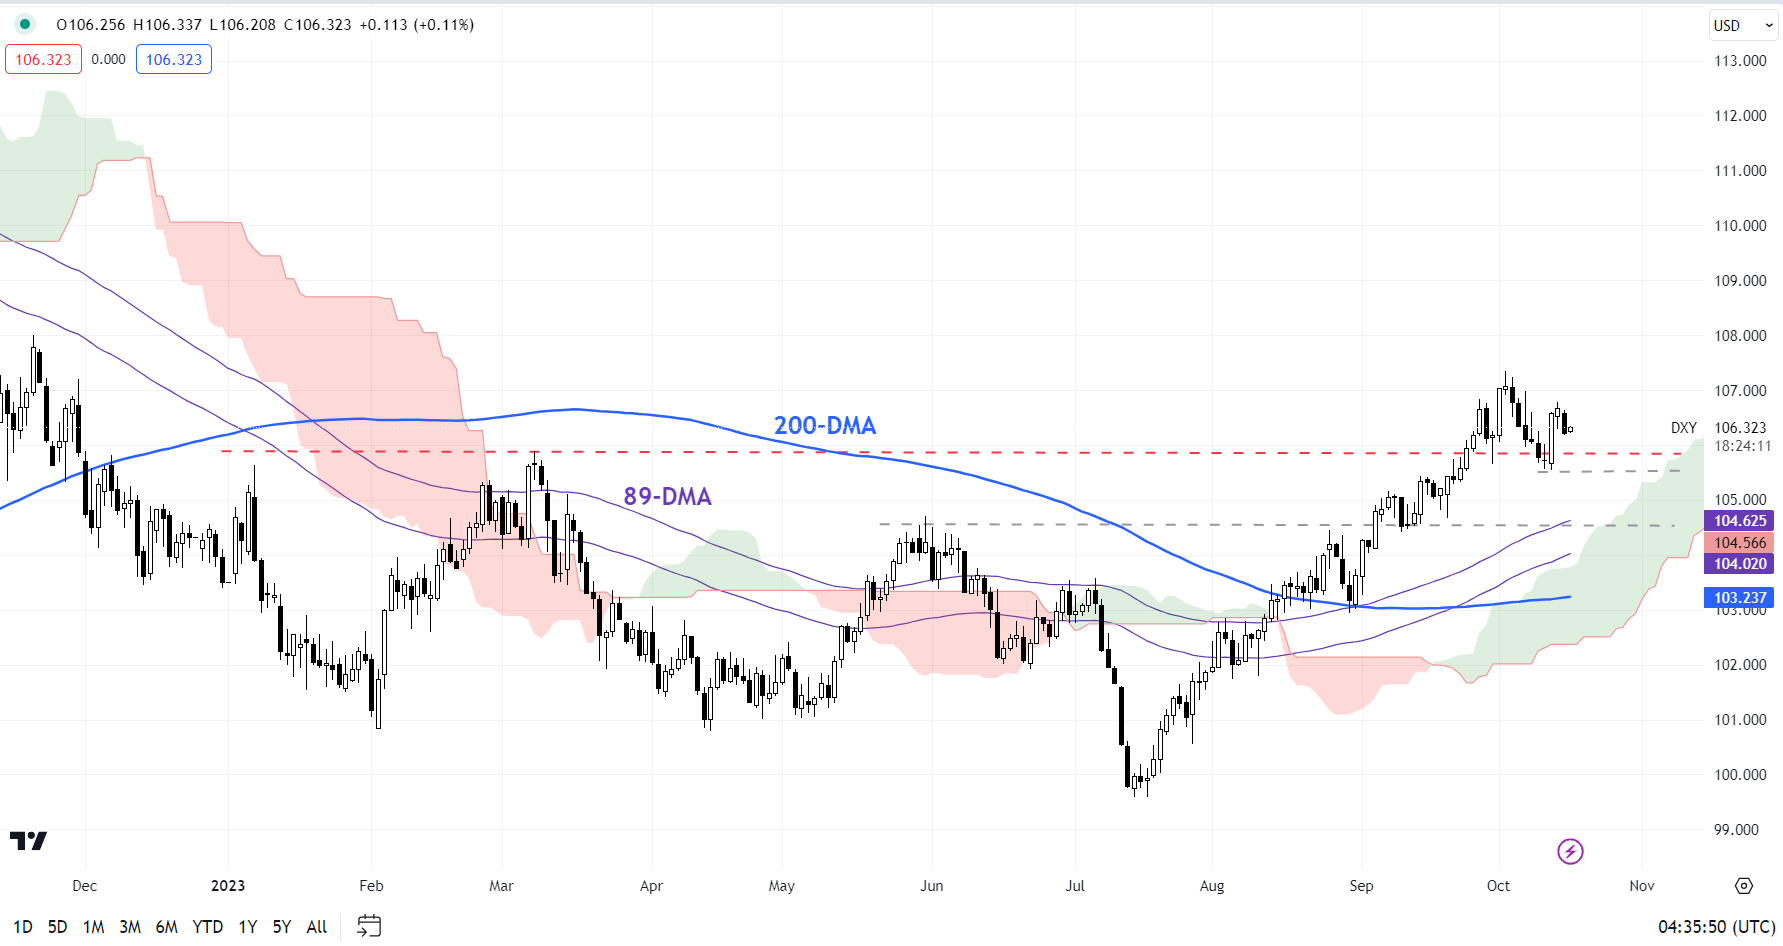
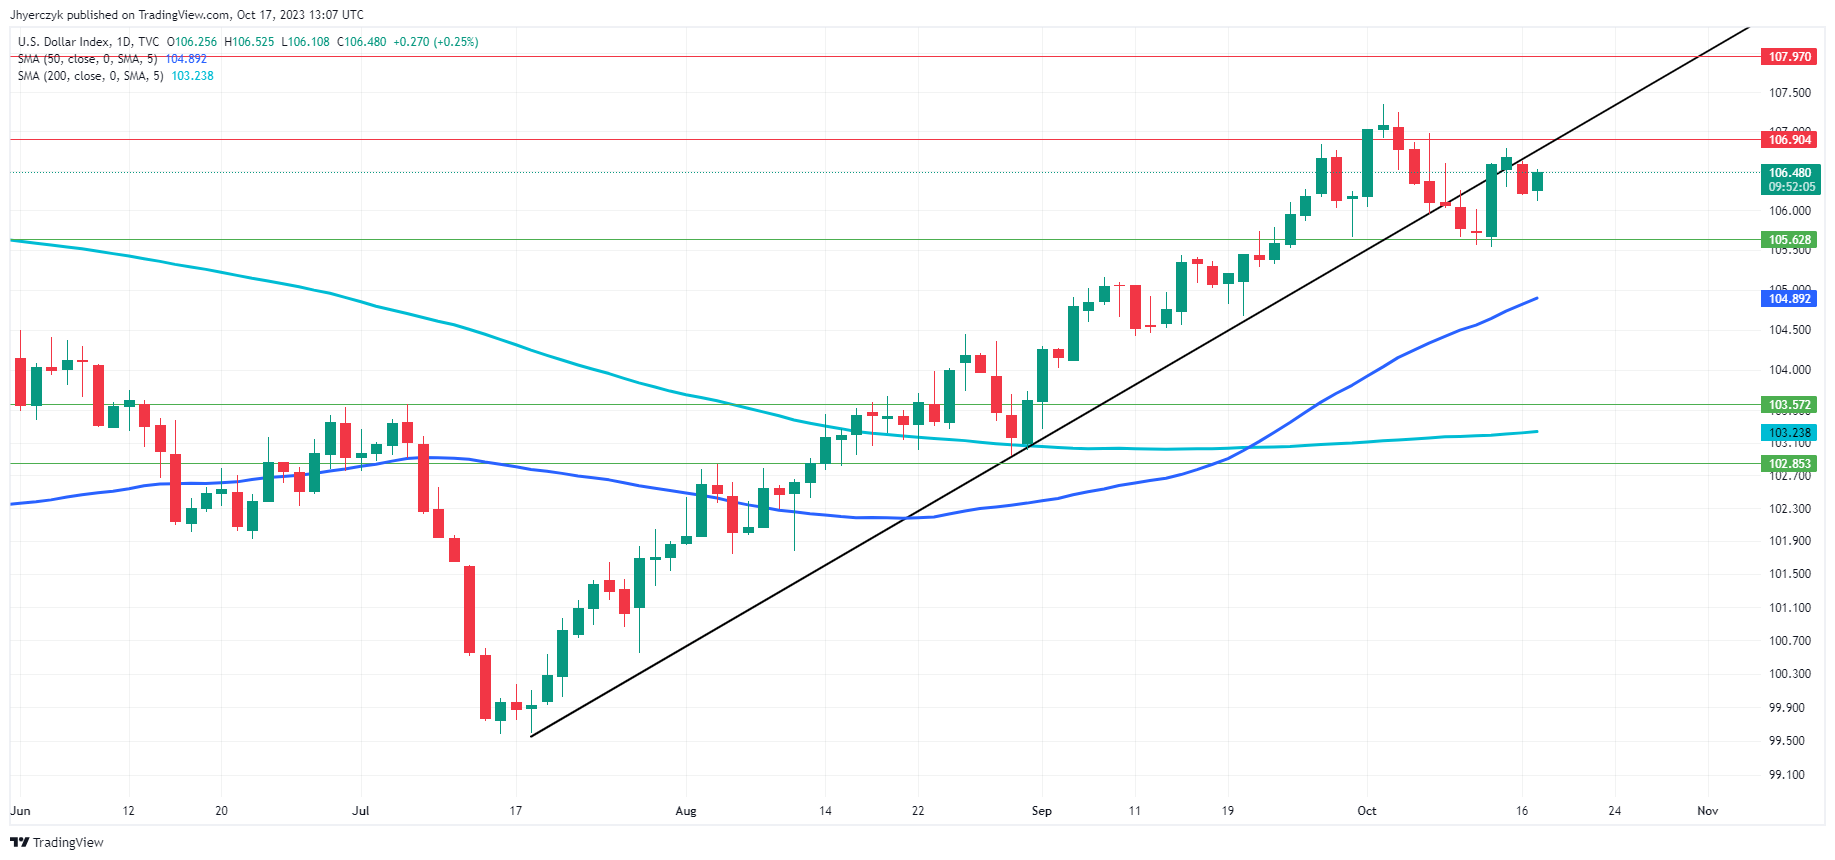
Daily US Dollar Index (DXY)The current daily price of the US Dollar Index (DXY) at 106.435 is slightly above the minor support level of 105.628 but below the minor resistance at 106.904. This puts the DXY in a neutral zone, but the price is higher than both the 200-day moving average of 103.237 and the 50-day moving average of 104.891, indicating a bullish trend.

However, with the trend line support at 106.774, the asset is at a critical juncture; a sustained break below could accelerate losses. But recapturing it could put the market on a strong upward trajectory.

NAHB Housing Market Index Drops As Mortgage Rates Climb To A 23-Year High

NAHB Housing Market Index Drops As Mortgage Rates Climb To A 23-Year High

On October 17, the National Association of Home Builders released NAHB Housing Market Index report for October. The report indicated that NAHB Housing Market Index declined from 45 in September to 40 in October, compared to analyst consensus of 44.

NAHB commented: “Builders have reported lower levels of buyer traffic, as some buyers, particularly younger ones, are priced out of the market because of higher interest rates.”

NAHB also noted that high interest rates have increased the cost of builder development and construction loans, leading to lower supply.

According to the report, 32% of builders reported cutting home prices in October. The average price discount remained at 6%. Freddie Mac data indicates that mortgage rates have climbed above the 7.50% level, so it remains to be seen whether price cuts from home builders will provide material support to housing market activity.

Today, traders also had a chance to take a look at the Industrial Production report for September, which indicated that Industrial Production increased by 0.3% on a month-over-month basis.

U.S. Dollar Index pulled back towards 106.20 as traders reacted to the housing market data. Traders ignore rising Treasury yields and bet that Fed will not raise rates again this year.

Gold moved towards the $1930 level as traders focused on U.S. dollar’s pullback. Rising demand for safe-haven assets provides additional support to gold.

SP500 moved away from session lows and climbed above the 4360 level after the release of the NAHB Housing Market Index report. The disappointing report provided some support to stocks as traders bet on a less hawkish Fed.

New Zealand Dollar Falls After Inflation Data, but NZD/USD Remains Above Key Support

New Zealand Dollar Falls After Inflation Data, but NZD/USD Remains Above Key Support

The New Zealand Dollar cautiously weakened in the aftermath of local inflation data. During the third quarter, New Zealand’s Consumer Price Index (CPI) grew by 5.6% compared to a year ago. This was slower than the 5.9% anticipated outcome. Meanwhile, compared to the previous quarter, local headline inflation expanded by 1.8%. That was slightly lower than the 1.9% expected result.

The data resulted in a softer-than-expected inflation report, which has key implications for the Reserve Bank of New Zealand (RBNZ). The RBNZ sets monetary policy by adjusting interest rates to help influence the pace of inflation and economic growth. The CPI data could mean that the central bank approaches policy with slightly more caution than previously expected.

As a result, the data has cooled expectations of further tightening, perhaps also opening the door to a shorter period for restrictive rates. This in turn might cool demand for the New Zealand Dollar, hence NZD/USD’s drop after the CPI report. With that in mind, the Kiwi Dollar might be left vulnerable in the near term, let us look at how price action is shaping up.

New Zealand Dollar Technical Analysis

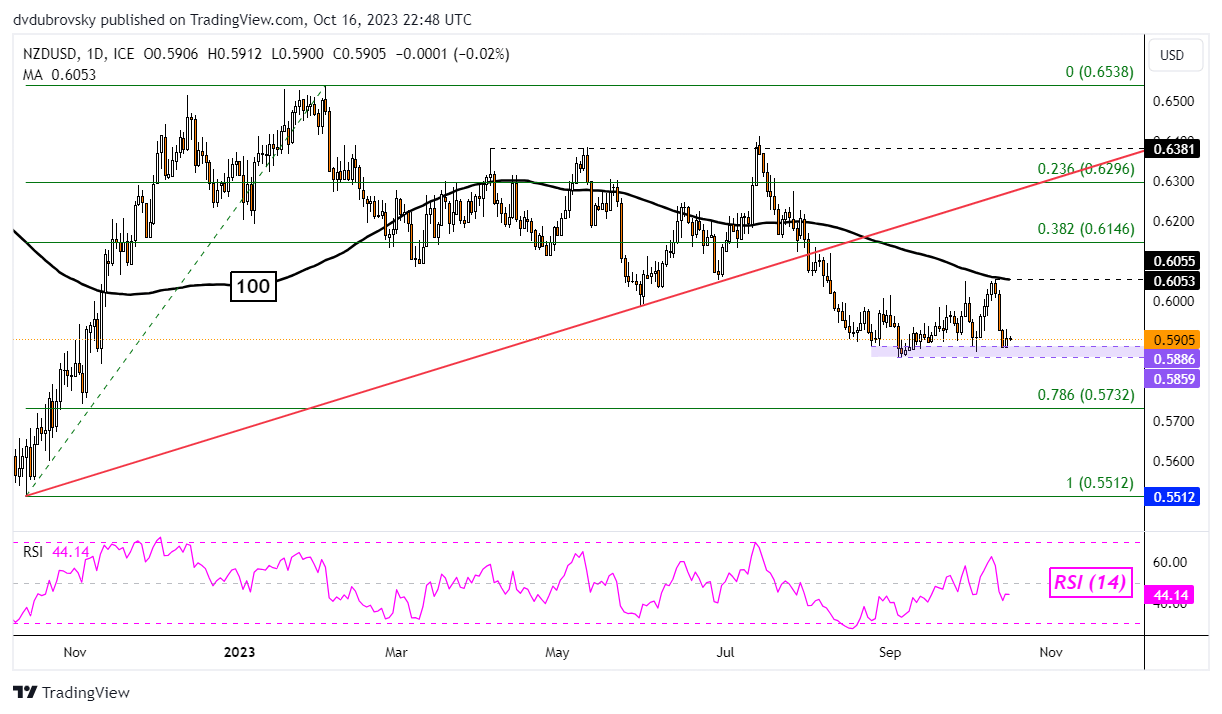
On the daily chart below, NZD/USD can be seen idling just above the 0.5859 – 0.5886 support zone. This range has been holding up since August, resulting in indecisive price action. Meanwhile, resistance is a combination of 0.6055 and the 100-day moving average. Until prices break above/below these highlights, the technical outlook seems to favor neutral.

Breaking lower exposes the 78.6% Fibonacci retracement level of 0.5732. Otherwise, turning higher and clearing resistance exposes the 38.2% level of 0.6146.

NZD/USD Daily Chart

NZD/USD Daily Chart

Euro Technical Outlook – Trend and Ranges for EUR/USD, EUR/JPY and EUR/GBP

Euro Technical Outlook – Trend and Ranges for EUR/USD, EUR/JPY and EUR/GBP

EUR/USD TECHNICAL ANALYSIS

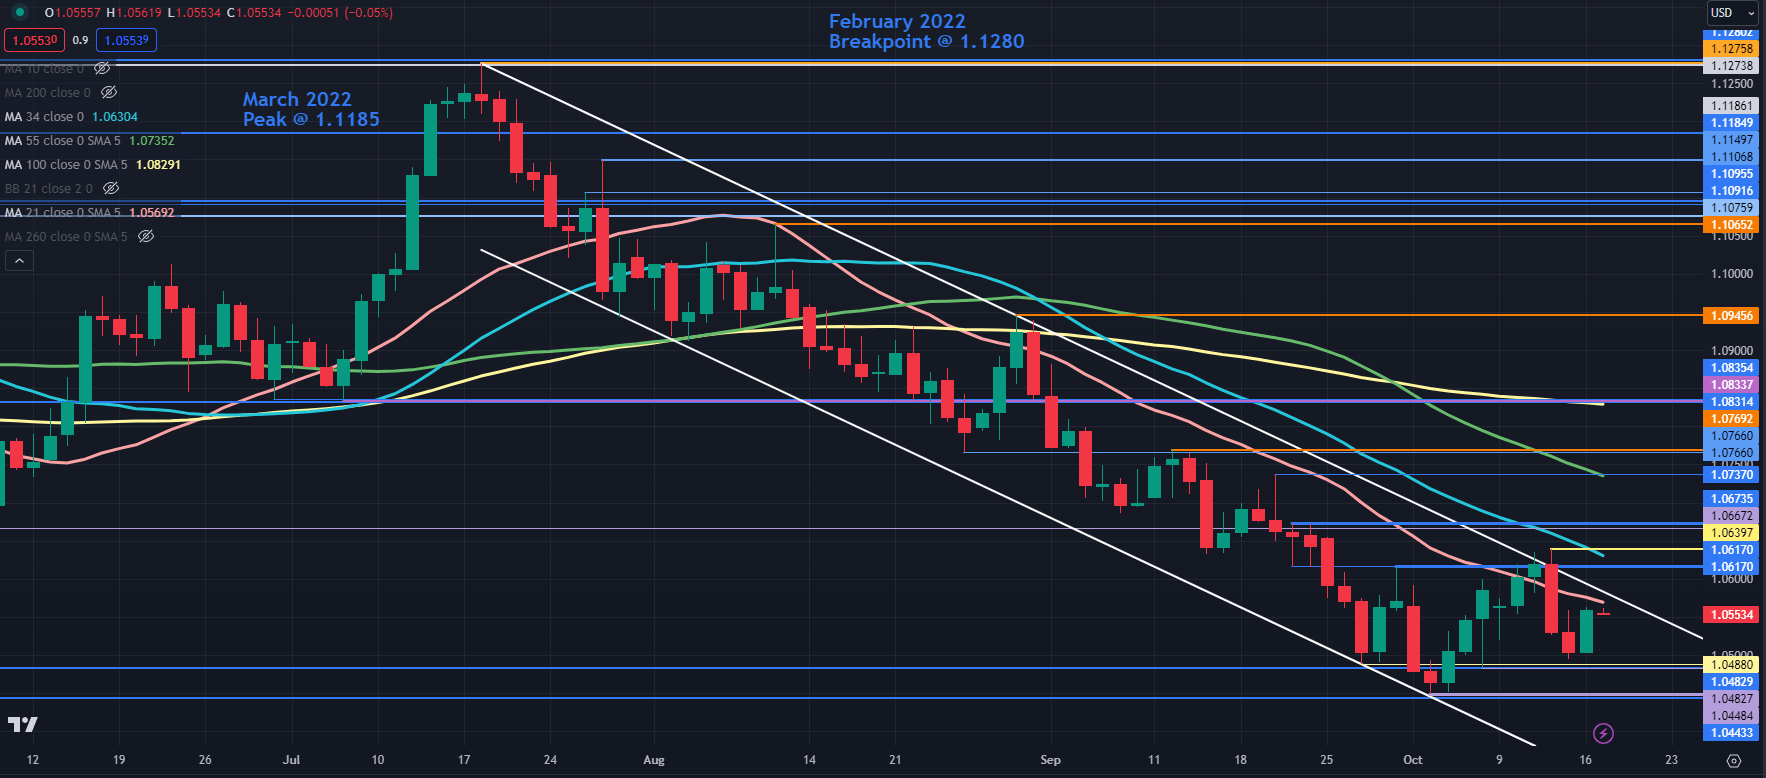
EUR/USD tried to break the topside of a descending trend channel last week but was unsuccessful and the channel remains in play for now.

That move posted a peak of 1.0640 but the daily close was below the descending trend line, potentially reaffirming that the trendline is intact.

A break above the trend line may see nearby resistance at the breakpoints and previous highs near 1.0620, 1.0640 and 1.0675.

Further up, resistance might be offered at a prior peak at 1.0737, which currently coincides with the 55-day simple moving average (SMA). Above there, another prior high and breakpoint near 1.0770 could offer resistance.

A bearish triple moving average (TMA) formation requires the price to be below the short-term SMA, the latter to be below the medium-term SMA and the medium-term SMA to be below the long-term SMA. All SMAs also need to have a negative gradient.

When looking at any combination of the 21-, 34-, 55- and 100-day SMAs, the criteria for a TMA have been met and might suggest that bearish momentum is evolving.

On the downside, support might lie near the breakpoints and lows of early 2023 that were tested at the start of this month with 1.0480 and 1.0440 as potential levels of note.

EUR/USD DAILY CHART

image1.png

EUR/JPY TECHNICAL ANALYSIS

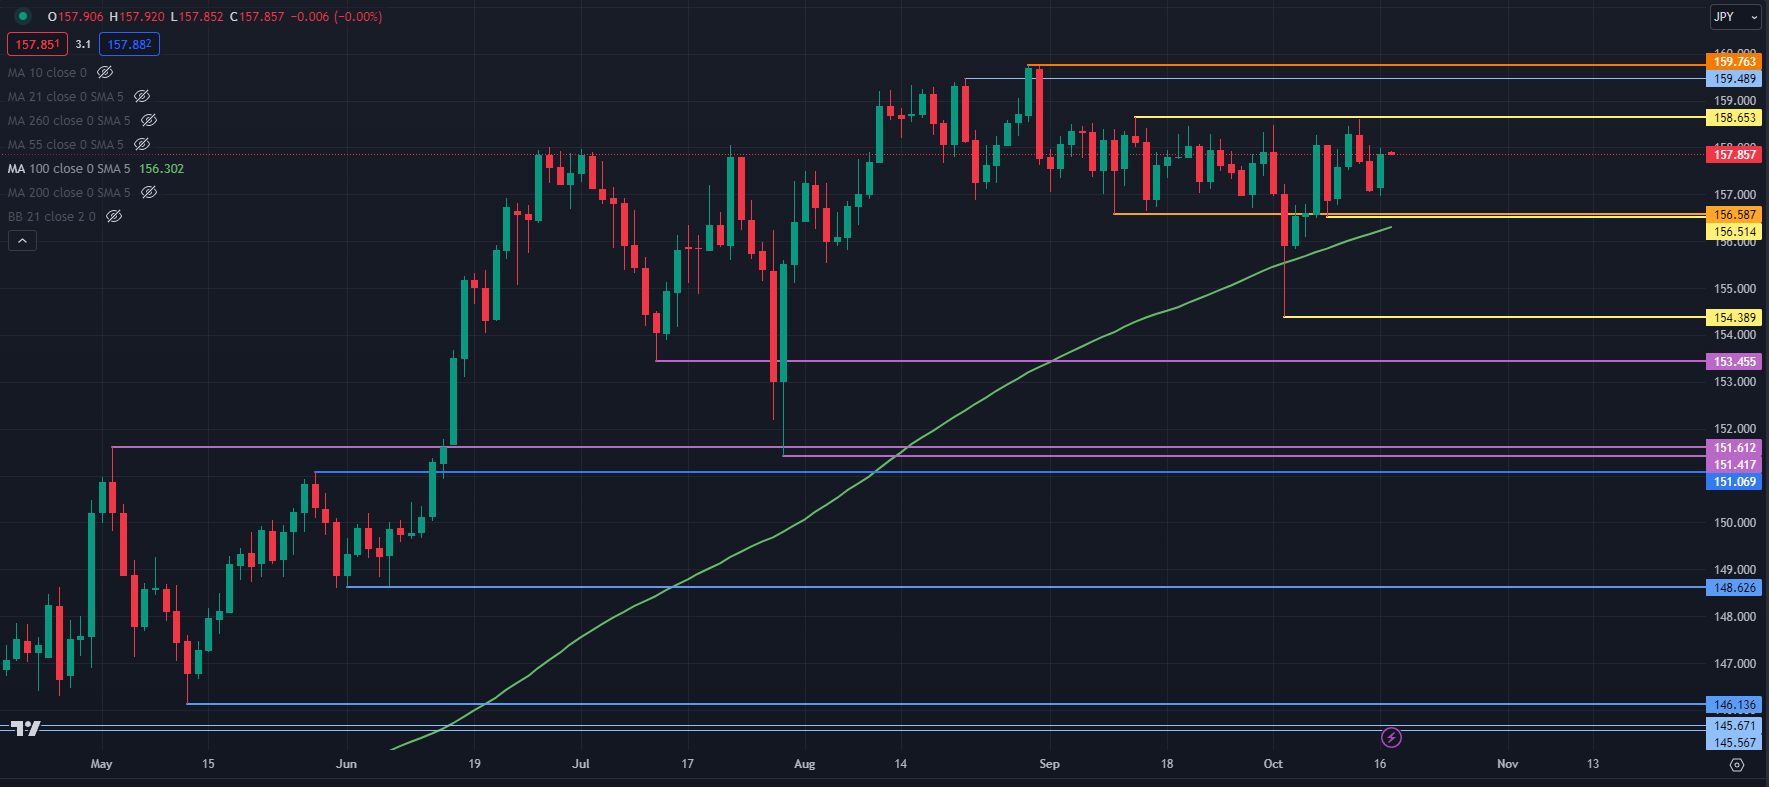
EUR/JPY appears to have settled back into its recent range after rejecting the move lower a fortnight ago when it traded down to a three-month low of 154.39.

That dip broke below the September low and the 100-day Simple Moving Average (SMA) before closing back above both of them in the proceeding sessions.

This may provide opportunities for A range trading strategy. To learn more about range trading, click on the banner below.

On the downside, support could be at the breakpoint and a recent low toward 156.50. On a sustained move lower, the levels to watch might be at the previous lows and breakpoints of 154.39, 153.45, 151.60, 151.40 and 151.07.

On the top side, the recent highs and breakpoint near 158.65, 159.50 and 159.75 may offer resistance.

EUR/JPY DAILY CHART

image2.png

EUR/GBP TECHNICAL ANALYSIS

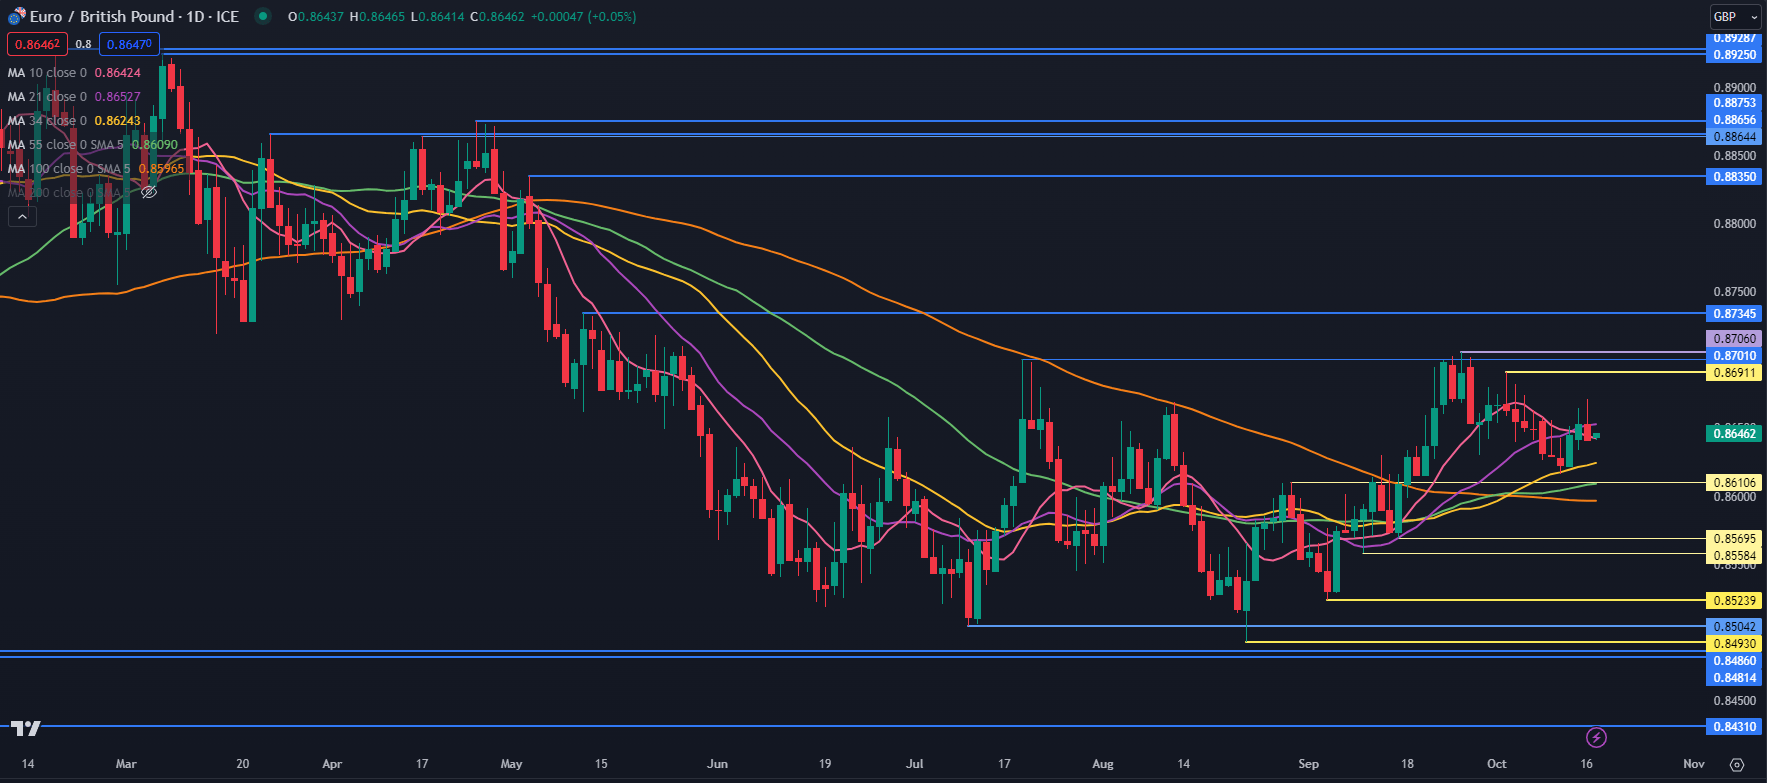
EUR/GBP has been trading between 0.8493 and 0.8706 for 5 months in what appears to be a range trading environment.

The 10-, 21-, 34-, 55- and 100-day SMAs are all grouped together between 0.8596 and 0.8653 potentially re-affirming the range trade environment for the time being.

However, if either side of the range is penetrated, a breakout trade opportunity may evolve. To learn more about breakout trading, click on the banner below.

Support might be at the breakpoints and recent lows of 0.8610, 0.8570, 0.8559, 0.8524, 0.8504 and 0.8493.

On the upside, resistance could be at the prior peaks of 0.8691, 0.8706 and 0.8735.

EUR/GBP DAILY CHART

image3.png

Is the Worst Over for Gold/Silver? XAU/USD, XAG/USD Price Setups

Is the Worst Over for Gold/Silver? XAU/USD, XAG/USD Price Setups

Potential safe-haven bids and short-covering on escalating tensions in the Middle East have boosted gold this month. Dovish comments by US Federal Reserve officials suggesting that the US central bank has pivoted on rates is also supporting the yellow metal. In this regard, the key focus is on Fed Chair Powell’s speech later this week. The market is pricing in around a 90% chance that the Fed will keep interest rates unchanged at its Oct. 31-Nov. 1 meeting.

While heightened geopolitical uncertainty could keep precious metals well bid, unless the broader trajectory of US Treasury yields/real yields reverse, the path of least resistance for gold remains sideways to down. Geopolitics is one of the risks that could slow or reverse the slide in the yellow metal, as highlighted in the quarterly outlook. “Gold Q4 Fundamental Forecast: Weakness to Persist as Real Yields Rise Further,” published October 6, and “Gold/Silver Q4 Technical Forecast: Tide Remains Against XAU/USD & XAG/USD,” published October 1.

XAU/USD Daily Chart

image1.png

Gold: Rally hits a roadblock

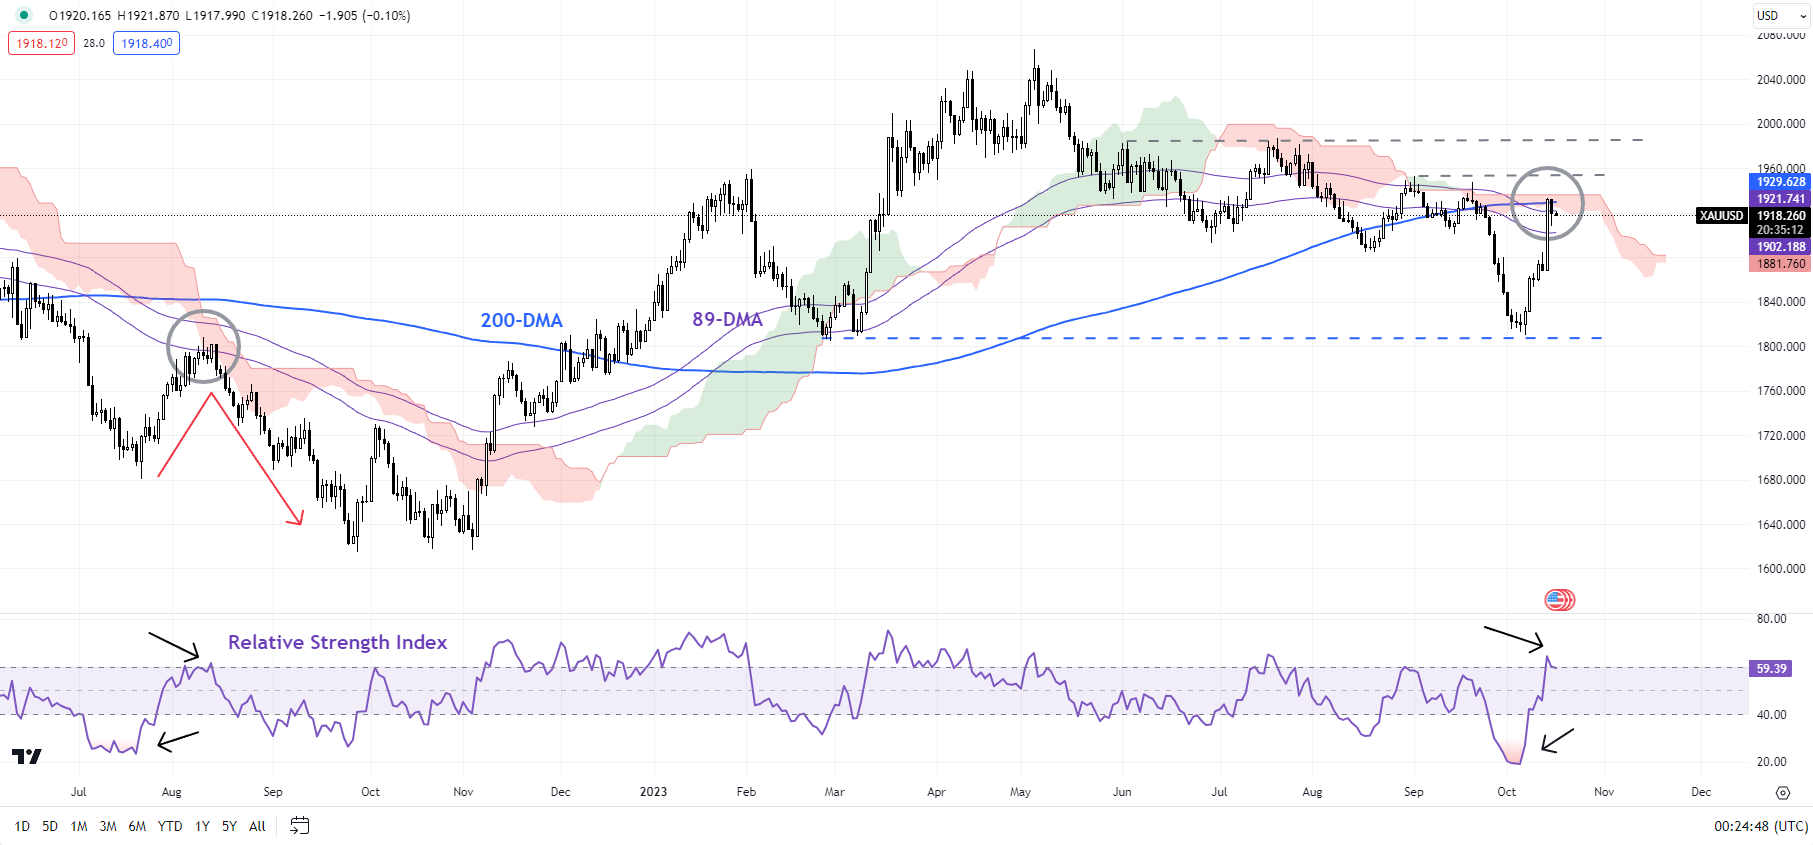
On technical charts, gold has run into significant converged resistance at the September high of 1953, the 89-day moving average, the 200-day moving average, and the upper edge of the Ichimoku cloud on the daily charts. Despite the rebound, the 14-Relative Strength Index (RSI) was unable to clear 60-65, suggesting that the rally in recent sessions isn’t the start of a new trend.

Recommended by Manish Jaradi
Get Your Free USD Forecast
Get My Guide

XAU/USD Weekly Chart

image2.png

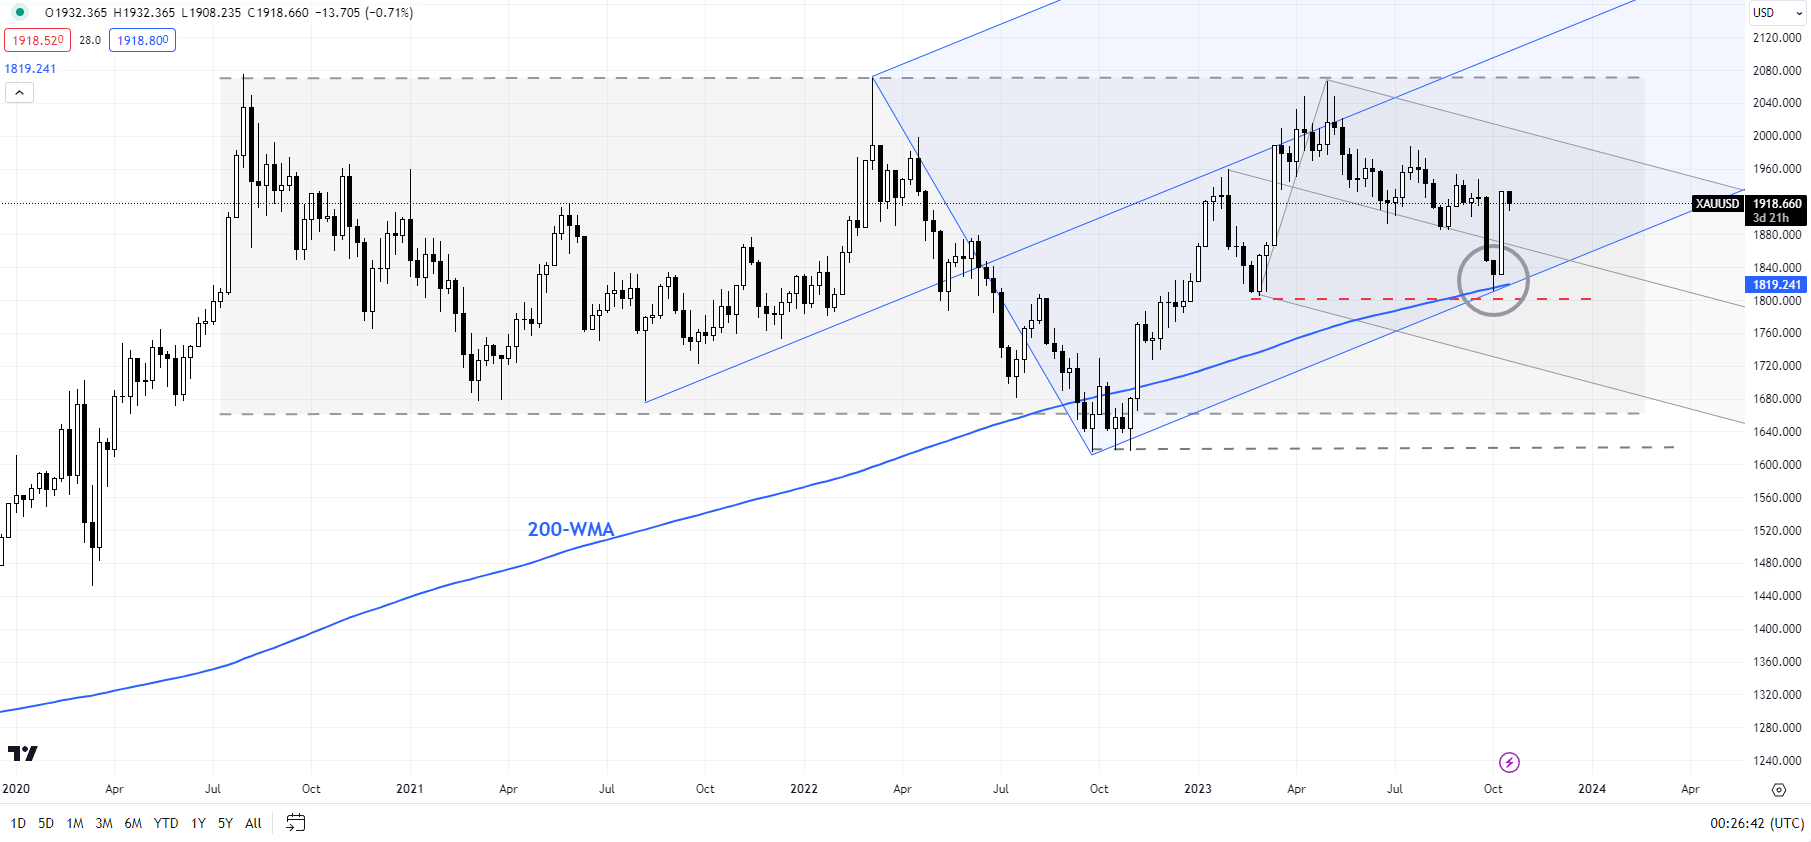
That’s because the rebound since early October looks similar to the one in mid-2022. Deeply oversold conditions (RSI below 20) triggered a rebound toward the 89-day moving average and the cloud. Gold subsequently made a new low a few months later. Any break below Monday’s low of 1905 would indicate that the upward pressure since last week had faded.

On the upside, as mentioned in the quarterly outlook, XAU/USD needs to rise abovethe July high of 1987 for the immediate downside risks to dissipate. Furthermore, a crack above the May high of 2072 is needed for the outlook to turn bullish.

XAG/USD Daily Chart

image3.png

Silver: Yet to break significant resistance

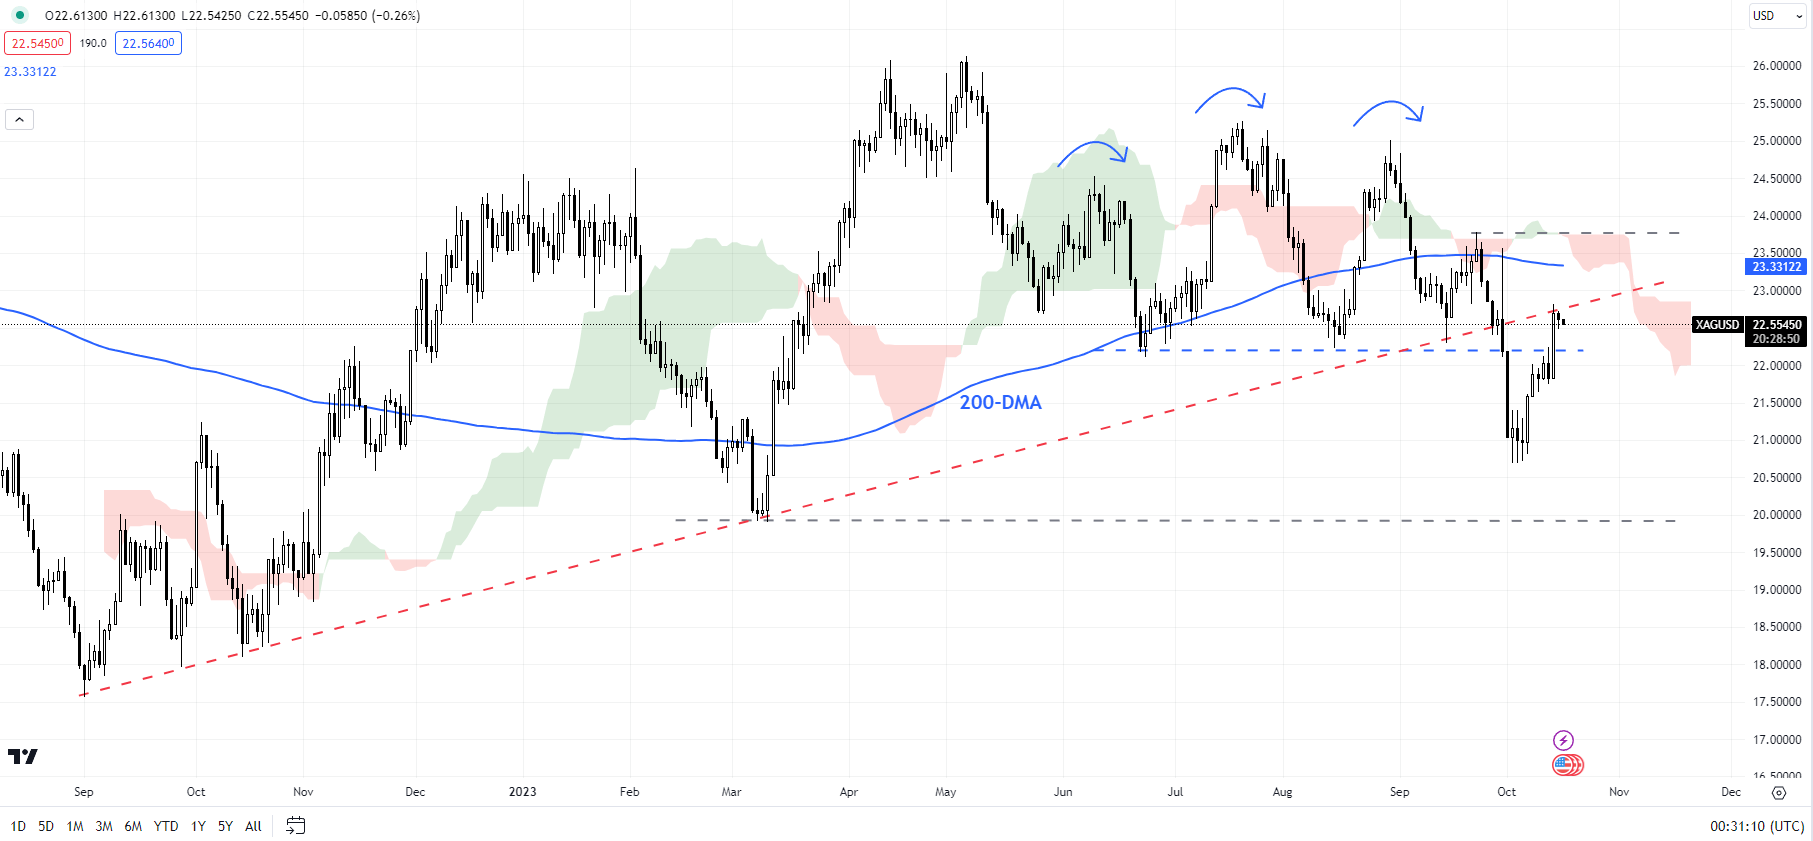
Silver’s rebound has run into stiff resistance on an uptrend line from late 2022, slightly above the support-turned-resistance at the August low of 22.20. Above this, there is a major converged hurdle on the 200-day moving average, the late-September high of 23.75, and the upper edge of the Ichimoku cloud on the daily charts. XAG/USD needs to cross the 23.25-23.75 area for the immediate downward pressure to fade.

Any fall below Monday’s low of 22.50 could open the door toward Thursday’s low of 21.75. Next support is at the early-October low of 20.50, followed by stronger support at the March low of 19.85.

Japanese Yen Poised for a Move as US Dollar Pivots Amid Rising Risks. Higher USD/JPY?

Japanese Yen Poised for a Move as US Dollar Pivots Amid Rising Risks. Higher USD/JPY?

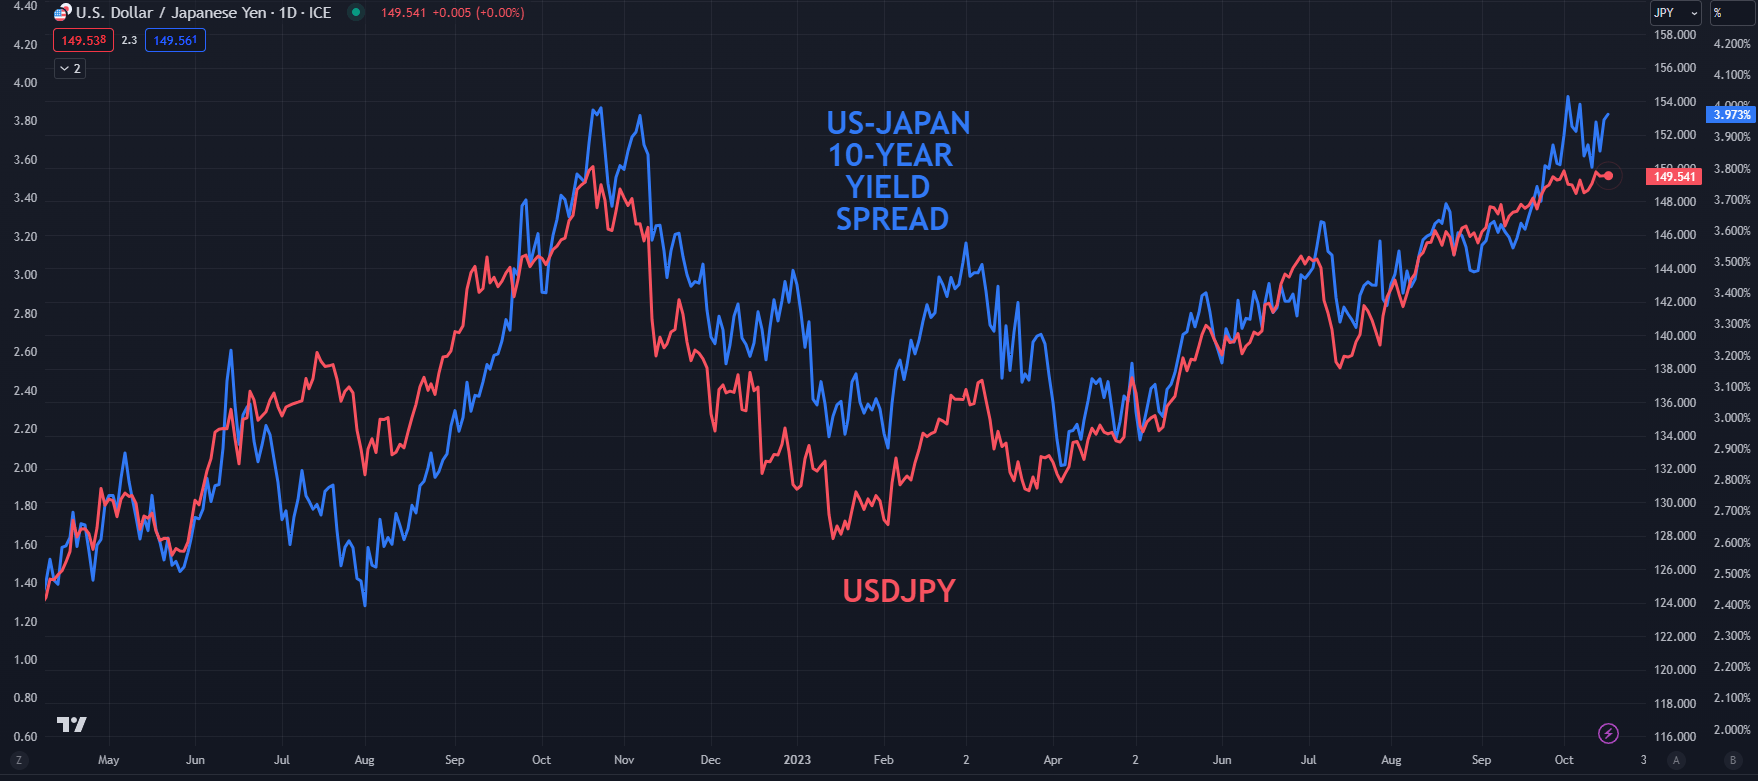
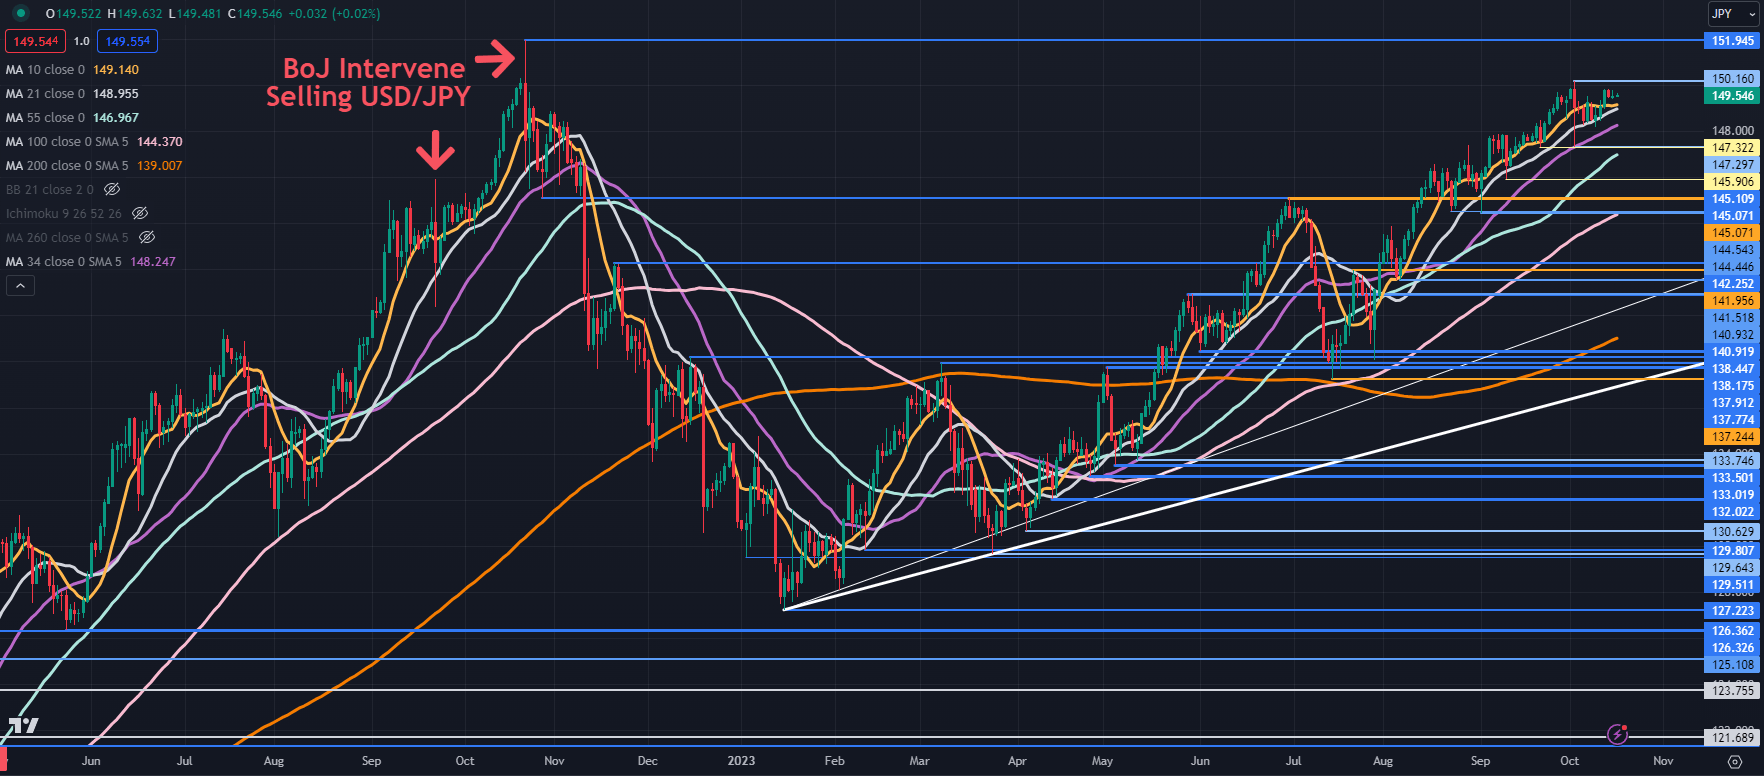
USD/JPY is homing in on the highs above 150 with elevated Japanese Government Bond (JGB) yields being outstripped by rising Treasury returns in a geopolitical environment that has seen haven assets underpinned to an extent.

10-year JGBs nudged 0.81% two weeks ago and continue to trade nearby at 0.76% going into Tuesday’s session. At the same time, the 10-year Treasury note is trading above 4.70% after eclipsing 4.88% earlier in the month.

The spread between the bonds favours the US Dollar and might add upside pressure to the exchange rate.

USD/JPY AND JP-US 10-YEAR BOND SPREAD

image1.png

Elsewhere, USD lost ground going into the North American close but has steadied through the Asian session so far today.

The Australian Dollar has seen the largest gains over the last 24 hours, reclaiming 0.6350 and the Kiwi Dollar has recovered some of the losses seen in the aftermath of CPI printing at 5.6% year-on-year, below estimates of 5.9%.

Crude oil prices have slipped again today as the Israeli – Hamas war remains in focus. There is a growing view in the market that if the conflict is regionally contained then it may not impact global supply as much as originally thought.

The WTI futures contract is near US$ 86.30 bbl while the Brent contract is a touch below US$ 89.50 bbl at the time of going to print. Live prices can be seen to the right of this article.

APAC equities have mostly followed Wall Street’s lead to score a positive day. India’s indices are an exception, trading slightly in the red.

US President Joe Biden is anticipated to visit Israel later this week while Russian President Vladimir Putin arrived in Beijing today for the Belts and Roads conference.

In what could be the highlight for markets this week, Fed Chair Jerome Powell is anticipated to deliver an address on Thursday to the Economic Club of New York.

It would appear likely to be his last opportunity to make a public statement before the blackout period begins this Saturday ahead of the Federal Open Market Committee (FOMC) meeting running over October 31 and November 1st.

Interest rate markets are not pricing in any change in the Fed funds target rate at this meeting.

Spot gold has peeled lower again, trading below US$ 1,915 going into the European session.

After UK jobs data and the German ZEW survey, the US will see retail sales figures and Canada will get its latest CPI print.

USD/JPY TECHNICAL ANALYSIS SNAPSHOT

USD/JPY is inching closer to the 12-month high seen at the start of October and a break above there could see a run toward the 33-year peak seen at this time last year at 151.95.

Such a move risks the possibility of the Bank of Japan (BoJ) physically intervening in the foreign exchange market.

A bullish triple moving average (TMA) formation requires the price to be above the short-term SMA, the latter to be above the medium-term SMA and the medium-term SMA to be above the long-term SMA. All SMAs also need to have a positive gradient.

When looking at any combination of the 10-, 21-, 34-, 55-, 100- and 200-day SMAs, the criteria for a TMA have been met and might suggest that bullish momentum is evolving. To learn more about trend trading, click on the banner below.

On the downside, support may lie at the recent lows near 147.30 and 145.90 or further down at the breakpoints in the 145.05 – 145.10 area ahead of the prior lows near 144.50 and 141.50.

image2.png


Has the US Dollar Rally Hit Limits? DXY Index Fractals, Price Action

Has the US Dollar Rally Hit Limits? DXY Index Fractals, Price Action

The US dollar’s rally is looking stretched on some measures, including market diversity, on the growing conviction that the US interest rates have pivoted.

Key US Federal Reserve officials sounded less hawkish last week, indicating that the jump in US Treasury yields has done some of the Fed’s tightening for it and proceeding carefully with any further increases in the benchmark federal funds rate. As a result, the market-implied pricing for the US terminal rate has fallen sharply. Markets will now be looking for a confirmation from Fed Chair Jerome Powell later this week if the US central bank has indeed pivoted.

Minutes of the last FOMC meeting showed increased concern about the risks of hiking too much, though members agree that there is still work to do with key measures of inflation remaining well above their target. Moreover, the conflict in the Middle East lowers the bar for immediate tightening. The market is pricing in around a 90% chance that the Fed will keep interest rates unchanged at its Oct. 31-Nov. 1 meeting.

DXY Index Index Chart

image1.png


Interestingly, market diversity, as measured by fractal dimensions, appears to be low as the DXY Index hit a multi-month high last month. Fractal dimensions measure the distribution of diversity. When the measure hits the lower bound, typically 1.25-1.30 depending on the market, it indicates extremely low diversity as market participants bet in the same direction, raising the odds of at least a pause or even a price reversal. For the DXY Index, the 65-day fractal dimension has fallen below the threshold of 1.25, flashing a red flag. See the chart with previous instances when the indicator fell below the 1.25 threshold.

DXY Index Weekly Chart

image2.png

Chart Created by Manish Jaradi Using TradingView

On technical charts, the index is testing major resistance on the upper edge of the Ichimoku cloud on the daily charts, near the March high of 105.90. However, for the immediate upward pressure to fade, the index would need to fall below initial support at last week’s low of 105.50.

DXY Index Daily Chart

Chart Created by Manish Jaradi Using TradingView

Beyond the short term, the outperformance of the US economy relative to the rest of the world coupled with a relatively hawkish Fed compared with its peers have been key drivers for the USD. Jobs data earlier this month highlighted that the US economy remains on a solid footing. Unless US exceptionalism reverses, the US dollar could stay well bid even if there is convergence of monetary policy.

UK Breaking News: UK Earnings Ease in August, Sterling Heads Lower

UK Breaking News: UK Earnings Ease in August, Sterling Heads Lower

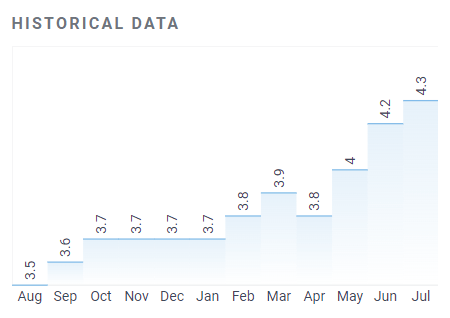
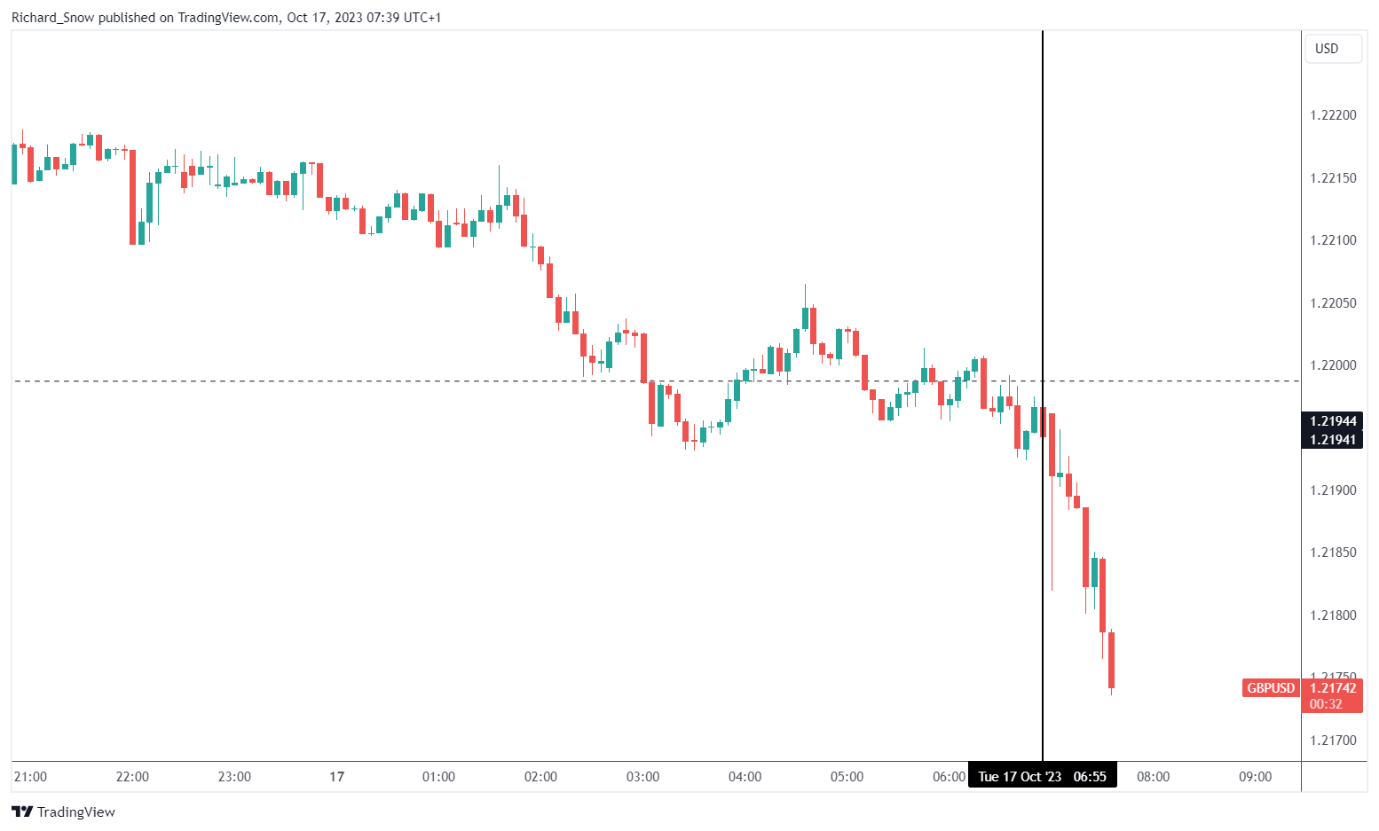
UK unemployment data has started to trend lower in recent months, arresting concerns that a tight job market combined with rising earnings will entrench inflation expectations. In fact, UK unemployment has increased to 4.3% in July from 3.5% in August 2022 and we will find out next week if the upward trend is set to continue. The IMF’s World Economic Outlook report this month noted a sharper contraction in UK GDP for 2024 which is likely to see further job losses along the way as financial conditions are expected to remain restrictive.

image3.png

GBP/USD 5-Minute Chart

image4.png

Crypto News: The Middle East, Crypto-Spot ETFs, and the SEC in Focus

Crypto News: The Middle East, Crypto-Spot ETFs, and the SEC in Focus

Fake News Sent BTC to a Monday Session High of $30,128

On Monday, news hit the wires of the SEC approving the Blackrock BTC-spot ETF application. A crypto news portal posted news of the Blackrock BTC-spot ETF approval on X (formerly Twitter).

Blackrock (BLK) denied the report, confirming that the iShares Bitcoin ETP application was still under review.

Trading Derivatives carries a high level of risk to your capital and you should only trade with money you can afford to lose. Trading Derivatives may not be suitable for all investors, so please ensure that you fully understand the risks involved, and seek independent advice if necessary. A Product Disclosure Statement (PDS) can be obtained either from this website or on request from our offices and should be considered before entering into a transaction with us. Raw Spread accounts offer spreads from 0.0 pips with a commission charge of USD $3.50 per 100k traded. Standard account offer spreads from 1 pips with no additional commission charges. Spreads on CFD indices start at 0.4 points. The information on this site is not directed at residents in any country or jurisdiction where such distribution or use would be contrary to local law or regulation.

The ramifications are significant. BTC longs experienced a breakout session and had a dress rehearsal for the likely market reaction to an SEC approval. However, the fake news led to the liquidation of millions of short positions.

More significantly, the SEC may consider the events on Monday when reviewing the spot ETF applications. The SEC could raise concerns over the influence of unverified news on the crypto market.

Over the weekend, Bloomberg Intelligence ETF Analyst James Seyffart put the probability of the SEC approving the Ark BTC-spot ETF application at 90%.

Binance Hits Pause on UK Plans After FCA Scrutiny

Binance announced it would stop accepting new UK customers. Last week, the UK Financial Conduct Authority intervened in a new partnership between Binance and rebuildingsociety.com.

Binance forged the new partnership to allow rebuildingsociety.com to handle its UK promotional materials and communications. The FCA intervention took place a matter of days after Binance announced the new partnership, highlighting the intense scrutiny amidst the ongoing SEC v Binance lawsuit.

The SEC filed thirteen charges against Binance CEO CZ, Binance US, and Binance in June 2023. Notably, the SEC filed charges against Coinbase (COIN) just days after.

Technical Analysis

Bitcoin Analysis

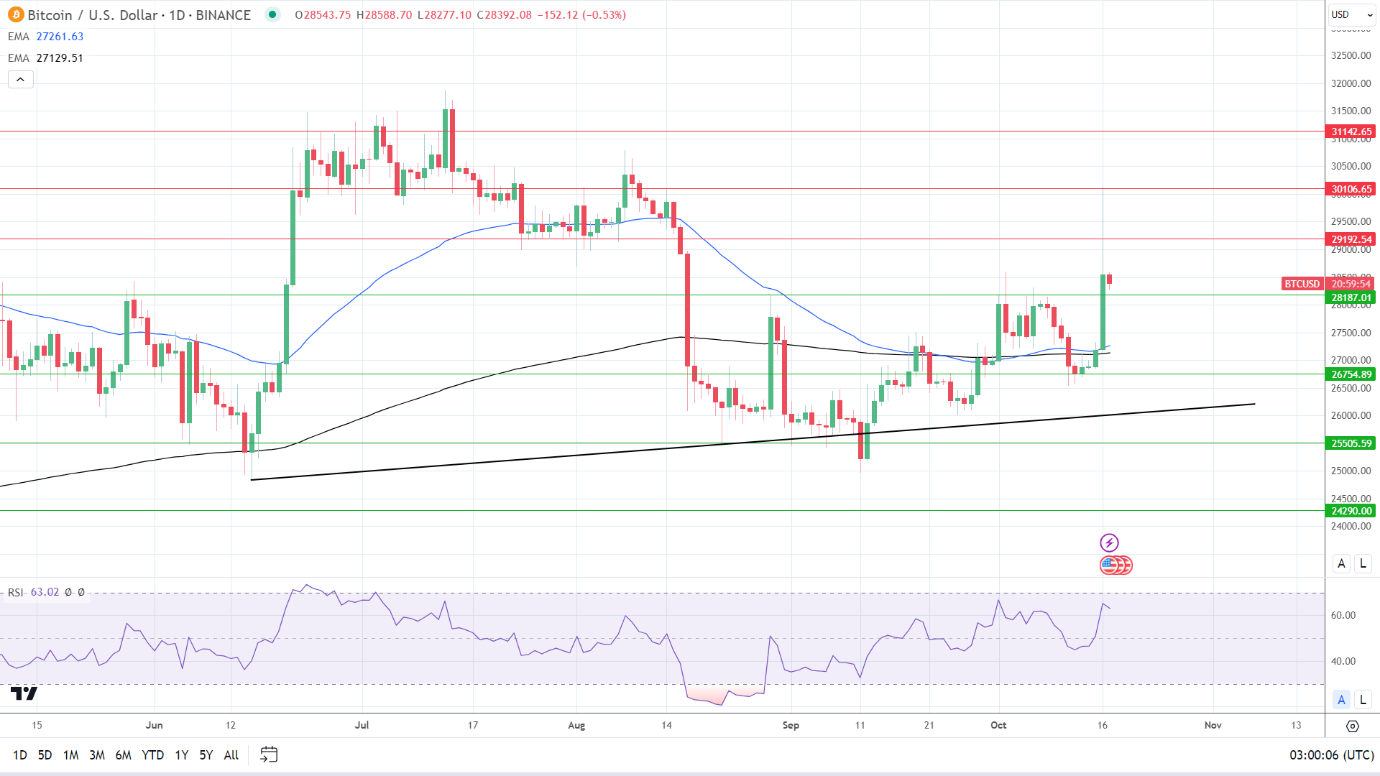
BTC held above the 50-day and 200-day EMAs, affirming bullish price signals. Significantly, the 50-day EMA pulled away from the 200-day EMA avoiding a bearish cross.

A BTC return to $28,500 would support a move toward the $29,193 resistance level. Investors will remain sensitive to BTC-spot ETF chatter throughout the day and news updates on the Middle East conflict.

However, a fall through the $28,187 support level would bring the $26,755 support level into view. Risk aversion stemming from the Middle East or an SEC response to the Monday events could test buyer appetite.

The 14-Daily RSI reading of 63.10 supports a BTC return to $29,000 before entering overbought territory.

BTC Daily Chart sends bullish price signals.
BTCUSD 171023 Daily Chart

Ethereum Analysis

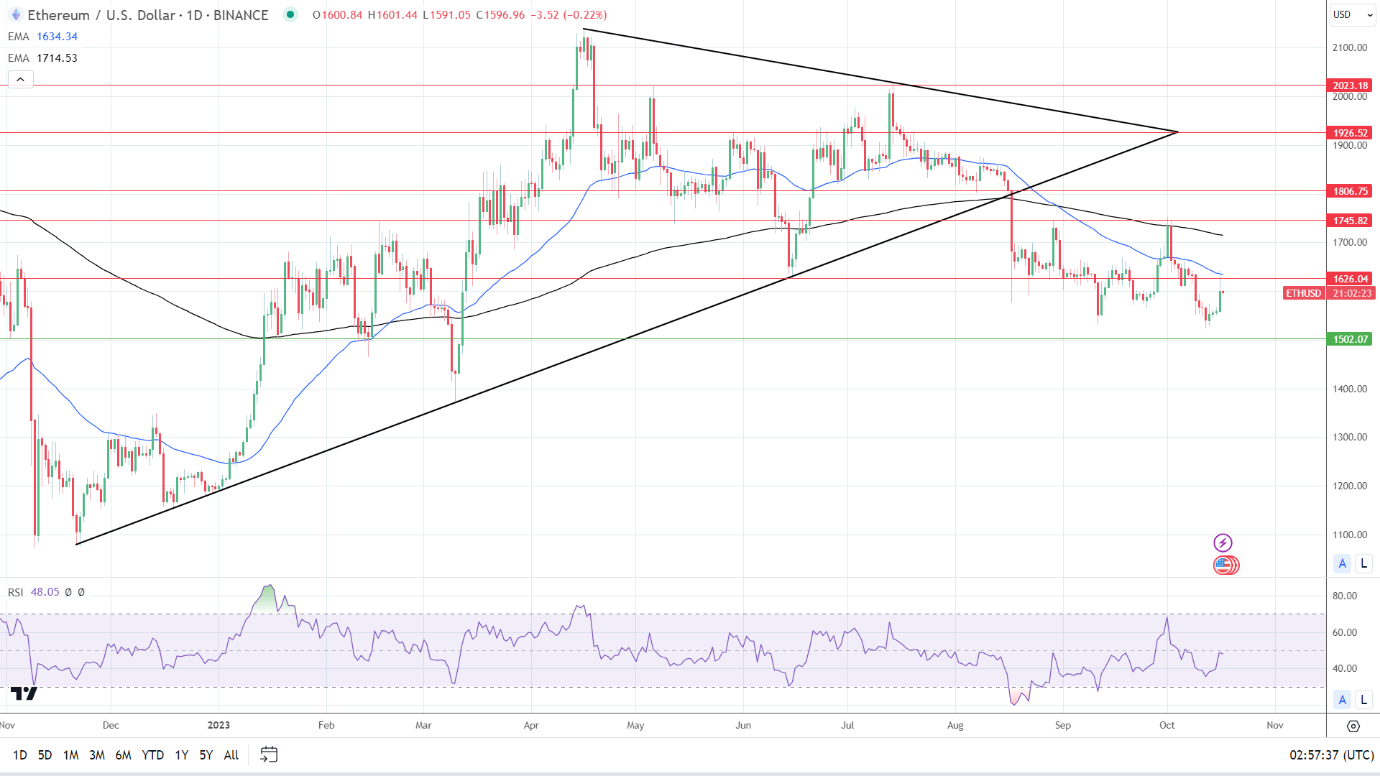
ETH remained below the 50-day and 200-day EMAs, affirming bearish price signals.

An ETH break above the $1,626 resistance level and the 50-day EMA would support a move toward the 200-day EMA. ETH-spot ETF-related news and regulatory chatter will remain the focal points.

However, a fall below $1,550 would bring the $1,502 support level into play.

The 14-Daily RSI reading of 48.05 supports an ETH move to the $1,502 support level before entering oversold territory.

ETH Daily Chart sends bearish price signals.
ETHUSD 171023 Daily Chart