EUR/USD Forecast – Euro Gives Up Early Gain

EUR/USD Forecast – Euro Gives Up Early Gain

Euro vs US Dollar Technical Analysis

The euro initially rallied during the trading session on Wednesday, but pulled back a bit at this point. All things being equal, the market looks as if it continues to see plenty of downward pressure, which makes quite a bit of sense considering the overall risk aversion that we have seen for most of the last several months. The US dollar of course is a safety currency, and therefore it makes a lot of sense that people would run toward it.
Advertisement
Know where EUR/USD is headed? Take advantage now with

Trading Derivatives carries a high level of risk to your capital and you should only trade with money you can afford to lose. Trading Derivatives may not be suitable for all investors, so please ensure that you fully understand the risks involved, and seek independent advice if necessary. A Product Disclosure Statement (PDS) can be obtained either from this website or on request from our offices and should be considered before entering into a transaction with us. Raw Spread accounts offer spreads from 0.0 pips with a commission charge of USD $3.50 per 100k traded. Standard account offer spreads from 1 pips with no additional commission charges. Spreads on CFD indices start at 0.4 points. The information on this site is not directed at residents in any country or jurisdiction where such distribution or use would be contrary to local law or regulation.

Furthermore, there is a huge interest rate differential between the 2 currencies, and therefore you get paid to be short of the market, therefore, I think it is probably only a matter of time before we see further downward pressure. The 1.05 level underneath is a large, round, psychologically significant figure, which of course people will pay close attention to. If we were to break down below there, then the market is likely to go much lower. At that point, the euro is likely to reach toward the 1.0250 level. Underneath there, then you have the parity level, which of course will attract a lot of attention in and of itself.

On the chart, I have a bearish flag marked out and I do think that most traders out there see this. Because of this, it’s probably only a matter of time before technical traders really start to press the issue as well. At the top of the flag, you have the 50-Day EMA indicator offering a significant amount of resistance. So technical traders would also pay attention to that as a potential “ceiling” going forward.

Ultimately, this is a market that has been negative for some time, and this recent consolidation is probably just going to end up being simple consolidation before a plunge. That being said, keep in mind that the market has been choppy for the most part, you should pay close attention to it and recognize that longer-term trades are going to be difficult to come by at the moment. However, we will eventually break down through the bottom of the flag if the technical analysis plays out, and that should bring in quite a bit of momentum.

Gold, Silver, Copper Analysis: XAU/USD and XAG/USD Surge Amid Geopolitical Tensions

Gold, Silver, Copper Analysis: XAU/USD and XAG/USD Surge Amid Geopolitical Tensions

Quick Fundamental Outlook

The discrepancies arose over an Israeli airstrike in Gaza: local authorities reported 500 hospital casualties, while Israel attributed it to a Palestinian attack, as per Reuters. These geopolitical tensions and positive economic data from China might influence precious metals.

China’s Q3 GDP surpassed forecasts, registering a 1.3% growth against the predicted 1.0%. The annual growth for the same period was 4.9%, beating the 4.4% estimate.

Trading Derivatives carries a high level of risk to your capital and you should only trade with money you can afford to lose. Trading Derivatives may not be suitable for all investors, so please ensure that you fully understand the risks involved, and seek independent advice if necessary. A Product Disclosure Statement (PDS) can be obtained either from this website or on request from our offices and should be considered before entering into a transaction with us. Raw Spread accounts offer spreads from 0.0 pips with a commission charge of USD $3.50 per 100k traded. Standard account offer spreads from 1 pips with no additional commission charges. Spreads on CFD indices start at 0.4 points. The information on this site is not directed at residents in any country or jurisdiction where such distribution or use would be contrary to local law or regulation.

China’s year-over-year retail sales also saw an increase of 5.5%, outdoing the previous 4.6% and anticipated 4.9%. This could have ripple effects on gold, silver, and copper prices.

Gold Prices Forecast


Gold (XAU/USD) has seen a positive trajectory today, with the price settling at a robust $1939.845, marking a commendable increase of +1.09% over the past 24 hours. Analyzing the 4-hour chart, the metal currently stands just above a pivotal point of $1932. Looking at resistance and support levels, the immediate resistance is pegged at $1950, followed by $1967 and $1984.

Conversely, gold finds its immediate support at $1909, with further cushions at $1886 and $1869. The technical indicators reveal noteworthy insights. With the Relative Strength Index (RSI) at 73, the metal is overbought, signalling strong bullish momentum.

Furthermore, the Moving Average Convergence Divergence (MACD) indicates a potential upward momentum as the MACD line is above the signal line. The price above its 50-day Exponential Moving Average (EMA) of $1895 further accentuates the short-term bullish sentiment.

From a chart pattern perspective, a bullish engulfing candle coupled with a breakout above the $1931 resistance suggests the possibility of more upward movement in the near future.

In conclusion, the overall trend for gold appears bullish above $1932.

Silver Prices Forecast


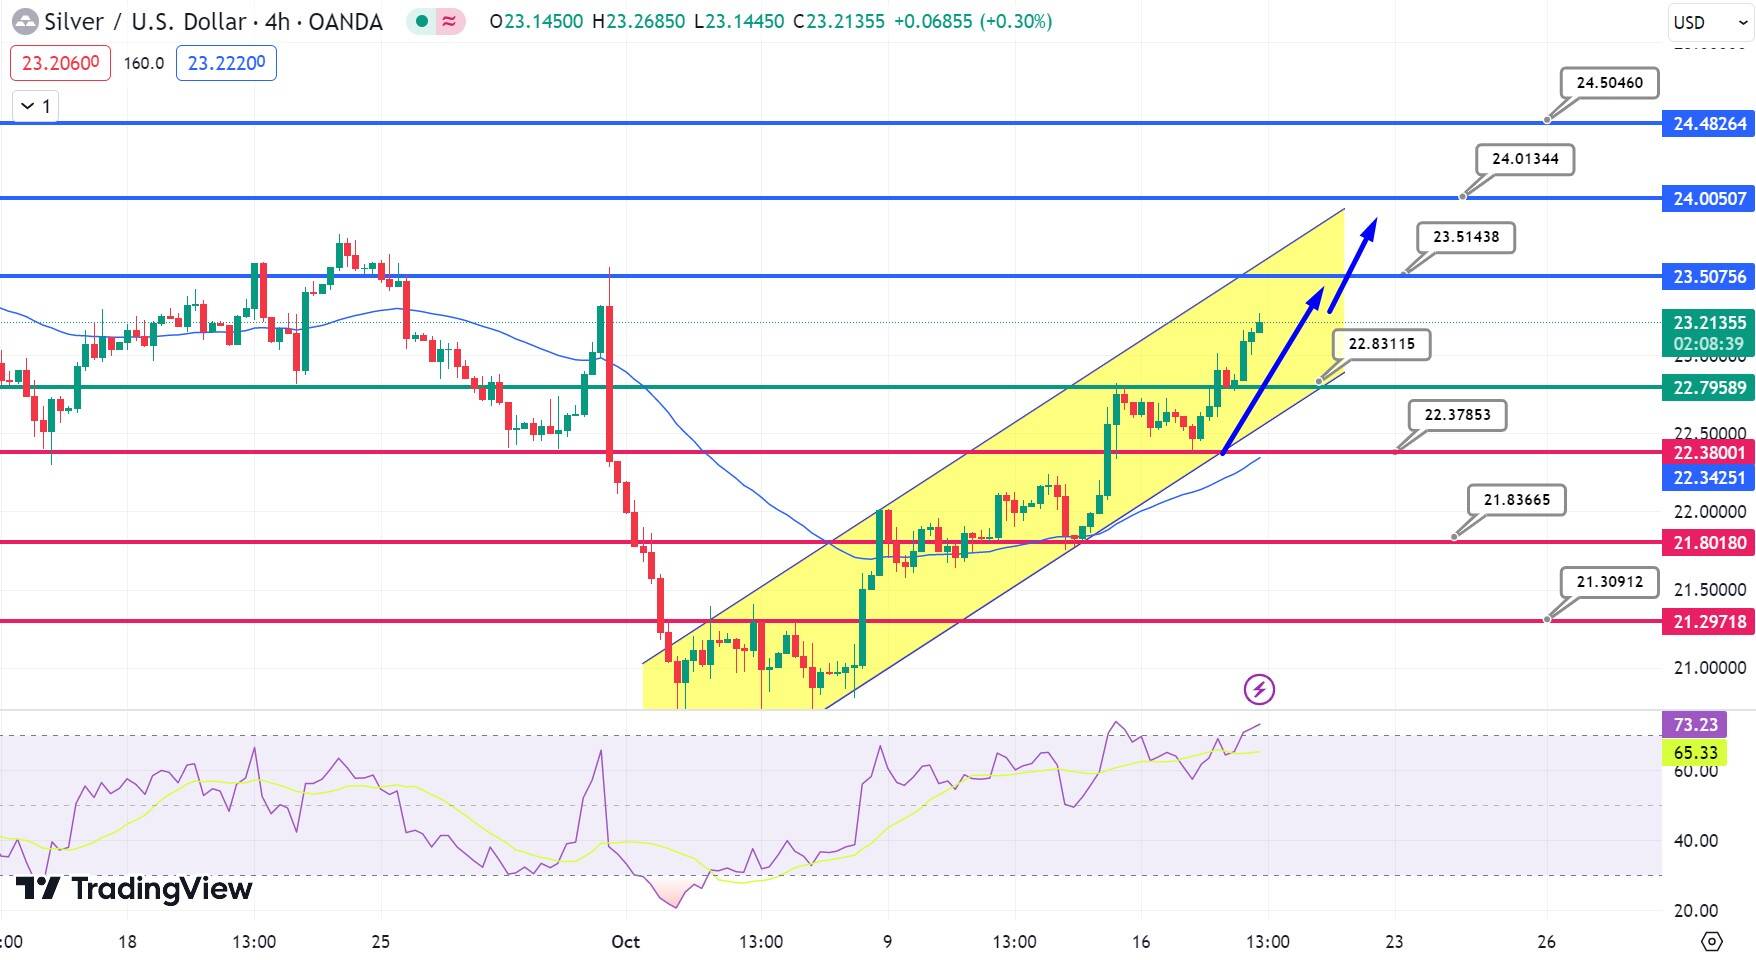
Silver (XAG/USD)‘s performance today displayed an upward momentum, with its value closing at $23.1764, representing a +1.78% increase over the past 24 hours. Analyzing its position on a 4-hour chart, silver is positioned just above the critical pivot point of $22.83.

When deciphering resistance and support metrics, the immediate resistance is noted at $23.51, with subsequent resistances at $24.01 and $24.50. Conversely, support levels are charted at $22.38, with subsequent support barriers at $21.84 and $21.31.

Diving into technical specifics, the Relative Strength Index (RSI) stands at 72, indicating that silver is in overbought conditions, reflecting an undercurrent of bullish sentiment. Its positioning above the 50-day Exponential Moving Average (EMA) of $22.34 reinforces this bullish inclination.

Chart patterns, notably the upward channel and the presence of the ‘Three White Soldiers’ candlestick formation, further affirm the bullish trajectory for silver, targeting the $23.50 mark. In conclusion, silver manifests a bullish trend beyond $22.85. The short-term forecast anticipates silver to challenge upper resistance levels soon.

Copper Prices Forecast

Copper Chart
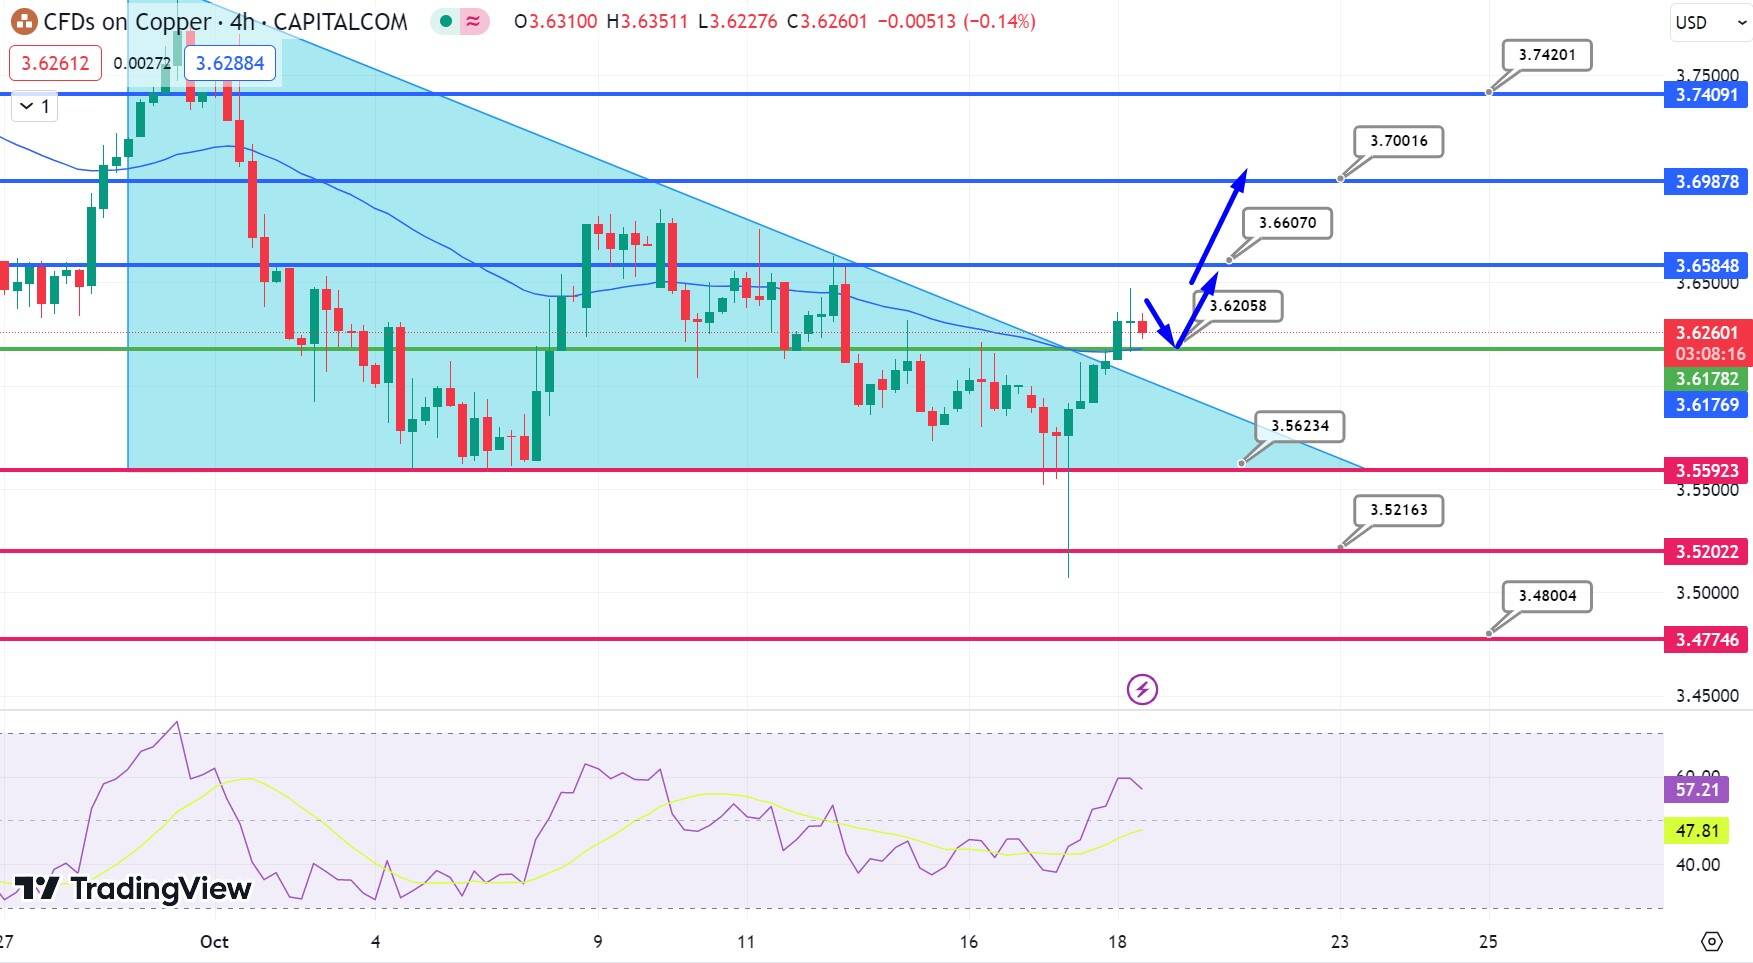
Copper ChartOn October 18th, Copper‘s trajectory presented an optimistic stance, closing at $3.64356, a modest rise of +0.44% within the 24-hour span. A glimpse into the 4-hour chart situates the metal just a notch above its pivot point of $3.62.

Mapping the resistance and support terrains, the metal encounters its first resistance at $3.66, followed closely by $3.70 and $3.74. On the defensive side, Copper finds sanctuary at $3.56, with subsequent fallbacks set at $3.52 and $3.48.

From a technical lens, Copper’s standing just above its 50-day Exponential Moving Average (EMA) of $3.62 hints at a short-term bullish trend. The chart elucidates a prominent descending triangle breakout around the $3.60 mark, which promotes a buying sentiment.

The consecutive candle closures outside this triangle coupled with the 50 EMA bullish crossover further endorses the bullish tilt. Summarily, Copper showcases a bullish demeanor past the $3.62 threshold.

Natural Gas Prices Forecast: Record U.S. Gas Output Challenging Market Sentiment

Natural Gas Prices Forecast: Record U.S. Gas Output Challenging Market Sentiment

Market Overview

U.S. natural gas futures are showing signs of life, inching up by 0.67% to $3.101 despite a five-day losing streak. The market’s positioning within yesterday’s trading range suggests impending volatility and possible sentiment transition from bearish to bullish. Speculation around short-covering driven by escalating tensions in the Middle East has given the market a slight boost. However, it’s worth noting that Israel is not a significant natural gas producer.

Weather and Demand

Cooler weather patterns are set to influence demand but only marginally. Temperatures in the Northeast are expected to drop this weekend, and again between October 29-31, causing a slight uptick in demand. However, forecasts show comfortable weather conditions persisting through much of the U.S., signaling light demand until the end of the month.

Trading Derivatives carries a high level of risk to your capital and you should only trade with money you can afford to lose. Trading Derivatives may not be suitable for all investors, so please ensure that you fully understand the risks involved, and seek independent advice if necessary. A Product Disclosure Statement (PDS) can be obtained either from this website or on request from our offices and should be considered before entering into a transaction with us. Raw Spread accounts offer spreads from 0.0 pips with a commission charge of USD $3.50 per 100k traded. Standard account offer spreads from 1 pips with no additional commission charges. Spreads on CFD indices start at 0.4 points. The information on this site is not directed at residents in any country or jurisdiction where such distribution or use would be contrary to local law or regulation.

Australian Strike Resolved

A breakthrough in wage negotiations between Chevron and Australian LNG unions has doused fears of disrupted supplies. Strikes planned at Chevron’s Gorgon and Wheatstone projects have been called off, eliminating risks that had previously escalated European spot prices. These facilities contribute to 6% of global LNG supplies, primarily servicing Asian markets.

Supply Indicators

On the supply front, the U.S. is hitting record highs with an average gas output of 103.5 billion cubic feet per day (bcfd) this October. Pipeline exports to Mexico have slightly decreased, but LNG exports are set to rise with the reopening of Cove Point export plant. U.S. gas supply dynamics indicate robust output, poised to meet global demands, especially as colder weather looms.

Short-Term Forecast

Given the surging U.S. natural gas output and the resumption of Australian LNG supplies, alongside modest seasonal demand, the short-term outlook for U.S. natural gas leans bearish. While geopolitical events and potential labor strikes could introduce some volatility, strong supply fundamentals currently tip the scales toward a downward price movement in the near term.

Technical Analysis

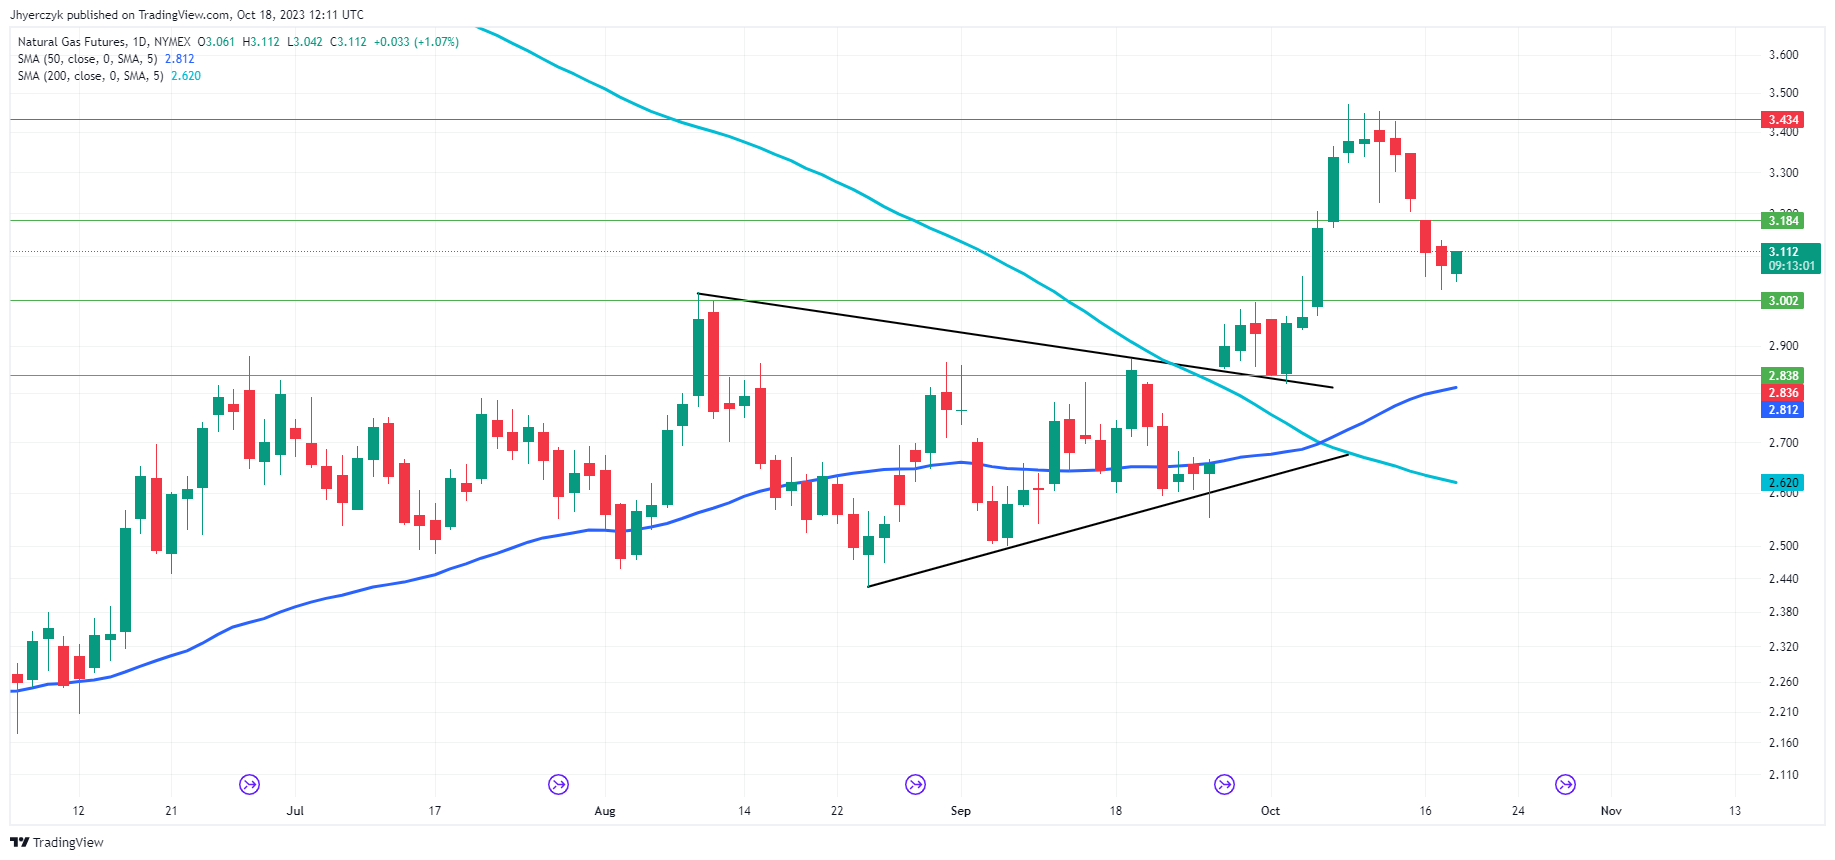
Daily Natural GasThe current daily price of natural gas at 3.106 sits above both the 200-day moving average of 2.620 and the 50-day moving average of 2.812, indicating bullish momentum. It also surpasses the minor support level at 3.002 and main support at 2.838, adding to the bullish sentiment.

While the minor resistance stands at 3.414, the asset would need to break through this level to confirm further upside potential.

In summary, strong technicals coupled with price levels above both short-term and long-term moving averages, as well as main and minor support levels, suggest a predominantly bullish market sentiment for natural gas. However, traders are still fishing for the level that is strong enough to support  a rally to new short-term highs.

Mixed US Housing Reports: Building Permits Decline, Housing Starts Rise

Mixed US Housing Reports: Building Permits Decline, Housing Starts Rise

U.S. Housing Market Shows Mixed Signals in September Data

The U.S. housing market in September displayed a blend of strengths and weaknesses across key metrics, according to recently released data. Building permits, a leading indicator for future construction, showed a seasonally adjusted annual rate of 1,473,000, a 4.4% decline from August and a 7.2% drop compared to last September. Meanwhile, single-family authorizations rose by 1.8% to reach 965,000, beating August’s revised figures.

The report on housing starts told a different story. The seasonally adjusted annual rate stood at 1,358,000, a 7% uptick from August, although it fell short of last September’s numbers by 7.2%. Single-family starts showed moderate growth at 963,000, marking a 3.2% increase from August’s revised rate. This could signal resilience in single-family construction despite broader headwinds.

Trading Derivatives carries a high level of risk to your capital and you should only trade with money you can afford to lose. Trading Derivatives may not be suitable for all investors, so please ensure that you fully understand the risks involved, and seek independent advice if necessary. A Product Disclosure Statement (PDS) can be obtained either from this website or on request from our offices and should be considered before entering into a transaction with us. Raw Spread accounts offer spreads from 0.0 pips with a commission charge of USD $3.50 per 100k traded. Standard account offer spreads from 1 pips with no additional commission charges. Spreads on CFD indices start at 0.4 points. The information on this site is not directed at residents in any country or jurisdiction where such distribution or use would be contrary to local law or regulation.

Housing completions also made headway, registering at a seasonally adjusted annual rate of 1,453,000. This represents a 6.6% increase from August and even managed to edge 1% above the rate in September 2022. Specifically, single-family completions rose by 5.3% to 998,000 from the previous month, underlining a similar trend of strength in the single-family sector.

However, units in buildings with five or more were generally subdued. Authorizations were at a rate of 459,000, and completions were at 445,000, pointing towards a softer multi-family construction market.

In summary, the U.S. housing market in September demonstrated a mixed landscape. While single-family metrics showed moderate gains, the broader market remains cautious due to declining building permits and lukewarm multi-family unit figures. The short-term outlook for the housing market appears uncertain, with both bullish and bearish factors at play.

Oil Prices Forecast: Middle East Unrest, US-China Demand Fuel Oil Price Surge

Oil Prices Forecast: Middle East Unrest, US-China Demand Fuel Oil Price Surge

Middle East Tensions Fuel Oil Price Surge

Oil markets were on edge this week as geopolitical tensions escalated in the Middle East, specifically between Israel and Hamas. Brent crude and WTI oil futures saw significant gains, with Brent trading at $91.66 and WTI at $88.61. The violence in Gaza, which claimed about 500 lives, led to a ripple effect, elevating concerns of a broader conflict that could disrupt oil supply from the region.

Biden’s Middle East Visit and Diplomacy

U.S. President Joe Biden’s impending visit to Israel aims to display support for the country amid its ongoing conflict with Hamas. The cancelled summit between Biden and Arab leaders, initially aimed at seeking a diplomatic resolution to the Israel-Hamas issue, makes Biden’s trip crucial in terms of U.S. involvement in the region.

Trading Derivatives carries a high level of risk to your capital and you should only trade with money you can afford to lose. Trading Derivatives may not be suitable for all investors, so please ensure that you fully understand the risks involved, and seek independent advice if necessary. A Product Disclosure Statement (PDS) can be obtained either from this website or on request from our offices and should be considered before entering into a transaction with us. Raw Spread accounts offer spreads from 0.0 pips with a commission charge of USD $3.50 per 100k traded. Standard account offer spreads from 1 pips with no additional commission charges. Spreads on CFD indices start at 0.4 points. The information on this site is not directed at residents in any country or jurisdiction where such distribution or use would be contrary to local law or regulation.

U.S. Supply and Demand Signals

Domestic factors are also influencing oil prices. The American Petroleum Institute (API) reported a significant drawdown of 4.4 million barrels in U.S. crude stocks for the week ending Oct. 13, exceeding analysts’ expectations. The official data from the Energy Information Administration (EIA) is anticipated to shed more light on U.S. oil inventories.

China’s Economic Outlook

China’s Q3 economic growth outperformed expectations, positively impacting oil demand. The country’s oil refinery throughput in September set a record, up 12% from the prior year. While the real estate sector could be a drag, China’s economic recovery is gaining momentum, potentially sustaining global oil demand.

Short-Term Forecast

The market presents a bullish outlook for oil prices in the short term. Factors like Middle East tensions and strong demand from the U.S. and China are likely to keep prices elevated. However, potential interest rate hikes by the Federal Reserve could apply brakes on economic growth, thereby affecting oil demand.

This week’s events paint a complex portrait of the oil markets, balancing geopolitical unrest with significant economic indicators. With such multifaceted influences at play, traders should exercise caution.

Technical Analysis

Light Crude Oil Futures
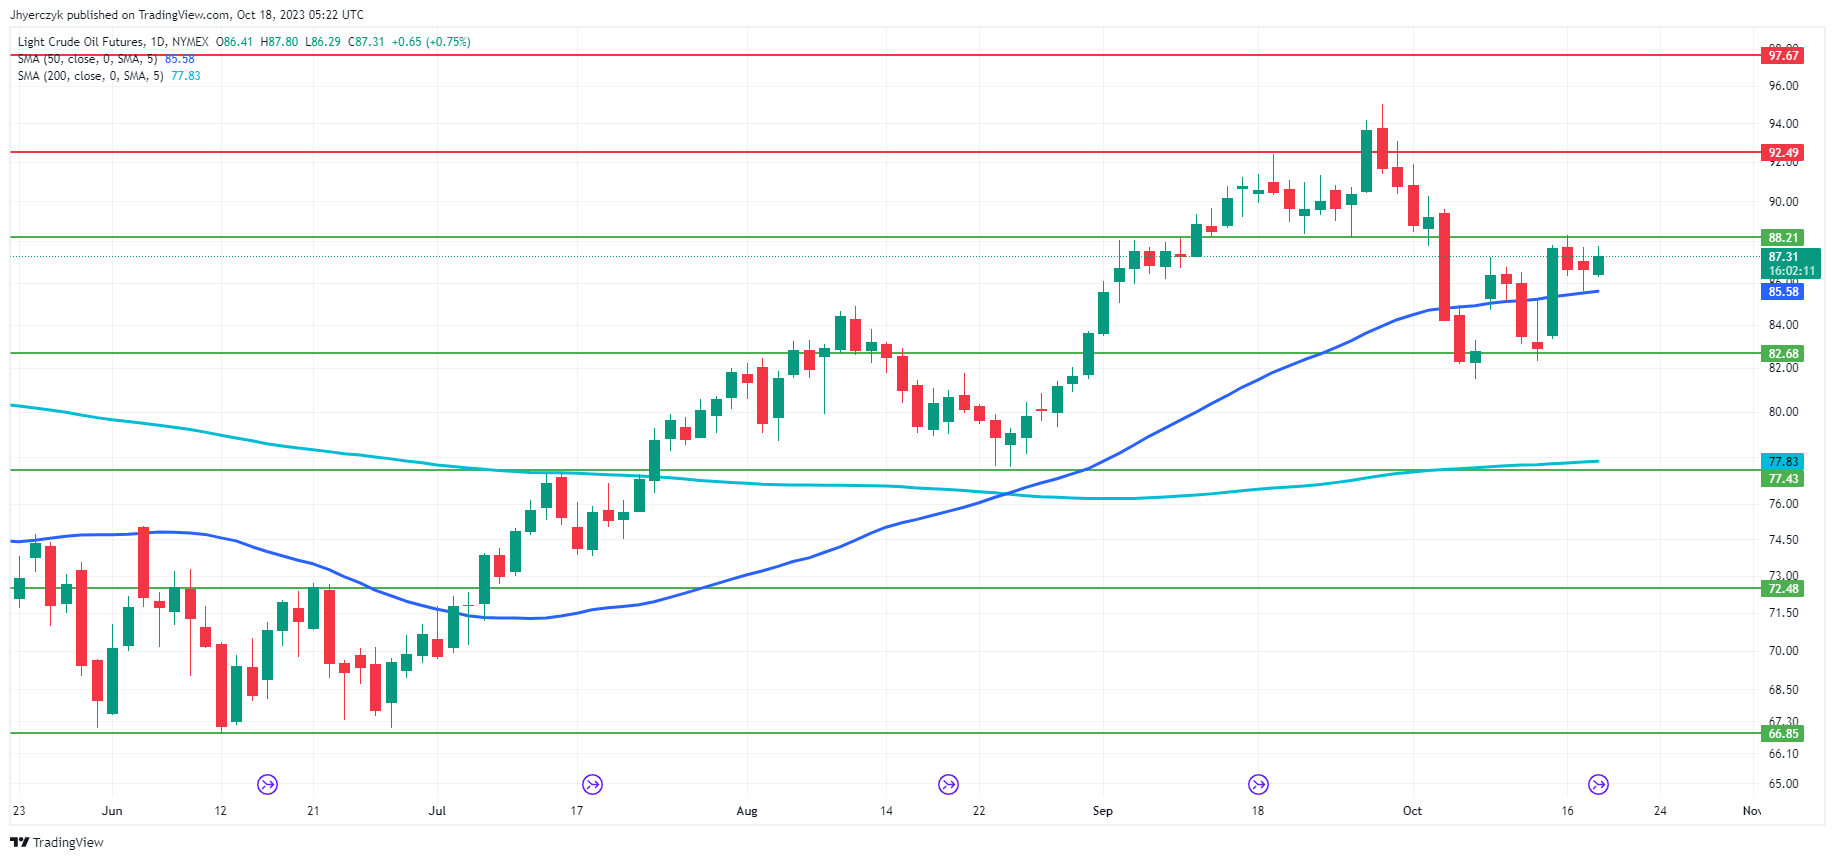
Daily Light Crude Oil FuturesThe current daily price of light crude oil futures is $87.23, positioned above both the 50-day moving average of $85.58 and the 200-day moving average of $77.83, signaling a bullish trend.

While minor and main support levels sit at $82.68 and $77.43 respectively, the asset remains well above these markers, providing a cushion against downside risks. Conversely, the immediate upside targets are the minor and main resistance levels at $92.49 and $97.67, which may serve as potential barriers.

Given these parameters, the market sentiment tilts bullish. Traders should keep an eye on the resistance levels for profit-taking opportunities or trend reversals.

DAX Index: China’s Impact, Middle East Concerns, and Corporate Earnings in Focus

DAX Index: China’s Impact, Middle East Concerns, and Corporate Earnings in Focus

DAX Tuesday Overview

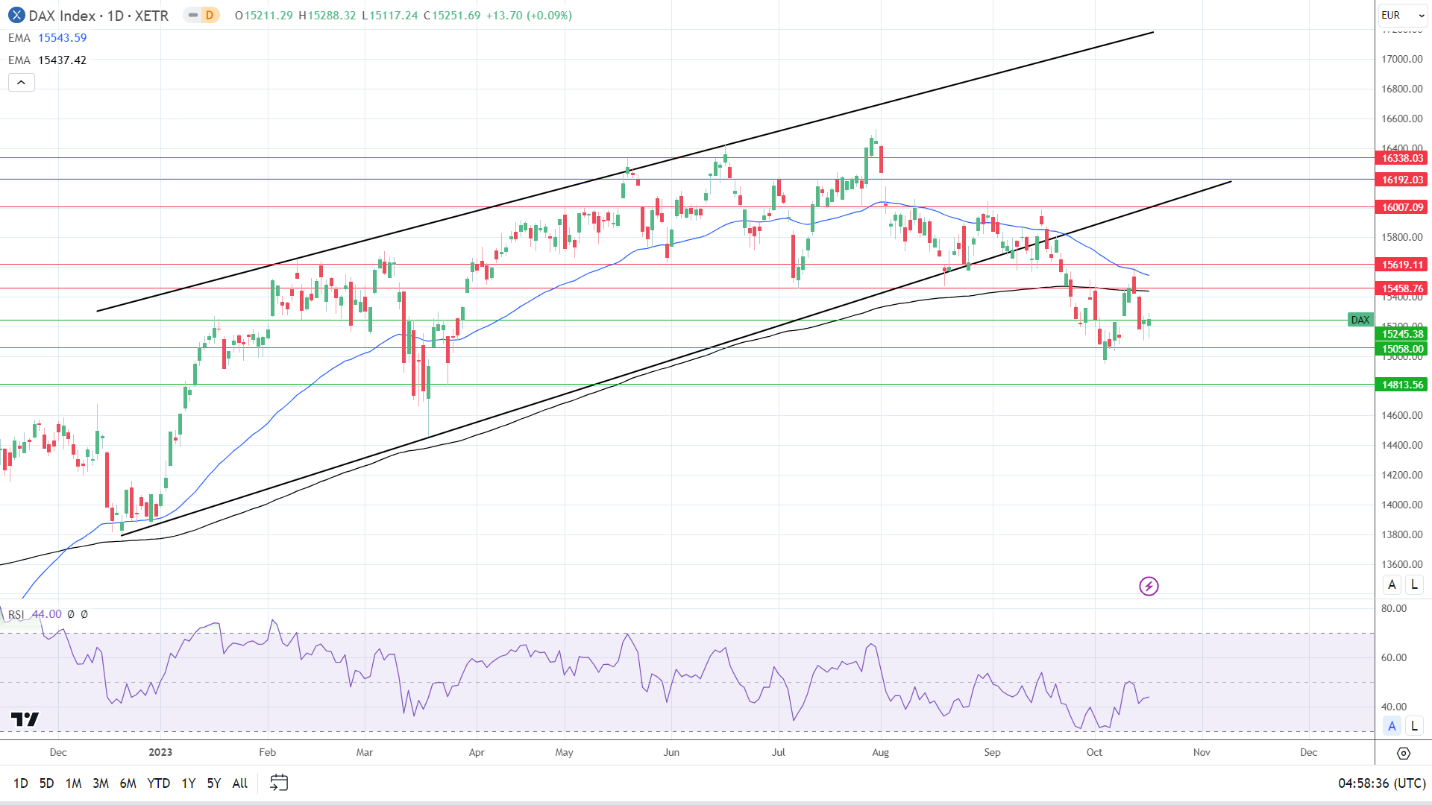
On Tuesday, the DAX rose by 0.09%. Following a 0.34% gain on Monday, the DAX ended the day at 15,252.

US Retail Sales and Earnings Delivered a Choppy End to Tuesday

German and Eurozone ZEW Economic Sentiment figures surprised the markets on Tuesday. Sentiment toward the German and Eurozone economies improved markedly in October. The German ZEW Economic Sentiment Index increased from -11.4 to -1.1.

Trading Derivatives carries a high level of risk to your capital and you should only trade with money you can afford to lose. Trading Derivatives may not be suitable for all investors, so please ensure that you fully understand the risks involved, and seek independent advice if necessary. A Product Disclosure Statement (PDS) can be obtained either from this website or on request from our offices and should be considered before entering into a transaction with us. Raw Spread accounts offer spreads from 0.0 pips with a commission charge of USD $3.50 per 100k traded. Standard account offer spreads from 1 pips with no additional commission charges. Spreads on CFD indices start at 0.4 points. The information on this site is not directed at residents in any country or jurisdiction where such distribution or use would be contrary to local law or regulation.


The latest figures suggest a possible shift in economic fortunes for Germany and the euro area. However, corporate earnings overshadowed hopes of containing the Middle East conflict and the sentiment numbers.

Later in the day, hotter-than-expected US retail sales figures dragged the DAX deeper into negative territory before a late recovery. The September figures raised the chances of a Fed rate hike, weighing on riskier assets. Solid US earnings supported the late rebound, with Goldman Sachs (GS) and Bank of America (BAC) beating forecasts.

US equities had a mixed Tuesday session. The Dow gained 0.04%, while the S&P 500 and NASDAQ Composite Index fell by 0.01% and 0.25%.

The Tuesday Market Movers

Bank stocks ended the Tuesday session in negative territory. Commerzbank and Deutsche Bank saw losses of 0.71% and 0.59%, respectively. Investors likely took profits after the Monday breakout.

Sartorius AG continued to face the wrath of investors, falling 2.37%. On Friday, Sartorius AG tumbled by 13.28% as investors responded to the downward revision to its full-year forecast.

However, Airbus Group rallied 3.55% as investors responded to new Buy ratings. On Tuesday, Jefferies upgraded the stock from Hold to Buy.

The Wednesday Session: China and the Middle East in Focus

Economic indicators from China showed a pickup in economic activity in the third quarter. The better-than-expected economic indicators suggested stimulus measures from Beijing are being effective.

However, market jitters about the Middle East conflict and sentiment toward Fed interest rate goals will test the buyer appetite for DAX-listed stocks. Updates from the Middle East will influence market risk appetite. US President Biden is in the region.

Finalized Eurozone inflation figures need consideration. An upward revision to prelim inflation figures may pressure the DAX on more hawkish ECB policy bets.

With inflation in the spotlight, ECB President Christine Lagarde is on the ECB calendar to speak. A hawkish reaction to the inflation figures could spook investors.

Away from the economic calendar, corporate earnings will move the dial.

The US Housing Sector and the Fed in Focus

Later today, housing sector data is unlikely to influence the DAX. However, Fed commentary will draw investor interest. Hawkish commentary following the US retail sales report would impact the buyer appetite for riskier assets.

Corporate earnings also need consideration. Morgan Stanley (MS), Tesla (TSLA), and Netflix (NFLX) are among the big names to release earnings results on Wednesday.

The futures markets point to a mixed Wednesday session. The DAX was up 17 points, while the NASDAQ mini was down 21 points.

Short-Term Forecast

Near-term trends hinge on news updates on the Middle East conflict, central bank commentary, and corporate earnings. An escalation in the Middle East conflict may overshadow upbeat earnings and impact the appetite for riskier assets.

DAX Technical Indicators

Daily Chart

The DAX sat below the 50-day and 200-day EMAs, affirming bearish price signals.

A break below the 15,245 support level would bring the 15,058 support level into play. An escalation in the Middle East conflict and hawkish Fed commentary would impact risk sentiment.

However, dovish central bank commentary and a de-escalation in the Middle East would support a move to the 200-day EMA and 15,459 resistance level. Selling pressure will likely intensify at 200-day EMA. The 200-day EMA is confluent with the 15,459 resistance level.

The 14-day RSI reading of 44.00 supports a DAX fall through the 15,245 support level and a move to the 15.058 support level before entering oversold territory.

DAX Daily Chart sends bearish price signals.

DAX 181023 Daily Chart

4-Hourly Chart

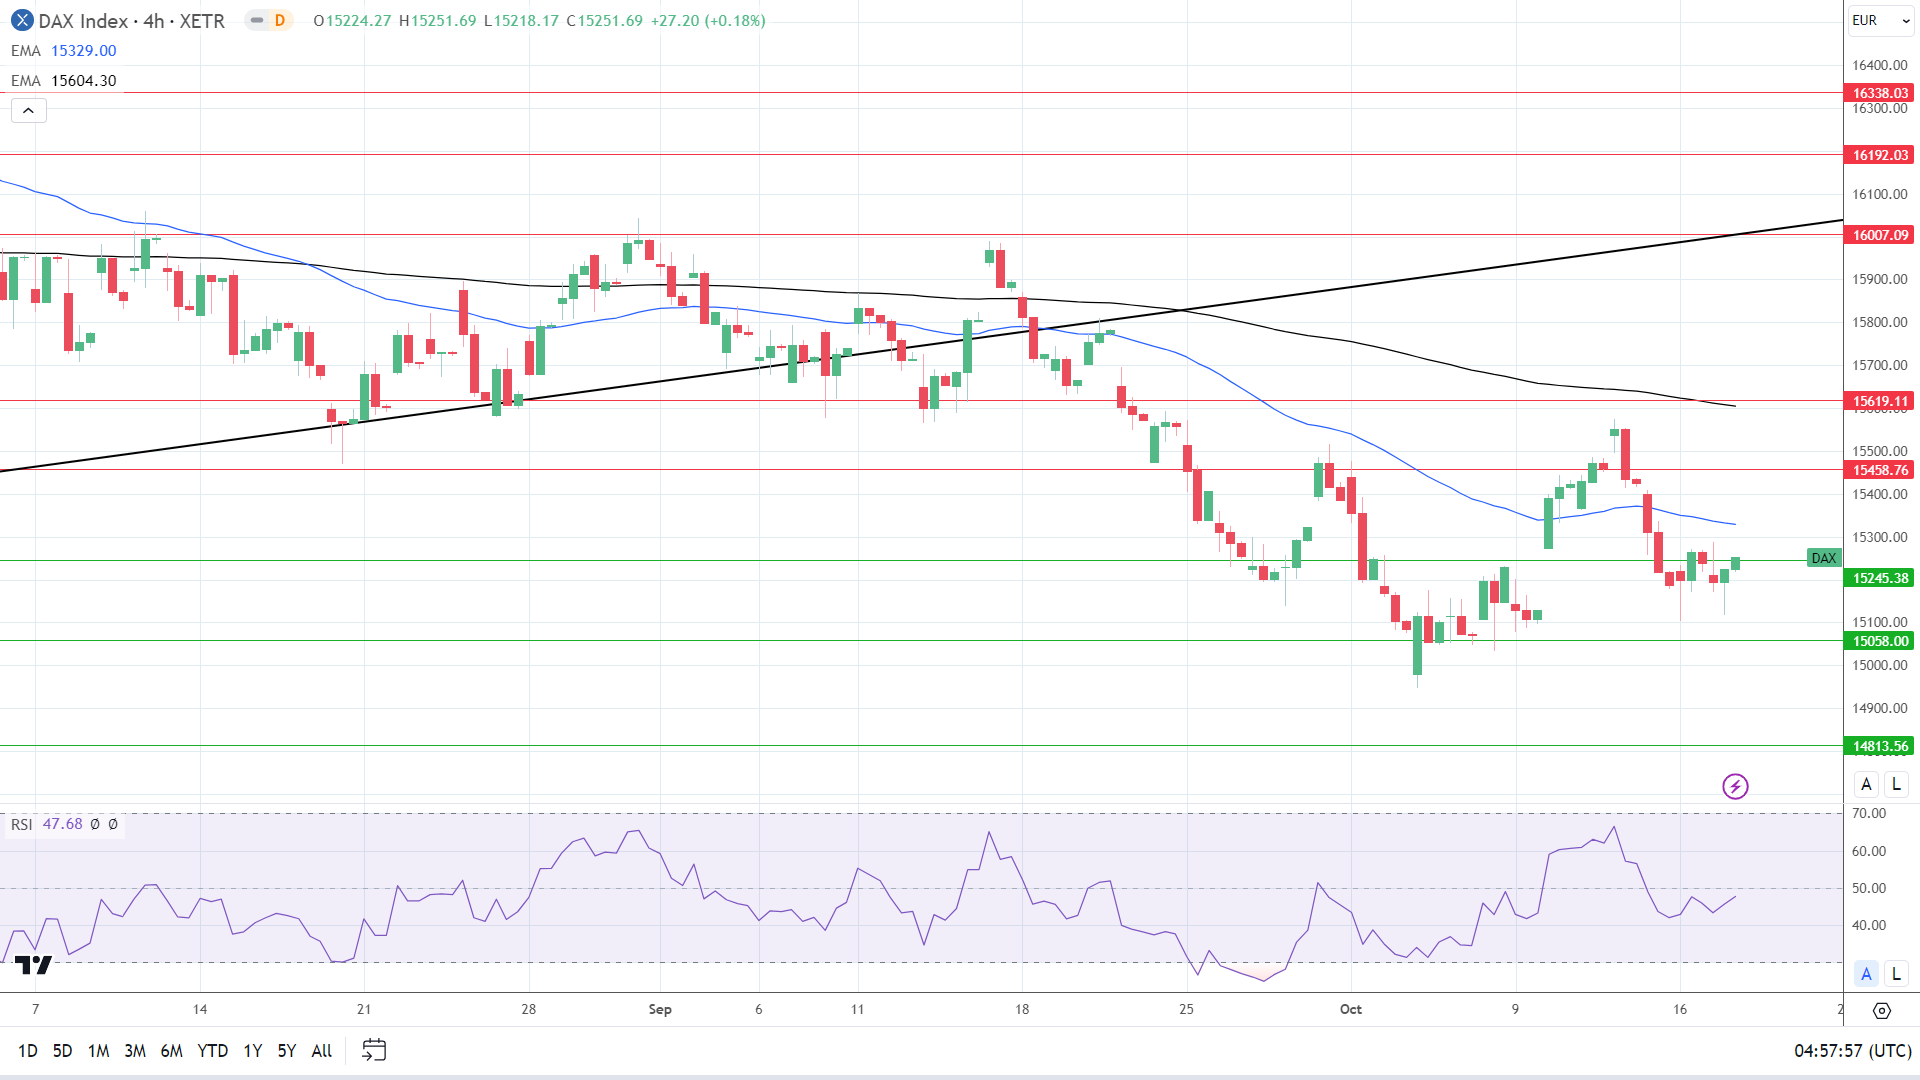
The DAX hovers below the 50-day and 200-day EMAs, reaffirming bearish price signals. A DAX break above the 50-day EMA would support a move toward the 15,459 resistance level.

However, a fall through the 15,245 support level would bring the 15,058 support level into play.

The 47.68 14-4 hour RSI reading suggests a DAX break below the 15,245 support level and a move toward the 15,058 support level before entering oversold territory.

4-Hourly Chart reaffirms bearish price signals.
DAX 181023 4-Hourly Chart
EUR/USD Forecast: Eurozone Inflation, the ECB, and the Middle East in Focus

EUR/USD Forecast: Eurozone Inflation, the ECB, and the Middle East in Focus

Tuesday Overview

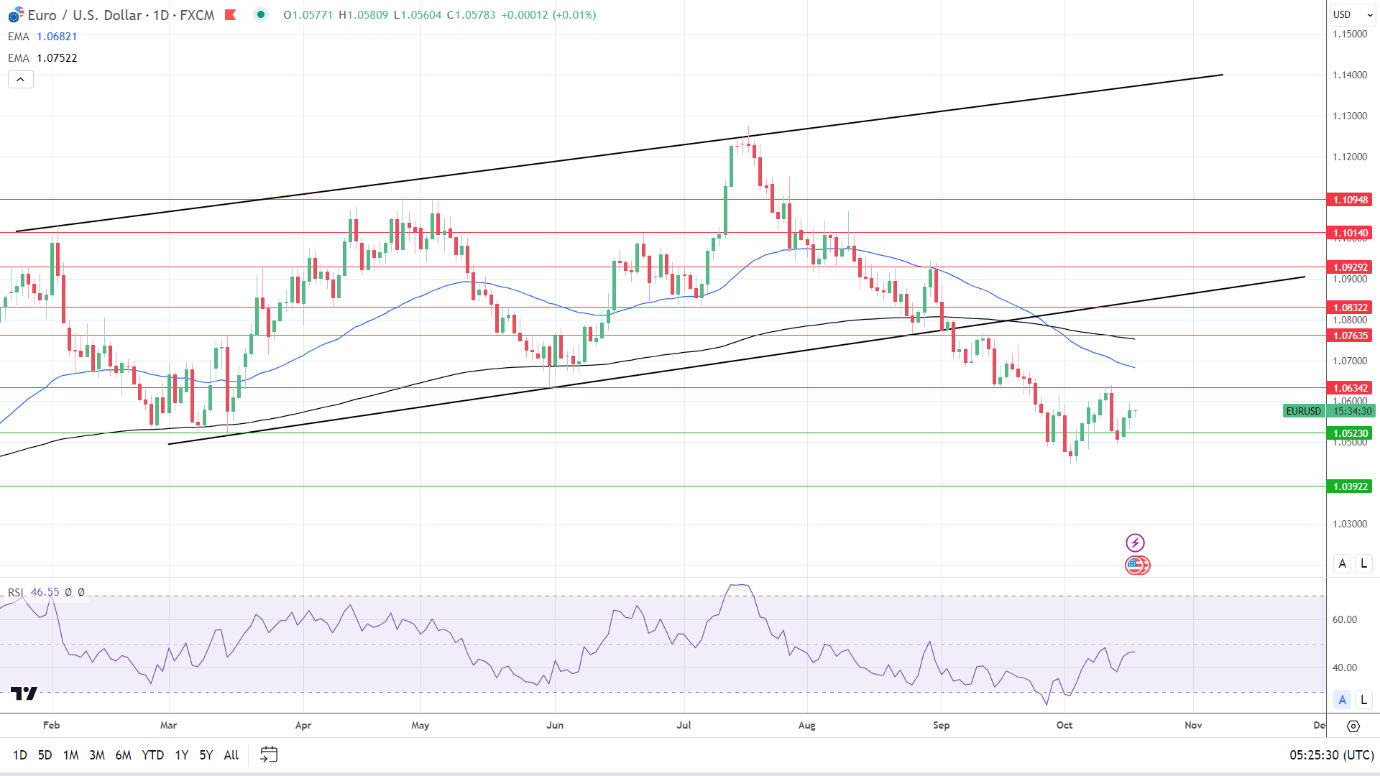
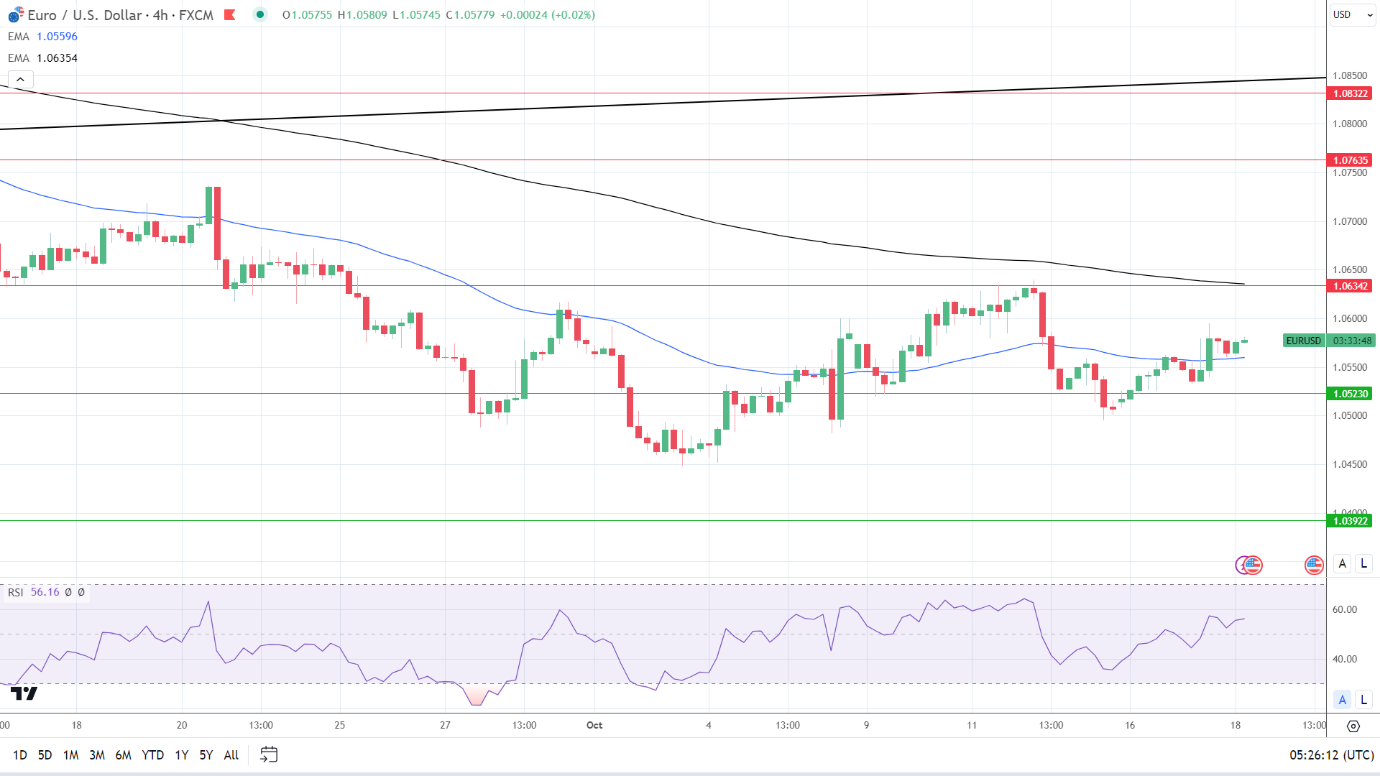
On Tuesday, the EUR/USD rose by 0.16%. Following a 0.51% gain on Monday, the EUR/USD ended the day at $1.05771. The EUR/USD fell to a low of $1.05328 before rising to a high of $1.05948.

Eurozone Inflation and the ECB in the Spotlight

Finalized Eurozone inflation figures for September will garner investor interest on Wednesday. The ECB remains mindful of elevated inflation and the adverse effects on the Eurozone economy.

Trading Derivatives carries a high level of risk to your capital and you should only trade with money you can afford to lose. Trading Derivatives may not be suitable for all investors, so please ensure that you fully understand the risks involved, and seek independent advice if necessary. A Product Disclosure Statement (PDS) can be obtained either from this website or on request from our offices and should be considered before entering into a transaction with us. Raw Spread accounts offer spreads from 0.0 pips with a commission charge of USD $3.50 per 100k traded. Standard account offer spreads from 1 pips with no additional commission charges. Spreads on CFD indices start at 0.4 points. The information on this site is not directed at residents in any country or jurisdiction where such distribution or use would be contrary to local law or regulation.

Upward revisions to prelim figures would test the market bets on the ECB hitting the brakes on interest rate hikes. The annual core inflation rate softened from 5.3% to 4.5% in September, according to prelim numbers.

With inflation in the spotlight, ECB commentary also needs consideration. ECB President Christine Lagarde is on the calendar to speak. References to the inflation numbers and monetary policy will influence the appetite for the EUR.

Beyond the economic calendar, investors must monitor news updates from the Middle East throughout the day. The Joe Biden visit will be a focal point.

Fed Speeches, the Middle East, and President Joe Biden in Focus

Later today, the US housing sector will be in focus. A slump in housing sector numbers may raise concerns about the US macroeconomic environment. The housing sector is a litmus test for the US economy. Deteriorating housing market conditions would impact on consumer confidence and consumer spending.

While the US housing sector contributes less than 20% to the US economy, US private consumption contributes over 65% to the US economy. A slump in the housing market would indirectly impact the US economy.

With the housing sector in the spotlight, FOMC member speeches warrant consideration. FOMC Members John Williams, Christopher Waller, Michelle Bowman, and Patrick Harker are on the calendar to speak. Reaction to the US retail sales figures and views on interest rate hikes will influence the buying appetite for the US dollar.

Beyond the economic calendar, the Middle East conflict and Joe Biden visit will need monitoring. Crude oil prices will reflect market views on the Biden visit and any threat of an escalation involving other Middle Eastern nations.

Short-Term Forecast:

Despite recent gains, the EUR/USD remains at risk of a reversal. The US macroeconomic environment remains robust, supporting a more hawkish Fed policy outlook. News updates from the Middle East will also influence near-term trends.

EUR/USD Price Action

Daily Chart

The EUR/USD sat below the 50-day and 200-day EMAs, affirming bearish price signals.

A EUR/USD fall through the $1.05230 support level would give the bears a run at $1.0450 and the $1.03922 support level. Hawkish Fed comments and an escalation in the Middle East would affect the appetite for the EUR/USD.

On the other hand, easing geopolitical tensions and hotter-than-expected Eurozone inflation numbers would support a run at the $1.06342 resistance level.

The 14-period Daily RSI, 46.55, supports a EUR/USD fall through the $1.05230 support level before entering oversold territory.

EUR/USD Daily Chart sends bearish price signals,

EURUSD 181023 Daily Chart

4-Hour Chart

The EUR/USD holds above the 50-day EMA while hovering below the 200-day EMA, sending bullish near-term but bearish longer-term price signals. A EUR/USD return to $1.06 would give the bulls a run at the $1.06342 resistance level and 200-day EMA.

Selling pressure will likely intensify at the $1.06342 resistance level. The 200-day EMA is confluent with the resistance level,

However, a break below the 50-day EMA would support a move to the $1.05230 support level.

The 14-period RSI on the 4-hour chart, 56.16, suggests a EUR/USD move to the $1.06342 resistance level and 200-day EMA before entering overbought territory.

4-Hourly Chart sends bullish near-term price signals.
EURUSD 181023 4 Hourly Chart
Silver Prices Forecast: XAG/USD Higher as Powell’s Speech Looms, Middle East Unrest Persists

Silver Prices Forecast: XAG/USD Higher as Powell’s Speech Looms, Middle East Unrest Persists

Safe-Haven Silver Rides Geopolitical Tensions to Two-Week High

Silver prices (XAG/USD) surged to a two-week peak, driven largely by rising geopolitical tensions in the Middle East. This run contradicts the robust U.S. economic data that typically propels investors toward higher-yielding options. As it stands, silver, alongside gold, remains the preferred safe-haven asset as conflicts continue to escalate.

Upcoming Powell Speech: A Critical Event

Fed Chair Jerome Powell’s imminent speech is generating considerable attention among silver traders. Recent U.S. retail sales figures came in surprisingly strong, lifting Treasury yields and generally exerting pressure on non-yielding assets like silver. However, the persisting geopolitical concerns seem to be counterbalancing the impact of higher interest rates, as traders stay committed to safe havens.

Trading Derivatives carries a high level of risk to your capital and you should only trade with money you can afford to lose. Trading Derivatives may not be suitable for all investors, so please ensure that you fully understand the risks involved, and seek independent advice if necessary. A Product Disclosure Statement (PDS) can be obtained either from this website or on request from our offices and should be considered before entering into a transaction with us. Raw Spread accounts offer spreads from 0.0 pips with a commission charge of USD $3.50 per 100k traded. Standard account offer spreads from 1 pips with no additional commission charges. Spreads on CFD indices start at 0.4 points. The information on this site is not directed at residents in any country or jurisdiction where such distribution or use would be contrary to local law or regulation.

China’s Robust Economy Adds Fuel to the Fire

Another contributing factor to silver’s rise is China’s stronger-than-expected economic data for the third quarter. As one of the largest consumers of silver, positive economic performance from China is being interpreted as a signal for sustained demand, providing additional support for the metal’s current upward momentum.

Overall Bullish Sentiment, But Powell’s Speech a Wildcard

In sum, market sentiment for silver is veering on the bullish side. The momentum is being fueled by ongoing geopolitical uncertainties and promising economic figures out of China. Nonetheless, the future landscape may shift dramatically depending on what Fed Chair Jerome Powell has to say about U.S. monetary policy. His comments are widely seen as the next potential turning point for silver markets.

Technical Analysis

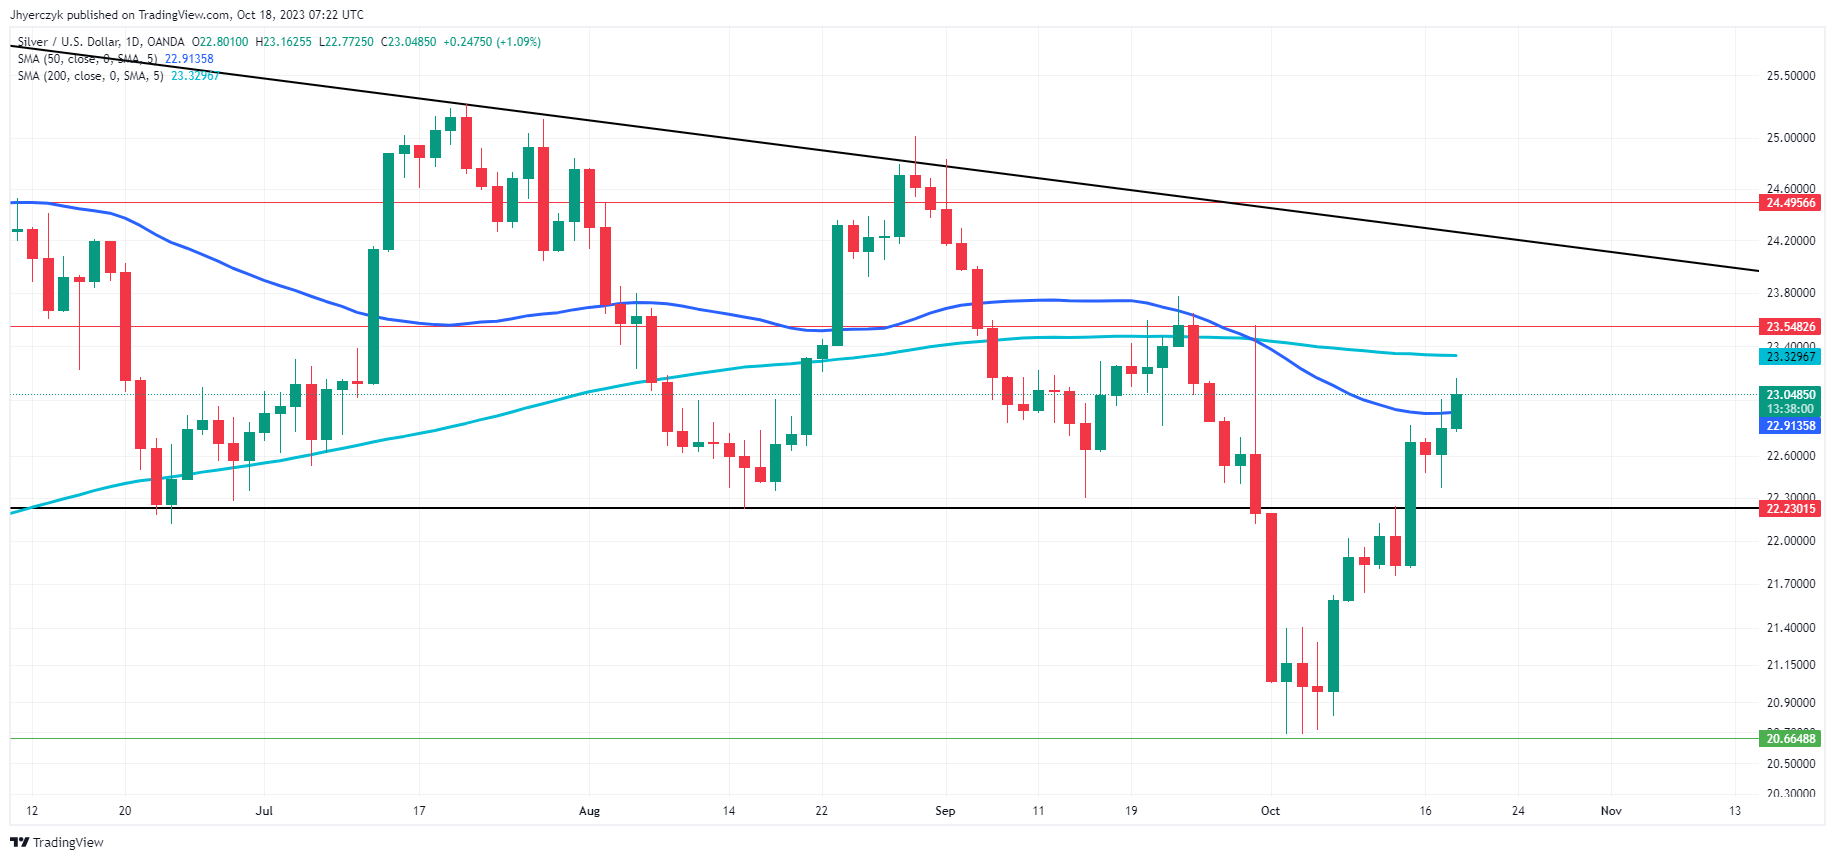
Daily Silver (XAG/USD)The current daily price of Silver (XAG/USD) at $23.02 is slightly below the 200-day moving average of $23.33 but above the 50-day moving average of $22.91. This mixed signal suggests traders are uncertain, albeit with a bullish lean given its position above the 50-day line.

The asset is also trading above its previous close of $22.80 and near minor resistance at $23.55. The trend line resistance at $24.25 serves as the next critical hurdle. A breach above this could instigate more bullish activity, while falling below the trend line support at $22.21 may shift sentiment to bearish. Overall, the market sentiment appears cautiously bullish.

Gold Prices Forecast: XAU/USD Prices Soar Amid Middle East Tensions, Fed Speculation

Gold Prices Forecast: XAU/USD Prices Soar Amid Middle East Tensions, Fed Speculation

Middle East Tensions Fuel Gold Rally

The escalating conflict in the Middle East has significantly bolstered gold prices (XAU/USD). A devastating event in Gaza has intensified fears of a wider regional conflict, driving investors towards the safe-haven asset.

Gold’s newfound buoyancy is further underpinned by its surpassing of key technical resistance levels, making it an appealing choice for those seeking a geopolitical risk premi

Trading Derivatives carries a high level of risk to your capital and you should only trade with money you can afford to lose. Trading Derivatives may not be suitable for all investors, so please ensure that you fully understand the risks involved, and seek independent advice if necessary. A Product Disclosure Statement (PDS) can be obtained either from this website or on request from our offices and should be considered before entering into a transaction with us. Raw Spread accounts offer spreads from 0.0 pips with a commission charge of USD $3.50 per 100k traded. Standard account offer spreads from 1 pips with no additional commission charges. Spreads on CFD indices start at 0.4 points. The information on this site is not directed at residents in any country or jurisdiction where such distribution or use would be contrary to local law or regulation.

Fed’s Upcoming Actions on Radar

Despite robust U.S. economic data suggesting higher interest rates for an extended period, gold’s upward trajectory persists. Investors are closely monitoring Federal Reserve Chair Jerome Powell’s upcoming speech for cues on interest rate policies.

The Fed’s strategy has been a crucial determinant for non-yielding gold, but the market seems to be tentatively shrugging off the higher-for-longer rates narrative. Speculation is rife that Powell might reveal insights that could affect this perspective, impacting gold prices in the process.

China’s Economic Momentum Lends Support

China, being a top consumer of gold, plays an integral role in shaping the asset’s price dynamics. Recent data showed China’s economy growing at a rate faster than expected in the third quarter. This positive economic backdrop in China lends additional support to gold, especially when balanced against the current geopolitical uncertainties.

President Biden’s Imminent Israel Visit

Adding another layer of complexity to the gold market is President Joe Biden’s forthcoming visit to Israel. As the humanitarian crisis in Gaza intensifies, Biden’s diplomatic venture could be a key catalyst for the gold market. The visit coincides with increasing tensions and could significantly influence investor sentiment, depending on its outcome.

Bullish Outlook in the Short Term

Taking into account the multiple vectors of influence—geopolitical tensions, upcoming Federal Reserve announcements, and macroeconomic factors—the market sentiment for gold is tipping towards the bullish side.

Although the $1,953 level represents a significant resistance point, the array of impactful events on the horizon suggests that gold is poised for more upside action. Investors would do well to keep an eye on these evolving narratives as they consider their next moves in the gold market.

Technical Analysis

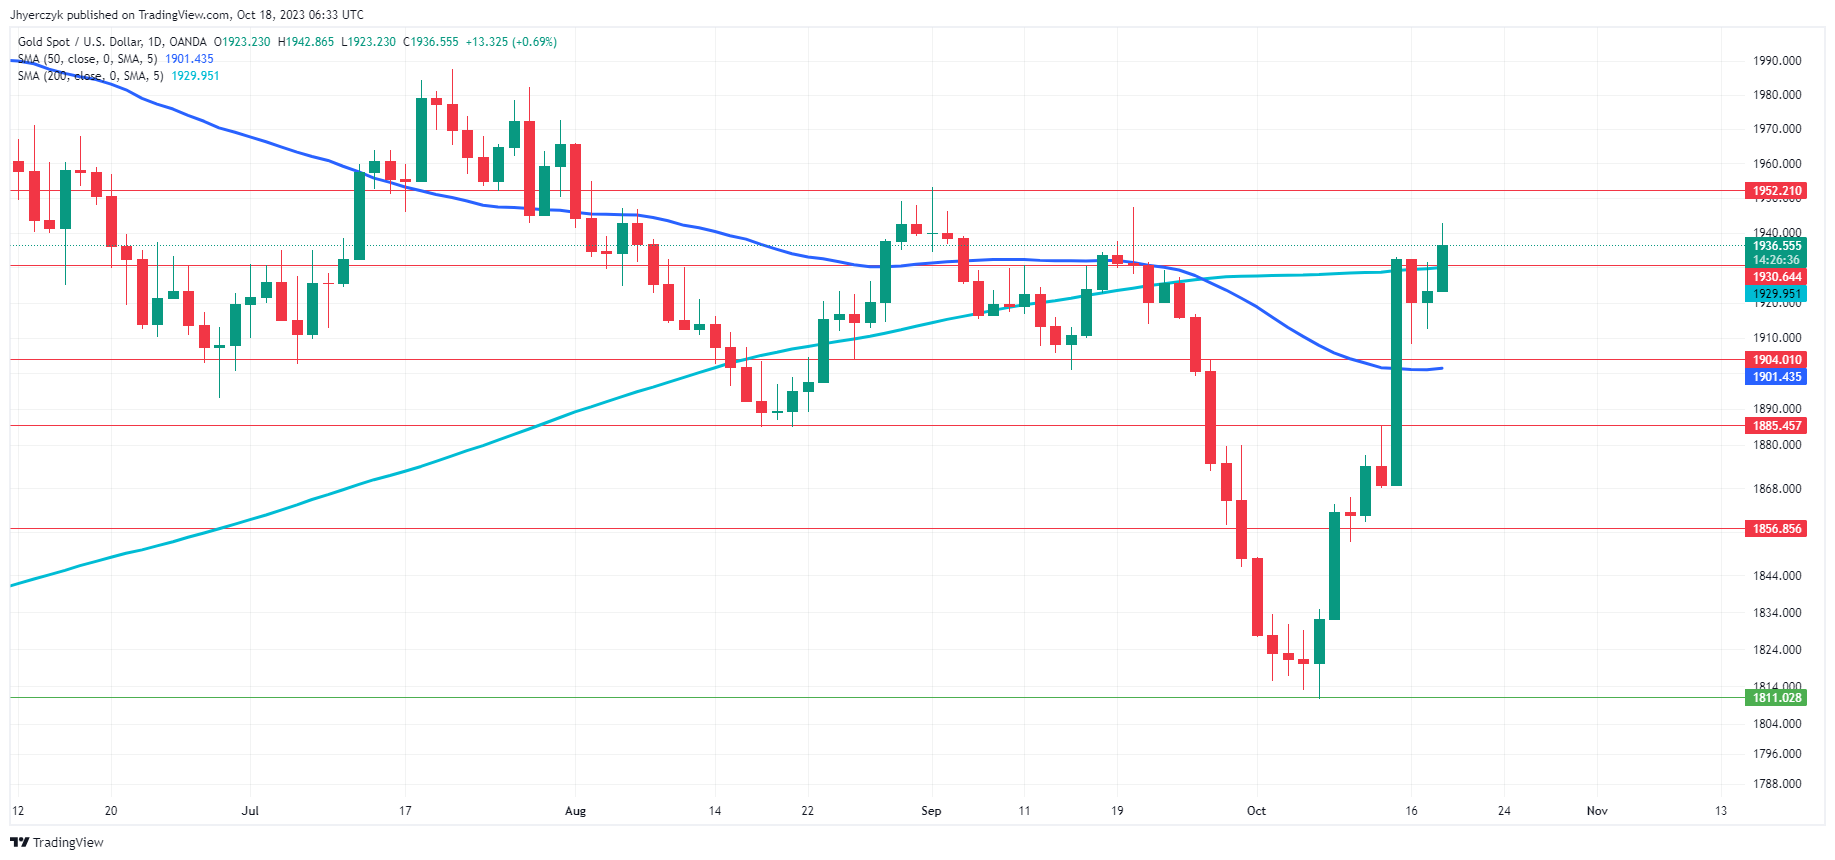
Daily Gold (XAU/USD)The current daily price of gold (XAU/USD) at 1936.39 has crossed both the 200-day and 50-day moving averages, which stand at 1929.95 and 1901.45 respectively, signaling bullish momentum.

This surge also took out the minor resistance level of 1930.64, eyeing the main resistance at 1952.21. The uptick from the previous daily close at 1923.23 further solidifies the bullish sentiment.

The strong showing in relation to multiple technical indicators suggests bullish market sentiment for gold in the short term. However, a failure to sustain a rally over 1929.95 could signal an imminent correction

Hang Seng Index, ASX 200, Nikkei 225 Index: China Economy in the Spotlight

Hang Seng Index, ASX 200, Nikkei 225 Index: China Economy in the Spotlight

Overview of the Tuesday Session

On Tuesday, the Nikkei was in recovery, following the Monday sell-off, with the Hang Seng Index and the ASX200 also ending the session in positive territory.

Hopes of containing the Middle East conflict through diplomatic channels drove demand for US equities. The positive sentiment spilled over to the Asian session on Tuesday. The news of several Middle Eastern nations favoring a ceasefire reduced fears of further escalation.

Trading Derivatives carries a high level of risk to your capital and you should only trade with money you can afford to lose. Trading Derivatives may not be suitable for all investors, so please ensure that you fully understand the risks involved, and seek independent advice if necessary. A Product Disclosure Statement (PDS) can be obtained either from this website or on request from our offices and should be considered before entering into a transaction with us. Raw Spread accounts offer spreads from 0.0 pips with a commission charge of USD $3.50 per 100k traded. Standard account offer spreads from 1 pips with no additional commission charges. Spreads on CFD indices start at 0.4 points. The information on this site is not directed at residents in any country or jurisdiction where such distribution or use would be contrary to local law or regulation.

Investors brushed aside US economic indicators, while dovish Fed commentary contributed to the positive US session.

On Monday, the Nasdaq Composite Index rallied 1.20%, with the Dow and S&P 500 gaining 0.93% and 1.06%.

There were no economic indicators from the Asian region  on Tuesday to influence market risk sentiment. Hawkish RBA minutes failed to overshadow investor sentiment toward the Middle East conflict. However, investors considered earnings results and news of Chinese companies announcing share buy-back plans.

The Wednesday Session: China in the Spotlight

Overnight US economic indicators from Tuesday and Fed commentary will set the tone for the Wednesday session.

US retail sales figures for September beat forecasts. The hotter-than-expected retail sales figures fueled bets on a Fed interest rate hike. Investors responded to the numbers, leaving the US equity markets with a mixed Tuesday session.

The Nasdaq Composite Index and S&P 500 fell by 0.25% and 0.01%, while the Dow gained 0.04%.

While the fear of a Fed rate hike will test the buyer appetite for riskier assets, economic data from China will influence market risk sentiment. Industrial production, fixed asset investment, unemployment, retail sales, and third-quarter GDP numbers will move the dial.

Economists forecast the Chinese economy to expand by 4.4% in Q3 year-over-year vs. 6.3% in the previous quarter. While the GDP numbers need consideration, an improvement in industrial production and retail sales figures would indicate a more positive macroeconomic environment.

However, economists forecast industrial production to rise by 4.3% year-over-year vs. 4.5% in August.

In the Futures Markets, the ASX 200 and the Nikkei 225 were up 20 points and 80 points, respectively.

ASX 200

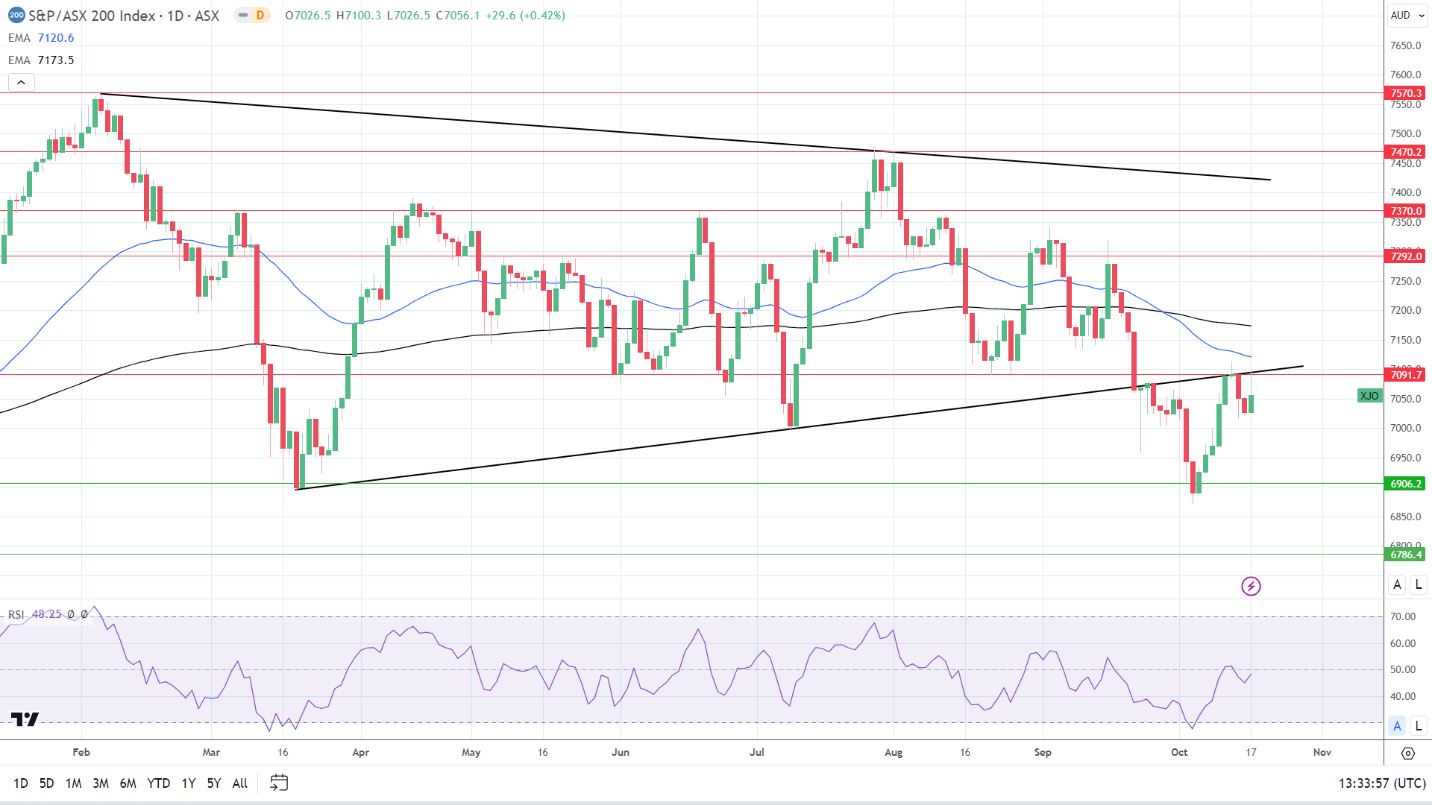
ASX 200 made gains on Tuesday.
ASX 200 181023 Daily ChartThe ASX 200 gained 0.42% on Tuesday. Tech stocks found much-needed support. The S&P/ASX All Technology Index (XTX) rose by 0.99%. Mining stocks and the big four banks also ended the session in positive territory.

Westpac Banking Corp (WBC) and the National Australia Bank (NAB) rose by 0.80% and 0.82%. ANZ Group (ANZ) and the Commonwealth Bank of Australia (CBA) ended the session up 0.82% and 0.53%.

Mining stocks had a positive session. Rio Tinto (RIO) rallied 1.20%, with Fortescue Metals Group (FMG) gaining 1.35%. BHP Group Ltd (BHP) and Newcrest Mining (NCM) rose by 0.86% and 0.15%. Rio Tinto beat earnings forecasts, giving the mining sector a boost.

Oil stocks also ended the day in positive territory. Woodside Energy Group (WDS) and Santos Ltd (STO) ended the day up 0.08% and 0.52%.

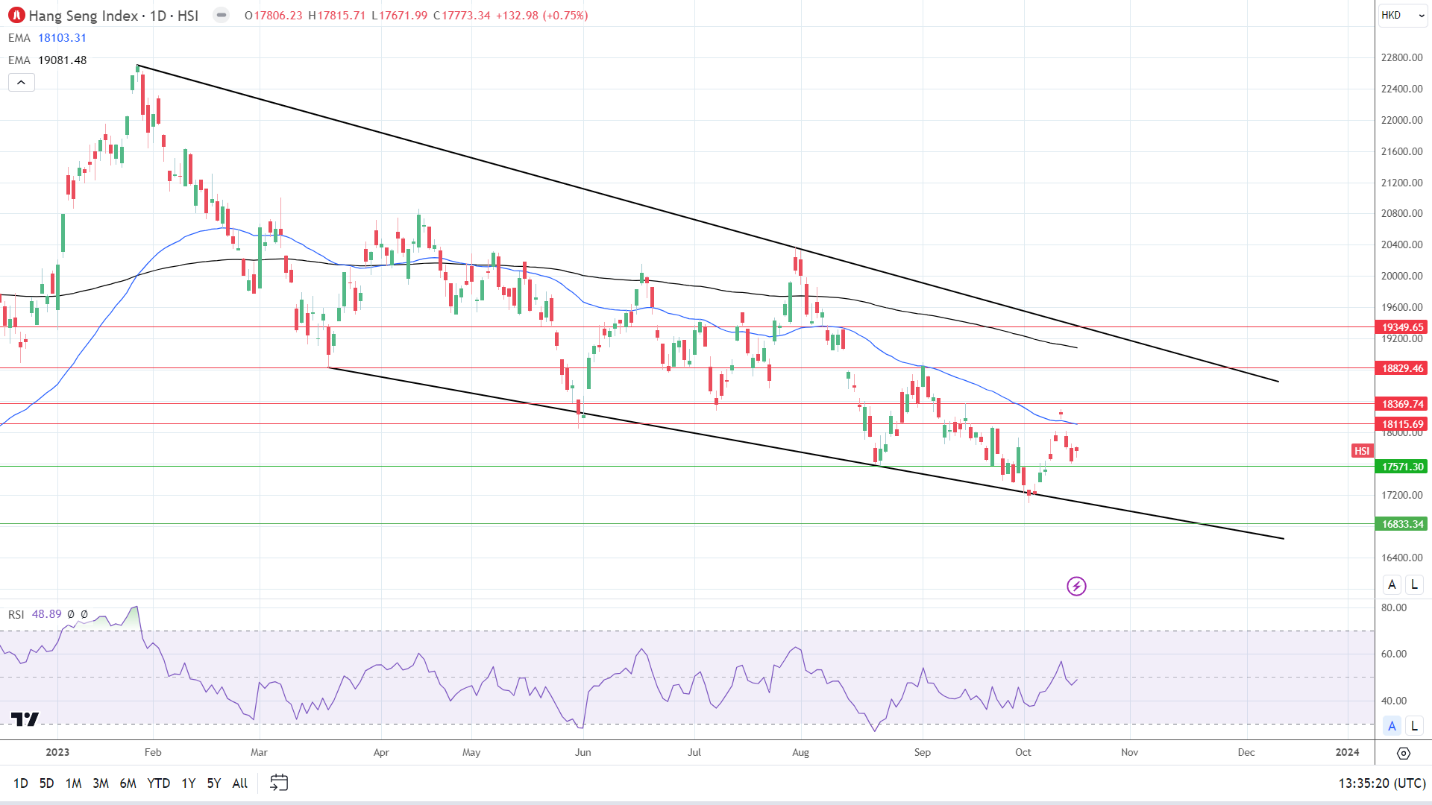
Hang Seng Index

Hang Seng Index found Tuesday support.
HSI 181023 Daily ChartOn Monday, the Hang Seng Index gained 0.75%.

Alibaba Group Holding Ltd (HK:9988) and Tencent Holdings Ltd (HK:0700) rose by 0.86% and 0.33%.

Bank stocks also had a positive session. China Construction Bank (HK:0939) and the Industrial and Commercial Bank of China (HK:1398) ended the session up 1.08% and 1.56%. HSBC Holdings PLC (HK:0005) rose by 0.08%.

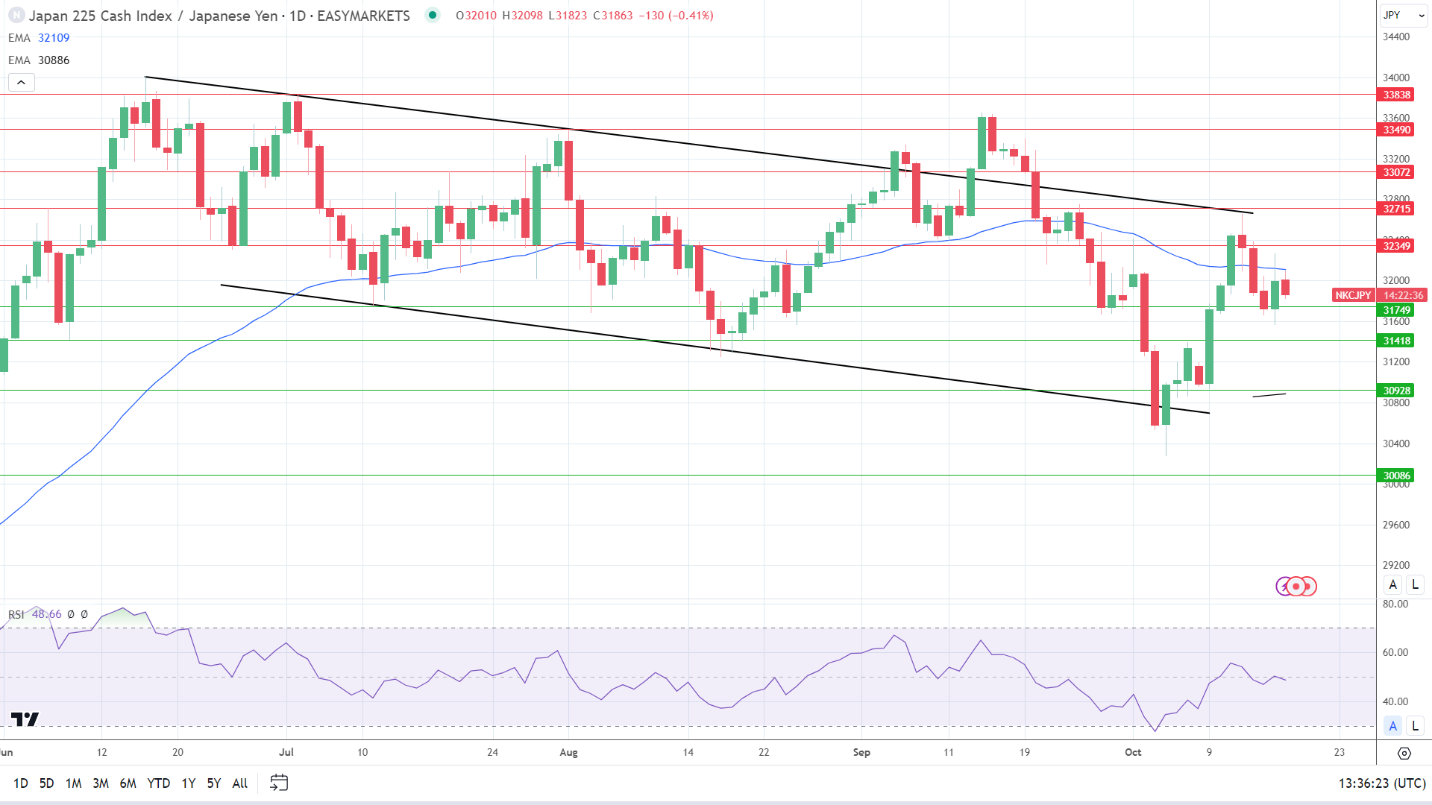
Nikkei 225

Nikkei in recovery mode.
NKCJPY 181023 Daily Chart(Graph for reference purposes only)

The Nikkei gained 1.20%, partially offsetting the sell-off from Monday.

Bank stocks, including Sumitomo Mitsui Financial Group (8316) and Mitsubishi UFJ Financial Group (8306), rose by 0.68% and 0.28%. However, the main components of the Nikkei saw strong gains.

Tokyo Electron Limited (8035) and SoftBank Group Corp. (9984) rallied 2.38% and 2.65%, with Sony Corp. (6758) gaining 1.55%.

KDDI Corp. (9433) and Fast Retailing Co (9983) ended the day up 0.72% and 0.83%.