US Dollar Outlook After Powell: GBP/USD, AUD/USD, EUR/USD Price Action

US Dollar Outlook After Powell: GBP/USD, AUD/USD, EUR/USD Price Action

The US dollar continues to trade strongly amid rising yields and escalating tensions in the Middle East, after US Federal Reserve Chair Jerome Powell stopped short of hinting that US interest rates have peaked.

Powell acknowledged the impact of tightening of financial conditions but stopped short of closing the possibility of further tightening given the strength of the economy and tight labor markets. However, Powell echoed the remarks of some of his colleagues saying the rise in yields “at the margin” might lessen the need for additional hikes. On balance, it appears that Powell’s tone was a touch dovish, though the central bank isn’t prepared to close the door yet on further tightening. The market is pricing in a high chance that the Fed will keep interest rates steady at its Oct. 31-Nov. 1 meeting.

The US dollar has been driven higher in recent months, thanks to the outperformance of the US economy relative to the rest of the world coupled with a relatively hawkish Fed compared with its peers. Even if the market leans toward the view that US rates have pivoted, unless there is economic convergence, the US dollar could stay well bid even if there is monetary policy convergence.

DXY Index Weekly Chart
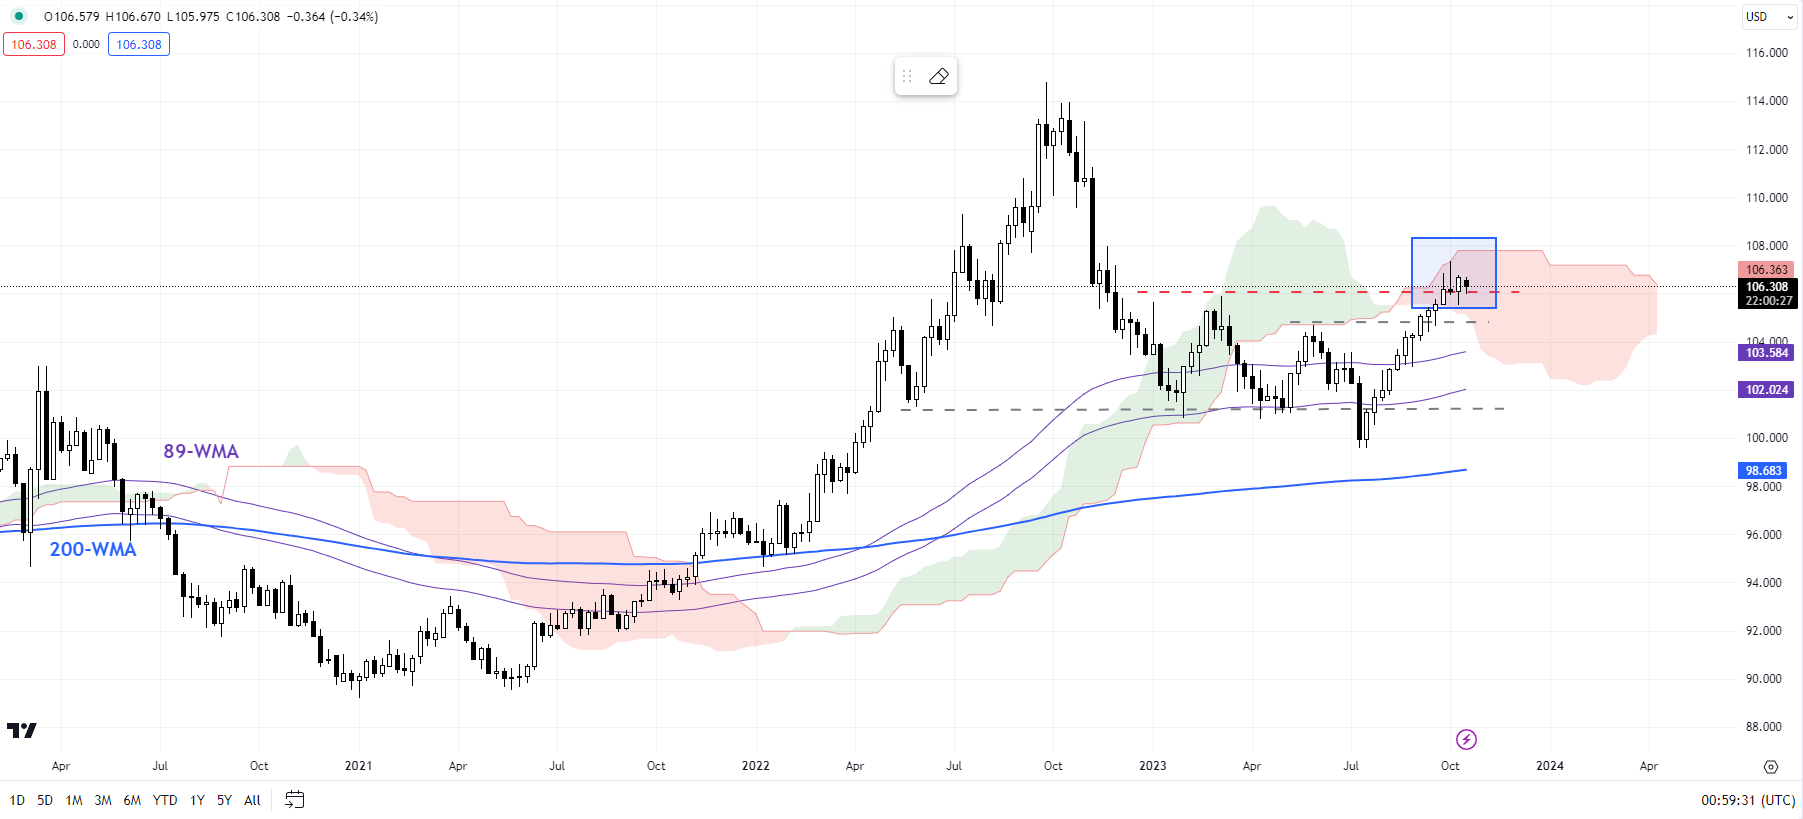
image1.png

On technical charts, the index is testing major resistance on the upper edge of the Ichimoku cloud on the weekly charts, not too far from the March high of 105.90. While the greenback’s rally may have stalled for now, it is too soon to say it is over. For the immediate upward pressure to fade, the index at minimum would need to fall below initial support at last week’s low of 105.50.

EUR/USD Weekly Chart

image2.png

EUR/USD: Is this it?

EUR/USD’s slide has paused at key support at the March low of 1.0500, near the lower edge of the Ichimoku cloud on the weekly charts. This support is strong and may not be easily broken, at least in the first attempt, especially given the sharp decline in recent weeks. So a minor rebound wouldn’t be surprising. Having said that, for a meaningful rebound to occur the pair needs to break above this month’s high of 1.0635. Until then, the balance of risks remains tilted sideways to down. For more discussion, including fundamentals, see “Is Euro’s Downtrend Over? EUR/USD, EUR/AUD, EUR/NZD Price Setups,” published October 12.

Looking for actionable trading ideas? Download our top trading opportunities guide packed with insightful tips for the fourth quarter!

GBP/USD Weekly Chart
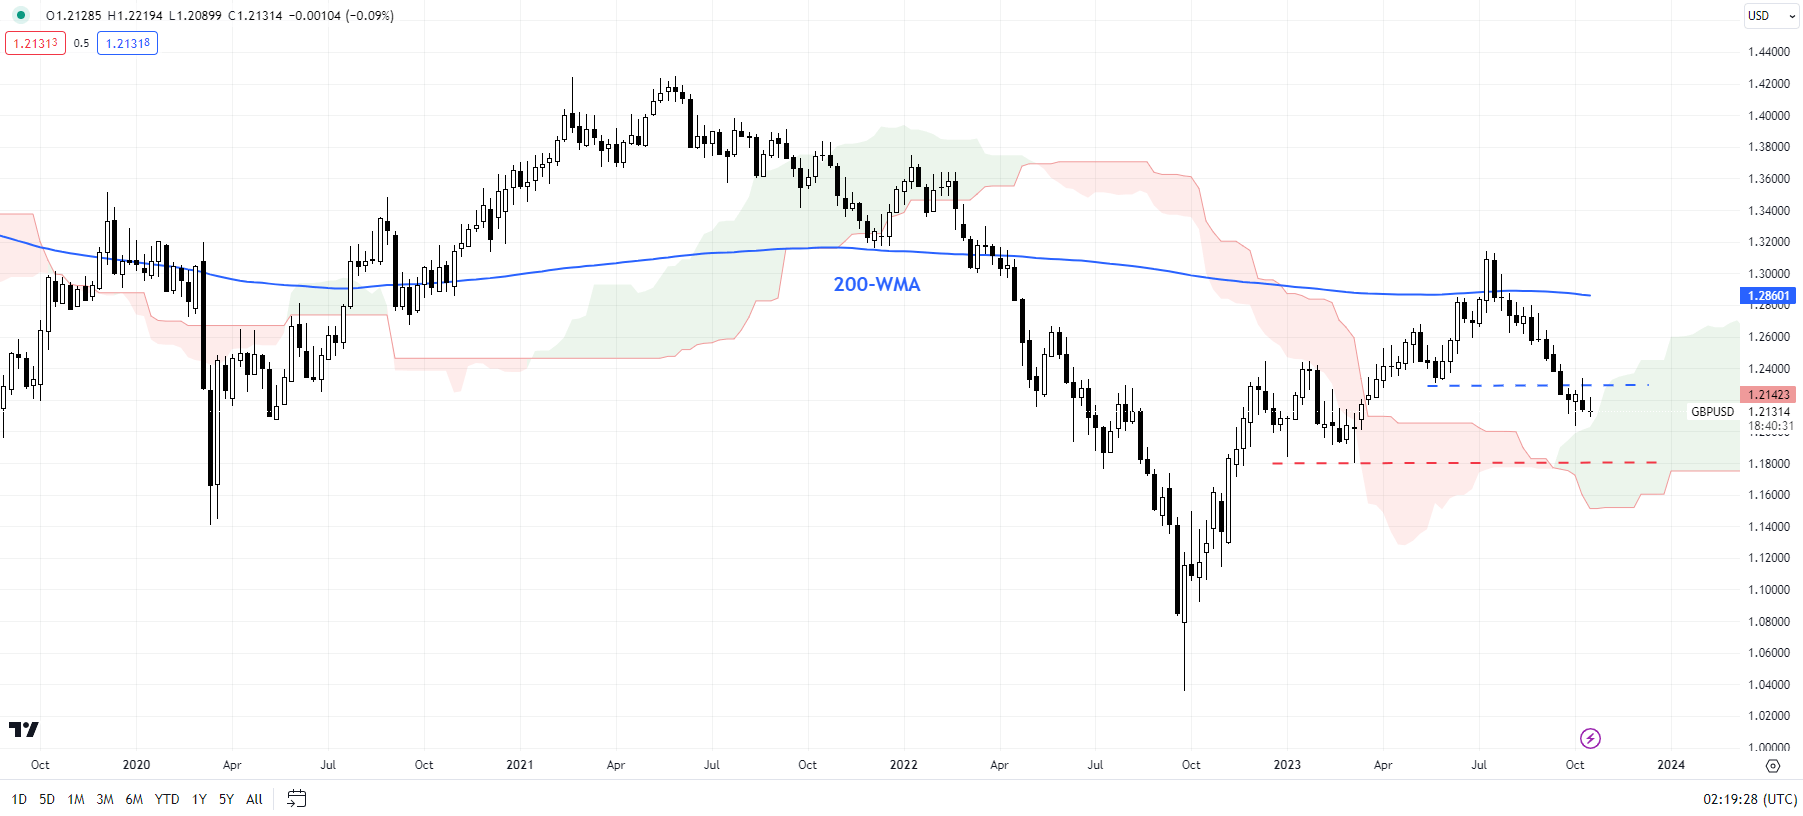
GBP/USD: In search of a bottom

GBP/USDappears to be in search of a low with the slide pausing around key support at the May low of 1.2300. Granted, the pair looks oversold as speculative long GBP positioning has been unwound. Still, there’s no evidence of a price reversal ahead of strong converged support at the early 2023 lows of around 1.1800, not too far from the lower edge of the Ichimoku cloud on the weekly charts. For more discussion, including fundamentals, see “British Pound Ahead of US CPI: GBP/USD, EUR/GBP, GBP/AUD Price Setups,” published October 11.

AUD/USD Daily Chart
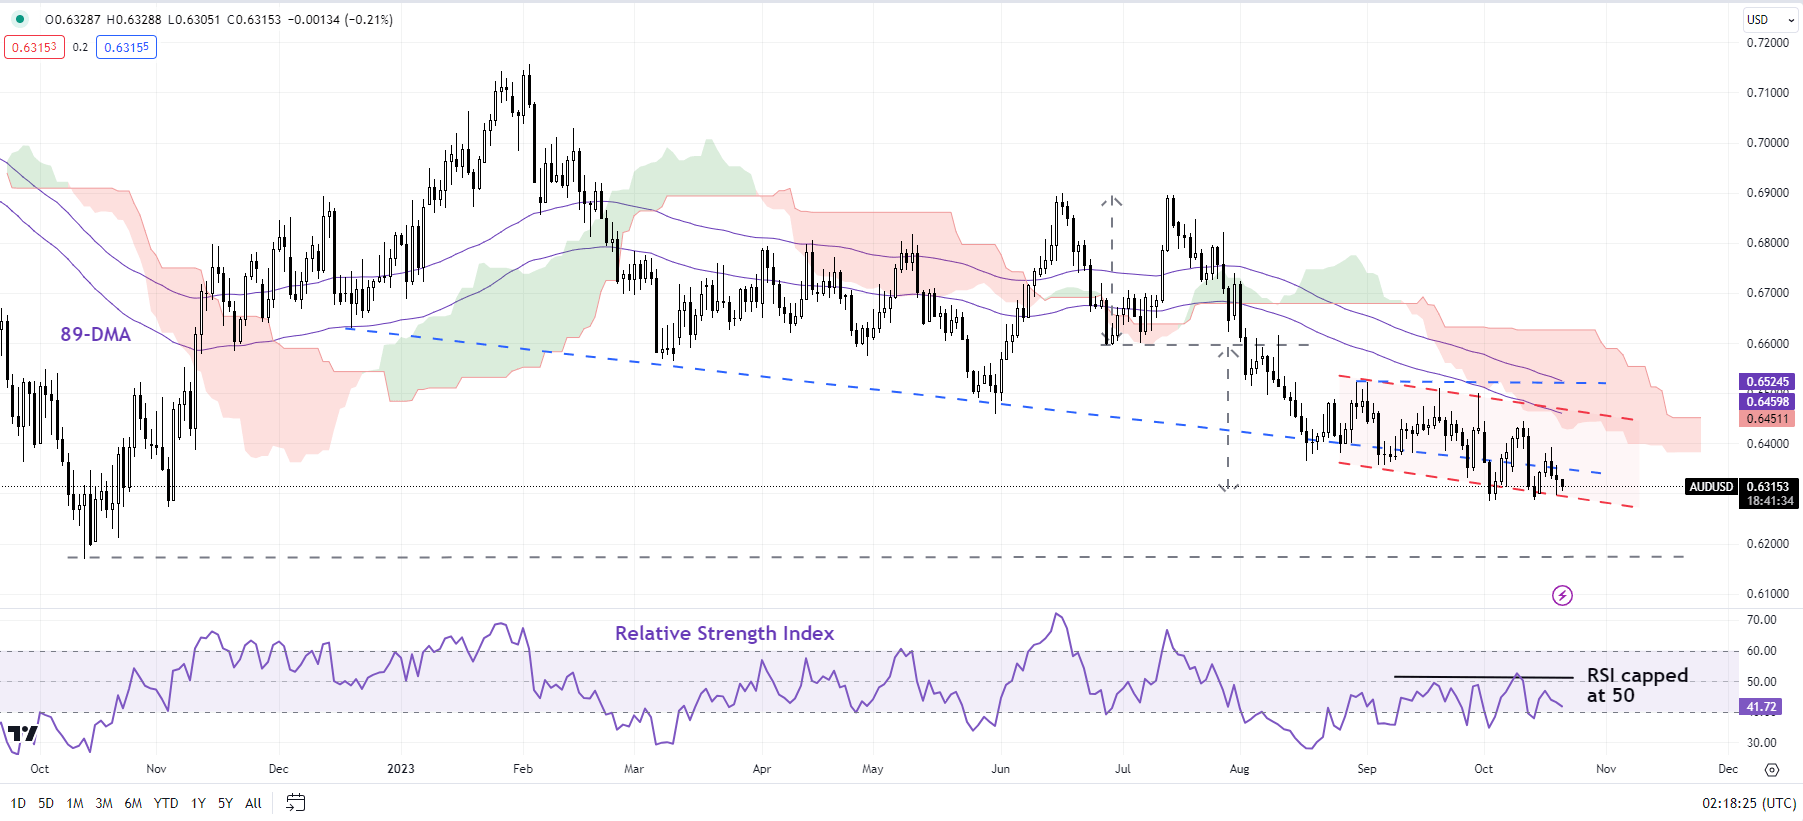
AUD/USD: Gradually drifting lower

AUD/USDappears to be gradually losing grip as it struggles to hold above support on the lower edge of a declining channel since August, around minor support at the early-October low of 0.6285. The repeated lower-lows-lower-highs indicate downside risks prevail unless AUD/USD breaks above resistance at the end-August high of 0.6525. For more discussion, including fundamentals, see “Australian Dollar Jumps After China GDP Beat; What’s Next for AUD/USD?” published October 18.

Supercharge your trading prowess with an in-depth analysis of oil‘s outlook, offering insights from both fundamental and technical viewpoints. Claim your free Q4 trading guide now!

XAU/USD Price Forecast: Investors Seek Out Golds Safety

XAU/USD Price Forecast: Investors Seek Out Golds Safety

XAU/USD FUNDAMENTAL FORECAST

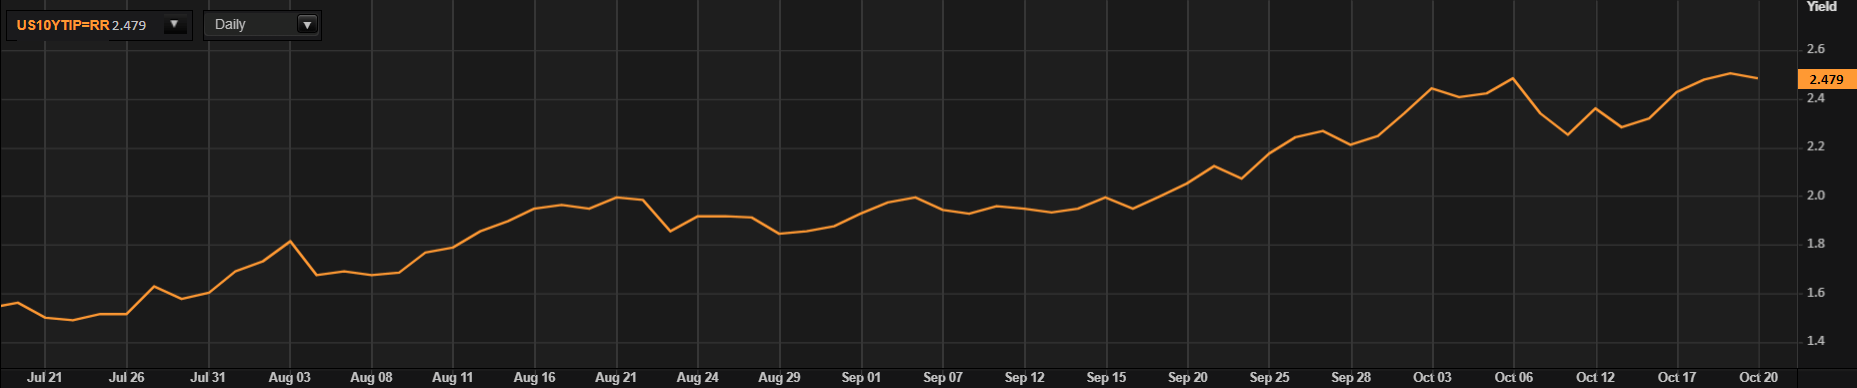
Gold prices capitalized on the risk off mood across financial markets while receiving an additional boost from Fed Chair Jerome Powell last night. Tensions in the Middle East have been escalating playing into the hands of the safe haven yellow metal while US government bonds received a lift across the curve (decline in US Treasury yields). Consequently, real yields (refer to graphic below) are softening making the non-interest bearing asset more attractive to investors.

US REAL YIELDS (10-YEAR)

image1.png

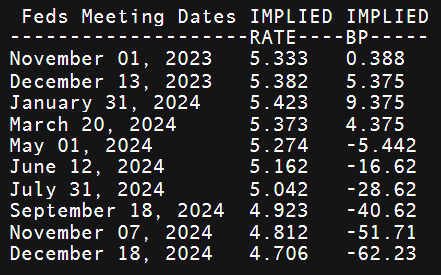
The Federal Reserve Chair signaled that the central bank is likely to keep interest rates on hold in November to gather more data and gauge the state of the US economy. That being said, there was no mention of being at the peak and that there could be scope for further monetary policy tightening if needed. From a more dovish perspective, he cited higher yields aided in keeping monetary policy conditions restrictive. Overall markets were expecting such guidance so no real surprises; however, money markets ‘dovishly’ repriced rate forecasts (see table below) with the first round of cuts expected around July as opposed to September prior to the speech.

IMPLIED FED FUNDS FUTURES

image2.png

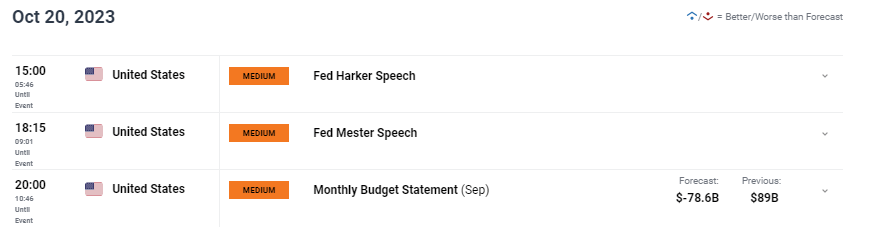
The economic calendar today is relatively muted and will see markets digesting yesterdays Fed comments as well as monitoring geopolitical tensions. More Fed speak will take place throughout the day but is unlikely to drive volatility as Fed Chair Powell’s address will be the focal point.

GOLD ECONOMIC CALENDAR

image3.png

Want to stay updated with the most relevant trading information? Sign up for our bi-weekly newsletter and keep abreast of the latest market moving events!

TECHNICAL ANALYSIS

GOLD PRICE DAILY CHART

image4.png

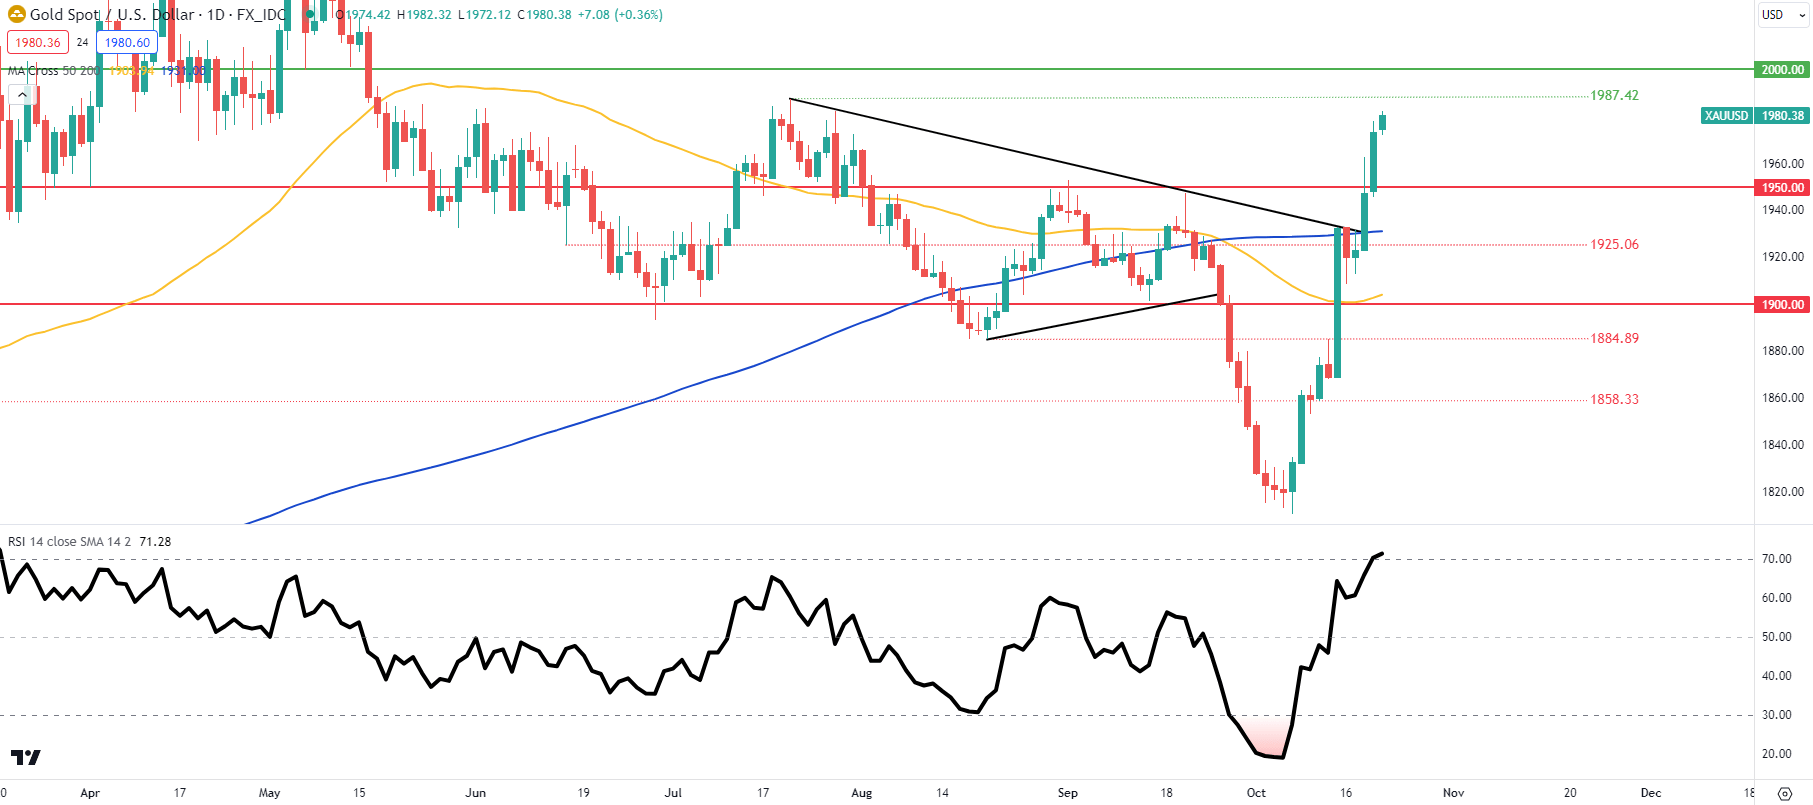
Daily XAU/USD price action now sees the pair trading within the overbought zone of the Relative Strength Index (RSI) as bulls look to test the 1987.42 July swing high. This comes after breaking above trendline resistance (black) and the 200-day moving average (blue). The weekend will be crucial for next week’s open and is mostly at the behest of the Israel-Hamas war. Bulls should be cautious around these extreme levels and should exercise sound risk management.

Resistance levels:

  • 2000.00
  • 1987.42

Support levels:

  • 1950.00
  • Trendline resistance/200-day MA (blue)

IG CLIENT SENTIMENT: BULLISH

IGCS shows retail traders are currently distinctly LONG on gold, with 64% of traders currently holding long positions (as of this writing).

The Bond Market as a Forecasting Tool for Stocks: Four Key Yield Curve Regimes

The Bond Market as a Forecasting Tool for Stocks: Four Key Yield Curve Regimes

On Wall Street, traders frequently say that the bond market is the smart money because of its predictive power for output growth, inflation , and interest rates – three key variables for the broader economy and therefore for financial assets. Based on this perception, investors sometimes focus sharply on bonds, examining the twists and turns of the yield curve , hoping to glean information about future economic performance and emerging trends. The financial system is highly connected, so it is logical that signals emitted by one market can sometimes become an indicator – perhaps even leading – and a forecasting tool for another that is slower to or inefficient at incorporating new data.

In this article, we’ll look at the Treasury market to explore how the shape/slope of the yield curve can offer clues about expectations for future equity returns and sector leadership by providing insight into the business cycle. Before delving in, it is necessary to become familiar with crucial concepts.

TREASURY YIELD CURVE

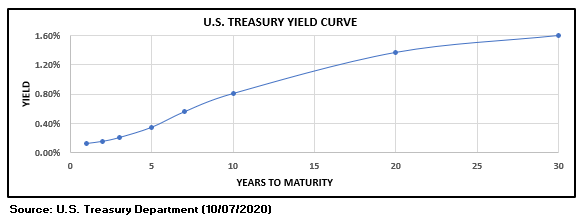
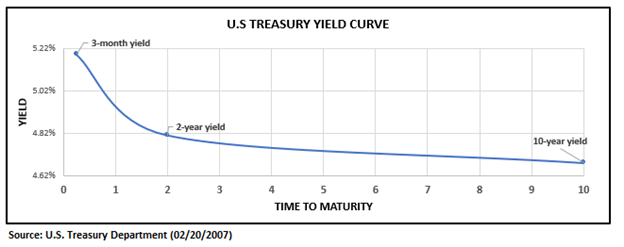
The Treasury yield curve is a graphical representation that plots government bond interest rates across different tenors for the entire maturity spectrum – from overnight to 30 years. It shows the return an investor would earn by lending funds to the US government for a given period of time, with the graph displaying the security’s yield on the vertical axis and borrowing period across the horizontal axis.

The curve may take different shapes, but in healthy environments , it will typically slope upwards as longer-term debt instruments will offer higher returns than short-dated ones to compensate for additional risks such as inflation and duration (see figure below). For example, the 30-year government bond will often have a higher yield than the 10-year note, which in turn, should have a higher yield than the 2-year Treasury note.

U.S YIELD CURVE

Although rare, at times, a long-term security may have a lower yield than a short-term investment, producing a downward sloping term-structure of interest rates . When this occurs, we say the yield curve has inverted.

Frequently, the yield curve tends to invert after the central bank has raised short-term rates to prevent overheating to the point that it is curtailing activity and weighing on the economic outlook. When monetary policy has become too restrictive, investors bet interest rates will have to decline in the future to address a possible downturn and disinflation. These assumptions cause longer dated bond rates to fall below short-term ones, causing the Treasury curve to invert.

Historically, inversions have frequently foreshadowed impending recessions. In fact, in the post WWII era, every yield curve inversion (of the 3-month to 10-year or 3m10y) has been followed by an economic slump.

INVERTED U.S. YIELD CURVE

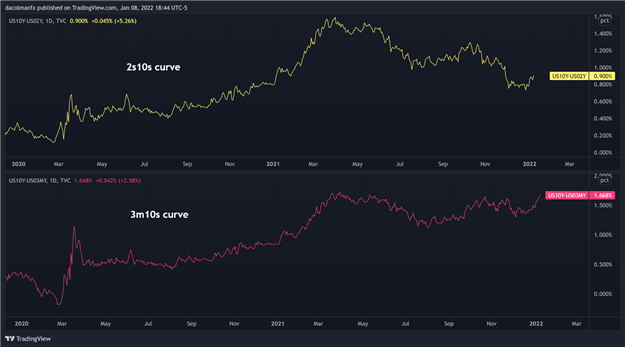
Rather than focusing on the entire interest rate term structure of the Treasury market, traders will often compare two yields at two specific maturities and refer to their spread, measured in basis points, as “the yield curve”. The most analyzed and frequently referenced curves in financial media are the following:

  1. The 2-year/10-year curve also known as the 2y10y (referred to as twos-tens): This is the difference between the 10-year Treasury bond yield and the 2-year Treasury Note yield.
  2. The 3-month/10-year curve also known as the 3m10y (referred to as three month-tens): This curve represents the difference between the 10-year Treasury bond yield and the 3-month Treasury bill yield.

2s10s and 3m10s curves since 2020

CHANGES IN THE YIELD CURVE

As economic activity, inflation expectations, monetary policy outlook and liquidity conditions change, so will the spread between long and short-term Treasury yields. When the spread increases, the difference between long and short-dated rates widen, and the curve is said to steepen . On the contrary, when the term spread compresses, the yield curve is said to flatten .

The term spread can change for many reasons; for example, it could flatten because long-term yields are declining and/or short-term rates are rising (or a combination of both). The twists and turns of the Treasury curve are an effective real-time business cycle indicator and can therefore help to develop interesting cross-market trading strategies. For instance, sophisticated stock investors will regularly look at the shape and slope of the yield curve to structure an equity portfolio aiming to capture an emerging economic trend.

THE FOUR DIFFERENT SHAPES OF THE CURVE TO KNOW

Here is a summary of the four fundamental yield curve regimes and how they can help predict sector leadership in the equity market.

  1. Bear steepener: long-term rates increase faster than short-term rates, steepening the yield curve. This is a risk-on environment that tends to appear during the early stages of the business cycle following a recession after the central bank has cut the benchmark rate and signaled it will keep them low for some time to support the recovery. Accommodative monetary policy creates a reflationary backdrop , lifting market-determined long-term rates amid improving prospects for future economic activity and inflation. The smart money considers this condition bullish for most stocks and especially cyclical sectors on account of faster earnings growth . During bear steepening, materials, industrials, and consumer discretionary stocks tend to rally significantly. Banks (financials), which rely on borrowing short and lending long, also perform well during these periods on the back of widening net interest margins.
  2. Bear flattener: short maturity yields rise faster than their long-term counterpart, compressing term spreads and flattening the curve. This regime takes place during the expansion phase and precedes the Fed raising the federal funds rate to keep inflationary pressures in check (the front end of the curve is primarily influenced by monetary policy expectations determined by the central bank). Volatility may be higher at times, but this remains a risk-on environment for stocks amid healthy earnings. It supports a constructive backdrop for technology, energy, and real estate.
  3. Bull steepener: short term yields fall faster than long term yields, steepening the curve. This regime tends to be risk-off and often appears early in a recession when the outlook is highly uncertain, and the central bank is cutting short-term rates to stimulate the economy. On balance, stocks don’t do well during bull-steepening periods, though defensive sectors such as utilities and staples tend to outperform the broader market while technology and materials struggle.
  4. Bull flattener: long-term yields fall faster than short-dated rates, flattening the Treasury curve. The narrowing of the spread is fueled by moves in the back end, driven overwhelmingly by market forces amid falling long-run inflation expectations and a deteriorating growth outlook. This regime, which foreshadows turbulence in financial markets, flares up late in the business cycle when investors start pricing a possible recession and disinflation. When bull flattening prevails, equity investors begin to tilt their portfolios towards higher quality plays as a hedge against rising volatility. Staples and utilities command leadership while cyclicals do poorly amid weakening corporate earnings for economically sensitive sectors.

Note: The ‘bull’ and ‘bear’ signifier that describes each regime refers to what happens to bond prices. For example, in bear flattener, when short-term rates rise faster than long-term ones, short-dated Treasuries are being sold, prompting their prices to fall (bearish for price in this example). Keep in mind that bond prices and yields move opposite of each other.

The shape of the U.S. Treasury curve is primarily influenced by inflation expectations, prospects for output growth and the monetary policy outlook. Considering that the yield curve captures important variables about the economy of today and the future, it is a useful leading indicator of the business cycle. Based on this assumption, equity investors often use the shape of the curve as a forecasting device to predict stock market leadership, but this practice shouldn’t be done in isolation as bonds can give false signals as with any tool. That said, top-down and bottom-up analysis are often best served when creating a balanced, diversified and less-volatile portfolio.

EDUCATION TOOLS FOR TRADERS

  • Are you just interested in the stock market? Download DailyFX quarterly equity forecast
  • Would you like to know more about your trading personality? Take the DailyFX quiz and find out
  • IG’s client positioning data provides valuable information on market sentiment. Get your free guide on how to use this powerful trading indicator here.
Nasdaq 100, Dow Jones, S&P 500 News: Futures Trend Lower as Powell’s Hawkish Stance Looms

Nasdaq 100, Dow Jones, S&P 500 News: Futures Trend Lower as Powell’s Hawkish Stance Looms

Mixed Bag for Equities

U.S. stock index futures are wobbling ahead of Thursday’s cash market open. As of 09:09 GMT, Dow Jones futures are down by 105 points, or 0.31%. Similarly, both the Nasdaq 100 and S&P 500 futures have slipped 0.32% and 0.23%, respectively. The market’s shaky disposition follows a volatile Wednesday session where surging Treasury yields led to a significant sell-off, contributing to the Dow shedding over 330 points.

Tech Giants Take a Hit, While Netflix Soars

Investors are also scrutinizing after-hours trading movements. Tesla, the electric vehicle powerhouse, tumbled 4% after reporting Q3 earnings and revenue that fell short of market expectations. Meanwhile, Netflix bucked the trend, with shares soaring nearly 13% after-hours thanks to a third-quarter profit that surpassed estimates.

Trading Derivatives carries a high level of risk to your capital and you should only trade with money you can afford to lose. Trading Derivatives may not be suitable for all investors, so please ensure that you fully understand the risks involved, and seek independent advice if necessary. A Product Disclosure Statement (PDS) can be obtained either from this website or on request from our offices and should be considered before entering into a transaction with us. Raw Spread accounts offer spreads from 0.0 pips with a commission charge of USD $3.50 per 100k traded. Standard account offer spreads from 1 pips with no additional commission charges. Spreads on CFD indices start at 0.4 points. The information on this site is not directed at residents in any country or jurisdiction where such distribution or use would be contrary to local law or regulation.

Rate Hike Looms; Airlines Drag Down Dow Transports

The rising yields have also cast a shadow over other sectors. Wednesday was particularly brutal for the Dow Transports, marking its worst day since April, with airlines taking a substantial hit. United Airlines plummeted 9.7%, while Alaska Air and American Airlines also reported significant losses. The upward movement in yields continues to raise questions around the Federal Reserve’s future monetary policy, and all eyes are now focused on Fed Chair Jerome Powell’s upcoming speech.

Powell’s Speech: A Pivotal Moment

Interest rates are taking center stage again as traders anticipate Powell’s keynote address at 16:00 GMT. According to Nuveen’s Chief Investment Officer, Saira Malik, markets should not expect Powell to deviate from a hawkish stance. With inflation still a concern and the job market robust, Powell is likely to maintain his hawkish narrative, raising the possibility of one more rate hike this year.

Short-Term Forecast: Cautiously Bearish Amid Powell’s Upcoming Remarks

The immediate outlook for U.S. stock index futures is bearish, heightened by the uncertainty surrounding the Federal Reserve’s next moves. With Treasury yields having recently hit multi-year highs, market participants are eagerly awaiting Fed Chair Jerome Powell’s speech for clues on the central bank’s stance on interest rates and monetary policy.

Should Powell echo the hawkish sentiment as expected, traders could see further downward pressure on equities. Proceed with caution; Powell’s words could very well serve as the catalyst for the market’s next significant move.

Technical Analysis

Daily S&P 500 IndexThe S&P 500 Index at 4314.59 is hovering just below its 50-day moving average of 4395.43, signaling a potentially bearish outlook in the short term. However, it remains above the 200-day moving average of 4229.01, suggesting longer-term bullishness.

The index is also skirting above minor support at 4261.72 and main support at 4197.68, critical levels to watch for further downside.

Although trend line support sits at 4339.00, the asset failed to maintain this level, indicating potential for further decline.

Crypto News: SEC Chair Gensler Stays Quiet on the Likelihood of a BTC-Spot ETF Approval

Crypto News: SEC Chair Gensler Stays Quiet on the Likelihood of a BTC-Spot ETF Approval

Coinbase, Hamas, and Illicit Activity

This week, Coinbase (COIN) issued a press release highlighting its approach to tackling illicit activity in the crypto space. Coinbase also called for clear US regulation, stating,

“By creating clear rules of the road, we keep crypto in the United States and other regulated jurisdictions, ensuring compliance with sanctions and anti-money laundering rules.”

Trading Derivatives carries a high level of risk to your capital and you should only trade with money you can afford to lose. Trading Derivatives may not be suitable for all investors, so please ensure that you fully understand the risks involved, and seek independent advice if necessary. A Product Disclosure Statement (PDS) can be obtained either from this website or on request from our offices and should be considered before entering into a transaction with us. Raw Spread accounts offer spreads from 0.0 pips with a commission charge of USD $3.50 per 100k traded. Standard account offer spreads from 1 pips with no additional commission charges. Spreads on CFD indices start at 0.4 points. The information on this site is not directed at residents in any country or jurisdiction where such distribution or use would be contrary to local law or regulation.

The press release followed news of Israeli authorities ordering Binance to freeze over 100 Hamas-linked crypto accounts.

While Coinbase took a proactive step, crypto advocates raised concerns about links between crypto and Hamas.

A bipartisan letter to the Biden Administration, calling on the Administration to tackle crypto-financed terrorism, justified the concerns.

According to the letter,

“Hamas and Palestinian Islamic Jihad (PIJ) raised millions of dollars via crypto, evading US sanctions to fund their operations. The lawmakers are asking the Biden administration to provide information about how it plans to prevent crypto-financed terrorism.”

The letter went on to say,

“Congress and this Administration must take strong action to thoroughly address crypto illicit finance risks before it can be used to finance another tragedy.”

Coinbase shares slid by 4.56% on Wednesday compared with a 1.62% loss for the Nasdaq Composite Index.

BTC-Spot ETFs: The Latest News

CEO of crypto asset management firm Galaxy Digital, Mike Novogratz, predicted the approval of a BTC-spot ETF in 2023.

Novogratz shared his views on Squawk Box, saying,

“We think a Bitcoin ETF will be approved this year in 2023. All the indications of dealing seem to be heading in the right direction. There’s a tremendous amount of pressure to do something that is rational. The American public want this.”

Bloomberg Intelligence ETF analyst James Seyffart recently put the chances of the SEC approving the Ark BTC-spot ETF application at 90%.

Amidst all the hype of an SEC approval, SEC Chair Gary Gensler had this to say,

“ We have not one, but multiple, I think its eight or ten filings that the staff, and ultimately the commission, is considering for, what’s called, exchange-traded products for bitcoin to be in a security. So the bitcoin would be held, and there would be something called an exchange-traded product and that would trade on various stock exchanges. And those filings are in front of us. I can’t prejudge any one of them but there’s eight or ten that we’re looking at.”

While acknowledging the review process is ongoing, the SEC Chair refrained from commenting on the level of progress and whether there would be a single or a group approval.

Technical Analysis

Bitcoin Analysis

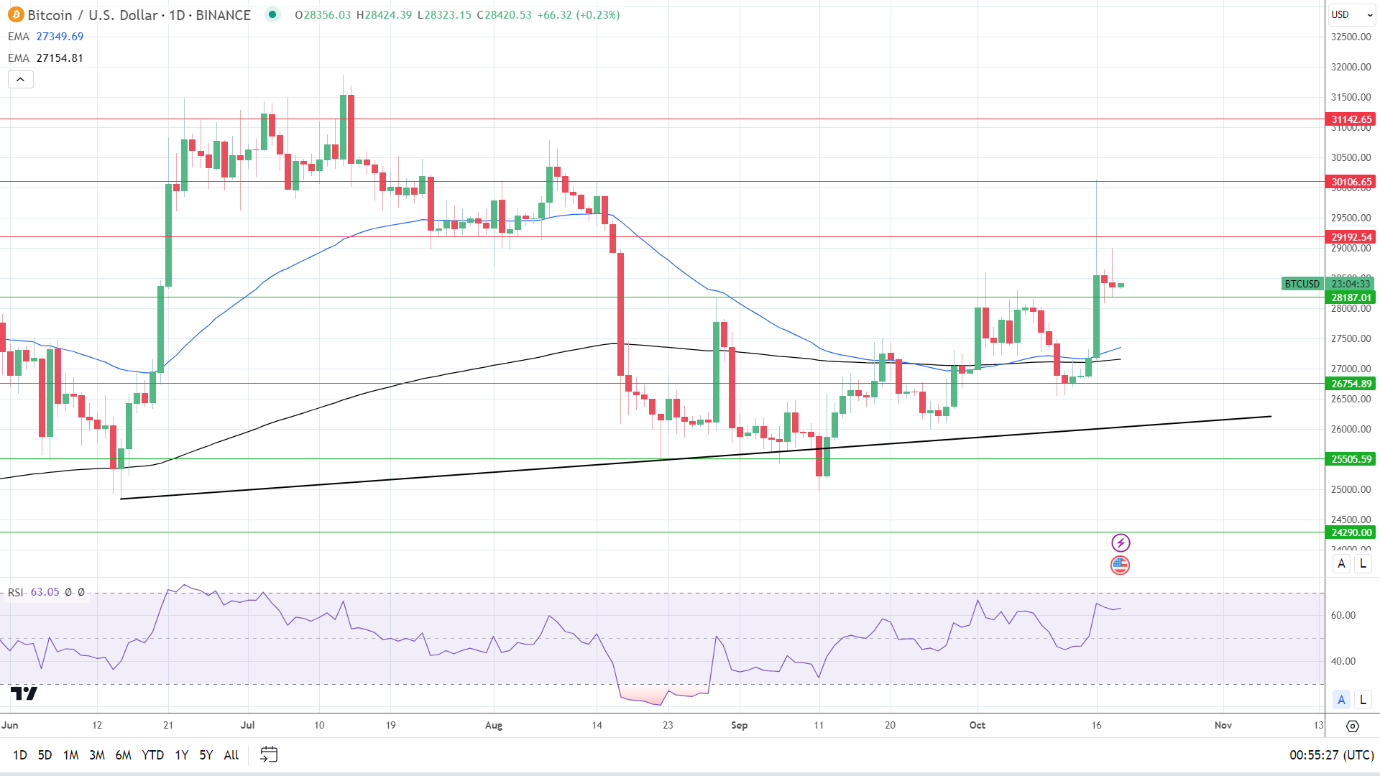
BTC held above the 50-day and 200-day EMAs, sending bullish price signals.

A BTC move through $28,500 would give the bulls a run at the $29,193 resistance level. Positive SEC updates on the BTC-spot ETF approval process would signal a BTC return to $30,000.

However, the Middle East conflict and increased scrutiny of the US crypto space could test buyer appetite. A break below the $28,187 support level would give the bears a look at the EMAs.

The 14-Daily RSI reading of 63.05 suggests a BTC return to $29,000 before entering overbought territory.

BTC/USD Daily Chart sends bullish price signals.
BTCUSD 191023 Daily Chart

Ethereum Analysis

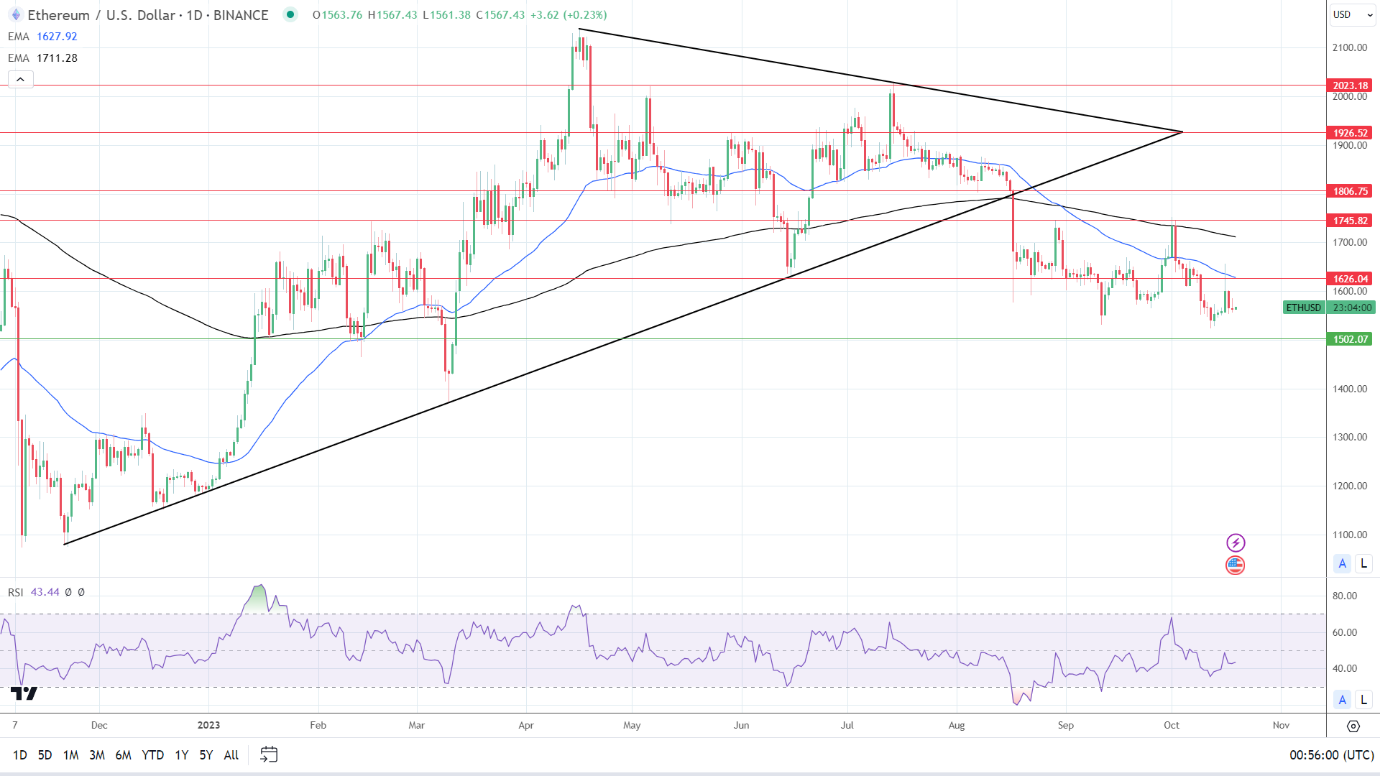
ETH remained below the 50-day and 200-day EMAs, reaffirming bearish price signals.

An ETH fall below $1,550 would bring the $1,502 support level and the sub-$1,500 handle into play.

ETH-spot-ETF-related news will also influence buyer demand.

However, a return to $1,600 would support a run at the $1,626 resistance level and the 50-day EMA. Selling pressure will likely intensify at $1,620. The 50-day EMA is confluent with the $1,626 resistance level.

The 14-Daily RSI reading of 43.44 indicates an ETH fall through the $1,502 support level before entering oversold territory.

ETH Daily Chart sends bearish price signals.
ETHUSD 191023 Daily Chart
The 3 Most Common Types of Forex Market Analysis.

The 3 Most Common Types of Forex Market Analysis.

Forex analysis techniques talking points:

  • There are three general types of forex analysis traders use to anticipate market movements and analyse trends.
  • Traders tend to use one or a combination of FX analysis methods to fit their personality and/or trading style.
  • It can be useful to identify trades using the analytical approach in a forex practise account

There are several different ways to analyze the FX market in anticipation of trading. Although categories of analysis may be plentiful, traders should keep the analysis simple enough to identify good trading opportunities.

This article explores the three most common forex analysis techniques: Fundamental, technical and sentiment analysis, and how they help to shape a trading strategy. Thereafter, it is up to the individual trader to try find out what type of analysis suits there trading style.

3 types of forex analysis techniques

The 3 Most Common Types of Forex Market Analysis:

1) Fundamental

Forex fundamentals center mostly around the currency’s interest rate. This is due to the fact that interest rates have a sizeable effect on the forex market. Other fundamental factors are included such as gross domestic product, inflation, manufacturing, economic growth activity. However, whether those other fundamental releases are good or bad is of less importance than how those releases affect that country’s interest rate.

Traders reviewing the fundamental releases should keep in mind how they might affect the future movement of interest rates. When investors are in a risk-seeking mode, money follows yield (currencies that offer a higher interest rate), and higher rates could mean more investment. When investors are in a risk adverse mentality, then money leaves yield for safe-haven currencies.

The DailyFX website offers a lot of assistance on identifying how a fundamental release could affect the value of the currency. Check out the economic calendar for events coming up this week.

2) Technical

Forex technical analysis involves looking at patterns in price history to determine the higher probability time and place to enter a trade and exit a trade. As a result, technical analysis in forex is one of the most widely used types of analysis.

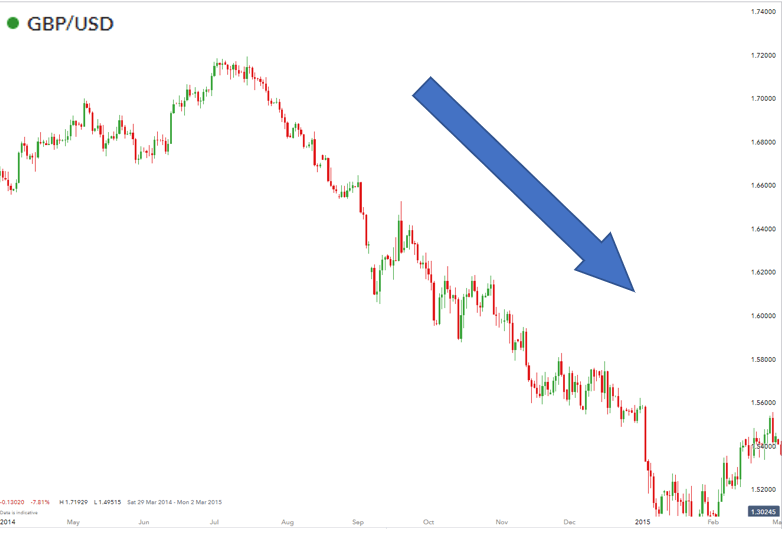
Since FX is one of the largest and most liquid markets, the movements on a chart from the price action generally gives clues about hidden levels of supply and demand. Other patterned behavior such as which currencies are trending the strongest can be obtained by reviewing the price chart. An example of this can be seen below in the GBP/USD chart where the US dollar is strengthening against the Pound Sterling.

GBPUSD chart in forex analysis techniques

Other technical studies can be conducted through the use of indicators. Many traders prefer using indicators because the signals are easy to read, and it makes forex trading simpler.

Technical versus fundamental analysis in forex is a widely debated topic. There is no right answer to the question of which type of analysis is better and traders tend to adopt one, or a combination of the two, in their analysis.

3) Sentiment

Forex sentiment is another widely popular form of analysis. When you see sentiment overwhelmingly positioned to one direction, this means the vast majority of traders are already committed to that position.

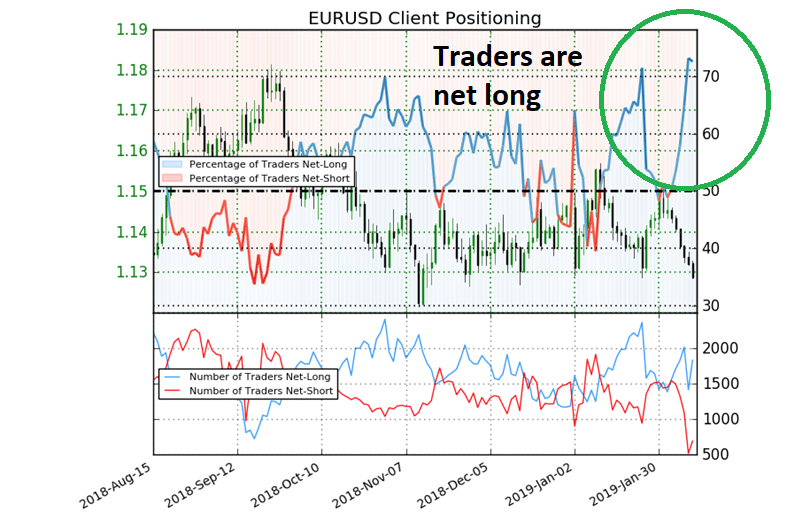
Perhaps this can be better explained with an example. Let’s assume that an overwhelming number of traders and investors are bullish the Euro. They think the Euro is going higher. Since people vote with their trades, we can assess through DailyFX (which uses IG Client Sentiment) that the EUR/USD sentiment shows a majority of traders are buyers in the currency pair.

sentiment forex analysis techniques

Since we know there is a large pool of traders who have already BOUGHT, then these buyers become a future supply of sellers. We know that because eventually, they are going to want to close out the trade. That makes the EUR to USD vulnerable to a sharp pull back if these buyers turn around and sell to close out there trades.

More astute traders will analyze retail sentiment alongside sentiment at the institutional level. Senior Analyst at DailyFX, Tyler Yell explains how traders can analyze the Commitment of Traders (CoT) report for clues on how the institutional market is positioned and how to implement this analysis into their trading analysis.

Learn more about sentiment trading through DailyFX to provide trading opportunities based on IGCS.

How to apply forex techniques to your trades

Traders can utilize a mix of all three types of forex market analysis. This can be done by:

  • Identifying long term trends with the use of fundamental analysis
  • Pin-pointing ideal entry points using technical analysis and accompanying indicators
  • Making use of client sentiment as the last check box before entering the trade.

Keep reading for in-depth examples of how to analyse forex market trends with the three analysis techniques:

1) Use fundamentals to assist in identifying a long-term trend:

Analyzing a country’s GDP, interest rate and inflation rate provides insight on the strength of that country’s economy and by extension, their currency. For example, if the US begins an interest rate hiking cycle, the US dollar will look attractive. If enough investors/traders buy US dollars this will prop up the value of the USD.

2) Apply sound technical analysis to spot entries into the market:

Using multiple time frame analysis and an indicator like the MACD or Relative Strength Index, traders can spot ideal entries into the market.

3) Consider client sentiment:

Traders can analyze client sentiment either by observing the net number of traders long or short, or by trading the difference in net short/long movements. The main takeaway however, is that retail clients tend to trade against prevailing trends therefore, making client sentiment a contrarian indicator.

EUR/USD Forecast: French Business Confidence and Fed Chair Powell in Focus

EUR/USD Forecast: French Business Confidence and Fed Chair Powell in Focus

Wednesday Overview

On Wednesday, the EUR/USD fell by 0.38%. Partially reversing a 0.61% gain on Tuesday, the EUR/USD ended the day at $1.05365. The EUR/USD rose to a high of $1.05942 before falling to a low of $1.05230.

French Business Confidence and the Middle East in Focus

Business confidence figures from France will draw interest on Thursday. A pickup in business confidence would support hopes of an improving macroeconomic environment. A positive economic outlook would encourage business investment, wage growth, and increased consumption. French private consumption contributes over 50% to the French economy.

Trading Derivatives carries a high level of risk to your capital and you should only trade with money you can afford to lose. Trading Derivatives may not be suitable for all investors, so please ensure that you fully understand the risks involved, and seek independent advice if necessary. A Product Disclosure Statement (PDS) can be obtained either from this website or on request from our offices and should be considered before entering into a transaction with us. Raw Spread accounts offer spreads from 0.0 pips with a commission charge of USD $3.50 per 100k traded. Standard account offer spreads from 1 pips with no additional commission charges. Spreads on CFD indices start at 0.4 points. The information on this site is not directed at residents in any country or jurisdiction where such distribution or use would be contrary to local law or regulation.

Economists forecast the French Business Survey Index to hold steady at 99 in October.

Beyond the numbers, news updates on the Middle East conflict remain a focal point. An escalation in the conflict will likely pressure the appetite for the EUR/USD.

Fed Chair Powell in the Spotlight and US Jobless Claims in Focus

US jobless claims will garner investor interest on Thursday. Tight labor market conditions support wage growth, fueling consumption and demand-driven inflation.

Steady initial jobless claims would support the hawkish Fed interest rate path. Higher interest rates over an extended period raise borrowing costs and have an impact on disposable income. A decline in disposable income leads consumers to reduce spending, thereby reducing demand-driven inflationary pressures.

However, it’s important to consider the Philly Fed Manufacturing Index and its sub-components. An unexpected slide in manufacturing activity could raise questions about the resilient US economy.

Later in the US session, Fed Chair Powell is on the calendar to speak. Comments relating to the economic outlook, inflation, and interest rates will influence buyer appetite for the US dollar. FOMC members Jefferson, Goldsbee, Barr, Bostic, and Harker will also deliver speeches.

Short-Term Forecast:

Near-term EUR/USD trends hinge on the Middle East conflict and central bank forward guidance. Without cracks forming in the US economy, the EUR/USD remains exposed to downside risks. US labor market conditions and consumption favor a Fed rate hike.

EUR/USD Price Action

Daily Chart

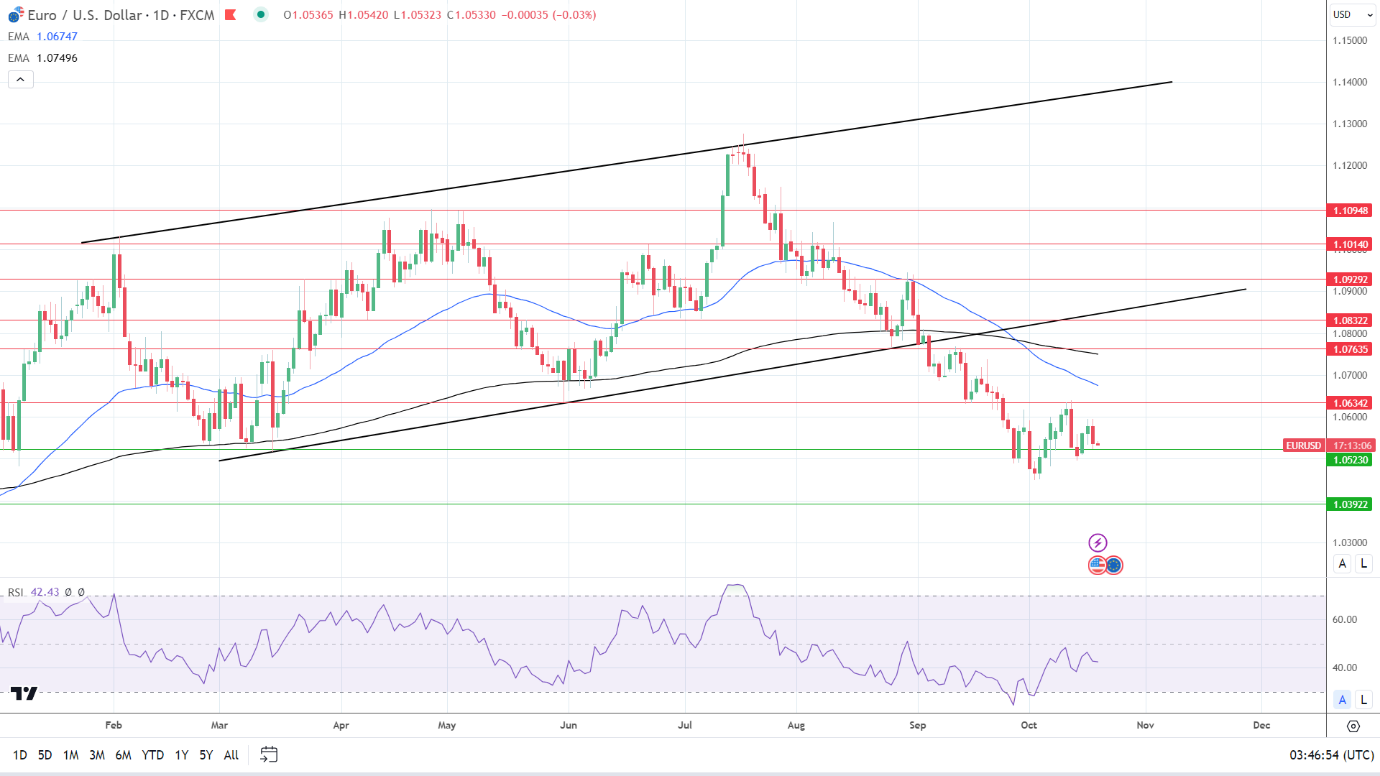
The EUR/USD remained below the 50-day and 200-day EMAs, affirming bearish price signals.

A EUR/USD break below the $1.05230 support level would support a move toward $1.0450 and the $1.03922 support level. An escalation in the Middle East conflict and hawkish Fed comments would affect the appetite for the EUR/USD.

On the other hand, a dovish Fed Chair and a de-escalation in the Middle East would support a run at the $1.06342 resistance level.

The 14-period Daily RSI, 42.43, indicates a EUR/USD fall through the $1.05230 support level before entering oversold territory.

EUR/USD Daily Chart sends bearish price signals.
EURUSD 191023 Daily Chart

4-Hour Chart

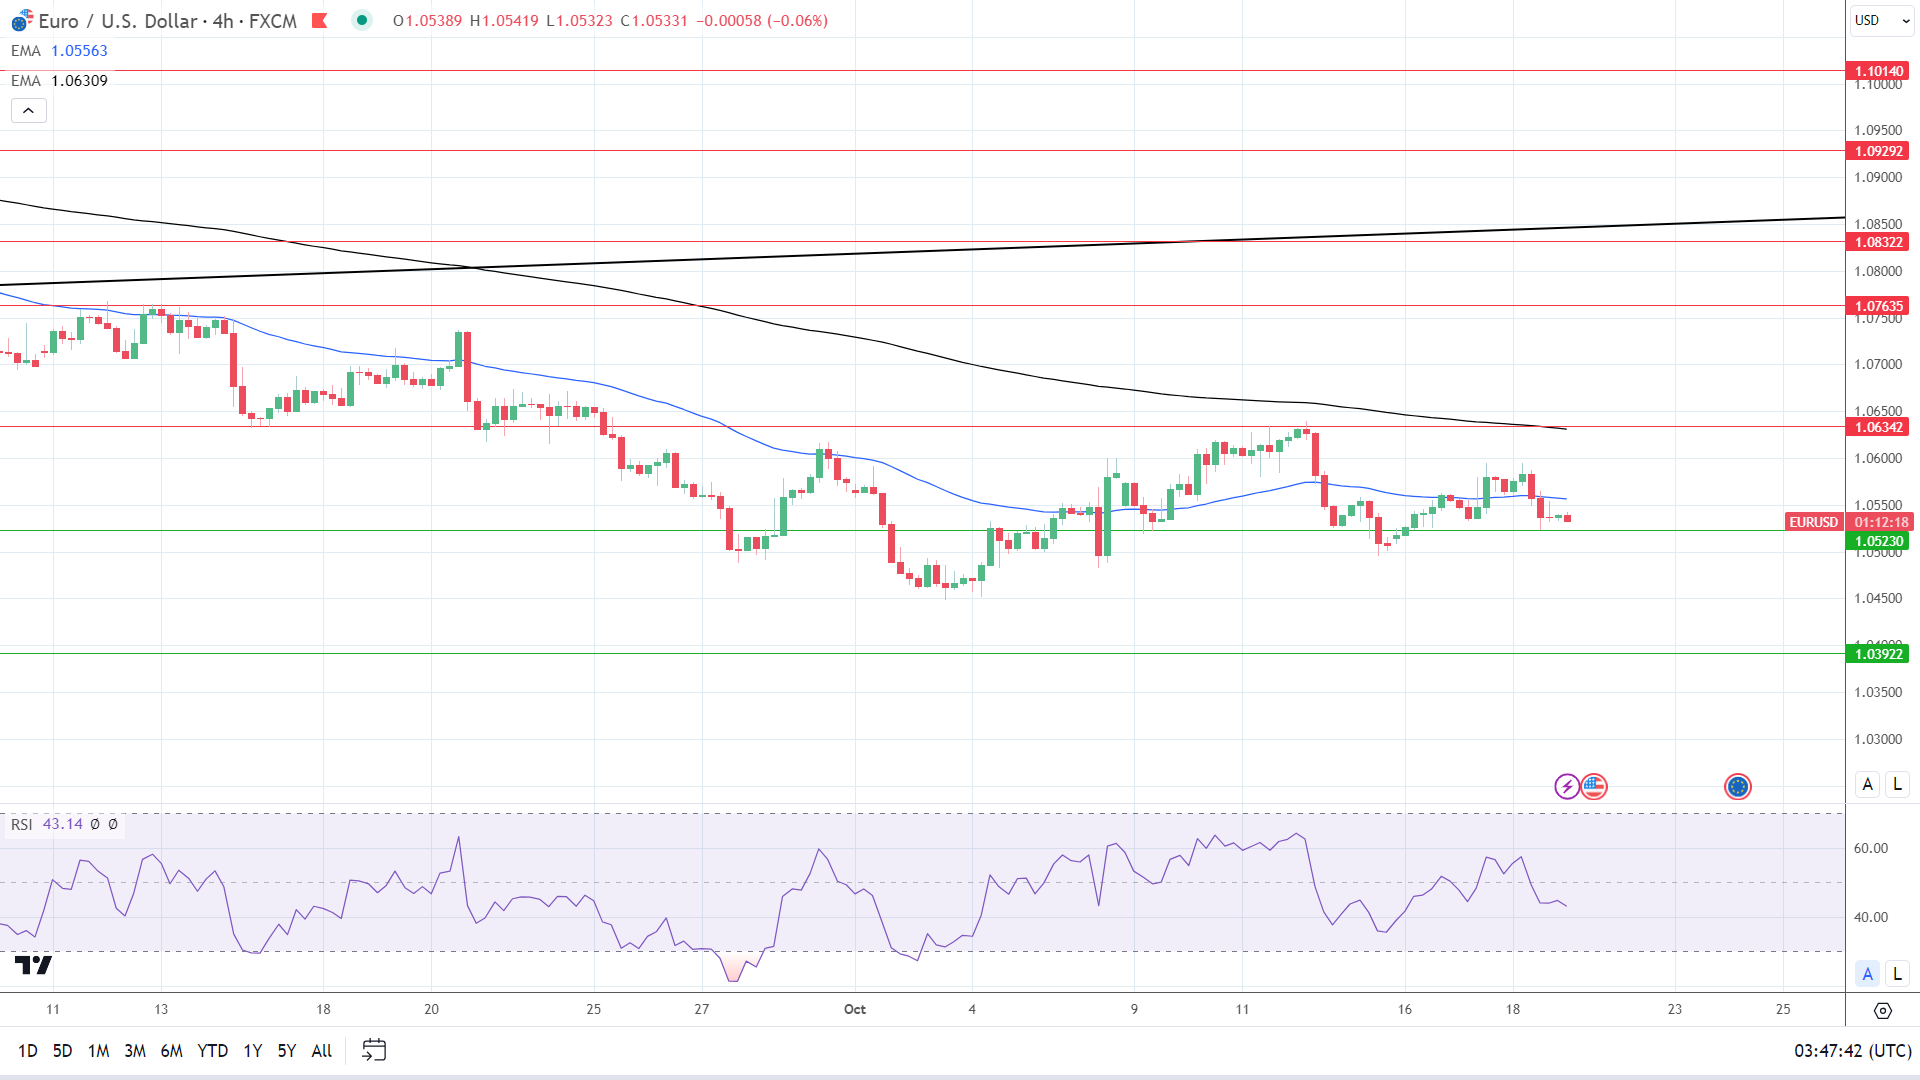
The EUR/USD hovers below the 50-day and 200-day EMAs, sending bearish price signals. A EUR/USD break above the 50-day EMA would support a move toward the 200-day EMA and $1.06342 resistance level.

However, selling pressure may intensify at the $1.06342 resistance level. The 200-day EMA is confluent with the resistance level,

A break below the $1.05230 support level would bring $1.0450 and the $1.03922 support level into view.

The 14-period RSI on the 4-hour chart, 43.14, indicates a EUR/USD fall through the $1.05230 support level before entering oversold territory.

4-Hourly Chart affirms bearish price signals.
EURUSD 191023 4 Hourly Chart
DAX Index: US Treasury Yields and the Middle East Conflict Signal a Bearish Open

DAX Index: US Treasury Yields and the Middle East Conflict Signal a Bearish Open

DAX Wednesday Overview

On Wednesday, the DAX declined by 1.03%. Reversing a 0.09% gain from Tuesday, the DAX ended the day at 15,095.

Middle East Conflict Overshadowed China Stats

Better-than-expected economic indicators from China supported a positive start to the day for the DAX. However, any market relief was brief.

Trading Derivatives carries a high level of risk to your capital and you should only trade with money you can afford to lose. Trading Derivatives may not be suitable for all investors, so please ensure that you fully understand the risks involved, and seek independent advice if necessary. A Product Disclosure Statement (PDS) can be obtained either from this website or on request from our offices and should be considered before entering into a transaction with us. Raw Spread accounts offer spreads from 0.0 pips with a commission charge of USD $3.50 per 100k traded. Standard account offer spreads from 1 pips with no additional commission charges. Spreads on CFD indices start at 0.4 points. The information on this site is not directed at residents in any country or jurisdiction where such distribution or use would be contrary to local law or regulation.

Sticky Eurozone inflation figures for September aligned with expectations of a higher-for-longer ECB interest rate path. A more hawkish interest rate path would likely exacerbate the euro area macroeconomic environment.

Rising 10-year US Treasury yields, stemming from the US retail sales figures, contributed to a pullback in the DAX. Concerns over a widening Middle East conflict added to the negative market sentiment.

Later in the day, housing sector numbers failed to move the dial, while FOMC member commentary drew interest. FOMC members continued to support a higher-for-longer interest rate trajectory.

US equities ended the day in negative territory on Wednesday. The Dow and the S&P 500 saw losses of 0.98% and 1.34%. The Nasdaq Composite Index slid by 1.62%

The Wednesday Market Movers

Adidas rallied 3.16% after cutting its projected loss for 2023 and raising its revenue forecast.

Sartorius AG ended the session with another hefty loss, falling 3.49%. On Friday, Sartorius AG tumbled by 13.28% after revising its full-year forecast.

Thursday Focus: Middle East and the Fed

Economic data from China will influence market risk sentiment for the second session. September house prices could fuel risk aversion. Economists forecast house prices to increase by 0.1% year-over-year. An unexpected decline would weigh on riskier assets. The real estate sector accounts for over 30% of the Chinese economy.

However, oil prices and 10-year US Treasury yields will likely continue to guide the markets on Thursday.

The Fed and the US Economic Calendar in the Spotlight

US economic indicators and Fed speeches also warrant consideration. US jobless claims and Philly Fed Manufacturing numbers will be in focus. Tighter labor market conditions would align with the market bets on a more hawkish Fed rate path.

FOMC member speeches will also move the dial. FOMC voting member Philip Jefferson is on the calendar to speak before the closing bell.

Beyond the economic calendar, corporate earnings and news updates from the Middle East will influence investor sentiment.

The futures markets point to a bearish start to the Thursday session. The DAX and the Nasdaq mini were down 72 and 11 points, respectively.

Short-Term Forecast

The Middle East conflict remains the key driver near-term. However, central bank policy intentions and the euro area economic backdrop remain considerations. Sticky inflation and hawkish monetary policy expectations would support the near-term bearish trend.

DAX Technical Indicators

Daily Chart

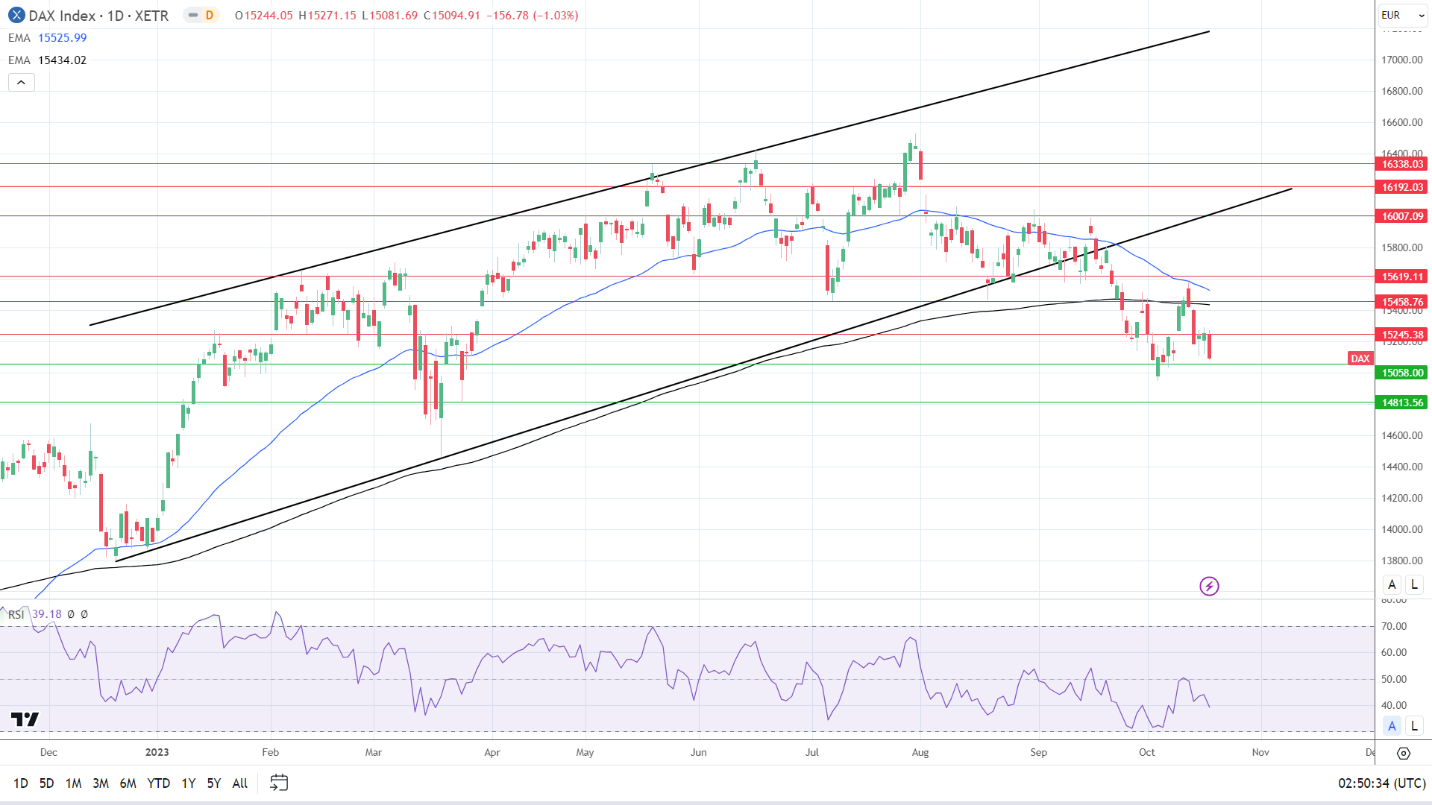
The DAX remained below the 50-day and 200-day EMAs, sending bearish price signals.

A breakout above the 15,245 resistance level could lead to a move towards the 200-day EMA and the 15,459 resistance level. Dovish fed commentary, and a de-escalation in the Middle East would drive demand for riskier assets.

However, hawkish Fed bets and an escalation in the Middle East conflict would leave the 15,058 support level in play.

The 14-day RSI reading of 39.18 indicates a DAX fall to the 15.058 support level before entering oversold territory.

DAX Daily Chart sends bearish price signals.

DAX 191023 Daily Chart

4-Hourly Chart

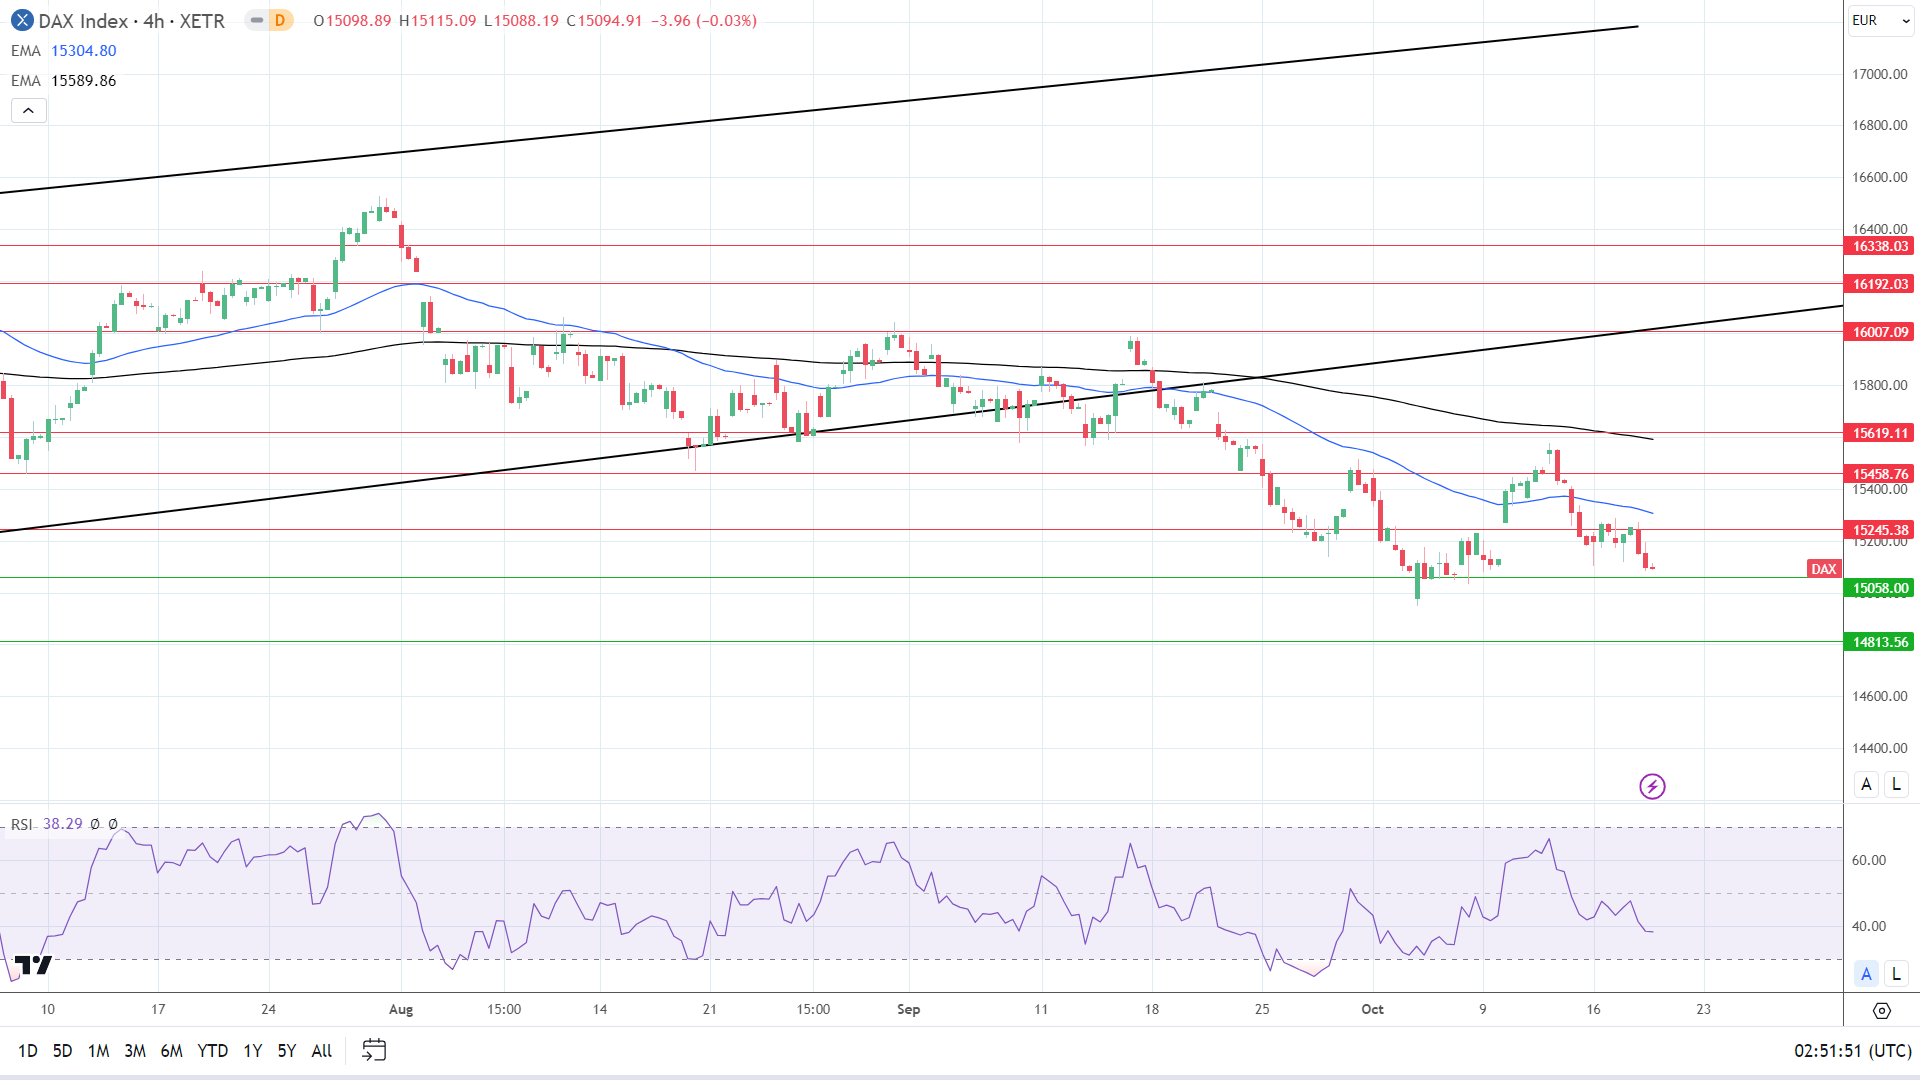
The DAX sits below the 50-day and 200-day EMAs, reaffirming bearish price signals. A DAX break below the 15,058 support level would support a fall below 15,000.

However, a DAX beak above the 15,245 resistance level would give the bulls a run at the 50-day EMA.

The 38.29 14-4 hour RSI reading indicates a DAX fall through the 15,058 support level before entering oversold territory.

4-Hourly Chart affirms bearish price signals.
DAX 191023 4-Hourly Chart
Oil Prices Forecast: Crude Stumbles as OPEC Snubs Iran’s Embargo Call

Oil Prices Forecast: Crude Stumbles as OPEC Snubs Iran’s Embargo Call

Oil Prices Fluctuate Amid Geopolitical Tensions and Policy Shifts

Benchmarks WTI and Brent oil markets are in the midst of a rollercoaster week, with prices initially softening on Monday and Tuesday before surging on Wednesday. The mid-week rally was fueled by Iran’s call for an oil embargo against Israel and a greater-than-anticipated reduction in U.S. oil stockpiles. Nevertheless, prices retreated late Wednesday and into Thursday as OPEC dismissed Iran’s call for an embargo and the U.S. indicated plans to ease sanctions on Venezuela.

Supply Concerns

Last week’s heightened tensions between Iran and Israel sparked fears of supply disruption, buoying oil prices. Iran’s push for an embargo, however, didn’t find favor with OPEC, easing those concerns. On the other side of the globe, the U.S. reported a sharp draw in oil inventories, implying that supplies were tightening. The Energy Information Administration (EIA) showed that U.S. crude inventories fell by 4.5 million barrels, while distillate stockpiles dropped by 3.2 million barrels.

Trading Derivatives carries a high level of risk to your capital and you should only trade with money you can afford to lose. Trading Derivatives may not be suitable for all investors, so please ensure that you fully understand the risks involved, and seek independent advice if necessary. A Product Disclosure Statement (PDS) can be obtained either from this website or on request from our offices and should be considered before entering into a transaction with us. Raw Spread accounts offer spreads from 0.0 pips with a commission charge of USD $3.50 per 100k traded. Standard account offer spreads from 1 pips with no additional commission charges. Spreads on CFD indices start at 0.4 points. The information on this site is not directed at residents in any country or jurisdiction where such distribution or use would be contrary to local law or regulation.

Demand Outlook

While geopolitical tensions added upward pressure on prices, the market found little respite. The U.S.’s plan to ease sanctions on Venezuela, an OPEC member, could potentially increase global supply, balancing out some of the demand-pull. However, this depends on Venezuela attracting the investments it needs to ramp up production, which is far from certain given years of under-investment and deteriorated infrastructure.

U.S.-Venezuela Policy Shift

The U.S. issued a six-month license to authorize transactions in Venezuela’s energy sector, aiming to improve oil flows and counter high prices. The move is more expansive than expected, allowing global energy firms to work with state-run PDVSA without needing individual licenses. But experts caution that Venezuela’s exports won’t significantly offset global cuts without sustained investment.

Short-Term Forecast

Given the unresolved geopolitical tensions and the uncertain impact of U.S. policy changes on Venezuelan oil supply, the market remains volatile. Short-term, we’re looking at a neutral to bearish outlook as the various factors pulling the market in opposite directions seem likely to cancel each other out.

This high-stakes game of supply and demand leaves traders treading cautiously, making it all the more important to keep an eye on the evolving geopolitical landscape and policy shifts.

Technical Analysis


Light Crude Oil Futures


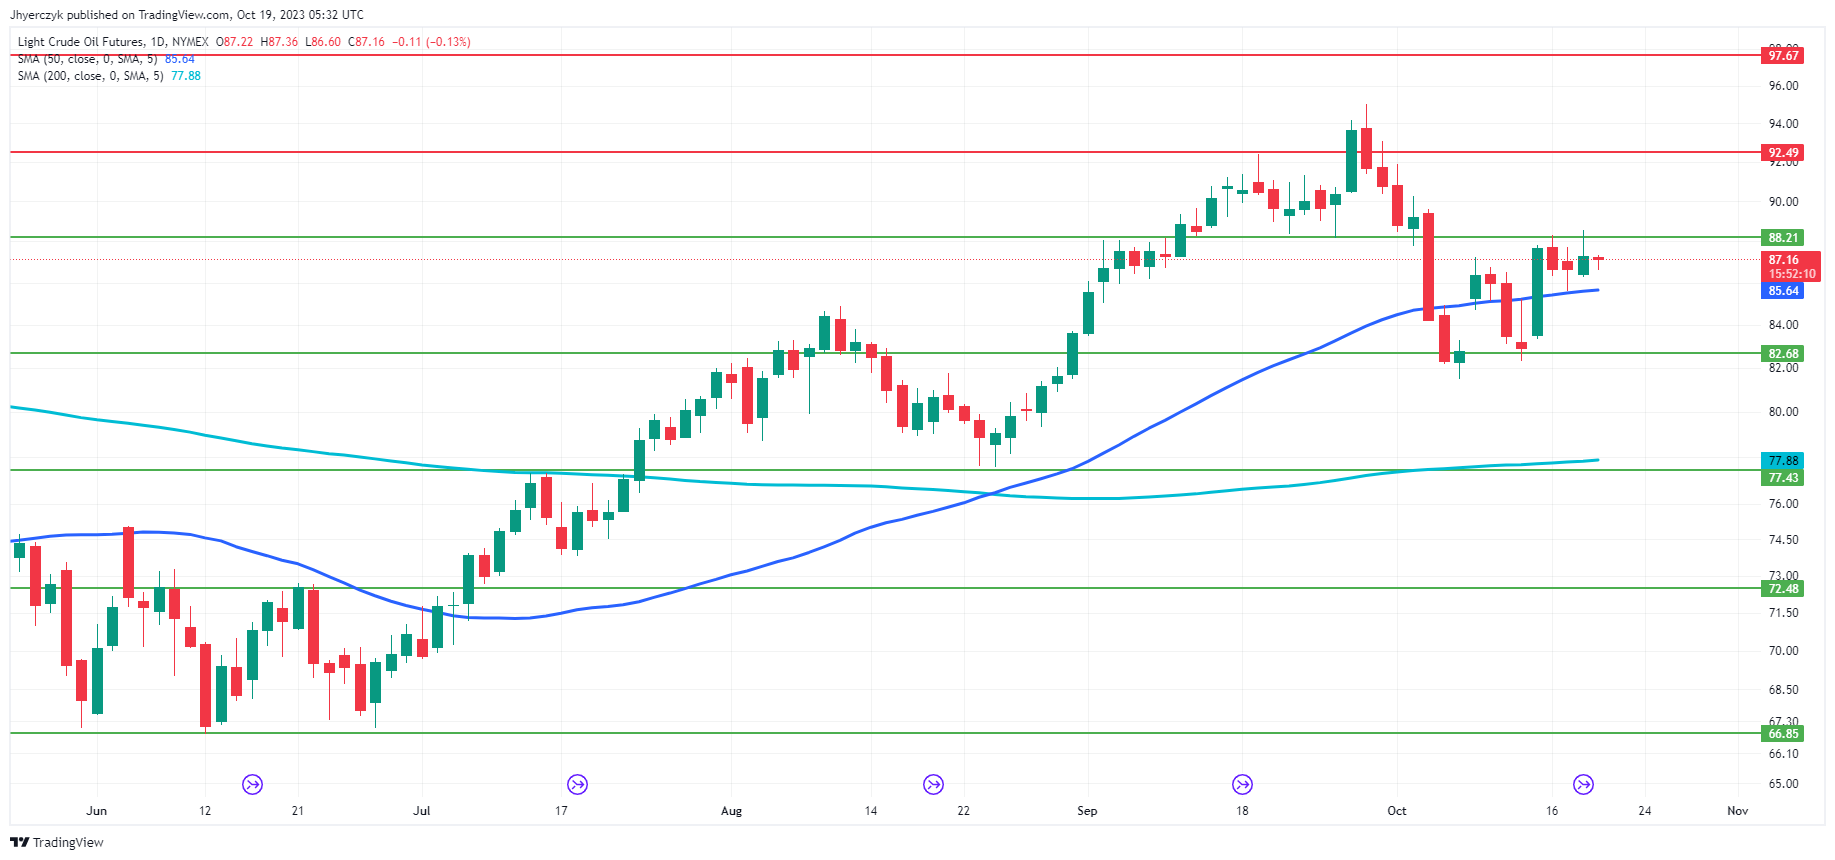
The current daily price of light crude oil futures at $87.14 is above both the 200-day and 50-day moving averages, at $77.88 and $85.64 respectively, signaling bullish momentum. However, the price is sandwiched between minor support at $82.68 and minor resistance at $92.49, suggesting a lack of decisive movement.

Main support and resistance levels stand at $77.43 and $97.67, which act as crucial barriers for significant trend reversals.

The market sentiment appears cautiously bullish, contingent on breaking the minor resistance to confirm the upward trend.

Silver Prices Forecast: XAG/USD Defies Treasury Yield Surge Amid Middle East Crisis as Powell’s Speech Looms

Silver Prices Forecast: XAG/USD Defies Treasury Yield Surge Amid Middle East Crisis as Powell’s Speech Looms

Silver’s Sudden Shine

Despite soaring Treasury yields and a robust U.S. dollar, silver (XAG/USD) prices are nearing a 1-month high. The geopolitical landscape, marked by escalating tensions in the Middle East, has driven investors towards this safe-haven asset. With Federal Reserve Chair Jerome Powell’s upcoming speech, market participants are keeping an eye on the asset’s next move.

Holding Steady Amid Chaos

Investors were already shifting towards silver following recent turmoil in the Middle East, which significantly derailed diplomatic talks. U.S. President Joe Biden’s recent trip to the region did little to quell concerns. Silver, considered a secure store of value in times of crisis, has surged roughly 10% since its seven-month low in early October.

Trading Derivatives carries a high level of risk to your capital and you should only trade with money you can afford to lose. Trading Derivatives may not be suitable for all investors, so please ensure that you fully understand the risks involved, and seek independent advice if necessary. A Product Disclosure Statement (PDS) can be obtained either from this website or on request from our offices and should be considered before entering into a transaction with us. Raw Spread accounts offer spreads from 0.0 pips with a commission charge of USD $3.50 per 100k traded. Standard account offer spreads from 1 pips with no additional commission charges. Spreads on CFD indices start at 0.4 points. The information on this site is not directed at residents in any country or jurisdiction where such distribution or use would be contrary to local law or regulation.

Economic Indicators and Rates

Data releases, such as better-than-expected retail sales and sluggish housing starts, have fueled uncertainty over the Fed’s interest rate path. Although economists anticipate that the Fed will maintain rates during their November 1 meeting, market sentiment hints at a potential rate hike in December. Yet, even with the 10-year Treasury yield hitting a multiyear high, silver has held its ground.

Bond Yields and Silver Dynamics

Rising bond yields usually dampen the allure of non-yielding assets like silver. The 10-year Treasury yield recently soared to its highest level since 2007, triggering concerns about tighter economic conditions. While silver’s gains could be limited under these circumstances, the asset’s resilience is noteworthy, considering market anticipation of further escalation in the Middle East.

Short-Term Outlook

The outlook for silver favors the bull, with geopolitical tension acting as a key driver. If the Middle East crisis exacerbates, expect silver to extend its rally. Conversely, any easing of geopolitical concerns may dent the metal’s recent gains, especially with the U.S. dollar holding strong and bond yields climbing.

Technical Analysis

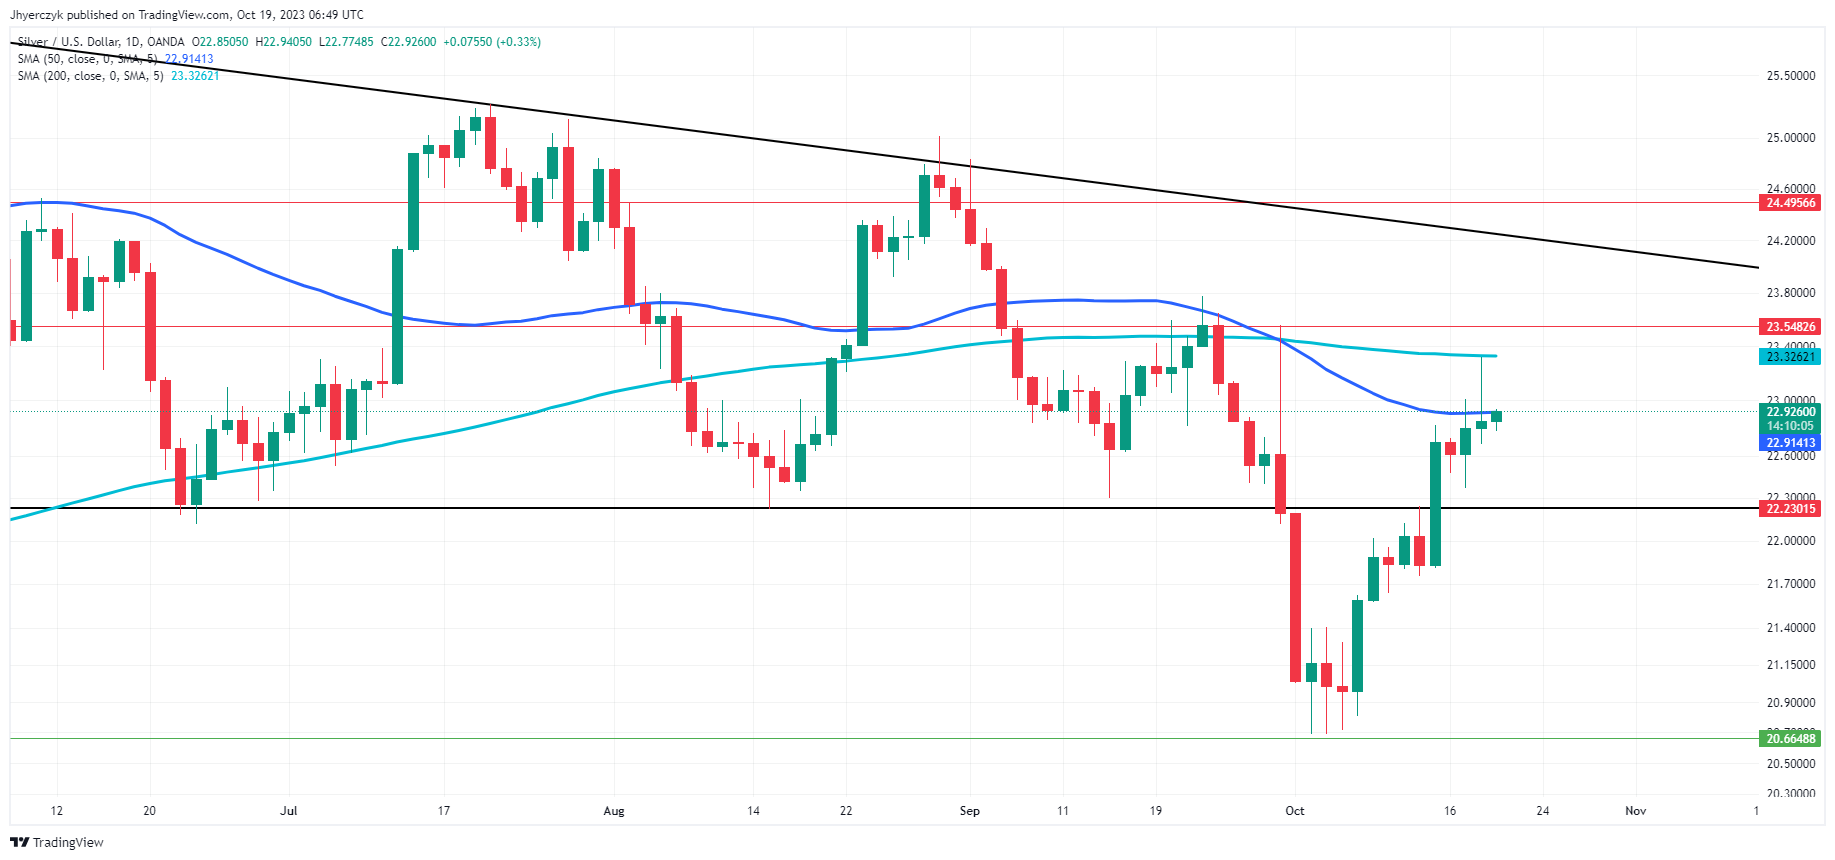
Daily Silver (XAG/USD)The current daily price of silver (XAG/USD) at 22.93 sits marginally above its 50-day moving average of 22.91 but below its 200-day moving average of 23.33, signaling a mixed sentiment.

The price is inching closer to the minor resistance level at 23.55, which if breached, may target the trend line resistance at 24.25.

On the flip side, the trend line support at 22.23 remains a crucial level to watch, as breaking it could lead to a test of the minor support at 20.66.

Although confined between the two moving averages, the market is leaning toward the slightly bullish side, especially since the asset has managed to sustain its rally above its immediate trend line support.