New York Manufacturing Dips but Optimism Holds Steady

New York Manufacturing Dips but Optimism Holds Steady

New York Manufacturing Takes a Hit, Yet Optimism Lingers

Manufacturing in New York State took a dip in October, evidenced by a seven-point decline in the general business conditions index to -4.6. The drop was underscored by a fall in new orders and stagnant shipments. While 24% of firms surveyed indicated improved conditions, 29% reported a downturn.

Inventory Levels and Supply Chain

Inventories remained nearly steady, with the index registering just below zero at -2.1. Unfilled orders declined significantly, reflected by an index score of -19.1. Coupled with this, delivery times shortened, as indicated by the -6.4 index rating, suggesting some ease in supply chain issues.

Employment and Pricing Dynamics

The labor market saw marginal improvement, with both employment levels and average workweek hours ticking up. Despite the downturn in manufacturing, the prices paid index held firm at 25.5, pointing to stable input costs. However, the selling prices showed a moderation, with the prices received index falling to 11.7.

Future Outlook

Firms maintained a relatively upbeat view of the six-month horizon, though the future business conditions index slipped three points to 23.1. Anticipations for new orders, shipments, and employment were cautiously optimistic, although slightly less so than in the previous month.

Short-Term Forecast: Neutral to Bearish

Despite the slump in current conditions, firms exhibit a degree of optimism for the near future. However, given the prevailing downward trajectory in several key indicators, the short-term outlook for New York State’s manufacturing sector tilts more towards neutral to bearish.

Cable at the Mercy of the Dollar, UK jobs and Inflation Data Next

Cable at the Mercy of the Dollar, UK jobs and Inflation Data Next

Pound Sterling’s Countertrend rise is at risk after Sticky US CPI Report Lifts USD

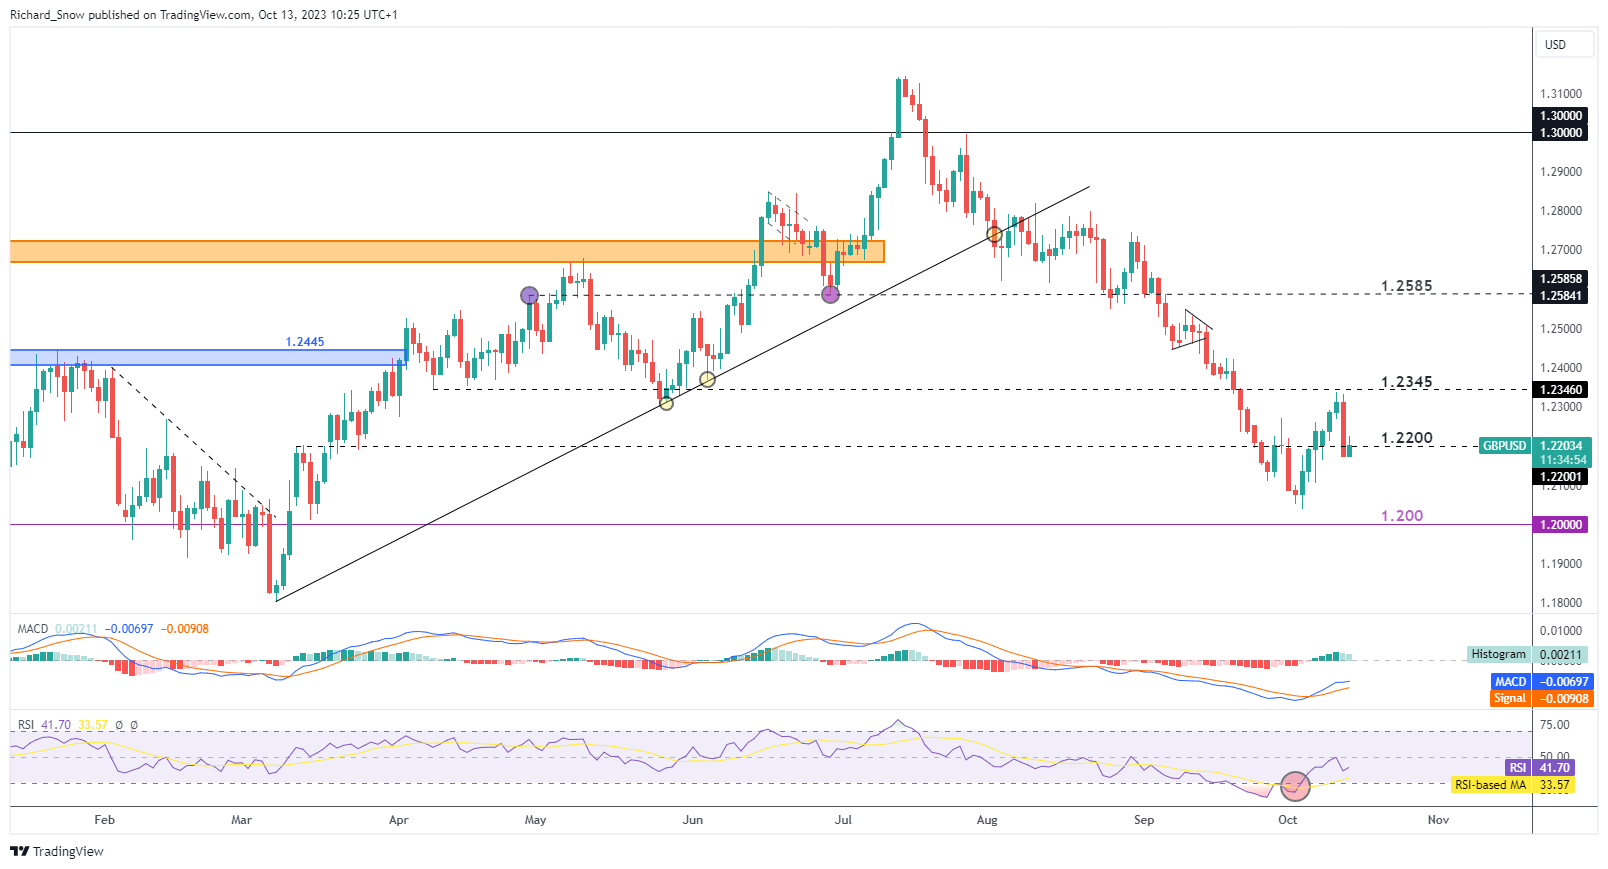
Stickier inflation in the US prompted a lift in the US dollar yesterday, with the ripple effect bringing an end to the recent countertrend move across major FX pairs vs the dollar. Cable is no different, seeing the pair surrender some of the recent gains after failing to breach the 1.2345 level.

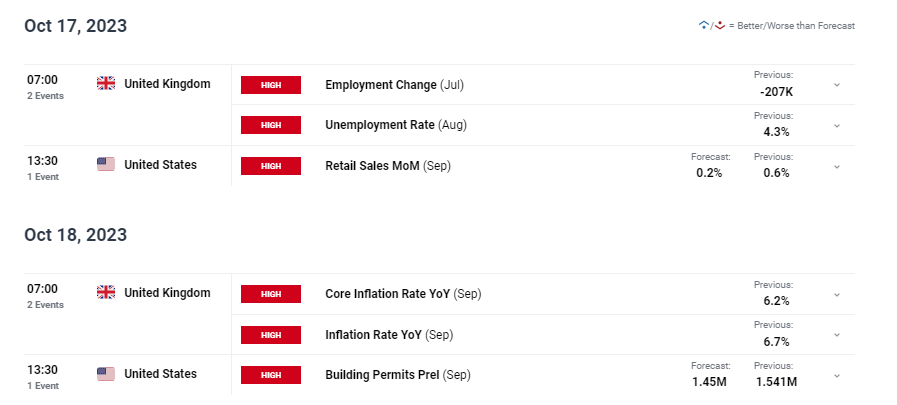
Next week presents an opportunity for local UK developments to drive the pair, something that has been absent for some time now, as UK unemployment and inflation data comes due. The UK has experienced a moderate easing in the job market of late and this week’s IMF World Economic Outlook revealed challenges to growth this year and particularly in 2024. These developments should help contain inflation but higher energy prices have threatened to reignite upside risks to inflation.

Heading into the last day of trade, GBP/USD tests the psychological level of 1.2200. Achieving such a feat may delay a continuation of the longer term downtrend but a close below suggests further pain for cable bears. Support resides at 1.2000.

GBP/USD Daily Chart

image1.png

With the Bank of England appearing content with the recent disinflation and easing in the UK jobs market, is there a case for further selling pressure in the final quarter of 2023? Read our Pound Sterling Q4 forecast below:

IG Client Sentiment Reveals Notable Divergence in Positioning vs Trend

GBP/USD:Retail trader data shows 72.56% of traders are net-long with the ratio of traders long to short at 2.64 to 1.

We typically take a contrarian view to crowd sentiment, and the fact traders are net-long suggests GBP/USD prices may continue to fall.

Read the full IG sentiment report based off actual client positioning data to find out why the contrarian indicator issues a bearish GBP/USD-bearish trading bias.

For more on how to understand the popular contrarian indicator, read our dedicated guide below:

Major Risk Events for the Week Ahead

Keep an eye on average earnings which reached an impressive 8.5% previously and remains way too hot for the Bank of England’s liking. The bank is next to meet in early November but appears content with rates at current levels. Unemployment data and UK CPI data provides further insight into the effectiveness of past rate hikes which will have a knock on effect on the pound.

image3.png

Crypto News: Bitcoin-Spot ETF Optimism a Much-Needed Tailwind

Crypto News: Bitcoin-Spot ETF Optimism a Much-Needed Tailwind

US Bitcoin Spot ETFs Could Be on the Crypto Horizon

Investor optimism toward the SEC approving BTC-spot ETFs delivered positive gains for BTC and the broader market.

Bloomberg Intelligence ETF Analyst James Seyffart recently raised the chances of a crypto-spot ETF approval. Seyffart put the probability of the SEC approving the Ark BTC-spot ETF application at 90%. The deadline for a decision is January 10, 2024.

Trading Derivatives carries a high level of risk to your capital and you should only trade with money you can afford to lose. Trading Derivatives may not be suitable for all investors, so please ensure that you fully understand the risks involved, and seek independent advice if necessary. A Product Disclosure Statement (PDS) can be obtained either from this website or on request from our offices and should be considered before entering into a transaction with us. Raw Spread accounts offer spreads from 0.0 pips with a commission charge of USD $3.50 per 100k traded. Standard account offer spreads from 1 pips with no additional commission charges. Spreads on CFD indices start at 0.4 points. The information on this site is not directed at residents in any country or jurisdiction where such distribution or use would be contrary to local law or regulation.

Seyffart attributed the 90% chance of approval to recent updates to the Bitcoin Spot ETF prospectus, which added at least five pages of new content. Notably, Seyffart believes the new content signaled “a constructive conversation with the SEC – a step that typically occurs when a fund is on its way to being approved.”

Seyffart also discussed the Grayscale application, saying,

“Dialogue between Grayscale and SEC should begin next week. Hoping for more info on next steps sometime next week or week after?”

UAE Unveils White Paper on Metaverse Regulations

The United Arab Emirates (UAE) AI Office published a whitepaper, Responsible Metaverse Self-Governance Framework. The UAE AI Office worked with OKX to prepare the whitepaper.

On Friday, OKX issued a press release,

“OKX, a leading Web3 technology company, is pleased to announce that it contributed to the whitepaper on Responsible Metaverse Self-Governance published by the Minister of State for Artificial Intelligence, Digital Economy, and Remote Work Applications Office of the United Arab Emirates.”

The statement went on to say,

“The paper stresses the importance of international cooperation to establish self-regulatory principles that ensure the metaverse’s transparent, safe, and ethical operation.”

The whitepaper estimated investments of more than $120 billion in the metaverse by mid-2022. Notably, the Dubai Metaverse Strategy estimates the metaverse will add $4 billion to its economy and support 42,000 jobs by 2030.

Technical Analysis

Bitcoin Analysis

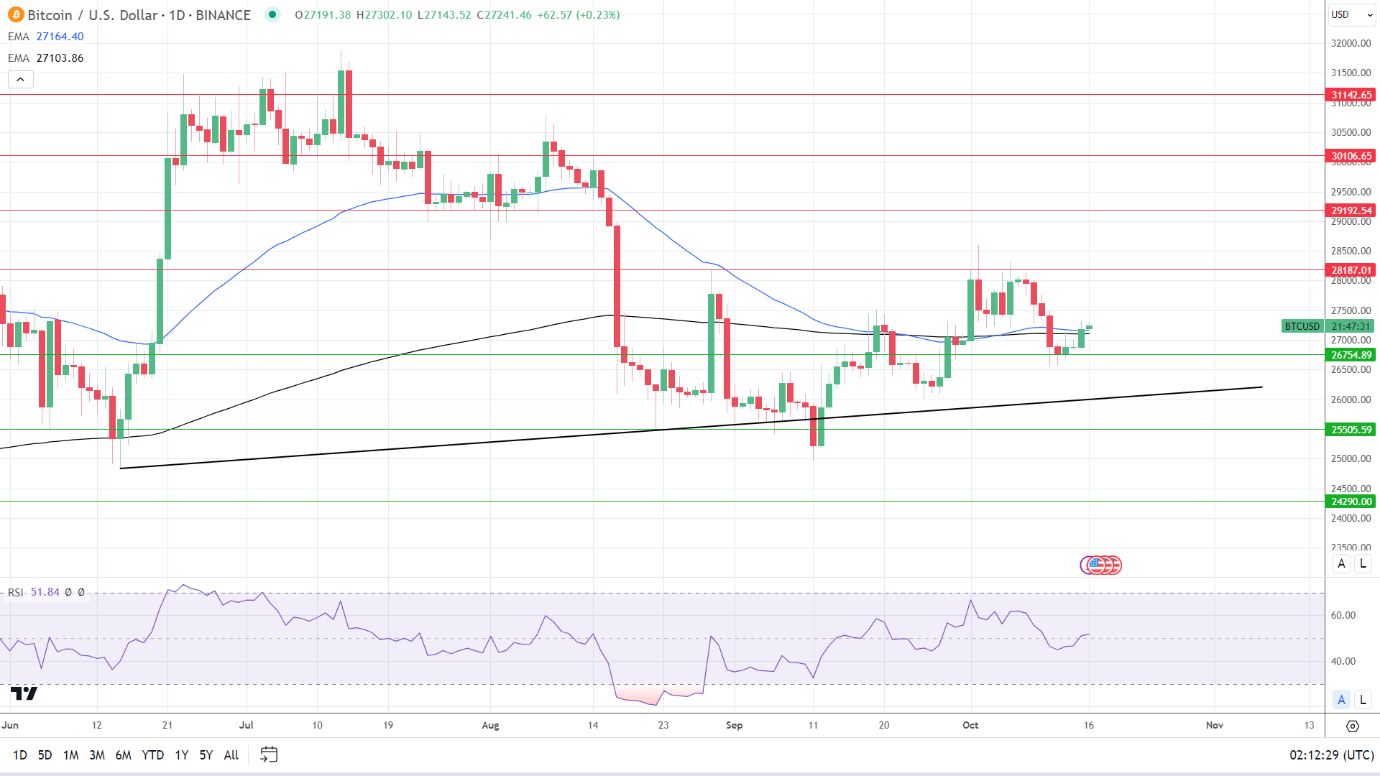
BTC sat above the 50-day and 200-day EMAs, sending bullish price signals. Significantly, the 50-day EMA avoided a bearish cross through the 200-day EMA.

A BTC return to $27,500 would support a move toward the $28,187 resistance level. Positive sentiment toward the SEC approval of one, some, or all of the BTC-spot ETF applications would drive buyer appetite for BTC.

However, a break below the 50-day and 200-day EMAs would bring the $26,755 support level into play. Risk aversion stemming from the Middle East conflict and a hawkish Fed would test buyer appetite.

The 14-Daily RSI reading of 51.84 indicates a BTC return to $28,000 before entering overbought territory.

BTC Daily Chart sends bullish price signals.
BTCUSD 161023 Daily Chart

Ethereum Analysis

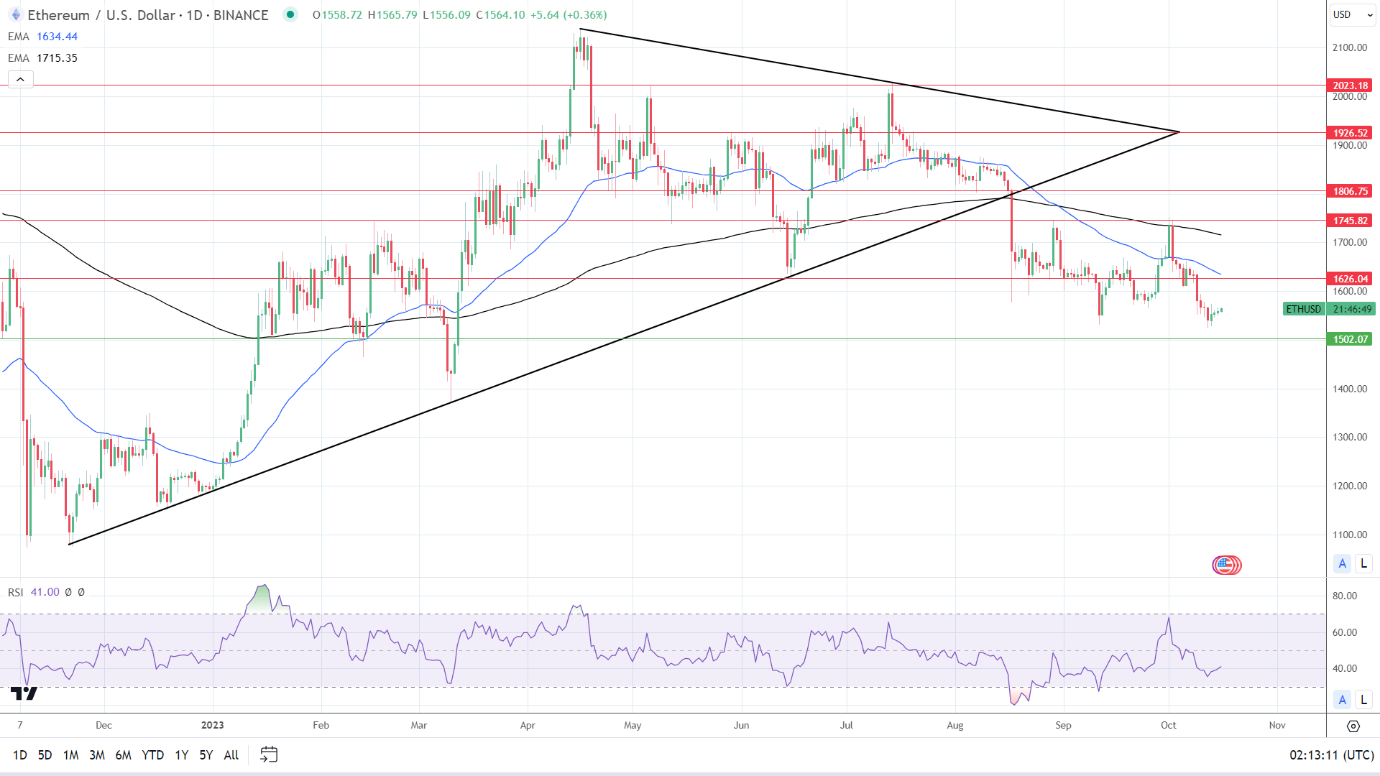
ETH stayed below the 50-day and 200-day EMAs, reaffirming bearish price signals.

An ETH return to $1,600 would support a break above the $1,626 resistance level. Crypto regulatory chatter and ETH-spot ETF-related news updates will influence investor sentiment.

However, a fall through the $1,502 support level would give the bears a run at $1,450.

The 14-Daily RSI reading of 41.00 suggests an ETH fall to the $1,502 support level before entering oversold territory.

ETH Daily Chart sends bearish price signals.
ETHUSD 161023 Daily Chart
DAX Index: German Wholesale Prices, Central Banks, and the Middle East in Focus

DAX Index: German Wholesale Prices, Central Banks, and the Middle East in Focus

DAX Friday Overview

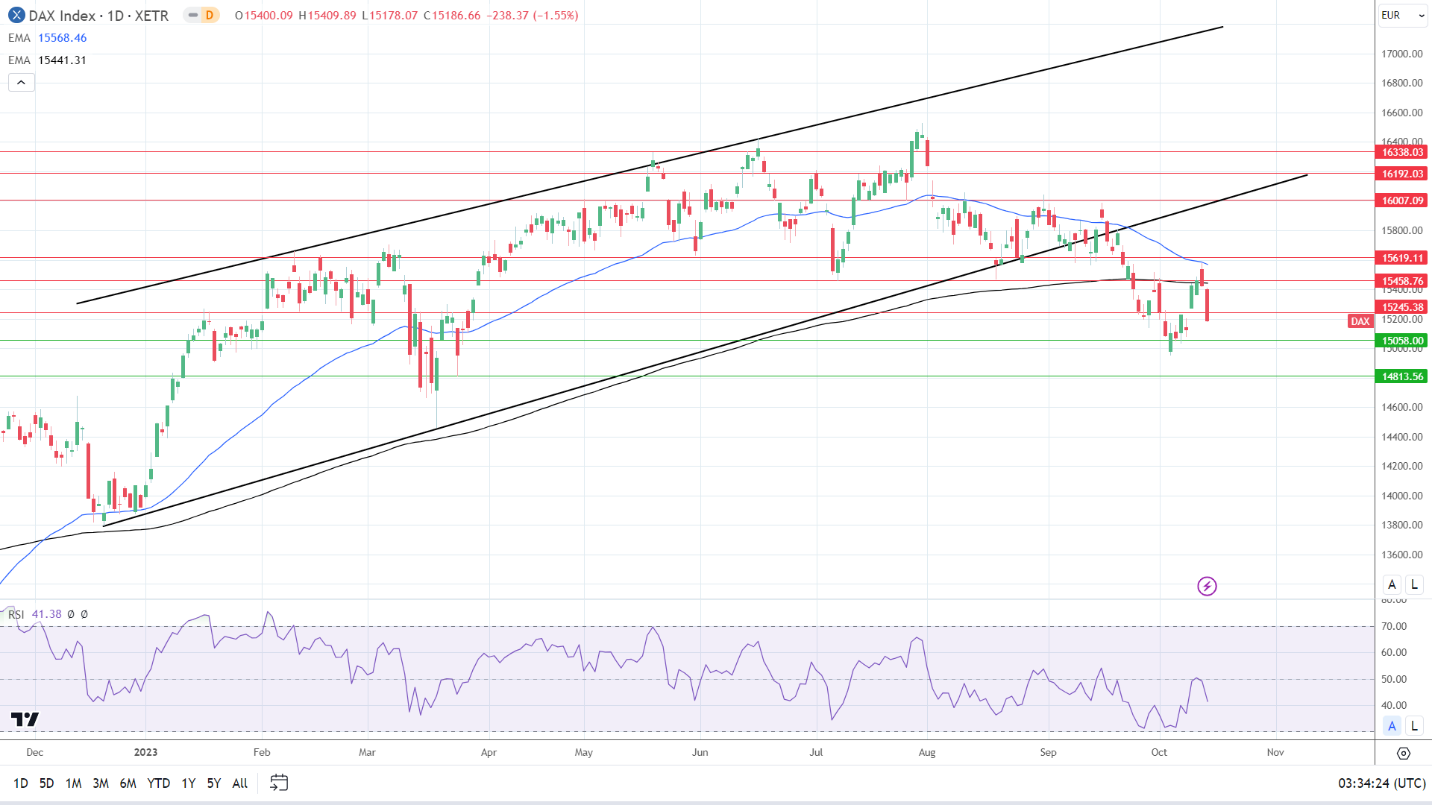
On Friday, the DAX tumbled by 1.55%. Following a 0.23% loss on Thursday, the DAX ended the day at 15,187.

US CPI Report and Fed Speeches Affected the Friday Session

Euro area economic indicators took a back seat on Friday. Investors continued to react to the hotter-than-expected US CPI Report and hawkish Fed comments.

Trading Derivatives carries a high level of risk to your capital and you should only trade with money you can afford to lose. Trading Derivatives may not be suitable for all investors, so please ensure that you fully understand the risks involved, and seek independent advice if necessary. A Product Disclosure Statement (PDS) can be obtained either from this website or on request from our offices and should be considered before entering into a transaction with us. Raw Spread accounts offer spreads from 0.0 pips with a commission charge of USD $3.50 per 100k traded. Standard account offer spreads from 1 pips with no additional commission charges. Spreads on CFD indices start at 0.4 points. The information on this site is not directed at residents in any country or jurisdiction where such distribution or use would be contrary to local law or regulation.

Inflation and trade data from China added to the negative sentiment. A twelfth consecutive monthly fall in year-over-year producer prices reflected the ongoing weak demand environment. A less marked fall in exports failed to offer comfort.

Later in the European session, a slump in US consumer sentiment amid heightening inflation jitters weighed on the appetite for riskier assets. However, the market fear of other nations joining the Middle East conflict contributed to the losses.

On Friday, the Nasdaq Composite Index and the S&P 500 ended the session down 1.23% and 0.50%. The Dow gained 0.12%.

Economic Indicators, Central Banks, and the Middle East in Focus

On Monday, German wholesale prices for August will kickstart the week for the DAX. A sharp fall in wholesale prices would signal a weakening demand environment. Firms reduce prices to win contracts in a low activity backdrop, which would align with expectations of a German recession.

Economists forecast German wholesale prices to fall by 4.2% year-over-year in September (August: -2.7%).

Later in the morning session, Eurozone trade data will also garner investor interest. Economists forecast the trade surplus to widen from €6.5 billion to €12.5 billion in August. Export figures and trade terms with key trading partners, including China and the US, will be focal points.

Beyond the numbers, ECB President Christine Lagarde and Executive Board members Andrea Enria and Anneli Tuominen are on the calendar to speak. Forward guidance favoring ECB rate hikes would weigh on buyer appetite for DAX-listed stocks.

However, Fed speeches and US economic indicators also warrant consideration. FOMC member Patrick Harker is on the economic calendar to speak. A pivot to a more hawkish outlook on interest rates would support more hawkish Fed interest rate bets.

While Fed speeches will remain the focal point, NY Empire State Manufacturing Index numbers may move the dial. Economists forecast the Index to fall from 1.9 to -7.0 in October. A larger-than-expected decline may spook investors and reignite fears of a hard landing.

The DAX was down 3 points, while the Nasdaq mini was up 38 points this morning.

Short-Term Forecast

Near-term trends for the DAX hinge on ECB and Fed forward guidance amid an elevated inflation environment. Economic indicators from Germany and news updates on the Middle East conflict will influence investor sentiment.

DAX Technical Indicators

Daily Chart

The DAX sat below the 50-day and 200-day EMAs, sending bearish price signals.

A break above the 15,245 resistance level would support a move toward the 200-day EMA and 15,459 resistance level. Selling pressure will likely intensify at 15,440. The 200-day EMA is confluent with the 15,459 resistance level.

Better-than-expected German wholesale prices and Eurozone trade data would drive buyer demand. However, hawkish ECB and central bank chatter and an escalation in the Middle East conflict would impact market risk appetite.

Failure to move through the 15,245 resistance level would support a move to the 15,058 support level.

The 14-day RSI reading of 41.38 indicates a DAX fall to the 15,058 support level before entering oversold territory.

DAX Daily Chart sends bearish price signals.
DAX 161023 Daily Chart

4-Hourly Chart

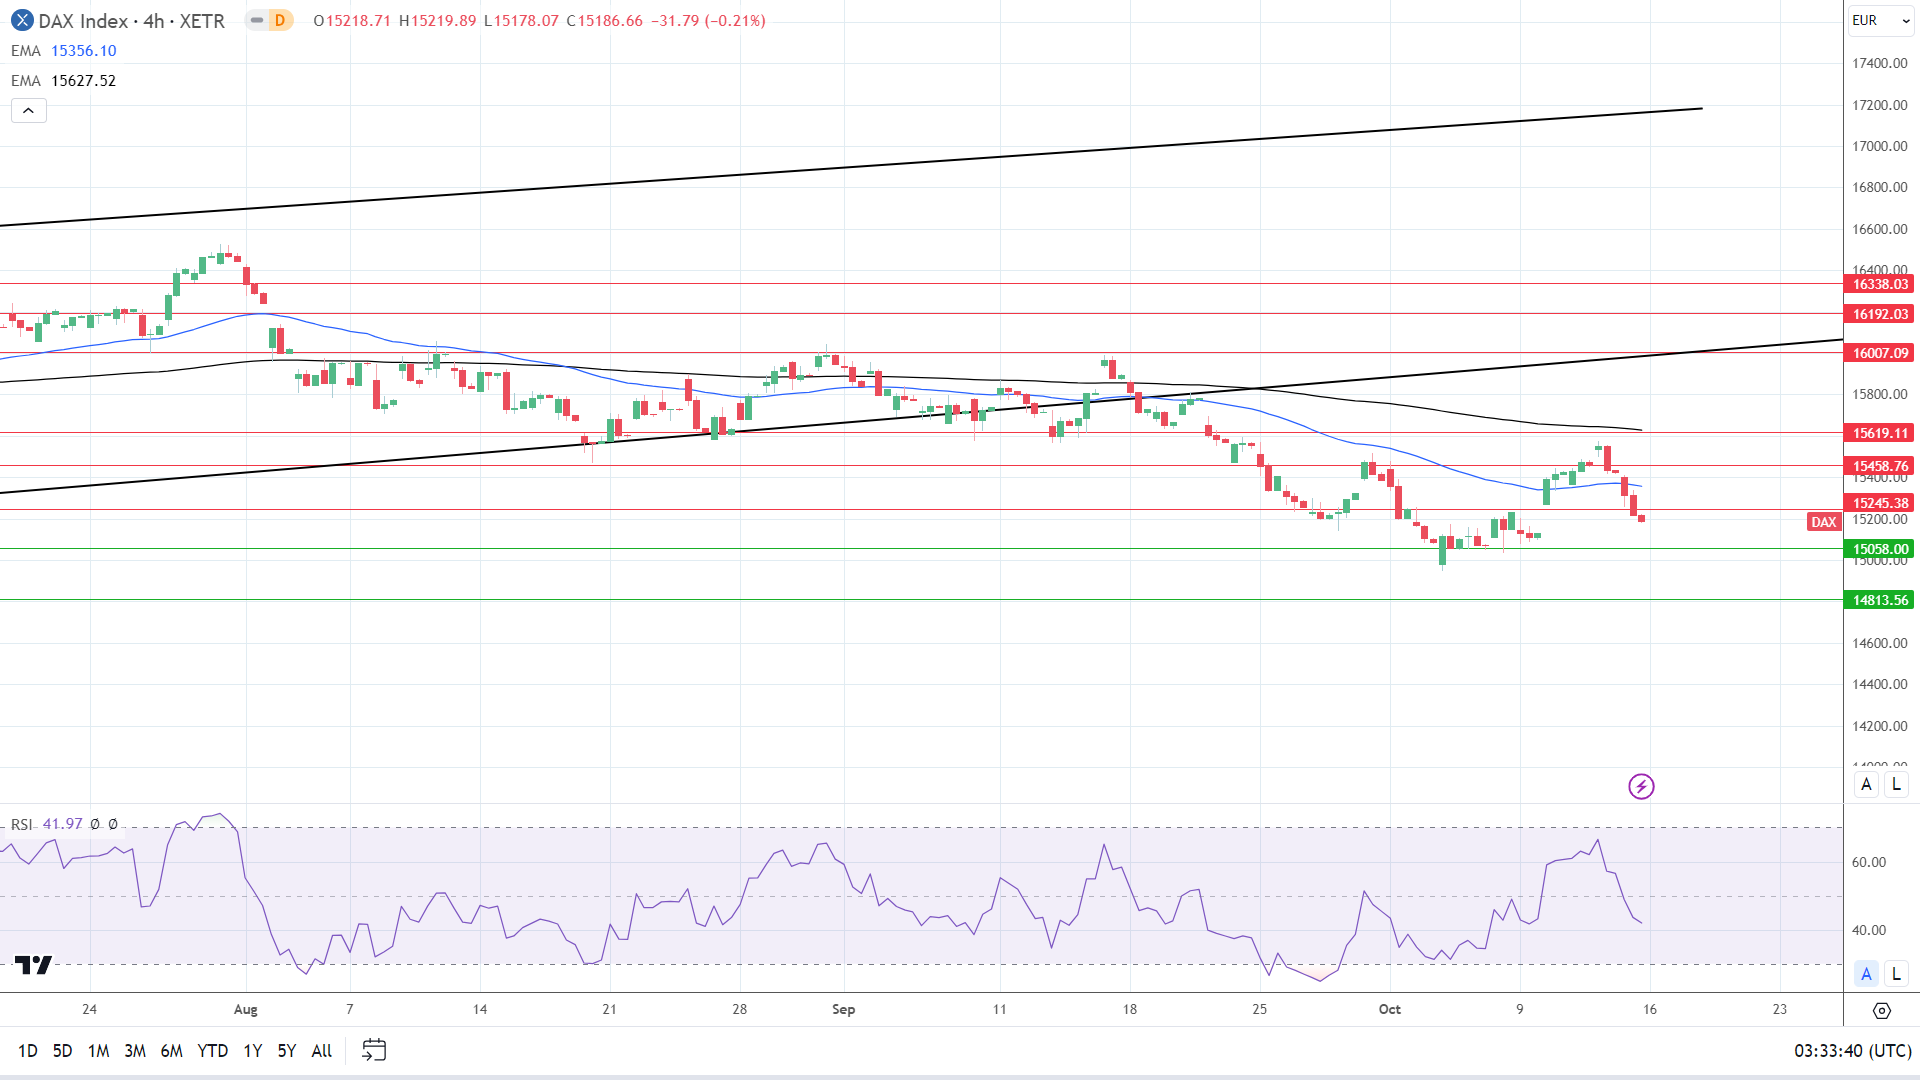
The DAX sits below the 50-day and 200-day EMAs, sending bearish price signals. A DAX break above the 15,245 resistance level would support a move to the 50-day EMA.

However, a drop below 15,100 would bring the 15,058 support level into play.

The 41.97 14-4 hour RSI reading indicates a DAX fall to the 15,058 support level before entering oversold territory.

4-Hourly Chart affirms bearish price signals.
DAX 161023 4-Hourly Chart
EUR USD Forecast: The ECB, the Fed, Economic Indicators, and Geopolitics in Focus

EUR USD Forecast: The ECB, the Fed, Economic Indicators, and Geopolitics in Focus

Friday Overview

On Friday, the EUR/USD declined by 0.20%. Following a 0.86% loss on Thursday, the EUR/USD ended the day at $1.05067. The EUR/USD rose to a high of $1.05585 before falling to a low of $1.04953.

German Wholesale Prices and ECB President Lagarde in Focus

German wholesale prices for September kickstart a tricky session for the EUR/USD. A sharp decline in wholesale prices would reflect a weaker demand environment. In a deteriorating demand environment, firms cut prices to win new contracts. Economists forecast wholesale prices to decline by 4.2% year-over-year vs. -2.7% in August.

Trading Derivatives carries a high level of risk to your capital and you should only trade with money you can afford to lose. Trading Derivatives may not be suitable for all investors, so please ensure that you fully understand the risks involved, and seek independent advice if necessary. A Product Disclosure Statement (PDS) can be obtained either from this website or on request from our offices and should be considered before entering into a transaction with us. Raw Spread accounts offer spreads from 0.0 pips with a commission charge of USD $3.50 per 100k traded. Standard account offer spreads from 1 pips with no additional commission charges. Spreads on CFD indices start at 0.4 points. The information on this site is not directed at residents in any country or jurisdiction where such distribution or use would be contrary to local law or regulation.

Later in the Monday session, Eurozone trade data also warrants consideration. Economists predict the Eurozone trade surplus to widen from €6.5 billion to €12.5 billion in August. An increase in exports would suggest an improving demand environment. However, investors must also consider trade terms with key trading partners, including China and the US.

Beyond the numbers, ECB President Lagarde and Executive Board members Andrea Enria and Anneli Tuominen are on the calendar to speak. Forward guidance on the economic outlook, inflation, and interest rates would move the dial.

NY Empire State Manufacturing Index and the Fed in Focus

The NY Empire State Manufacturing Index numbers for October will garner investor interest. While the US manufacturing sector contributes less than 25% to US GDP, investors will likely react to a slump in sector activity. Cracks in the US economy could reignite fears of a hard landing.

After the recent US consumer price inflation numbers, Fed speeches need consideration. FOMC member Patrick Harker is on the economic calendar to speak. On Friday, Harker favored leaving rates unchanged. A pivot to a hawkish policy stance would influence the buyer appetite for the US dollar.

Away from the economic calendar, updates on the Middle East conflict will influence market risk sentiment. The threat of other nations joining the conflict would fuel demand for the US dollar.

Short-Term Forecast:

Near-term EUR/USD trends hinge on central bank comments, economic indicators, and geopolitics. A sturdier US economy and hawkish Fed bets will continue to test buyer appetite for the EUR/USD.

EUR/USD Price Action

Daily Chart

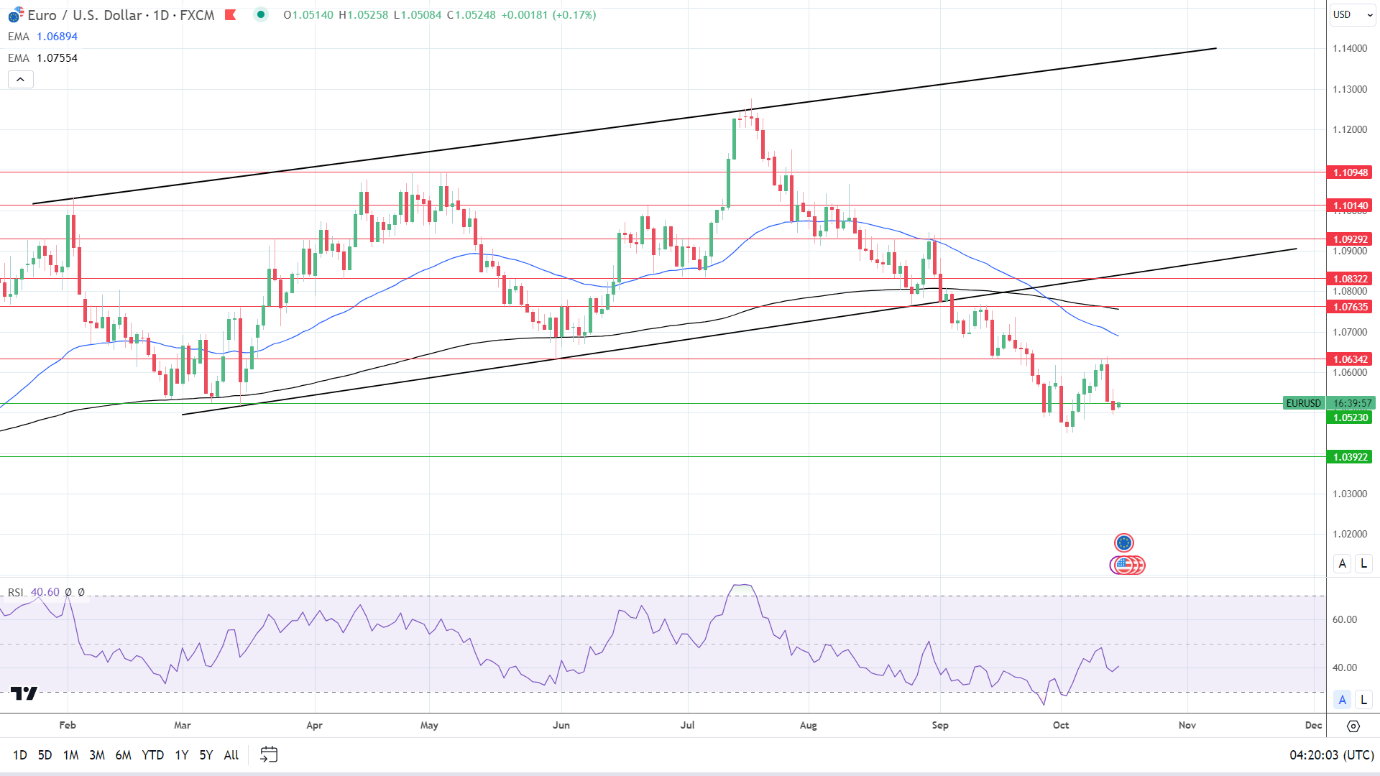
The EUR/USD sat below the 50-day and 200-day EMAs, affirming bearish price signals.

A EUR/USD fall through the $1.05230 support level would bring the $1.03922 support level into view. Geopolitical tensions and hawkish Fed comments would affect the appetite for the EUR/USD.

However, hawkish ECB chatter and easing geopolitical tensions would support a move toward the $1.06342 resistance level.

The 14-period Daily RSI, 40.60, supports a EUR/USD fall to $1.04500 before entering oversold territory.

EUR/USD Daily Chart sends bearish price signals.
EURUSD 161023 Daily Chart

4-Hour Chart

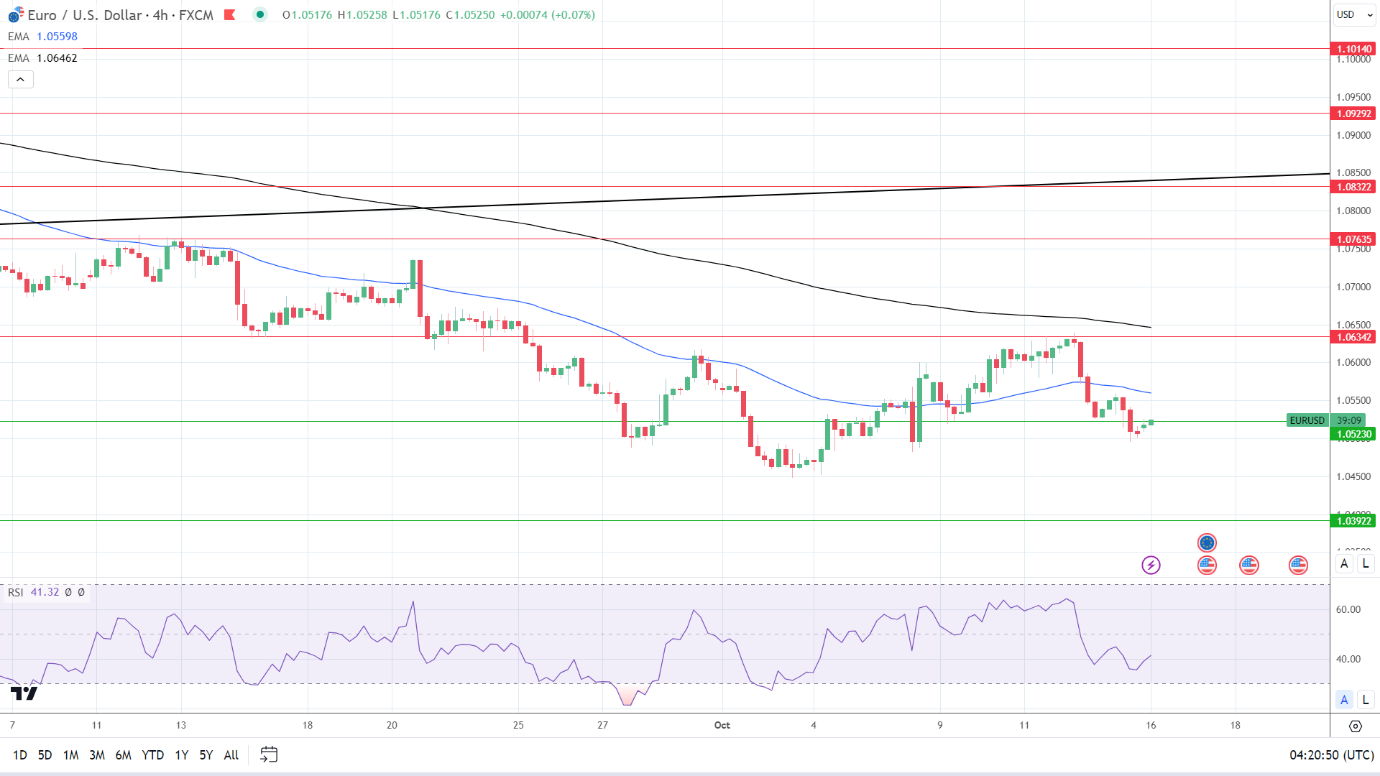
The EUR/USD hovers below the 50-day and the 200-day EMAs, reaffirming bearish price signals. A EUR/USD fall through the $1.05230 support level would bring the $1.03922 support level into view.

However, a break above the 50-day EMA would support a move toward the $1.06342 resistance level.

The 14-period RSI on the 4-hour chart, 41.32, indicates a EUR/USD fall below $1.05 before entering oversold territory.

4-Hourly Chart affirms bearish price signals.
EURUSD 161023 4 Hourly Chart
Silver Prices Forecast: XAG/USD Rides Geopolitical Waves Amid Israel-Hamas Conflict

Silver Prices Forecast: XAG/USD Rides Geopolitical Waves Amid Israel-Hamas Conflict

Safe Havens in Turbulent Times

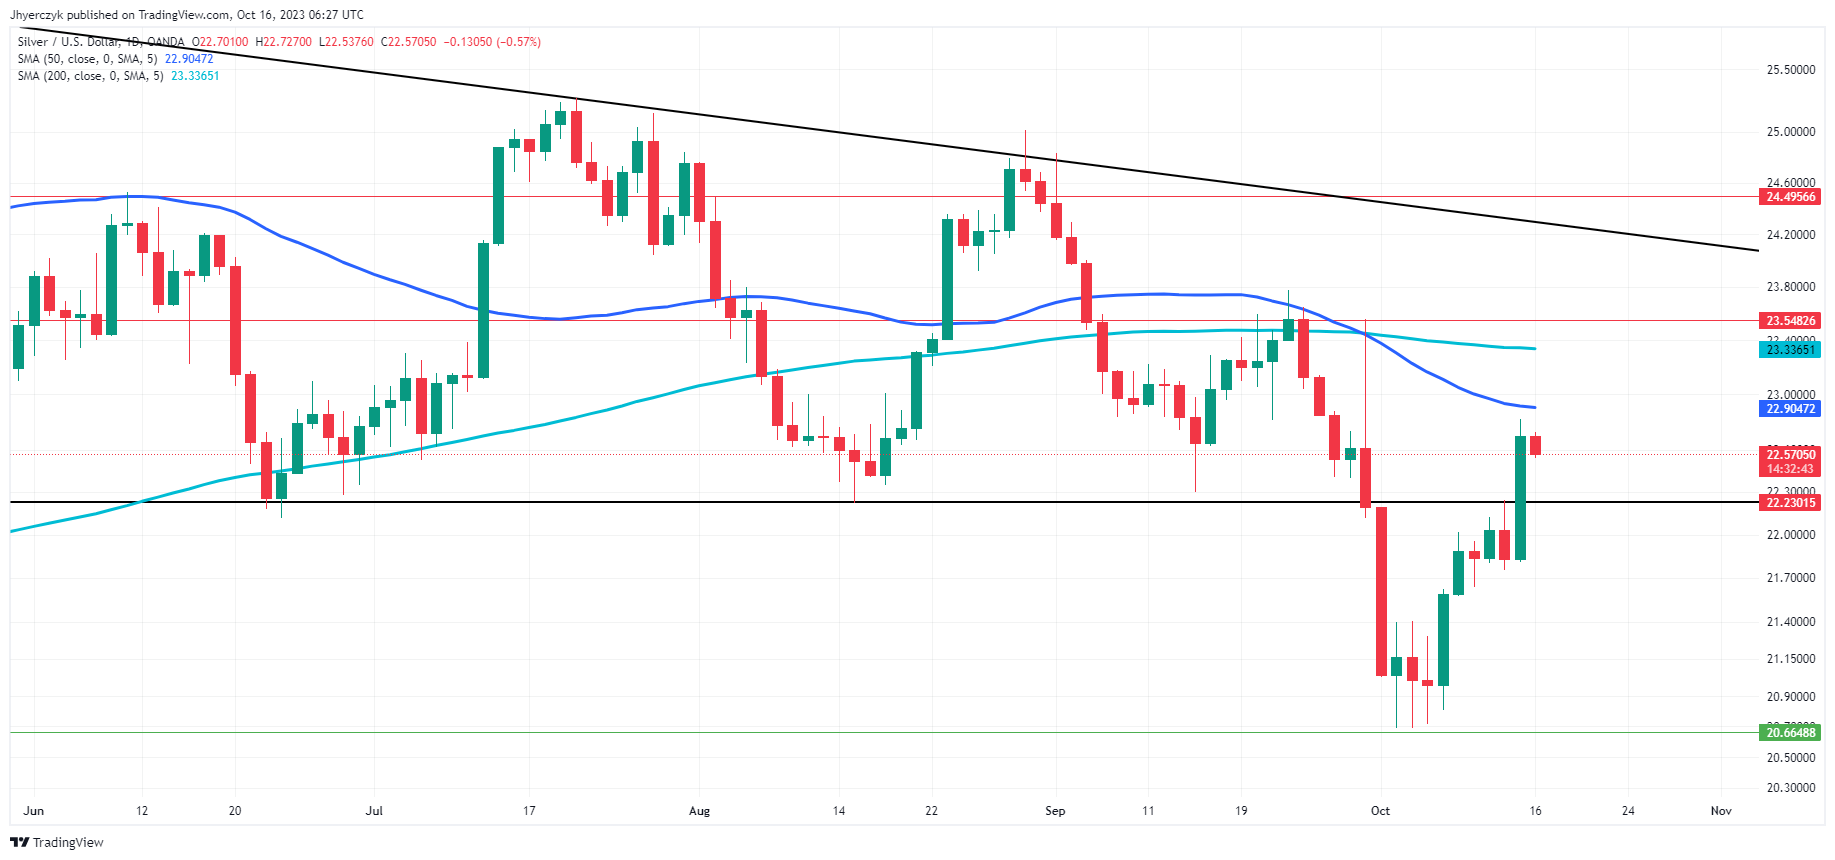
Silver’s (XAG/USD) price witnessed a roller-coaster ride as the Israel-Hamas conflict escalated and investors eyed geopolitical developments along with U.S. monetary policy. After touching a high of $22.82 last Friday, its highest level since September 29, silver retreated as traders engaged in technical selling and profit-taking. The metal had surged 4%, registering its first weekly gain in three weeks, driven primarily by investors flocking to safe-haven assets amid heightened Middle East tensions.

Key Price Points and Geopolitical Factors

The spotlight remains on silver as traders consider it an asset to park money during geopolitical uncertainties. Prices had broken above the significant $22.00 ceiling and are now expected to retest the resistance at $23.78 per ounce. If Middle East tensions continue to escalate, a dip to $21.75 could provide a lucrative entry point, but bears should exercise caution. Ground operations by Israeli forces add another layer of volatility, fueling more inflows into safe-haven assets like silver.

Trading Derivatives carries a high level of risk to your capital and you should only trade with money you can afford to lose. Trading Derivatives may not be suitable for all investors, so please ensure that you fully understand the risks involved, and seek independent advice if necessary. A Product Disclosure Statement (PDS) can be obtained either from this website or on request from our offices and should be considered before entering into a transaction with us. Raw Spread accounts offer spreads from 0.0 pips with a commission charge of USD $3.50 per 100k traded. Standard account offer spreads from 1 pips with no additional commission charges. Spreads on CFD indices start at 0.4 points. The information on this site is not directed at residents in any country or jurisdiction where such distribution or use would be contrary to local law or regulation.

U.S. Monetary Policy and Market Sentiment

In addition to geopolitical factors, U.S. monetary policy is also influencing silver prices. Despite a rise in U.S. consumer prices, expectations remain high that the Federal Reserve will keep interest rates steady, lending additional support to the zero-yield asset. Investors are keenly waiting for Federal Reserve Chair Jerome Powell’s upcoming speech, balancing it against developments in the Middle East conflict.

The Balancing Act of Risks

Investors have been walking a tightrope, keeping one eye on the Middle East and another on U.S. monetary policy. The Israel-Hamas conflict threatens to involve other nations, which could further impact financial markets and boost safe-haven assets. U.S. President Joe Biden’s stance on eliminating Hamas adds another layer of complexity, intensifying investor focus on geopolitical risks.

Short-Term Forecast: Bullish

In the short term, silver appears set on a bullish trajectory. Geopolitical tensions and speculation over the Federal Reserve’s next move are likely to keep silver in traders’ crosshairs. Should these tensions escalate further, silver could aim for the $26.00 mark, offering both risk and reward in an increasingly volatile market.

Technical Analysis

Daily Silver (XAG/USD)The current Daily price of Silver (XAG/USD) at $22.56 sits below both the 200-day and 50-day moving averages, at $23.34 and $22.90 respectively, suggesting a bearish undertone.

While the market hovers close to the 50-day MA, it’s still below the minor resistance level of $23.55, reinforcing the bearish sentiment. Trend line resistance stands at $24.30, another level yet to be breached for a bullish reversal.

Given these technical indicators, the current market sentiment for Silver appears bearish, but momentum suggests the market may be gearing up to challenge resistance. Overcoming both moving averages and the resistance at $23.55 could trigger an acceleration to the upside.

Gold Prices Forecast: Safe-Haven XAU/USD Fluctuates as Israel-Hamas War Heats Up

Gold Prices Forecast: Safe-Haven XAU/USD Fluctuates as Israel-Hamas War Heats Up

Gold Retreats After Rally as Israel-Hamas Conflict Intensifies

Following a 3% surge attributed to escalating Israel-Hamas tensions, gold prices retreated on Monday. At the time of trading, Spot gold (XAU/USD) was down by 0.65%, trading at $1919.86. Gold has long been viewed as a sanctuary during geopolitical unrest, and the metal touched its highest point since September 20 at $1,934.82. With no immediate resolution to the Middle East crisis in sight, the precious metal continues to lure anxious investors.

The volatility comes as the Israel-Hamas conflict intensifies, triggering a rush to gold, seen as a ‘safe-haven’ asset. Israel’s recent transition from air to ground operations in the Gaza Strip adds another layer of uncertainty, boosting demand for gold. The situation has kept traders on their toes, making price points at $1,920 and $1,900 key areas of interest.
Advertisement
Know where Gold is headed? Take advantage now with

Trading Derivatives carries a high level of risk to your capital and you should only trade with money you can afford to lose. Trading Derivatives may not be suitable for all investors, so please ensure that you fully understand the risks involved, and seek independent advice if necessary. A Product Disclosure Statement (PDS) can be obtained either from this website or on request from our offices and should be considered before entering into a transaction with us. Raw Spread accounts offer spreads from 0.0 pips with a commission charge of USD $3.50 per 100k traded. Standard account offer spreads from 1 pips with no additional commission charges. Spreads on CFD indices start at 0.4 points. The information on this site is not directed at residents in any country or jurisdiction where such distribution or use would be contrary to local law or regulation.

Amid the geopolitical risks, the U.S. inflation report released last week hinted at no imminent interest rate hikes from the Federal Reserve. Current market sentiment indicates a 69% likelihood of the Fed maintaining current rates, offering additional support for gold prices. Speculators, however, have increased their net short positions in COMEX gold, adding a complex layer to market dynamics.

Investors are now keenly waiting for Federal Reserve Chair Jerome Powell’s upcoming speech, balancing it with developments in the Middle East to gauge gold’s next move. Meanwhile, U.S. President Joe Biden advocates for the elimination of Hamas, implying the possibility of an extended conflict, further unsettling markets.
Short-term Forecast: Bullish

Given the current landscape, gold is set for a bullish trajectory in the short term. Rising geopolitical tensions and speculation over the Federal Reserve’s next moves will likely keep the metal in traders’ crosshairs. Should tensions escalate further, gold could inch closer to the $2,000 mark, offering both risk and reward in an increasingly volatile market.
Technical Analysis
Daily Gold (XAU/USD)

The current daily price of Gold (XAU/USD) at 1916.90 is below the 200-day moving average of 1929.38 but above the 50-day moving average of 1900.99. This indicates a mixed outlook, as gold is struggling to find a clear direction.

The asset is trading within a range defined by minor support at 1811.03 and main support at 1752.85, with minor resistance at 1930.64 and main resistance at 1952.21.

Given its positioning between these key levels and mixed moving average signals, the current market sentiment leans neutral, but we could see an acceleration to the upside if buyers can overcome the 200-day moving average with conviction.

Oil Prices Forecast: Israel-Hamas Conflict Fuels Uncertainty in Crude Market

Oil Prices Forecast: Israel-Hamas Conflict Fuels Uncertainty in Crude Market

Tensions Elevate Oil Prices to New Heights

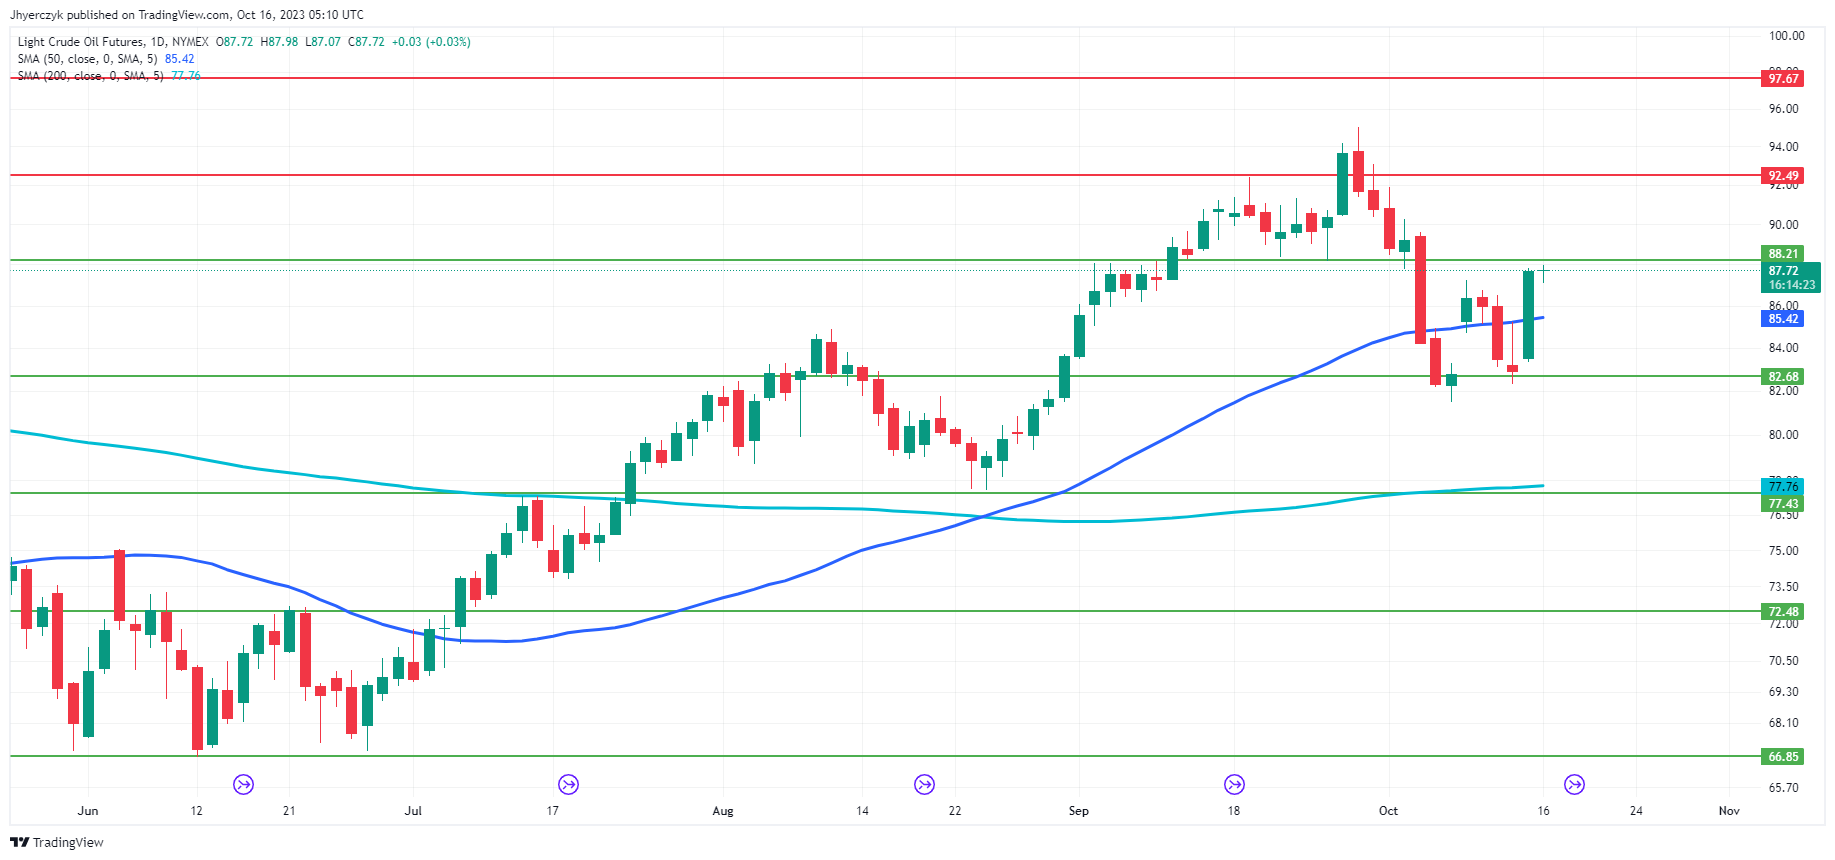
Oil prices inched higher this Monday, extending last week’s gains as the Israel-Hamas conflict adds a layer of uncertainty to an already tense market. Brent futures nudged up to $90.90 per barrel, while U.S. West Texas Intermediate (WTI) rose to $87.71 a barrel. Both benchmarks soared nearly 6% on Friday, reflecting heightened concerns over a broader Middle East conflict.

Investor Uncertainty Amid Israel-Hamas Conflict

Despite a large-scale ground assault by Israel not yet unfolding, investors remain wary. The uncertainty surrounding the conflict’s impact on oil-producing countries has been partially priced in, but an escalation could send prices soaring past the $100 mark. While Israel itself isn’t a major oil producer, the geopolitical risk surrounding the Israel-Hamas conflict is the most significant since Russia’s invasion of Ukraine last year.

Trading Derivatives carries a high level of risk to your capital and you should only trade with money you can afford to lose. Trading Derivatives may not be suitable for all investors, so please ensure that you fully understand the risks involved, and seek independent advice if necessary. A Product Disclosure Statement (PDS) can be obtained either from this website or on request from our offices and should be considered before entering into a transaction with us. Raw Spread accounts offer spreads from 0.0 pips with a commission charge of USD $3.50 per 100k traded. Standard account offer spreads from 1 pips with no additional commission charges. Spreads on CFD indices start at 0.4 points. The information on this site is not directed at residents in any country or jurisdiction where such distribution or use would be contrary to local law or regulation.

Global Supply Concerns

Market players are closely monitoring what a potential escalation could mean for supplies from top oil-producing regions like Saudi Arabia, Iran, and the United Arab Emirates. If Iran is implicated in supporting the Hamas attacks, the U.S. could fully enforce existing sanctions on Iranian oil exports, putting at risk the 0.5-1 million barrels per day increase in Iran’s oil exports this year.

US Diplomacy and Sanctions

U.S. Secretary of State Antony Blinken will return to Israel for further diplomatic efforts, while the U.S. recently imposed the first sanctions on tanker owners carrying Russian oil above the G7’s price cap of $60 a barrel. The move could curtail supply from one of the world’s top crude exporters, adding another layer of complexity to the market.

Short-Term Forecast: Bullish

In the week ahead, the oil market is likely to remain on edge as investors gauge the ramifications of the Israel-Hamas conflict and its potential spill-over into larger geopolitical issues. The overall sentiment leans bullish, bolstered by supply concerns and escalating tensions in the Middle East.

Technical Analysis

Daily Light Crude Oil FuturesThe current daily price of 87.71 sits above both the 200-day and 50-day moving averages, at 77.76 and 85.42 respectively, signaling bullish momentum. It is also closely hugging its previous close of 87.69, suggesting market equilibrium.

The market seems well-positioned between its minor support at 82.68 and minor resistance at 92.49. The main support and resistance levels are at 77.43 and 97.67, offering a broad trading range.

Considering these technical indicators, the current market sentiment leans bullish. However, caution is advised as the market moves closer to the resistance levels.

Markets Week Ahead: Gold, Crude Oil, Geopolitical Tensions, US Dollar, Fed, China GDP

Markets Week Ahead: Gold, Crude Oil, Geopolitical Tensions, US Dollar, Fed, China GDP

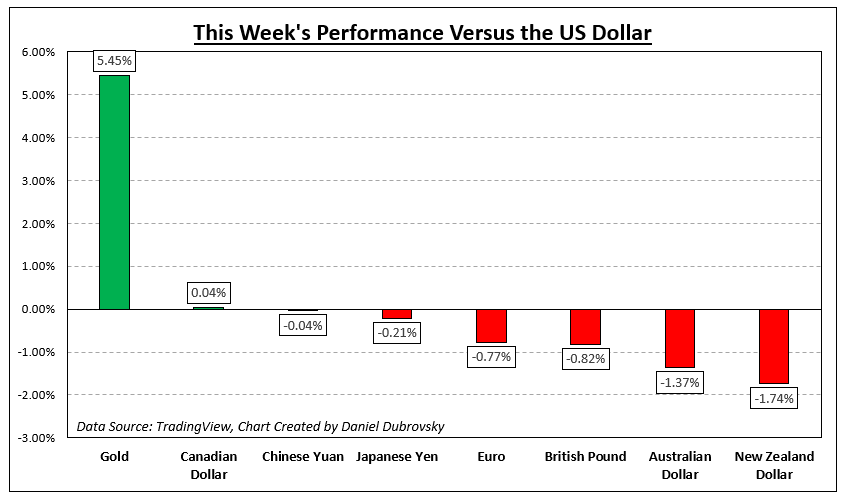
It was a volatile week for certain corners of financial markets over the past few trading sessions. All eyes were on gold and crude oil prices. XAU/USD rallied almost 5.5 percent, marking the best 5-day period since the middle of March. Meanwhile, crude oil prices soared almost 6 percent in the best weekly gains since the end of August.

Turmoil in the Middle East in the aftermath of Hamas’s attack on Israel fueled oil supply disruption woes with respect to potential geopolitical volatility around Iran. Meanwhile, cautious Fedspeak helped cool government bond yields. The latter offered support to gold prices, which are very sensitive to Treasury yields and the Federal Reserve.

Focusing on currencies, the sentiment-linked New Zealand and Australian Dollar underperformed against the US Dollar amid a deterioration in global stock markets heading into the end of last week. While the S&P 500 and Nasdaq 100 started off the week strong, most of the gains were reversed heading into the weekend.

Looking at the week ahead, there are a few notable event risks. Fed Chair Jerome Powell will be speaking on Thursday and his language will be in focus given the somewhat cautious Fedspeak of late. Elsewhere, China will be releasing the latest GDP figures. All eyes will be on a slowing in growth. The UK will release employment figures while Canada reports inflation. What else is in store for financial markets in the week ahead?

How Markets Performed – Week of 10/9

How Markets Performed – Week of 10/9

The Dollar Index (DXY) roared back to life as concerns of escalation and spread in the Middle East has seen the US Dollar benefit from its safe have appeal and remains key in the week ahead.

XAU/USD Price Forecast: Tempered Start for Gold

XAU/USD Price Forecast: Tempered Start for Gold

XAU/USD FUNDAMENTAL FORECAST

Gold prices softened on Monday morning after a the largest upside rally since mid-March this year due to rising concerns between Israel and Hamas (safe haven demand). Since then there has been no real escalation in incoming news which has seen bullion taper off slightly but may well pick up again on any worsening news in the Middle East.

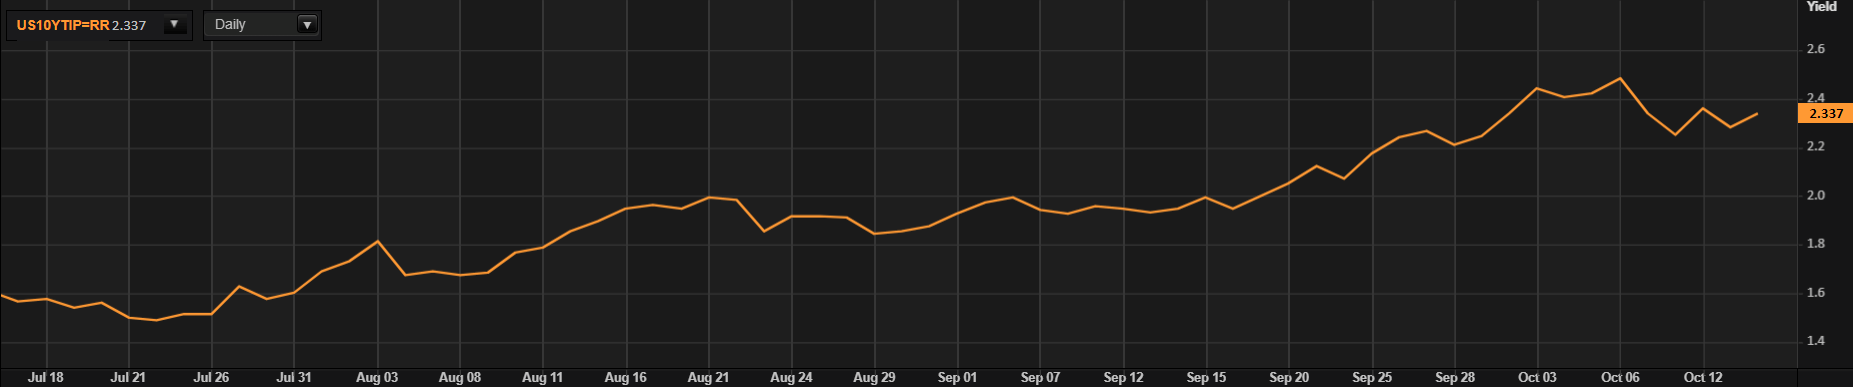
US real yields (see below) is marginally higher thus weighing on the non-interest bearing asset as US Treasury yields tick higher.

US REAL YIELDS (10-YEAR)

image1.png

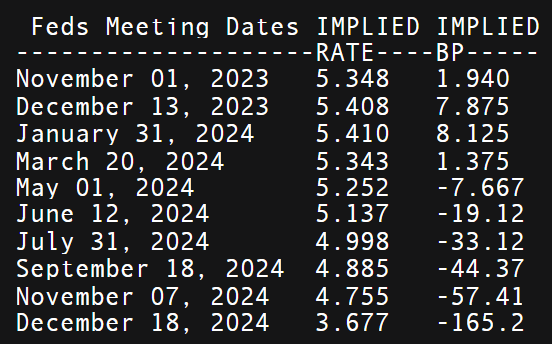
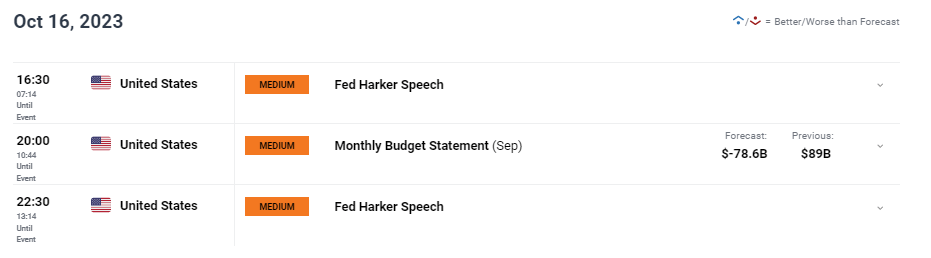
From a Federal Reserve perspective, markets have ‘dovishly’ repriced interest rate expectations (refer to table below), currently pricing in roughly 165bps of rate cuts by year end 2024. This drastic change suggests a possible peak to the Fed’s hiking cycle and may continue to buoy gold prices should this narrative gain traction through weaker US economic data and less aggressive Fed talk. Fed guidance will continue today but the focal point for the week will come from US retail sales data tomorrow, additional Fed speakers including Fed Chair Jerome Powell and jobless claims data.

IMPLIED FED FUNDS FUTURES

image2.png

GOLD ECONOMIC CALENDAR

image3.png

TECHNICAL ANALYSIS

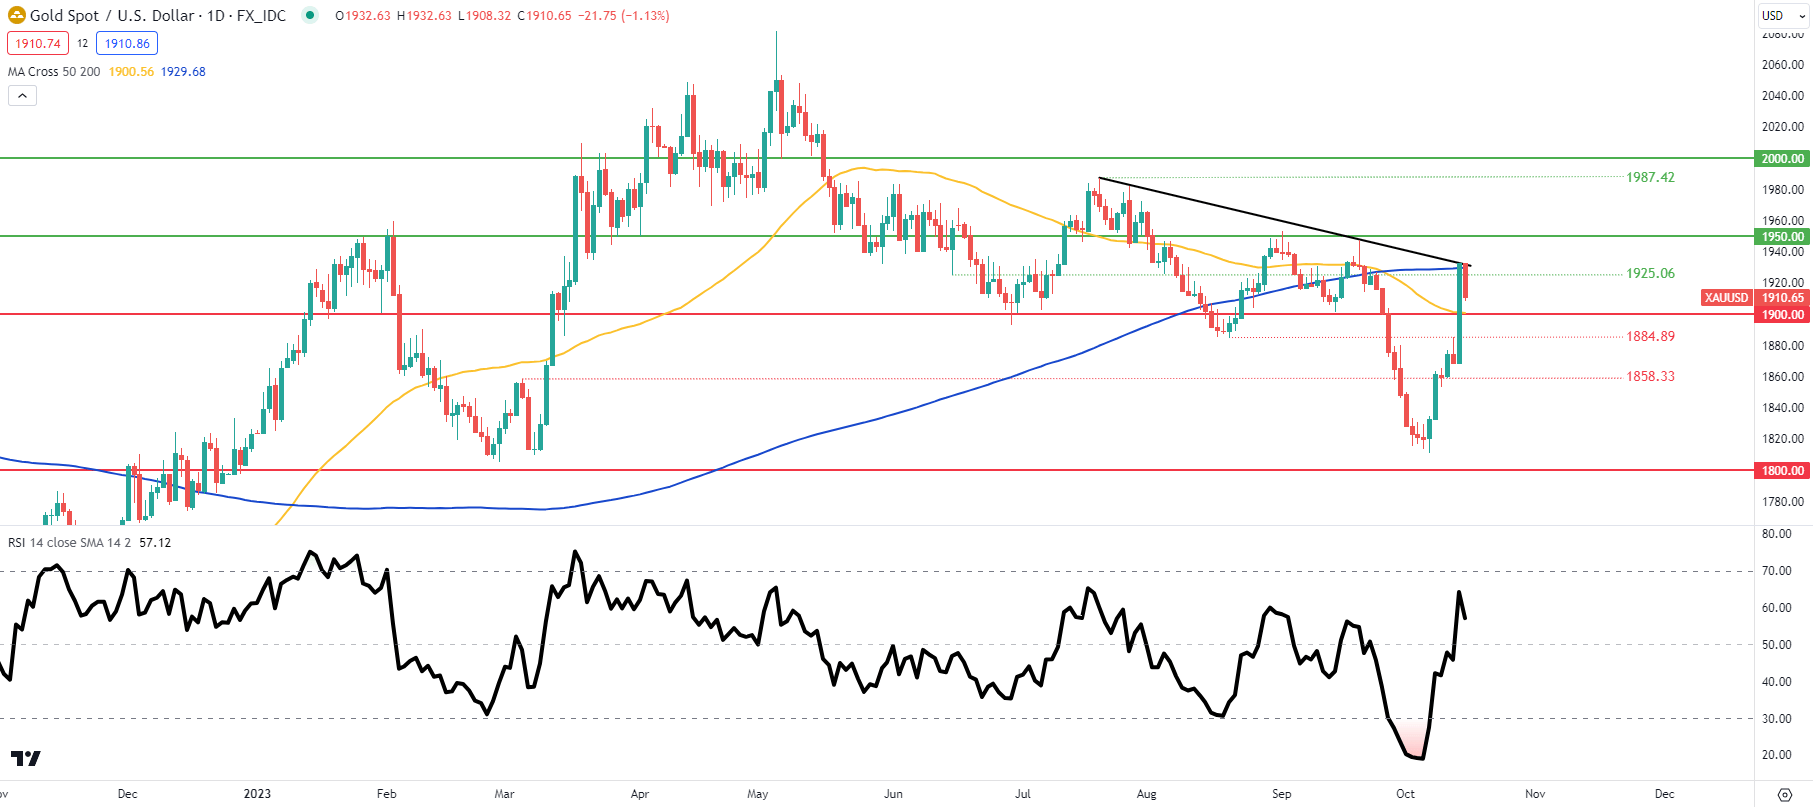
GOLD PRICE DAILY CHART

image4.png

Daily XAU/USD price action shows the pair respecting the longer-term trendline resistance zone (black), coinciding with the 200-day moving average (blue). Due to the external factors at play, there could be investors looking to look for long opportunities at support levels; however, due to the fact that the war in the Middle East remains relatively contained within the region, gold may not appreciate as many would expect. That being said, should the war spillover and see other nations implicated, the contagion effect will likely support a sharp rise in gold prices.