USD rips higher on hot headline CPI

USD rips higher on hot headline CPI

USD well and truly broke the sequence of six consecutive days of losses. The dollar rebounded sharply after the inflation data, having traded around flat before the numbers. A fourth consecutive week of initial weekly jobless claims around 200k also suggested tightness in the labour market continues. Yields rose though more Fed commentary stuck to the recent script. That being that rising long-term rates are doing “some of the work” for the Fed amid tighter financial conditions. The DXY is firmly back in the long-term ascending channel.

EUR had poked out of its descending channel over the last two days, but sellers quickly emerged. Solid resistance sits around 1.0634/39 where prices have twice reversed, plus there’s a major Fib level in this zone too. The ECB minutes highlighted growth concerns and broader differences in the Governing Council on inflation and the policy rate. But a pause looks all but certain at its meeting in a few weeks’ time.

GBP dropped below 1.23 after the US data. UK GDP was mixed but the headline mostly hit consensus estimates. Comments from Chief Economist Pill noted that inflation was still too high, and more rate hikes were a finely balanced issue. Cable is back in the middle of the bear channel.

USD/JPY pushed higher and is heading towards 150. US yields pushed north with the 10-year Treasury closely correlated to this major. We heard from a BoJ official who supports early yield curve control flexibility.

AUD suffered along with the kiwi as the worst performing majors. The aussie plunged below 0.6350, down close to 1.3% on the day. The recent cycle lows reside around 0.6285/6. USD/CAD moved up again just above recent resistance at 1.3667. Subdued oil prices and risk sentiment have dampened the loonie.

Stocks: US equities closed down for the first day in five. The benchmark S&P 500 lost 0.62% to settle at 4349. The tech-heavy Nasdaq finished 0.37% lower at 15,184. The Dow closed off 0.51% at 33,631. UAW expanded its strike to Ford’s biggest plant in Kentucky. The stocks settled down just over 2%. Third quarter US earnings get under way today with results from some of the biggest financial names. After three straight quarters of year-over-year earnings declines, expectations are for an improved earnings season. But given the unsettled outlook, forward guidance will be key.

Asian futures are pointing lower after the down day on Wall Street. APAC stocks were firmer yesterday on the back of the intraday rebound Stateside. The Hang Seng gapped above 18,000 and led advance sin the region. The Nikkei 225 broke above the 32,000 level.

Gold edged higher to $1885 before falling sharply after the CPI release. Yields rose close to 4.70% from recent lows on the 10-year US Treasury, after dipping to a near two-week bottom at 4.53%.

Data Breakdown – US CPI still sticky

US CPI for September showed the headline a tick higher than forecasts at 0.4% m/m and 3.7% y/y. The core rate, which excludes volatile food and energy costs, printed in line with estimates at 0.3% m/m and 4.1% y/y. Housing is still running relatively hot but the time lag with rents should see this slow significantly into year end.

The issue for the Fed is the super core services data which excludes shelter and energy costs and rose 0.6% m/m. This is highly connected to the job market that is still tight and feeling wage pressures.

Markets reacted to the hotter data by modestly upping their bets on the chances of another rate hike this year. This moved higher to 40% from below 30% before the release. But as credit availability tightens and borrowing costs are high, the current high yields may mean the Fed doesn’t need to raise rates again.

Chart of the Day – GBP/USD remain firmly in a bear channel

Sterling was a clear underperformer yesterday. UK GDP released early in the session largely matched expectations. August growth rose 0.2% on the month and 0.3% on a quarterly basis. There were downward revisions to July with manufacturing softer than expected while services were slightly better than forecast.

The recent upswing in cable didn’t get to challenge the topside of the descending channel. Short-term resistance was reinforced around 1.2340/50 yesterday before prices sunk after the US inflation data. The early October low sits at 1.2037. We get UK CPI and important wage figures out the middle of next week.

China’s Trade Balance: Surplus widens more than expected in September

China’s Trade Balance: Surplus widens more than expected in September

China’s Trade Balance for September, in Chinese Yuan terms, came in at CNY558.74 billion versus expectations of CNY510 billion and CNY488 billion previous.

Exports dropped 0.6% YoY in September vs. -3.2% seen in August. The country’s imports declined 0.8% YoY in the reported month vs. -1.6% prior.

In US Dollar terms, China’s trade surplus shrunk more than expected in September.

Trade Balance came in at +77.71B versus +70B expected and +68.36B previous.

Exports (YoY): -6.2% vs. -8.3% exp. and -8.8% previous.

Imports (YoY): -6.2% vs. -6.0% exp. and -7.3% last.

Additional takeaways

China Jan-Sept Yuan-denominated exports +0.6% YoY.

China Jan-Sept Yuan-denominated Imports -1.2% YoY.

China Jan-Sept USD-denominated exports -5.7% YoY.

China Jan-Sept USD-denominated Imports -7.5% YoY.

China Jan-Sept Trade Balance +$630.3 Bln.

FX implications

AUD/USD is off the highs but remains well bid near 0.6325 on encouraging China’s trade figures. The pair is up 0.17% on the day, tradas of writing.

Bank of China reports rise in cross-border renminbi settlements

Bank of China reports rise in cross-border renminbi settlements

BEIJING, Oct. 12 (Xinhua) — The Bank of China (BOC) said Thursday it has actively expanded cross-border renminbi products and services since the start of the year, and handled 22.59 trillion yuan (about 3.15 trillion U.S. dollars) of cross-border renminbi settlements in the first eight months.

In breakdown, cross-border renminbi settlements by the lender’s domestic branches grew by 22 percent year on year to 8.29 trillion yuan in the first eight months, while all the overseas branches of the lender handled 14.3 trillion yuan of cross-border renminbi settlements, up 4.45 percent year on year.

There has been a notable increase in the cross-border use of renminbi in the participating countries of the Belt and Road Initiative (BRI), surging 90.41 percent year on year during the period, said Liu Yunfei, deputy general manager of BOC’s global transaction banking department.

In recent years, the BOC has continuously expanded its service network in BRI countries. With the opening of its branch in Riyadh last month, the lender’s overseas institutions have covered 64 countries and regions, including 44 that are taking part in the BRI.

By the end of June, the lender had assisted BRI partner countries and related institutions in issuing 29 types of panda bonds worth a total of 75.96 billion yuan, effectively meeting their renminbi financing needs.

Emerging markets PMI signal growth momentum slowing at end of third quarter

Emerging markets PMI signal growth momentum slowing at end of third quarter

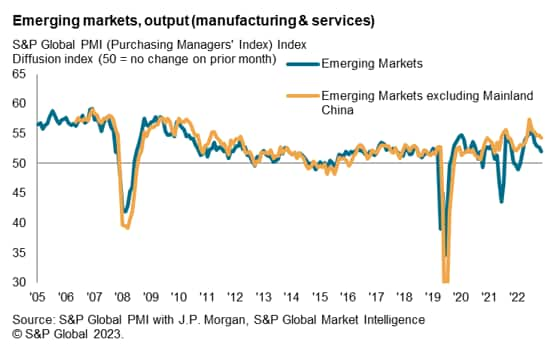
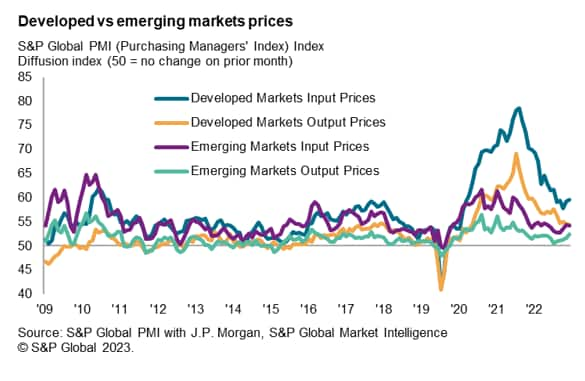
Global economic growth near-stalled for a second straight month in September amid a sustained contraction of developed market activity and an easing in the rate of emerging market expansion, according to the latest PMI indications. Slower expansions of both manufacturing and service sector activity caused overall emerging market output to expand at the weakest pace since January.

Although still relatively resilient, the latest PMI data extends the trend of slowing economic growth for emerging markets to a fourth month. This is while softening business optimism and a renewed contraction in backlogged work outline the possibility for a further easing of growth momentum as we head into the fourth quarter.

Amid softening demand conditions, cost pressures eased for emerging market firms. However, businesses passed on prior cost increases to result in the highest rate of selling price inflation in 14 months.

Emerging market expansion decelerates for fourth straight month

September’s PMI data outlined a second consecutive month in which developed markets experienced a mild contraction in private sector output, measured across both manufacturing and services. This was accompanied by a fourth successive slowdown in emerging market growth, leading to the softest expansion in emerging market output in eight months.

Once again, the slowdown in emerging market growth was less pronounced when mainland China is excluded. The emerging markets ex-China PMI declined only slightly from August, remaining well above the series long-run average to signal solid improvements in economic conditions. In contrast, mainland China’s activity rose at the shallowest pace since renewed growth was seen at the start of the year.

New orders performance diverge between developed and emerging markets

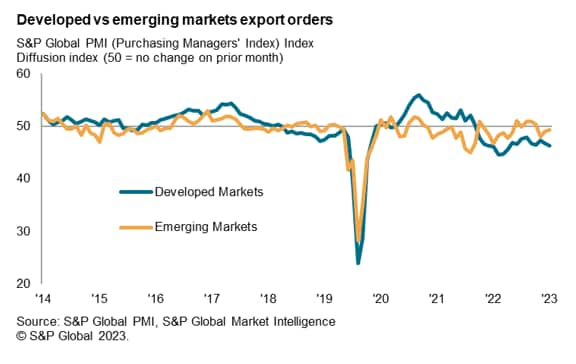
Underpinning the difference in output performance between emerging and developed markets was the divergence in new orders, including new export orders. While developed markets saw the sharpest contraction in overall new orders in nine months, emerging markets new business growth merely moderate. Meanwhile, new export orders fell at a slower and only marginal pace in emerging markets. In contrast, developed markets saw the sharpest fall in new export orders in nine months.

To a large extent, the weakness in the goods producing sector has been driven by a sustained deterioration in trade conditions and this appeared to have disproportionately affected developed markets compared to emerging economies. That said, service providers in developed markets also saw the first deterioration in foreign demand since February and at a solid rate, hinting at a broadening out of the trade malaise.

India continues to lead emerging market growth

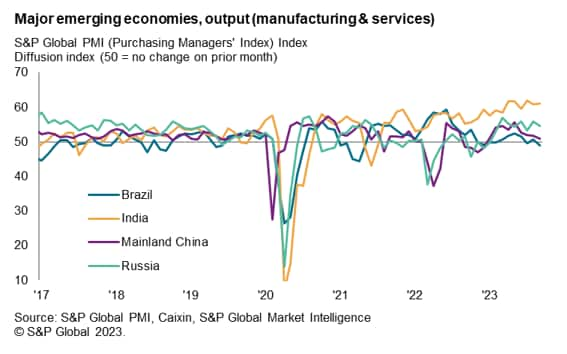
Examining the growth of the four major emerging economies, India continued to stand out with exceptional growth momentum. Furthermore, India was the only one of the four to see growth accelerate from August, with output expanding at one of the strongest rates in just under 13 years. Supporting the strong expansion in India’s output was the second-fastest rise in new business in over 13 years amid favourable demand conditions and positive market dynamics, according to surveyed companies. Manufacturing output and services activity rose at comparable strong paces in India over September.

India’s growth surge was accompanied by more modest expansions in Russia and mainland China, both of which experienced a slowdown in growth from August. China (mainland) notably saw its services activity near-stall in September, after the sector had played a key role in supporting growth earlier in 2023. Manufacturing output consequently overtook services to rise at a faster rate in mainland China. Broadly, however, business confidence in the mainland weakened to the lowest since last November, hinting at reduced optimism regarding future output.

Finally, Brazil returned to contraction after eking out modest growth midway into the third quarter. Business activity in Brazil has now declined in half of the year-to-date , and with both manufacturing and services activity posting sub-50.0 (contraction) readings to signal a broad-based reduction in output.

Margins improve for emerging market firms

Price pressures slightly eased for emerging market firms after rising in August, helped by softer service sector cost inflation. That said, solid demand growth in emerging markets reportedly enabled businesses to pass on higher costs at a faster rate at the end of the third quarter. This led to a slight acceleration in emerging market selling price inflation, which hit the highest in 14 months to climb above the series average. This bodes well for emerging market firms’ profits.

In contrast, developed market profit margins appear to be coming under pressure amid a faster, and still-elevated, rate of input cost increases, while selling price inflation dip in September. Overall developed market selling prices nevertheless continued to rise at a rate well above the long-run average, outlining the pressure of higher prices on clients’ demand amidst an environment of high interest rates and softening global economic conditions.

Jingyi Pan, Economics Associate Director, S&P Global Market Intelligence

[email protected]

© 2023, S&P Global. All rights reserved. Reproduction in whole or in part without permission is prohibited.

Purchasing Managers’ Index™ (PMI™) data are compiled by IHS Markit for more than 40 economies worldwide. The monthly data are derived from surveys of senior executives at private sector companies, and are available only via subscription. The PMI dataset features a headline number, which indicates the overall health of an economy, and sub-indices, which provide insights into other key economic drivers such as GDP, inflation, exports, capacity utilization, employment and inventories. The PMI data are used by financial and corporate professionals to better understand where economies and markets are headed, and to uncover opportunities.

China’s Credit Growth Beats Expectations on Stronger Stimulus

China’s Credit Growth Beats Expectations on Stronger Stimulus

(Bloomberg) — China’s credit jumped in September as local governments rushed to sell infrastructure bonds and authorities eased mortgage restrictions in a bid to boost demand for real estate.

  • Aggregate financing, a broad measure of credit, was 4.12 trillion yuan ($564 billion), the People’s Bank of China said Friday. That was well above the median estimate of 3.7 trillion yuan in a Bloomberg survey of economists.
  • Financial institutions offered 2.31 trillion yuan worth of new loans in the month, lower than economists’ forecasts of 2.5 trillion yuan, and compared with 2.47 trillion yuan a year ago.

The boost can in part be explained by timing, as banks usually rush to extend loans at the end of each quarter to meet their lending targets and satisfy regulatory requirements. Last month’s data may also be bolstered by recent stimulus — including a move by the PBOC to release long-term liquidity into the financial system by cutting the reserve requirement ratio, encouraging banks to lend more.

Several measures to spur people to buy more homes — such as lowering downpayment requirements in cities — also essentially took effect from September. The additional support for the economy came as China’s post-pandemic recovery has lost steam, with the property crisis weighing on demand and sentiment. Exports have been falling and the job market has been gloomy, especially for recent graduates.

The impact from stronger policy support so far, however, has been limited. Some sectors are seeing a mild rebound, but home sales are still struggling and spending over the critical Golden Week holiday period was cooler than expected.

To ensure the economy meets Beijing’s 2023 growth target of around 5%, policymakers are considering raising this year’s budget deficit and issuing at least 1 trillion yuan of additional sovereign debt for spending on infrastructure such as water conservancy projects, Bloomberg News has reported. That may push up the extension of credit in the coming months.

Bitcoin Price Rallied 12% After Last CPI Report —Will it Happen Again?

Bitcoin Price Rallied 12% After Last CPI Report —Will it Happen Again?

After a 3% decline on Wednesday, Bitcoin (BTC) price edged towards reclaiming the $27,000 level on October 12. Historical data-driven analysis provides insights into how BTC prices could react to the latest Consumer Price Index (CPI) data released by the US Bureau of Labor Statistics.

US Inflation Cooled By 0.2% in September, According to CPI Data

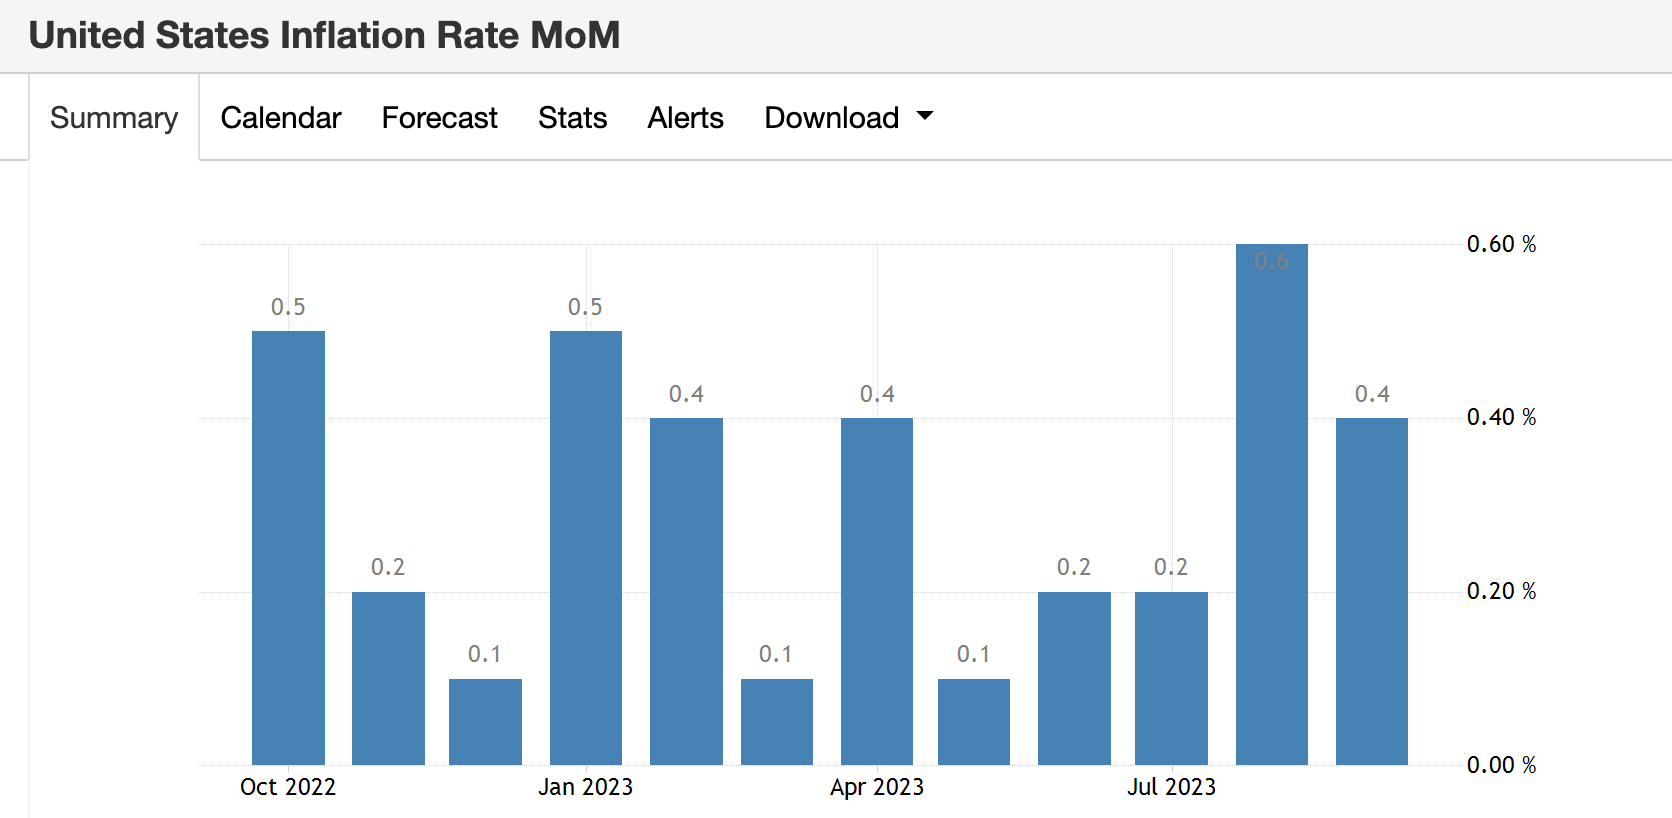
The Consumer Price Index released on October 12 shows that household inflation rose 0.4% in September, a significant decline from the 0.6% recorded in August 2023. This decline in CPI has been received as bullish indicator by investors.

US Inflation Rate Month on Month |Source: TradingEconomics
Published monthly, the CPI data is a economic indicator used to measure the average change over time in the prices paid by urban consumers for a basket of goods and services.Essentially it provides valuable insights into inflation trends and ultimately, likely changes in citizens’ investment patterns in the coming months.

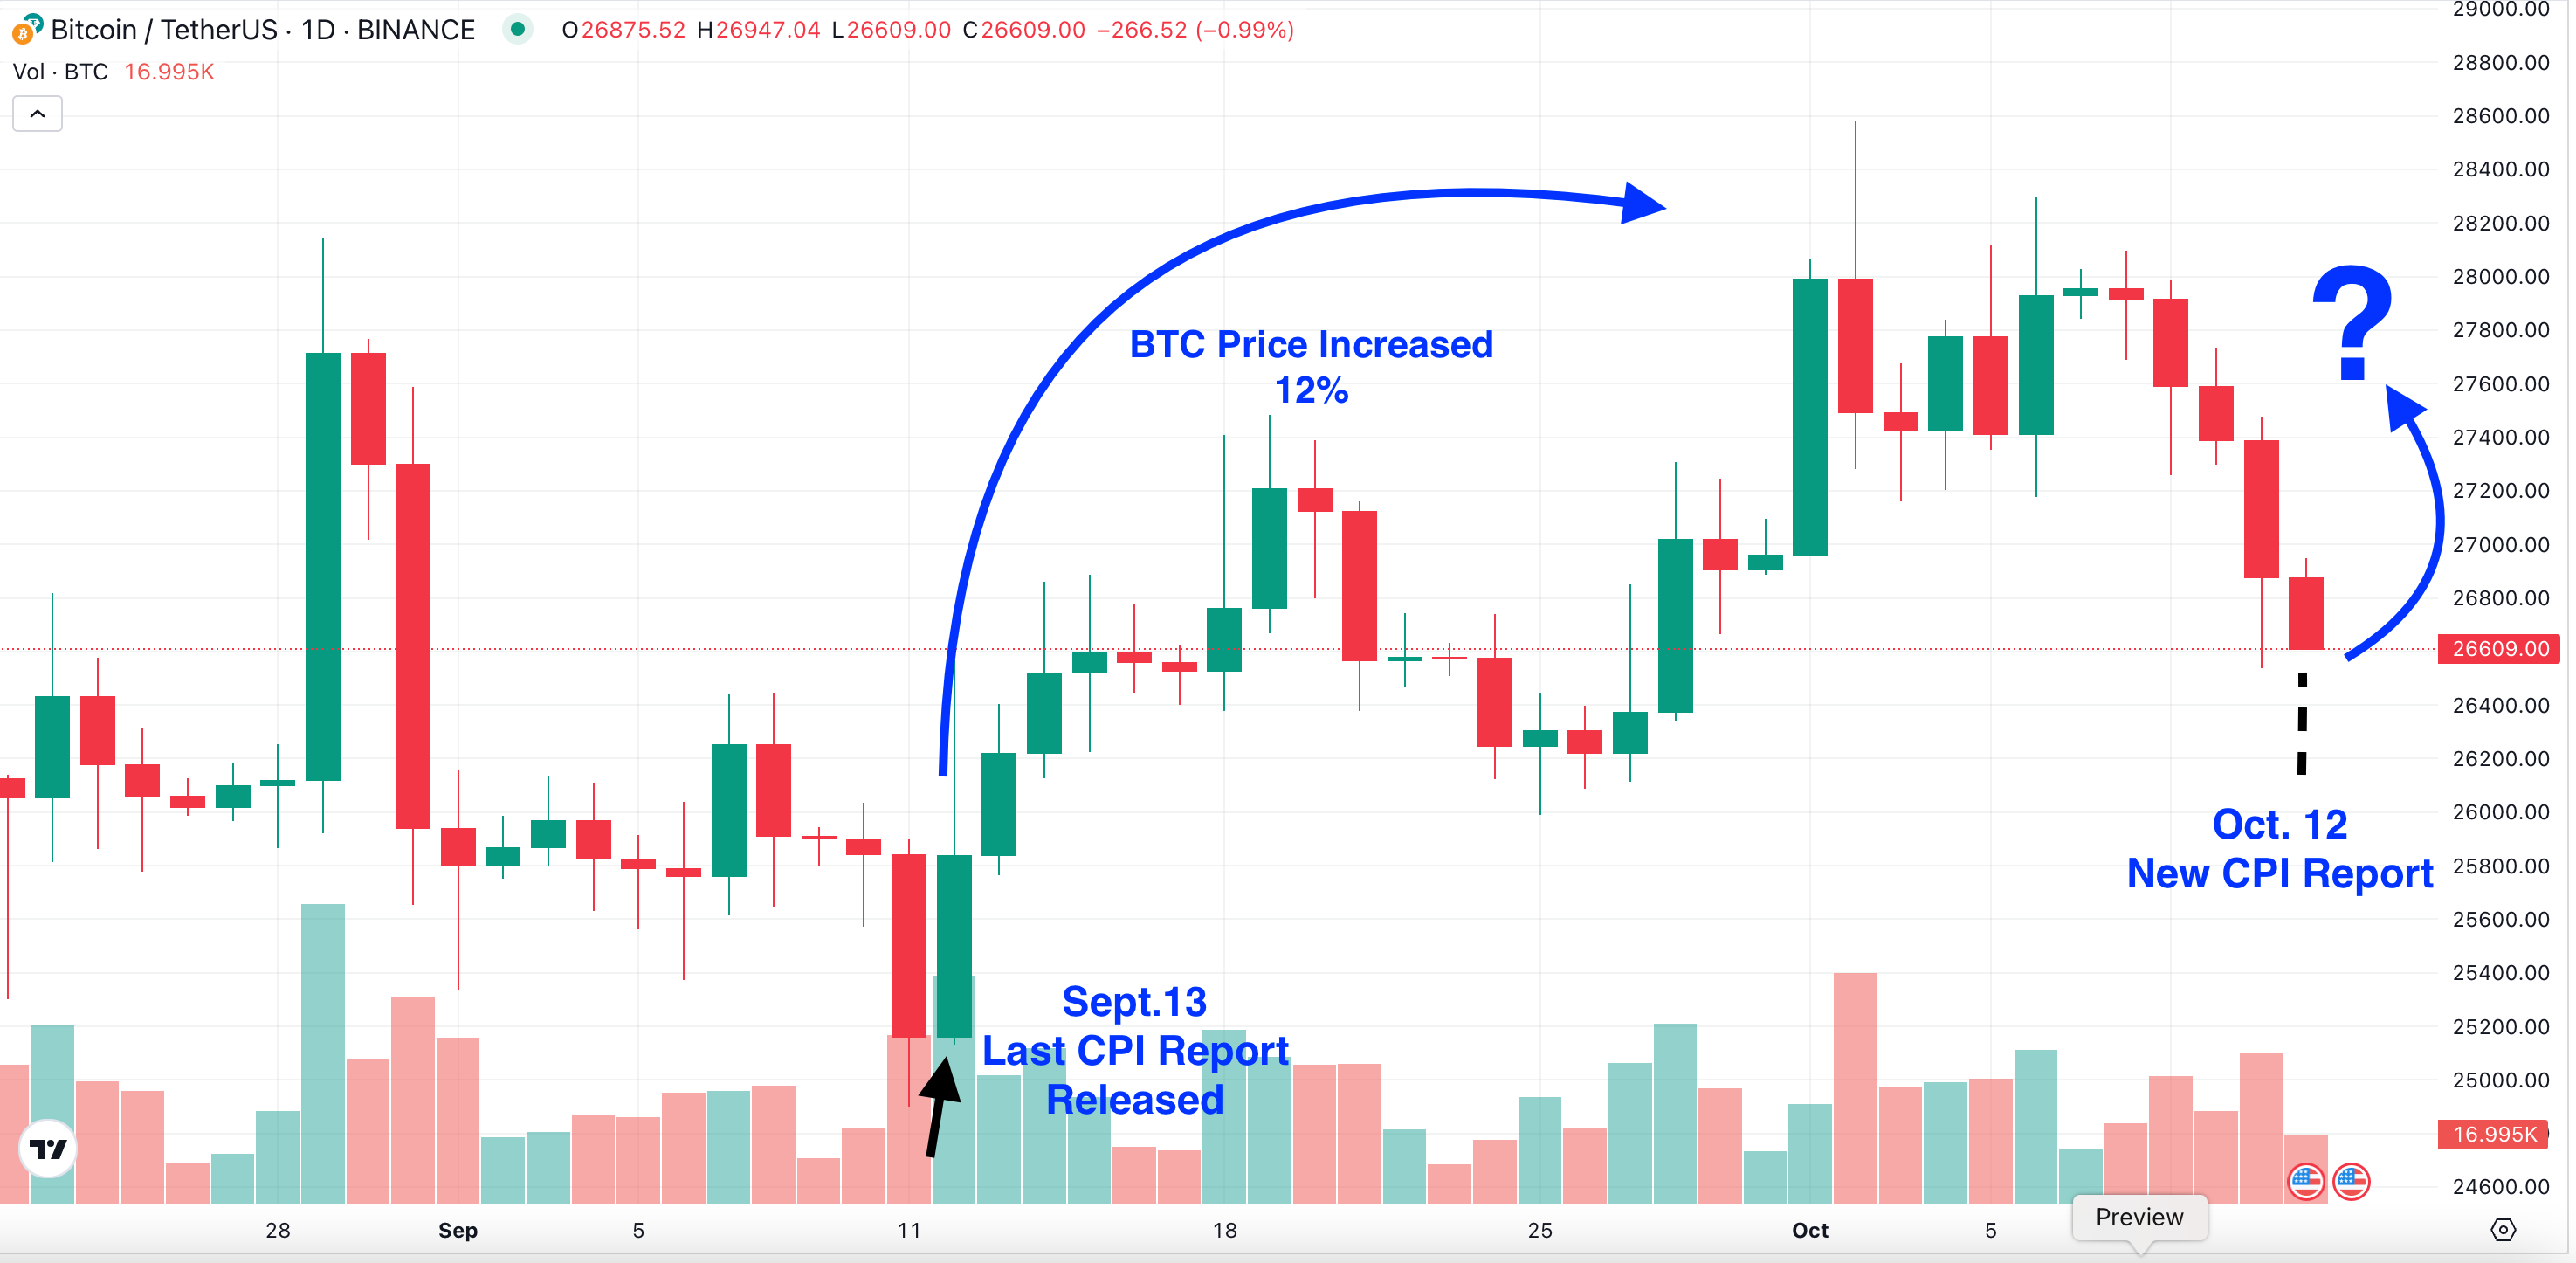
Bitcoin (BTC) Price increased by 12% After the Last CPI Report

Typically, investors in risk-on assets such as stocks and cryptocurrencies consider it bullish when US CPI indicates low or lower-than expected inflation. Less pressure on citizen’s disposable income, often means that more funds available to be invested in risk assets.

This phenomenon was last observed when the US Bureau of Labor Statistics published the previous CPI data on September 12.

The report showed that household inflation had increased by 0.6%, lower than the 0.8% that market analyst had anticipated. Historical BTC price data shows that crypto investors reacted positively to the previous CPI report.


Bitcoin (BTC) Price Performance after September CPI data report.
As depicted below, BTC price stood at a H2 2023 bottom of $25,100 as of September 12. But following the CPI report release, Bitcoin price rose 12% to hit $28,050, by the end of that month.Notably, the latest CPI report shows that inflation is 0.2% lower than the previous month. Compared to the August 2023 report which showed a 0.4% inflation increase. Hence, this will likely trigger a much more positive response from  Bitcoin investors than last month.

If this economic projections align with historical trends, BTC price could retest $30,000 in the coming weeks. However, the escalation tensions in the Middle East remains a vital factor to watch.

DAX Index: DAX 30’s Tug of War – ECB’s Concerns vs. US Economic Indicators

DAX Index: DAX 30’s Tug of War – ECB’s Concerns vs. US Economic Indicators

DAX Thursday Overview

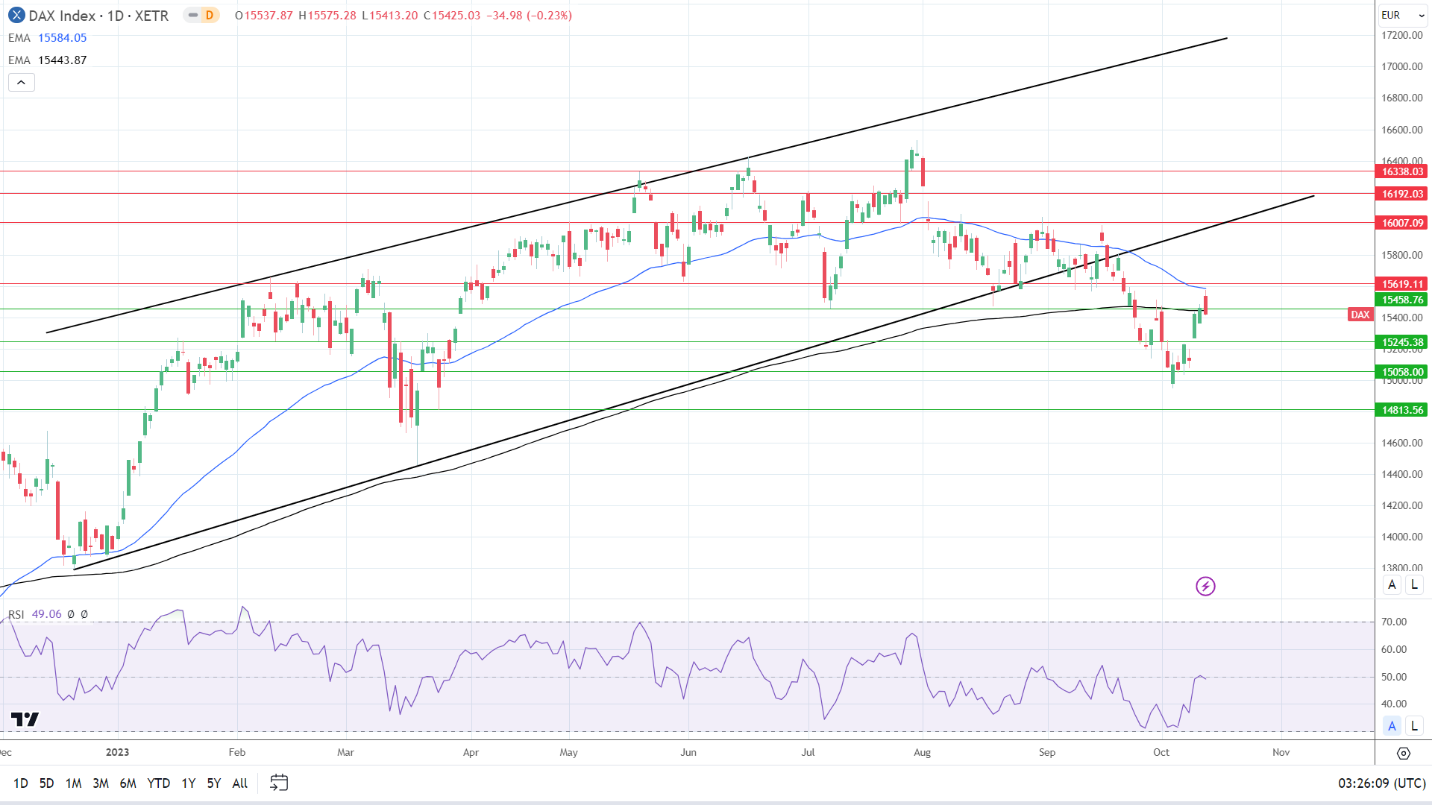
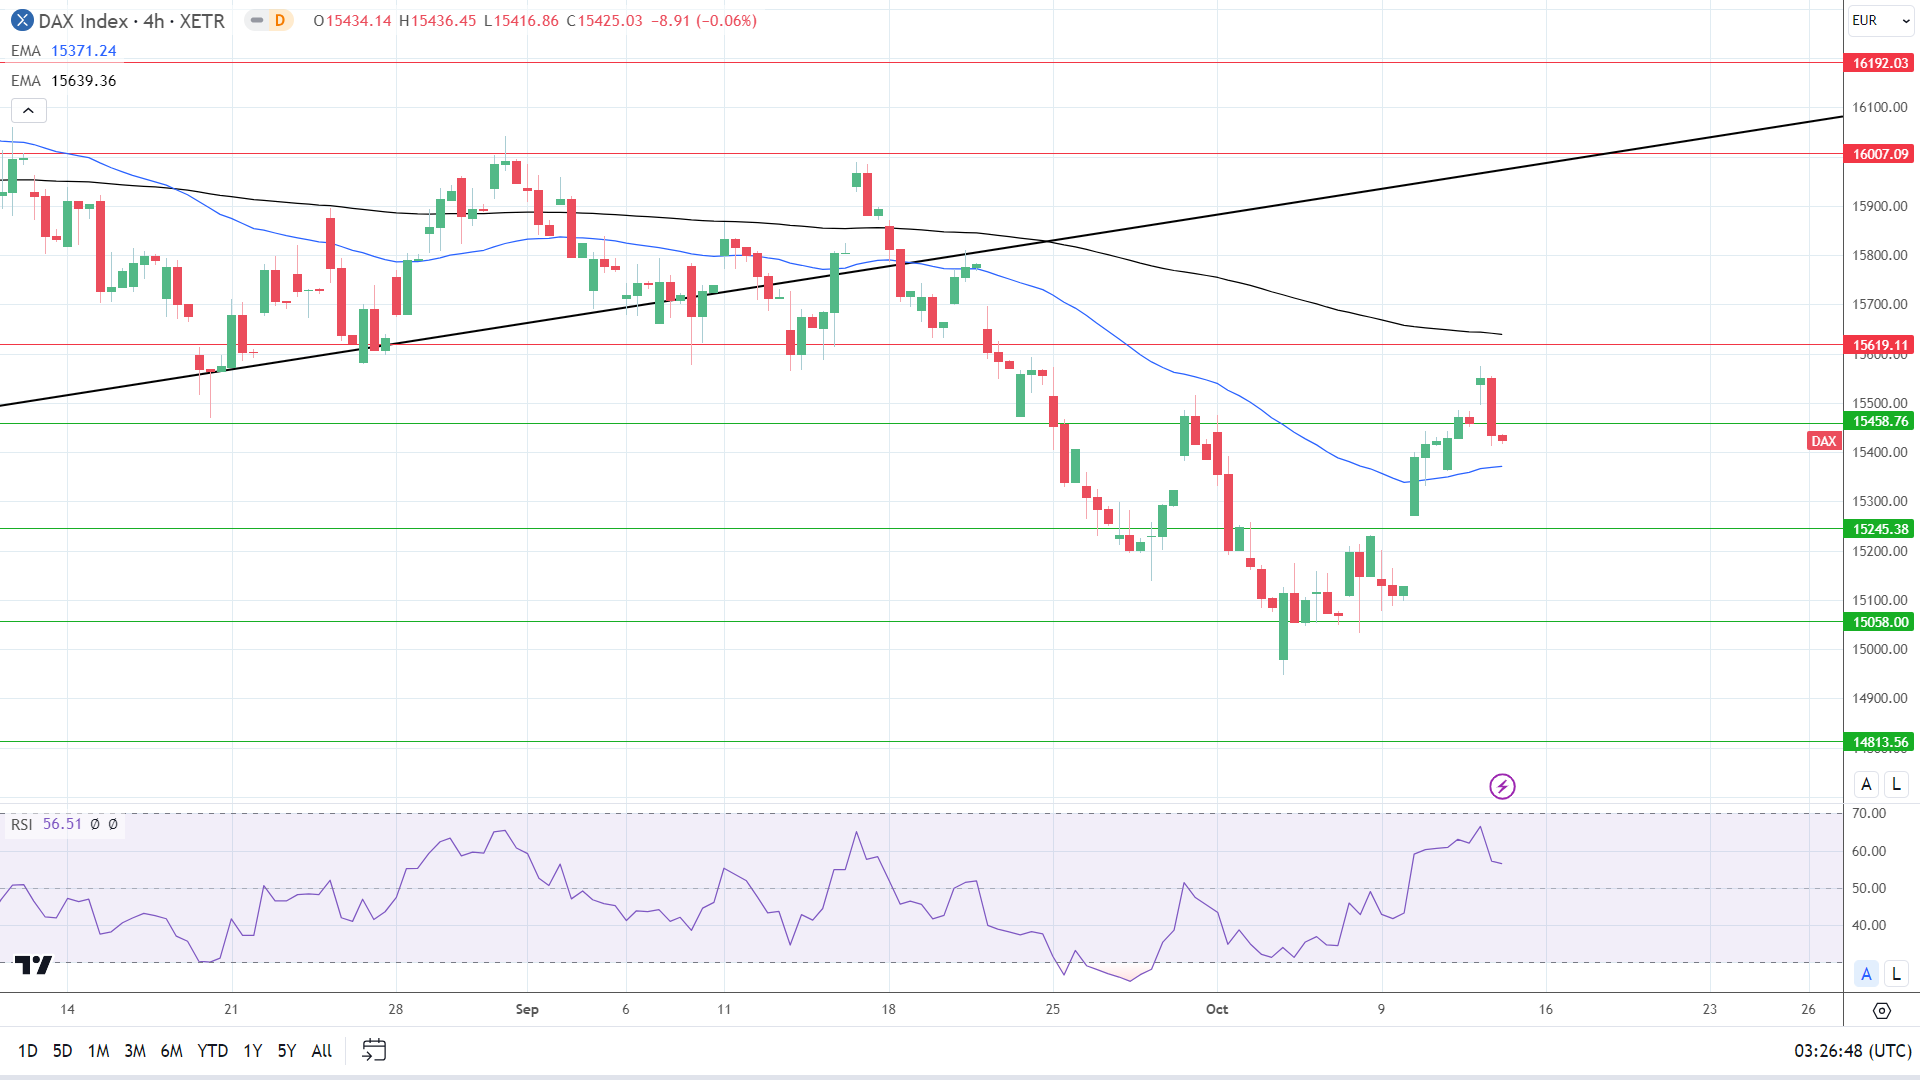
On Thursday, the DAX declined by 0.23%. Reversing a 0.24% gain from Wednesday, the DAX ended the day at 15,425.

ECB Growth Concerns and US CPI Report Weighed

The ECB monetary policy meeting minutes revealed an uncertain interest rate outlook. Executive board members deemed the risk to inflation more balanced while raising concerns about growth.

Trading Derivatives carries a high level of risk to your capital and you should only trade with money you can afford to lose. Trading Derivatives may not be suitable for all investors, so please ensure that you fully understand the risks involved, and seek independent advice if necessary. A Product Disclosure Statement (PDS) can be obtained either from this website or on request from our offices and should be considered before entering into a transaction with us. Raw Spread accounts offer spreads from 0.0 pips with a commission charge of USD $3.50 per 100k traded. Standard account offer spreads from 1 pips with no additional commission charges. Spreads on CFD indices start at 0.4 points. The information on this site is not directed at residents in any country or jurisdiction where such distribution or use would be contrary to local law or regulation.

While the ECB minutes drew interest, the US CPI Report sent the DAX into negative territory for the session. A hotter-than-expected US CPI Report raised bets on a Fed rate hike, weighing on demand for riskier assets.

US initial jobless claims continued to signal a tight labor market, giving the Fed more reason to push interest rates higher.

The US equity markets responded to the numbers with modest losses. On Thursday, the Nasdaq Composite Index fell by 0.63%. The S&P 500 and the Dow ended the day down 0.62% and 0.51%, respectively.

The Thursday Market Movers

Defense stock Rheinmetall (+2.72%) continued to rise as investors responded further to the Middle East conflict.

However, the negative sentiment toward the economic outlook left online retailer Zalando (-1.71%) deep in negative territory.

Bank stocks also struggled, with Commerzbank and Deutsche Bank ending the day down 1.01% and 0.53%, respectively.

It was a mixed session for the auto sector. While stimulus plans from China offered support, a gloomy outlook for the European economy tested buyer appetite.

Continental and Volkswagen saw losses of 1.49% and 0.60%, with Porsche and BMW falling by 0.13% and 0.06%. Mercedes Benz Group and Daimler Truck Holding bucked the trend, gaining 0.52% and 0.29%, respectively.

Central Bank Commentary and US Consumer Sentiment in Focus

On Friday, Eurozone industrial production figures will garner investor interest. Economists forecast industrial production to increase by 0.1% in August vs. a 1.1% fall in July.

After the ECB monetary policy meeting minutes, ECB President Lagarde may offer further guidance on interest rate goals. The ECB President is attending the IMF/World Bank Annual Meetings.

However, US economic indicators and Fed speeches may have more influence on investor sentiment. After the US CPI Report, an unexpected rise in consumer sentiment would support a Fed rate hike to curb inflation. Economists forecast the Michigan Consumer Sentiment Index to fall from 68.1 to 67.2 in October.

Beyond the numbers, Fed speeches will warrant consideration. Reaction to the US CPI Report would move the dial. FOMC member Patrick Harker is on the economic calendar to speak.

Earlier today, inflation and trade data from China sent mixed signals. A continued year-over-year fall in producer prices may test buyer appetite for DAX-listed stocks.

The DAX was down 24 points, while the Nasdaq mini was up 13 points this morning.

Short-Term Forecast

Near-term trends hinge on central bank monetary policy intentions. A more hawkish Fed interest rate path will likely pressure the DAX. The negative outlook toward the German economy remains another headwind amidst ECB plans to keep interest rates higher for longer.

DAX Technical Indicators

Daily Chart

The DAX sat below the 50-day and 200-day EMAs, sending bearish price signals.

A break above the 200-day EMA and 15,459 resistance level would support a move toward the 50-day EMA and 15,619 resistance level. However, selling pressure will likely intensify at 15,450. The 200-day EMA is confluent with the 15,459 resistance level.

Weaker-than-expected US consumer sentiment numbers and dovish Fed speeches would support a positive session.

However, failure to break above the 200-day EMA would leave the 15,245 support level in play.

The 14-day RSI reading of 49.06 suggests a DAX fall to the 15,245 support level before entering oversold territory.

DAX Daily Chart sends bearish price signals.

DAX 131023 Daily Chart

4-Hourly Chart

The DAX sits above the 50-day EMA while remaining below the 200-day EMA, sending bullish near-term but bearish longer-term price signals. A DAX break above the 15,459 resistance level would support a move toward the 15,619 resistance level and 200-day EMA.

However, a fall through the 50-day EMA would give the bears a run at the 15,245 support level.

The 56.51 14-4 hour RSI reading indicates a DAX break above the 15,459 resistance level and a return to 15,500 before entering the overbought territory.

4-Hourly Chart sends bullish near-term price signals.
DAX 131023 4-Hourly Chart
EUR/USD Forecast: Euro Area Woes vs. US Consumer Confidence Showdown

EUR/USD Forecast: Euro Area Woes vs. US Consumer Confidence Showdown

Thursday Overview

On Thursday, the EUR/USD slid by 0.86%. Reversing a 0.13% gain from Wednesday, the EUR/USD ended the day at $1.05280. The EUR/USD rose to a high of $1.06396 before falling to a low of $1.05256.

Inflation, Production, and ECB President Lagarde in Focus

French inflation and Eurozone industrial production figures will garner investor interest on Friday. Inflation remains a hot topic of debate for the ECB. Upward revisions to prelim French inflation figures may test market bets on an ECB hold on interest rates.

Trading Derivatives carries a high level of risk to your capital and you should only trade with money you can afford to lose. Trading Derivatives may not be suitable for all investors, so please ensure that you fully understand the risks involved, and seek independent advice if necessary. A Product Disclosure Statement (PDS) can be obtained either from this website or on request from our offices and should be considered before entering into a transaction with us. Raw Spread accounts offer spreads from 0.0 pips with a commission charge of USD $3.50 per 100k traded. Standard account offer spreads from 1 pips with no additional commission charges. Spreads on CFD indices start at 0.4 points. The information on this site is not directed at residents in any country or jurisdiction where such distribution or use would be contrary to local law or regulation.

Amidst the elevated interest rate environment, the economic outlook for the euro area has gotten murkier. Eurozone industrial production numbers would need to beat forecasts to support the EUR/USD at current levels.

The euro area manufacturing sector contributes less than 20% to GDP. However, recessionary jitters expose the EUR/USD to weak manufacturing data.

Beyond the numbers, ECB President Lagarde speeches will warrant consideration. After the ECB monetary policy meeting minutes, forward guidance on interest rates will influence buyer appetite for the EUR/USD.

US Consumer Sentiment and Fed Commentary in Focus

Michigan Consumer Sentiment figures from the US will garner investor interest on Friday. After the hotter-than-expected US CPI Report, an improvement in consumer sentiment would support a more hawkish Fed rate path.

An uptrend in consumer confidence would signal a pickup in consumer spending and fuel demand-driven inflationary pressure. Higher interest rates would affect borrowing costs and disposable incomes, forcing consumers to curb spending. A pullback in spending would ease demand-driven inflationary pressures.

Beyond the numbers, updates on the Middle East conflict and upcoming Fed speeches warrant attention. FOMC member Patrick Harker is on the economic calendar to speak.

Short-Term Forecast:

The EUR/USD rests in the hands of US consumer sentiment and Fed commentary today. Hawkish Fed chatter and a pickup in consumer sentiment would tilt monetary policy divergence toward the US dollar. An escalation in the Middle East conflict would also fuel demand for the safe havens, including the greenback.

EUR/USD Price Action

Daily Chart

The EUR/USD remained below the 50-day and 200-day EMAs, sending bearish price signals.

A EUR/USD break above the $1.06342 resistance level would bring the 50-day EMA into play.

Dovish Fed comments and a slump in US consumer sentiment would ease the buying appetite for the US dollar. However, hawkish Fed comments would support a EUR/USD break below the $1.05230 support level.

A break below the $1.05230 support level would give the bears a run at sub-$1.05.

The 14-period Daily RSI, 42.51, indicates a EUR/USD drop below $1.05 before entering oversold territory.

EUR/USD Daily Chart sends bearish price signals.
EURUSD 131023 Daily Chart

4-Hour Chart

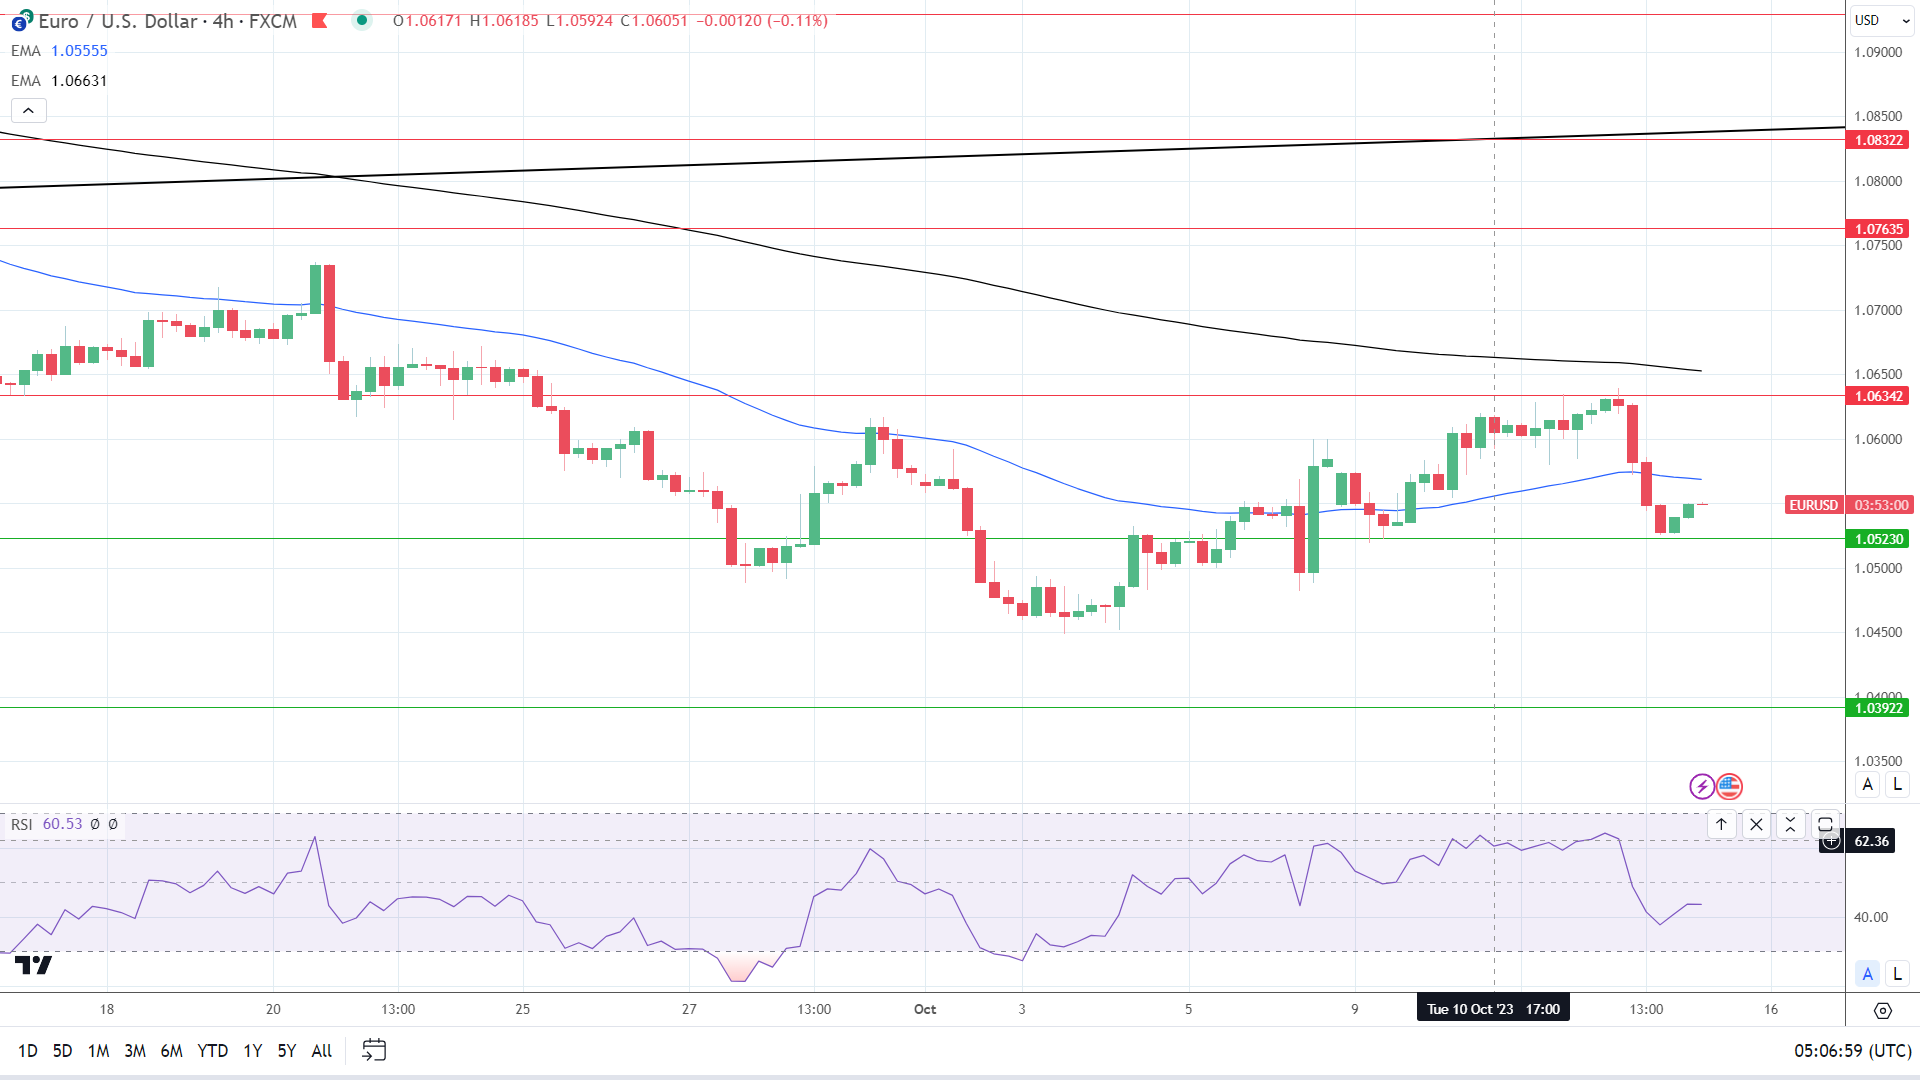
The EUR/USD sits below the 50-day and the 200-day EMAs, affirming bearish price signals. A EUR/USD break above the 50-day EMA would support a move toward the $1.06342 resistance level.

However, a fall through the $1.05230 support level would give the bears a run at sub-$1.05.

The 14-period RSI on the 4-hour chart, 60.53, supports a EUR/USD break above the 50-day EMA before entering overbought territory.

4-Hourly Chart affirms bearish price signals.
EURUSD 131023 4 Hourly Chart
Nasdaq 100, Dow Jones, S&P 500 News: Inflation Worries, Earnings Causing Early Jitters

Nasdaq 100, Dow Jones, S&P 500 News: Inflation Worries, Earnings Causing Early Jitters

Market Braces for Earnings Amid Volatility

U.S. stock futures signaled a bearish start to the trading day on Friday as investors await pivotal earnings reports from leading financial institutions.

Dow Jones, S&P 500, and Nasdaq Composite futures all retreated, erasing some of the week’s earlier gains. This skittish behavior comes despite the indices each trending positively for the week and shaking off consecutive losses from previous weeks.

Trading Derivatives carries a high level of risk to your capital and you should only trade with money you can afford to lose. Trading Derivatives may not be suitable for all investors, so please ensure that you fully understand the risks involved, and seek independent advice if necessary. A Product Disclosure Statement (PDS) can be obtained either from this website or on request from our offices and should be considered before entering into a transaction with us. Raw Spread accounts offer spreads from 0.0 pips with a commission charge of USD $3.50 per 100k traded. Standard account offer spreads from 1 pips with no additional commission charges. Spreads on CFD indices start at 0.4 points. The information on this site is not directed at residents in any country or jurisdiction where such distribution or use would be contrary to local law or regulation.

Meanwhile, lingering fears of stubborn inflation persist, particularly after September’s Consumer Price Index showed a 0.4% uptick, fueling concerns of more aggressive interest rate adjustments by the Federal Reserve.

Dollar General in Leadership Flux

In the retail sector, Dollar General‘s stock saw a nearly 8% uptick in extended trading as the company announced the reappointment of Todd Vasos as CEO, replacing Jeff Owen. Owen’s leadership period was marked by stagnating sales growth and increasing scrutiny over workplace conditions. Alongside this executive shake-up, Dollar General revised its full-year profit projections downward, adding another layer of uncertainty to an already jittery market environment.

Earnings Season Kicks Off

Wall Street is eyeing the third-quarter earnings reports from banking giants JPMorgan, Wells Fargo, and Citigroup with apprehension. The financial sector already faces challenges ranging from stringent regulatory capital requirements to looming recession fears, adding to investor nervousness.

However, some experts argue that the market might be overestimating the downside. Nancy Tengler, Chief Investment Officer at Laffer Tengler Investments, for example, posits that we could see earnings surprise on the upside, as companies are better poised to manage current economic conditions than many believe.

Sectors in Focus

The tech and industrial sectors are likely to be the frontrunners in an end-of-year market rally, suggests Tengler. This is noteworthy given the comparatively unimpressive performance of certain banking stocks like Wells Fargo and Citigroup, which have struggled to keep up with the S&P Bank ETF. Both have shown mixed results over the past month and will be under the microscope as they report their earnings.

Tentative Sentiment Ahead

With a plethora of crucial financial data slated for release, the market’s sentiment seems cautious but not entirely negative. Earnings reports and preliminary consumer sentiment data for October will be closely scrutinized for signals on market direction. It promises to be a decisive day for investors, who will look to navigate through the current uncertainties and position themselves for the last quarter of the year.

Technical Analysis

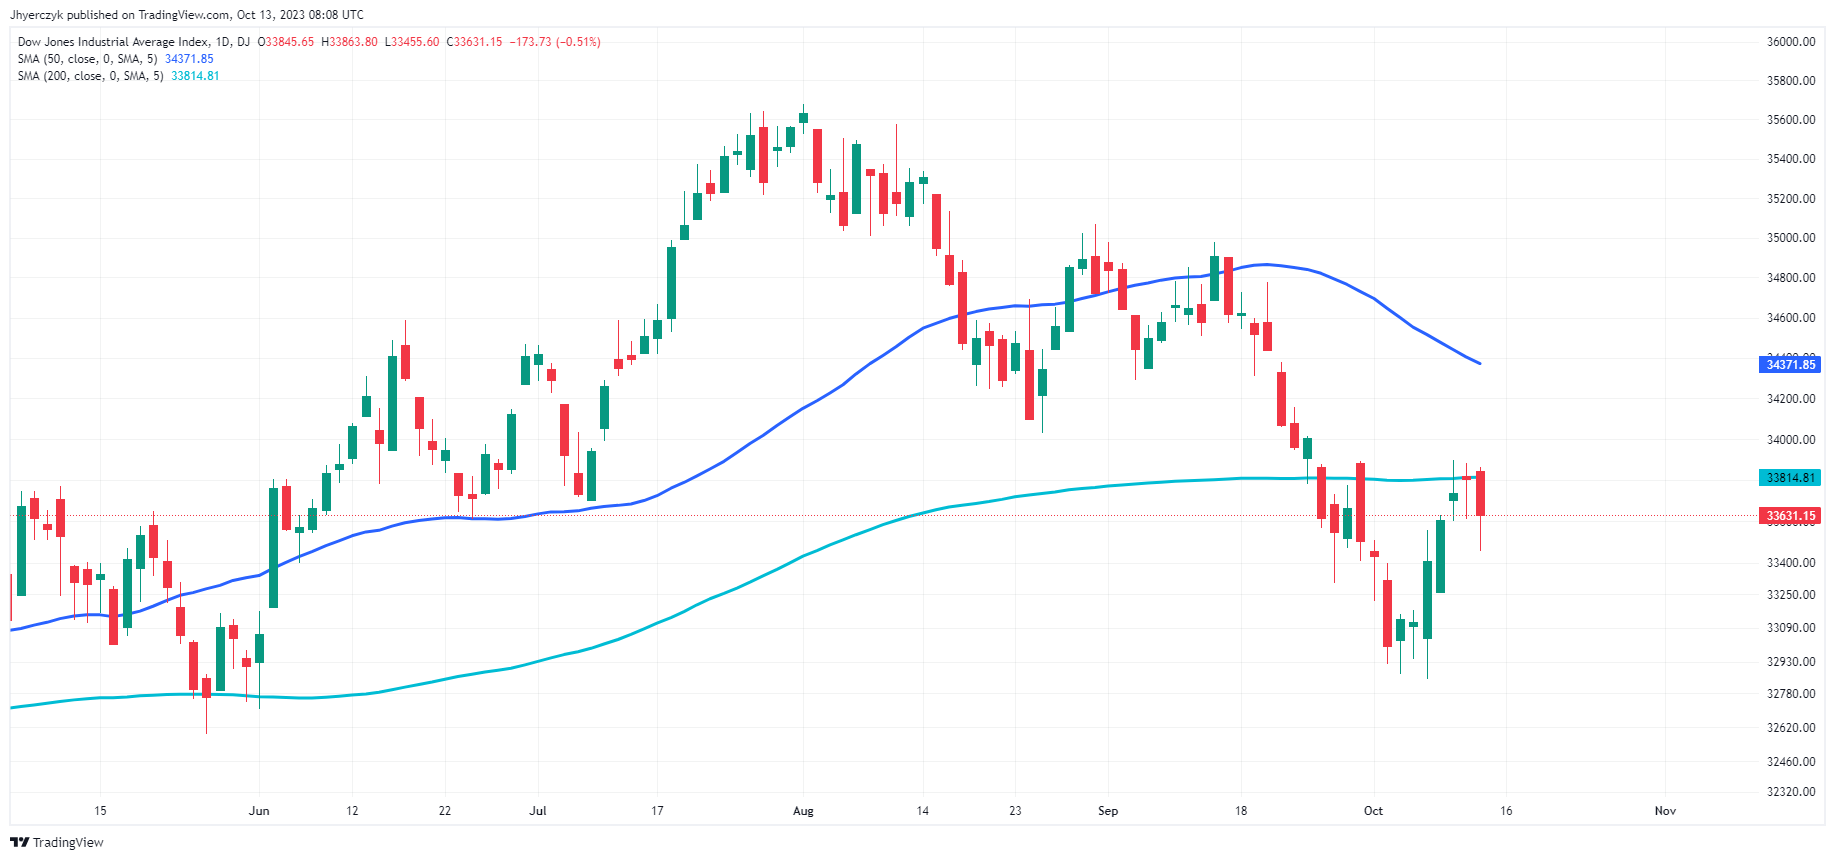
Daily Dow Jones Industrial AverageThe Dow Jones Industrial Average stands at 33631.15, below both the 200-day moving average of 33814.81 and the 50-day moving average of 34371.85. This positioning typically indicates a bearish sentiment and may signal further downside potential.

The current price also marks a decline compared to the previous daily close of 33804.88, reinforcing the bearish outlook. ‘

The underperformance relative to both key moving averages becomes even more critical in assessing market sentiment. Based on these technical indicators, the current market sentiment for the Dow Jones appears bearish. However, momentum can shift to the upside if buyers recover the 200-day moving average at 33814.81.