Silver Prices Forecast: XAG/USD Jumps on Geopolitical Tensions and Fed Speculation

Silver Prices Forecast: XAG/USD Jumps on Geopolitical Tensions and Fed Speculation

Silver’s Surge Amid a Perfect Storm of Factors

Silver (XAG/USD) is basking in its strongest weekly gains in months, buoyed not just by geopolitical turmoil in the Middle East but also by speculation that the Fed’s interest rate hikes may be winding down. Concurrently, gold’s stellar performance this week lends credence to silver’s uptick. With spot silver up 1.32% at $22.12 and U.S. silver futures rising 1.35% to $22.26, the market’s trajectory is clearly upwards.

Federal Reserve’s Changing Winds

The Federal Reserve’s policy moves have long had the financial markets on a string. Despite recent U.S. inflation data showing only a modest increase in consumer prices, market sentiment suggests the Fed’s rate-hiking days could soon be over. This has led to a pullback in both Treasury yields and the dollar, further bolstering silver’s appeal.

Trading Derivatives carries a high level of risk to your capital and you should only trade with money you can afford to lose. Trading Derivatives may not be suitable for all investors, so please ensure that you fully understand the risks involved, and seek independent advice if necessary. A Product Disclosure Statement (PDS) can be obtained either from this website or on request from our offices and should be considered before entering into a transaction with us. Raw Spread accounts offer spreads from 0.0 pips with a commission charge of USD $3.50 per 100k traded. Standard account offer spreads from 1 pips with no additional commission charges. Spreads on CFD indices start at 0.4 points. The information on this site is not directed at residents in any country or jurisdiction where such distribution or use would be contrary to local law or regulation.

The Safe-Haven Factor

Amid the escalating conflict between Israel and Palestinian group Hamas, silver’s role as a safe-haven asset is being cemented. With geopolitical uncertainty reaching new heights, traders are increasingly viewing silver as a stable investment option.

China’s Softening Economy

China, a major player in the silver market, has exhibited weaker-than-expected inflation rates and factory prices, indicating persistent deflationary pressures. This is a bullish signal for silver prices, as deflationary scenarios often support demand for the precious metal.

Short-Term Forecast

Taking into account Fed policy speculation, global geopolitical tensions, and economic signals from China, silver appears poised to continue its upward journey. In the short term, expect silver to trade between $22.45 and $24.05, supported by economic uncertainties both in the U.S. and globally.

Technical Analysis

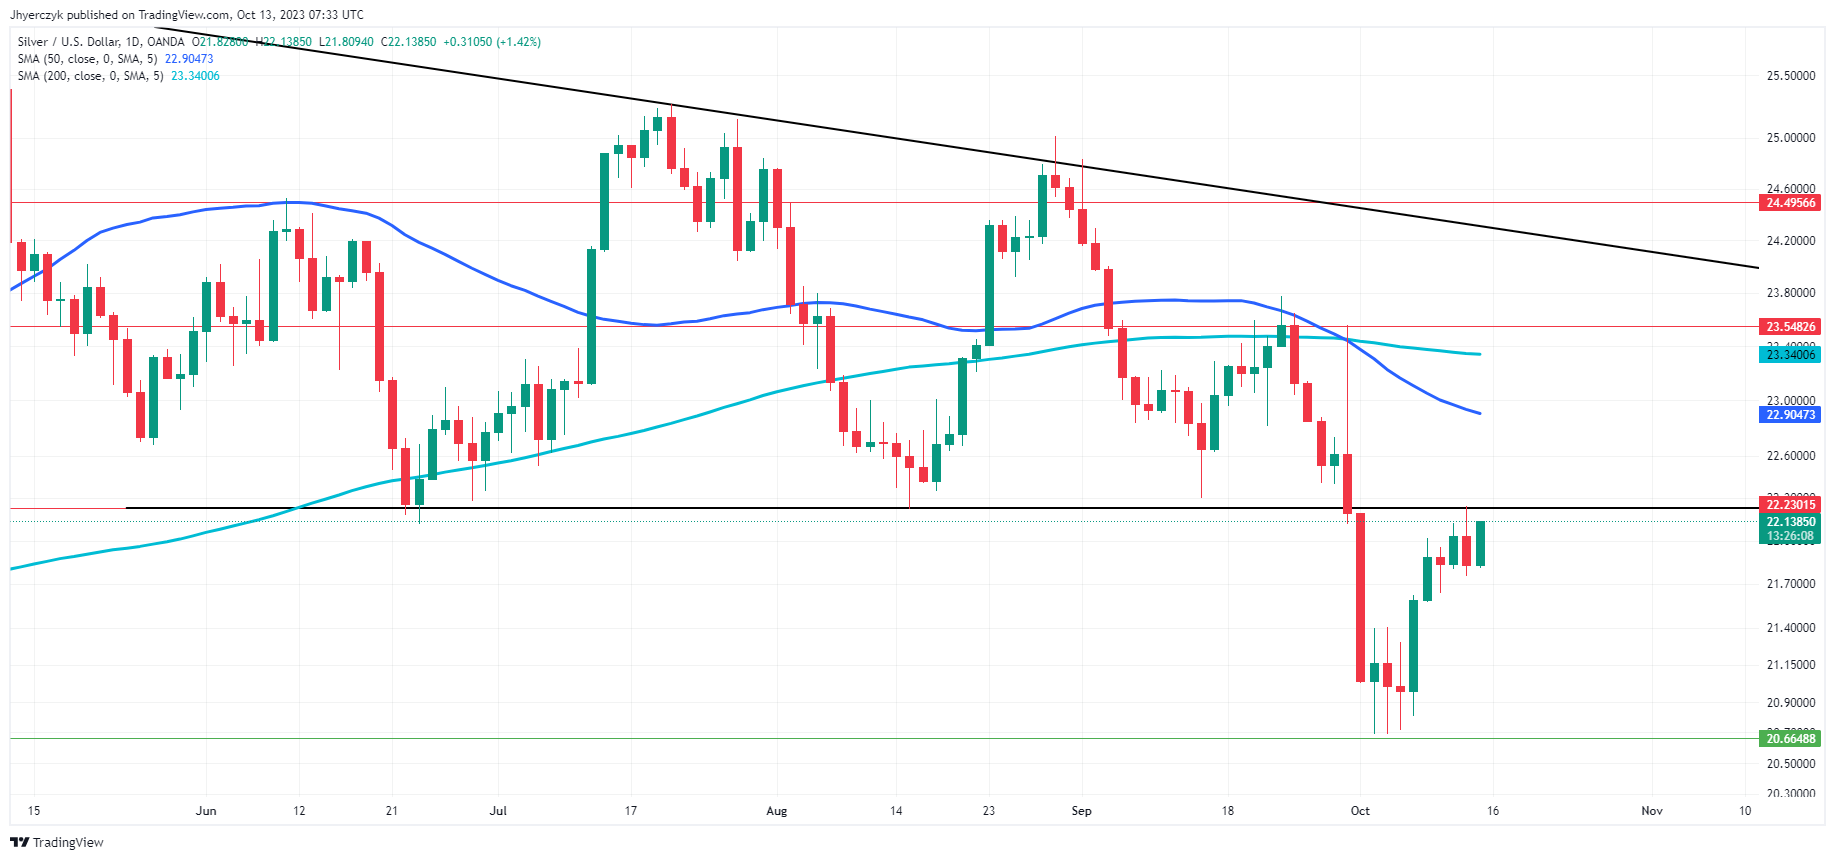
Daily Silver (XAG/USD)The current daily price of silver (XAG/USD) at $22.13 is trading below both its 200-day and 50-day moving averages, at $23.34 and $22.90 respectively, confirming a bearish bias in the medium term.

However, the price is notably near the trend line support of $22.23, which it had previously broken. Its approach towards this former support level is critical; recapturing it could signal renewed bullish strength.

While the market has minor resistance at $23.55 and more significant resistance at $24.50, it currently sits above the minor support level of $20.66.

Despite this, given its position relative to key moving averages and trend lines, the market sentiment leans bearish but watchful. Additionally, trader reaction to the former trend line support at $22.23 will set the tone on Friday.

Gold Prices Forecast: XAU/USD Hits 7-Month Peak Amid Fed Uncertainty

Gold Prices Forecast: XAU/USD Hits 7-Month Peak Amid Fed Uncertainty

Gold’s Best Week in Seven Months

Gold (XAU/USD) is enjoying its most robust weekly performance in over half a year, lifted by geopolitical tensions in the Middle East and market speculation that the U.S. Federal Reserve’s interest rate hike cycle may be coming to an end. Spot gold was up by 0.3% at $1,873.25 per ounce, while U.S. gold futures added 0.2% to $1,885.80.

Federal Reserve Speculation and Market Response

Recent U.S. inflation data failed to significantly alter the market’s view on the Fed’s next moves. Despite a modest uptick in consumer prices, Treasury yields and the dollar have pulled back. Market sentiment appears to be gravitating towards the belief that the era of rate hikes could be drawing to a close.

Trading Derivatives carries a high level of risk to your capital and you should only trade with money you can afford to lose. Trading Derivatives may not be suitable for all investors, so please ensure that you fully understand the risks involved, and seek independent advice if necessary. A Product Disclosure Statement (PDS) can be obtained either from this website or on request from our offices and should be considered before entering into a transaction with us. Raw Spread accounts offer spreads from 0.0 pips with a commission charge of USD $3.50 per 100k traded. Standard account offer spreads from 1 pips with no additional commission charges. Spreads on CFD indices start at 0.4 points. The information on this site is not directed at residents in any country or jurisdiction where such distribution or use would be contrary to local law or regulation.

Geopolitical Tensions and Safe-Haven Status

Adding to gold’s allure is its traditional role as a safe-haven asset. Ongoing military conflicts between Israel and Palestinian group Hamas have contributed to the metal’s rise. These geopolitical tensions have solidified gold’s role as a stable investment, particularly when uncertainty looms large on the global stage.

China’s Economic Data and Deflationary Pressures

Another contributing factor to gold’s rise comes from China, the world’s largest consumer of the precious metal. Recent data showed weaker-than-expected inflation and factory-gate prices, signaling that deflationary pressures are persistent, which typically supports gold prices.

Short-Term Outlook: Bullish

Given the amalgamation of Fed speculation, geopolitical tensions, and global economic indicators, gold is likely to maintain its upward trajectory in the near term. Traders should watch for gold prices to trade in the range of $1,856 to $1,904, supported by a possible slowdown in the U.S. economy and persistent global uncertainties.

Technical Analysis

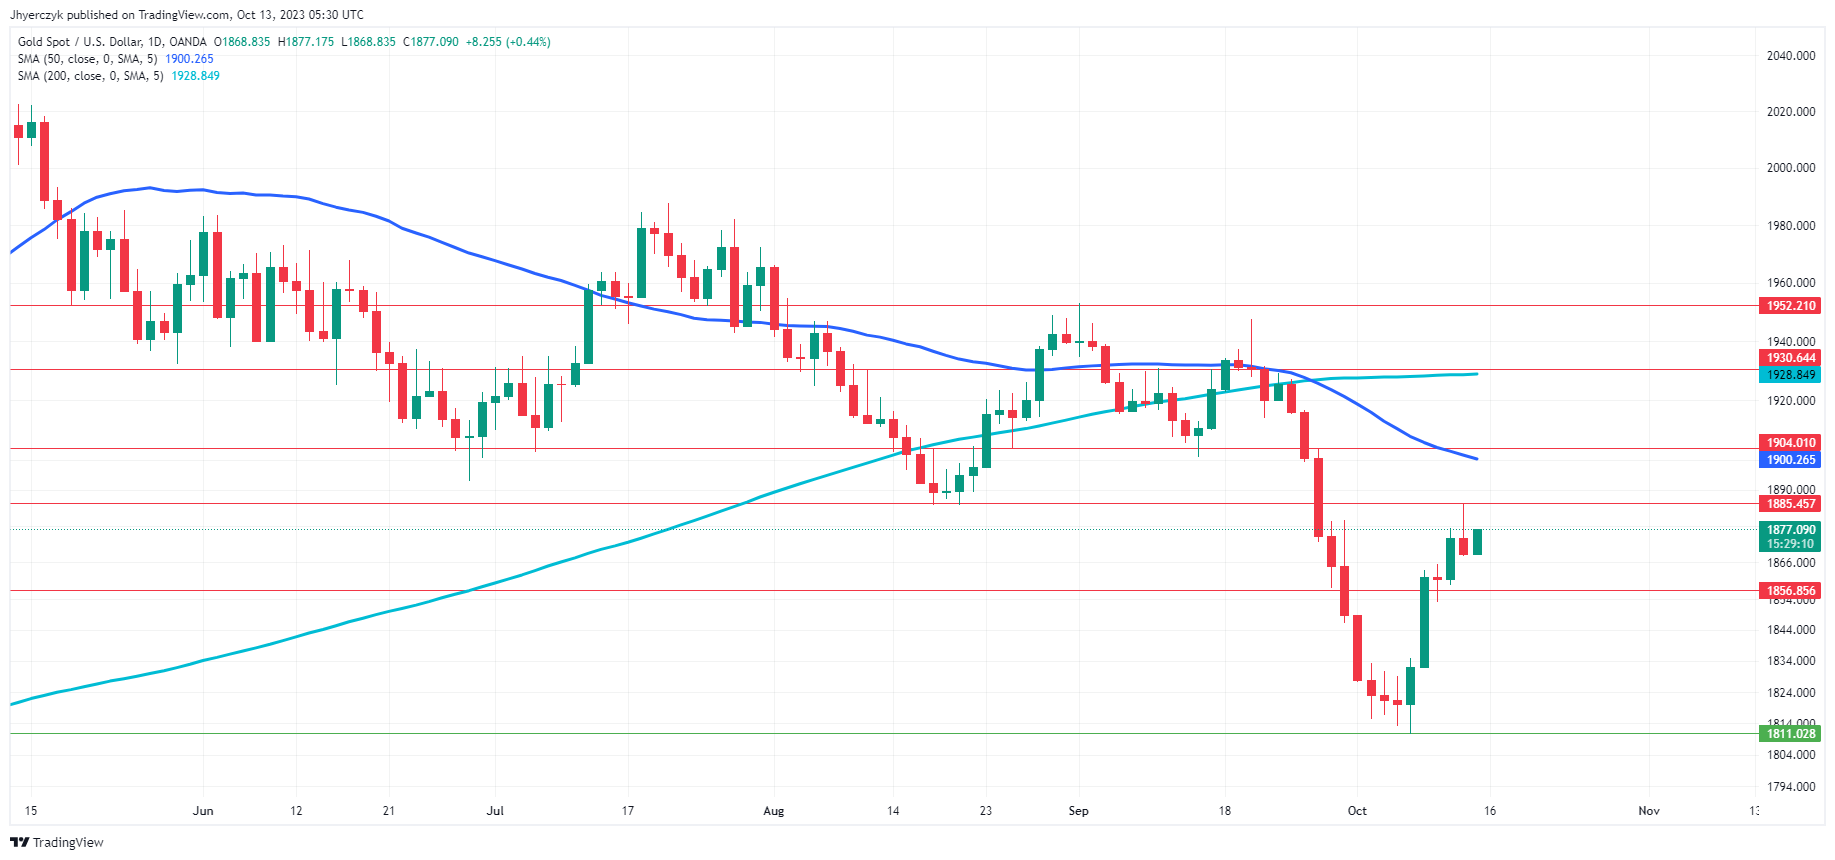
Daily Gold (XAU/USD)The current daily price of Gold (XAU/USD) at $1876.94, while below the 200-day and 50-day moving averages, does reside above the minor resistance at $1856.86 and well above the minor support at $1811.03.

This indicates a degree of bullishness and strength in the market as it has successfully surpassed these levels. It seems the market is challenging the main resistance at $1885.46.

The scenario suggests a mixed sentiment: bearish due to moving averages but somewhat bullish as the price is above minor resistance and support.

China Trade Surplus Widens as Exports Suggest an Improving Demand Environment

China Trade Surplus Widens as Exports Suggest an Improving Demand Environment

China Trade Surplus Widened to $77.71 Billion

The Chinese US dollar trade surplus widened from $68.36 billion to $77.71 billion in September. Economists forecast a trade surplus of $70.00 billion.

Significantly, exports fell by 6.2% year-over-year vs. -8.8% in August, with imports down 6.2% vs. -7.3% in August. Economists predicted exports and imports to decline by 7.6% and 6.0%, respectively.

Less marked declines in imports and exports suggest an improving macroeconomic environment. With more stimulus from China on the way, the markets may consider the worst is over for the Chinese economy.

However, the Middle East conflict remains a headwind for the global financial markets. An escalation in the conflict would likely impact supply chains, inflation, and demand.

China Inflation Failed to Impress

Earlier in the Friday session, inflation figures from China also drew investor interest. Consumer prices increased by 0.2% month-on-month in September vs. 0.3% in August, while consumer prices were unchanged year-over-year. Economists forecast an annual inflation rate of 0.2% and for consumer prices to increase by 0.3% in September.

Significantly, producer prices declined by 2.5% year-over-year vs. a 3.0% fall in August. Economists predicted a 2.4% decline.

While falling short of forecasts, the less marked fall in producer prices signaled a possible pickup in demand. Nonetheless, factory prices declined for the twelfth month in a row.

AUD/USD Reaction to the China Trade Data

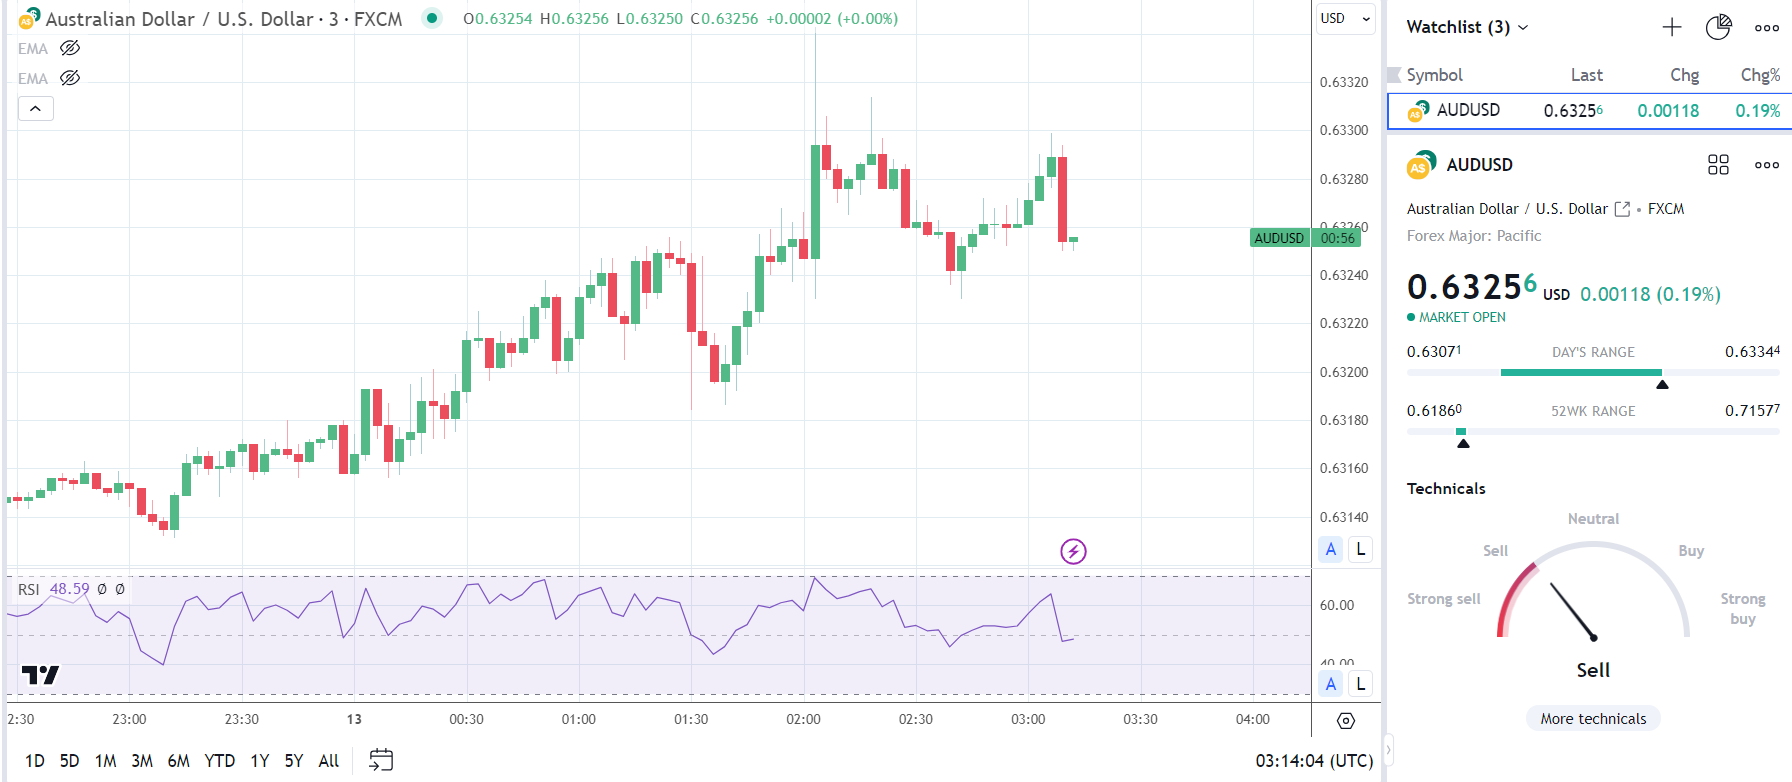
Before the trade data, the AUD/USD fell to a pre-stat low of $0.63071 before rising to a high of $0.63344.

However, in response to the trade figures, the AUD/USD rose to a post-stat high of $0.63299 before falling to a low of $0.63250.

This morning, the AUD/USD was up 0.19% to $0.63256.

AUD to USD response to the China trade data.
131023 AUDUSD 3 Minute Chart

Up Next

New loan figures from China will warrant consideration on Thursday. An increase in new Yuan loans would signal a pickup in economic activity. Economists forecast new Yuan loans to increase from CNY1,360 billion to CNY2,500 billion in September.

In the US session, consumer sentiment will be the focal point. Economists predict the Michigan Consumer Sentiment Index to decline from 68.1 to 67.2 in October.

After the hotter-than-expected US CPI Report, an unexpected pickup in consumer sentiment may incentivize the Fed to hike rates to tackle inflation.

US Dollar Post-CPI Rally May Reverse, EUR/USD Creeping Higher

US Dollar Post-CPI Rally May Reverse, EUR/USD Creeping Higher

The US dollar rallied by over one big figure yesterday after the latest US inflation data release. Core inflation y/y fell from 4.3% to 4.1% in September, as expected, while headline inflation y/y remained unchanged at 3.7%, one-tenth of a percentage point above market estimates of 3.6%.

image1.png

Headline US inflation remained unchanged at 3.7% with the shelter costs contributing to around half of the monthly rise while a rise in gasoline prices was also a major contributor to the all items monthly rise. According to the US Bureau of Labor Statistics, ‘while the major energy component indexes were mixed in September, the energy index rose 1.5 percent over the month.’

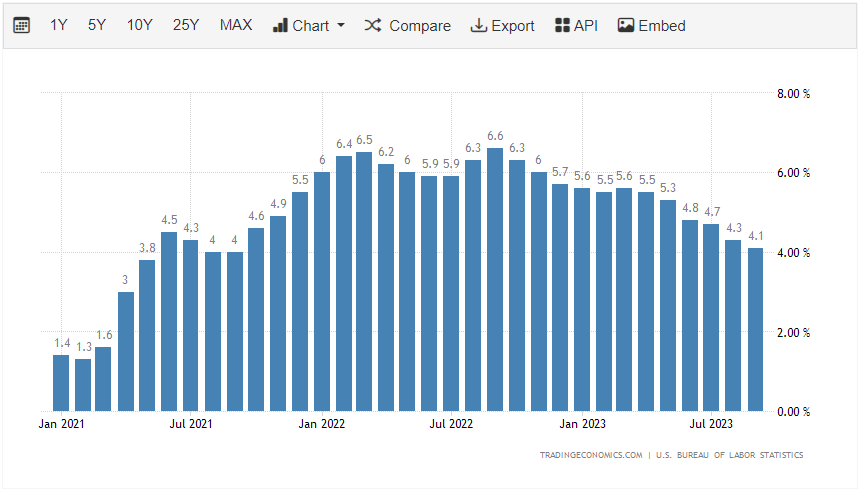
Core US inflation fell on the month and slipped to its lowest level since September 2021 and has fallen from a peak of 6.6% over the last 14 months.

US Core Inflation

image2.png

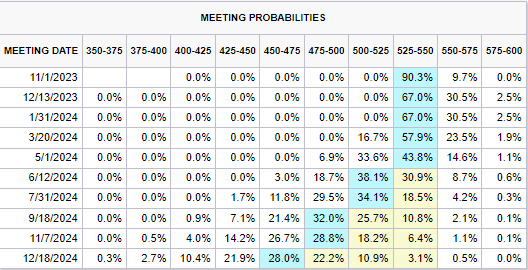
The miss in headline inflation pushed US bond yields higher but future rate hike expectations only moved by a handful of percentage points. The closely followed CME FedWatch tool still suggests that Fed Funds will remain untouched until mid-2024 when the Fed will start cutting interest rates.

CME FedWatch Tool

image3.png

Our Brand New Q4 Trading Opportunities are Now Available to Download

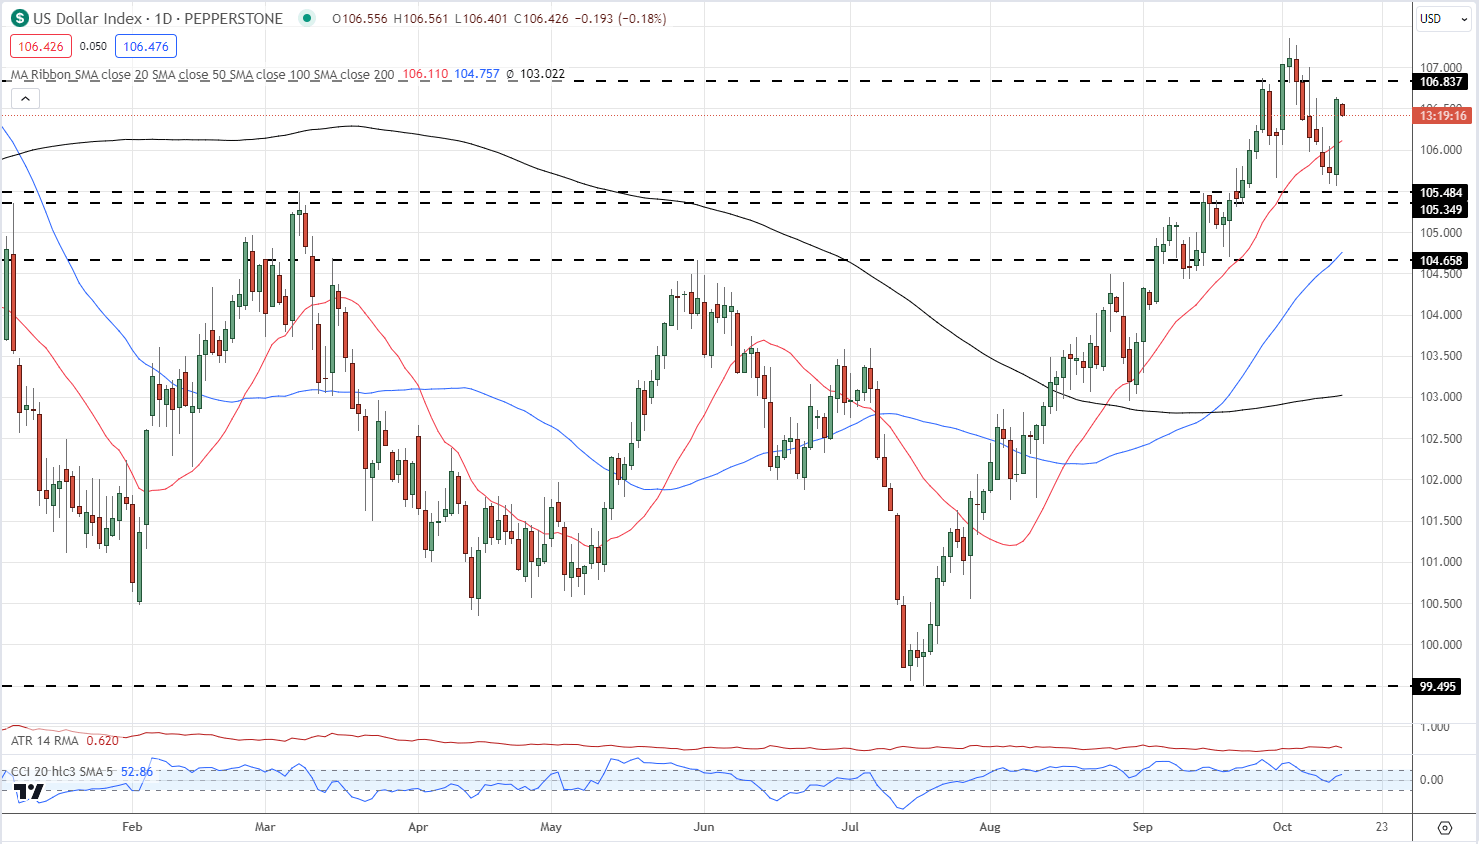
The US dollar had been on the back foot over the week, prior to yesterday’s move, and the likelihood is that Thursday’s move is more a case of overreacting than the belief that the greenback will rally again. One poor data point, a 0.1% miss, does not signal a turnaround in the US dollar’s fortune.

US Dollar Index Daily Price Chart – October 13, 2023

image4.png

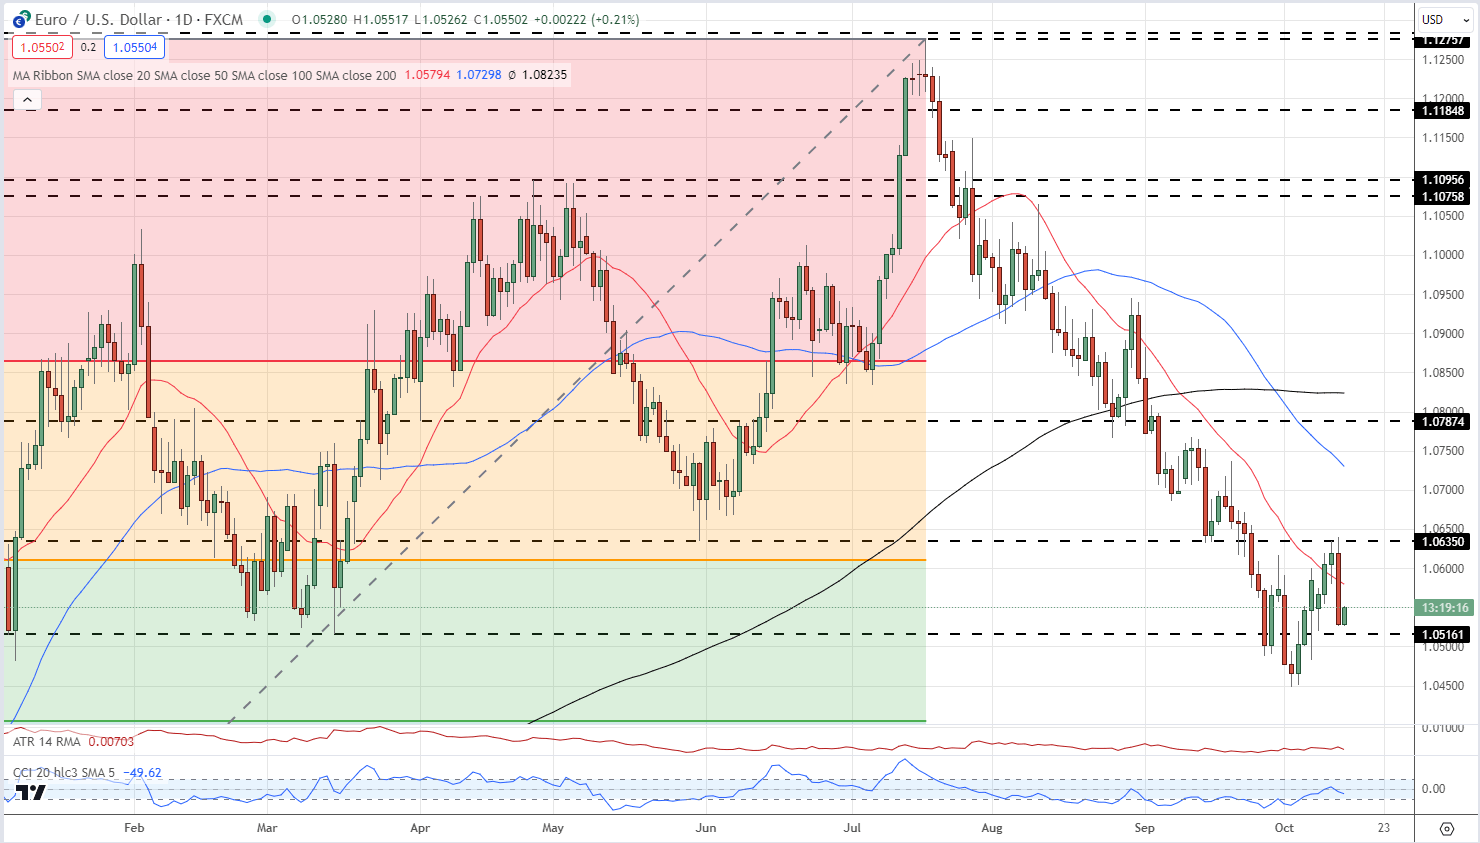
EUR/USD has been a beneficiary of recent US dollar weakness and has twice touched an area of prior resistance we indicated on the daily chart around 1.0635. The pair now trades around 1.0550 and is nearing an old horizontal support level at 1.0516, and this needs to hold otherwise the pair is likely to attempt to break big-figure support at 1.05 again.

EUR/USD Daily Price Chart – October 13, 2023

image5.png

While the recent US dollar move has provided fx traders with a much-needed boost of volatility, US Q3 earnings start in earnest with a clutch of US banks reporting before the US stock market opens. Today BlackRock (BLK), Citigroup (CITI), JPMorgan Chase (JPM), and Wells Fargo (WFC) open their books and their performance over the last three months may give more of a clue to the health of the US economy. A boost in pre-weekend volatility is likely.

US Dollar Technical Setups: AUD/USD Plummets While USD/CAD Skyrockets

US Dollar Technical Setups: AUD/USD Plummets While USD/CAD Skyrockets

The U.S. dollar, as measured by the DXY, embarked on a furious rally on Thursday after hotter-than-expected U.S. September inflation data sent Treasury yields sharply higher and increased the likelihood that the Fed will deliver another quarter-point rate hike at its December meeting. In this context, the Loonie (CAD) and the Aussie (AUD) suffered a major setback and took a beating against the greenback, with both currencies nearing their weakest levels in several months. Detailed technical analyses for AUD/USD and USD/CAD are provided below in consideration of these developments.

USD/CAD TECHNICAL ANALYSIS

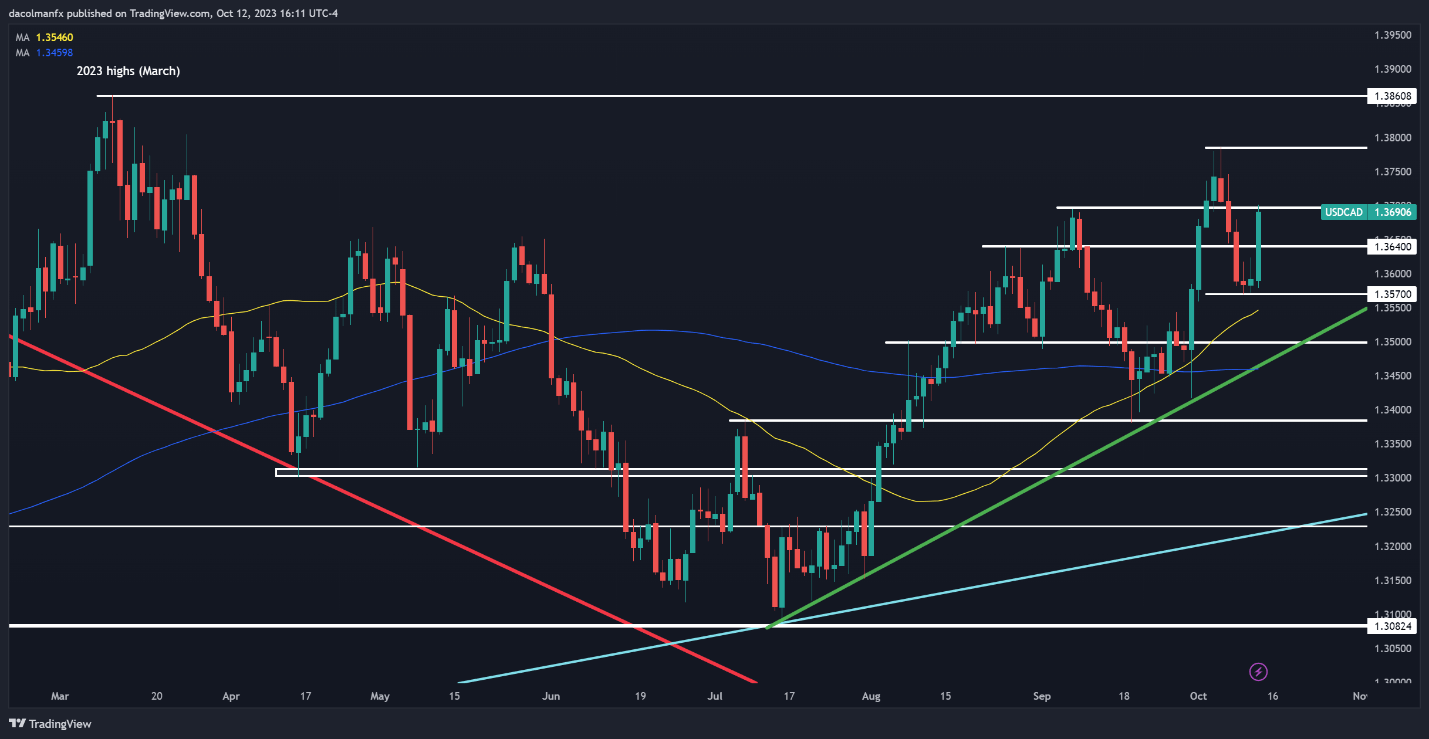
USD/CAD surged on Thursday, blasting past a key technical ceiling at 1.3640 and pushing towards the 1.3700 handle, another important level that could cap further advances.

With a strong bullish momentum firmly in place for USD/CAD and prices following a well-defined uptrend, it may pose a considerable challenge for sellers to regain control of the market, suggesting that the path of least resistance may be higher.

In terms of possible scenarios, if the pair manages to clear the 1.3700 mark decisively, the bears may throw in the towel, setting the stage to move towards the October’s swing high, which hovers just below the 1.3800 threshold. On further strength, the focus shifts to the 2023 peak.

Conversely, if prices turn lower from their current position and begin to retreat unexpectedly, initial support is seen at 1.3640, but further losses could be in store on a push below this area, with the next downside target located at 1.3570.

Discover the power of crowd mentality in FX trading. Download the sentiment guide to understand how USD/CAD positioning can influence the underlying trend!

USD/CAD TECHNICAL CHART

A graph of stock market  Description automatically generated

AUD/USD TECHNICAL ANALYSIS

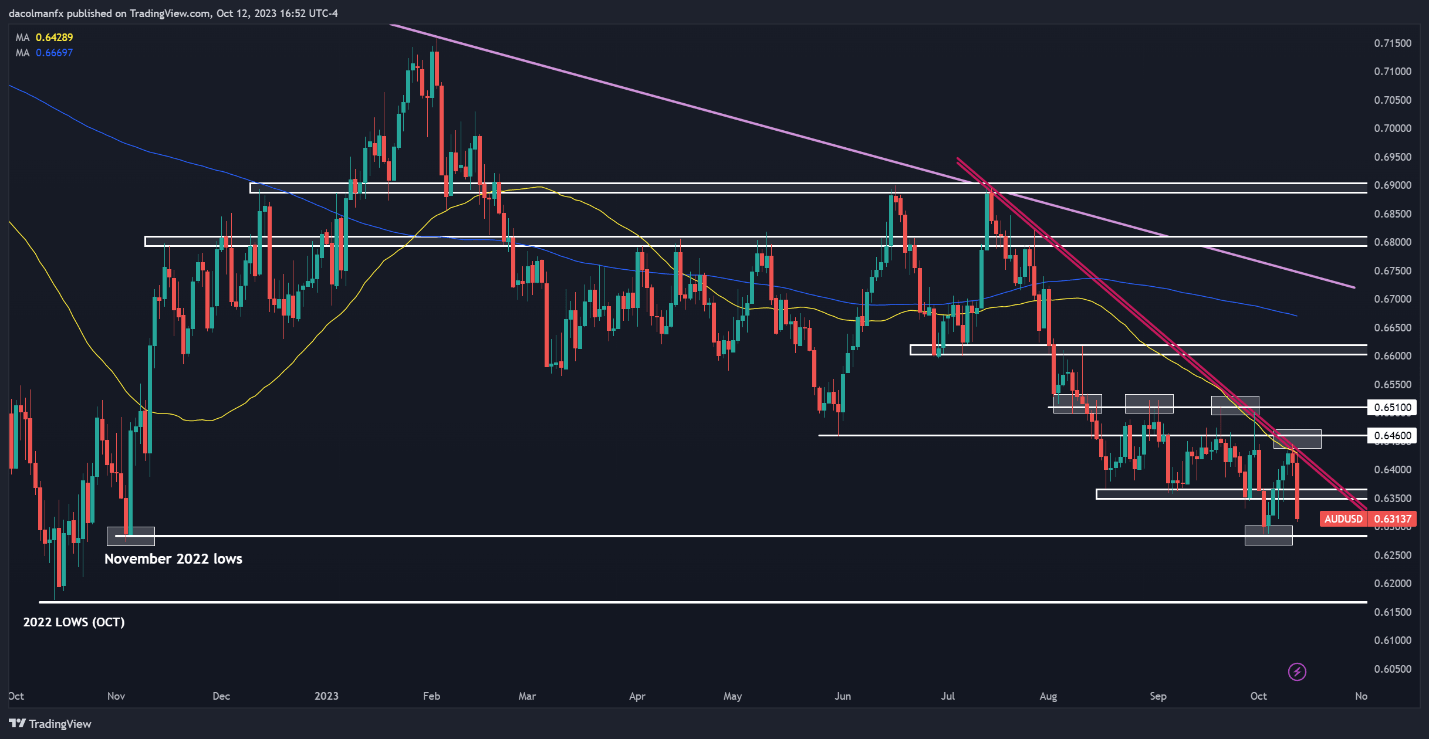
Everything was going well for AUD/USD until earlier this week. The pair had bounced more than 2% from multi-month lows and was on a steady recovery trajectory, but then its rebound abruptly hit a roadblock when prices collided with trendline resistance and the 50-day simple moving average, situated just above the 0.6400 handle.

Right after testing the 0.6400 area, sellers made a strong comeback, initiating a robust bearish reversal that pushed prices below support at 0.6350. With the market firmly in the grip of the bears, it may only be a matter of time before a move toward the 2023 lows unfolds. AUD/USD could find a foothold in this area on a retest, but in the event of a breakdown, we could see a pullback towards the 2022 lows.

On the flip side, if sentiment improves and the Australian dollar accelerates higher, initial resistance is located at 0.6350. Clearing this hurdle may breathe fresh life into the upward impetus, potentially opening the path for an advance toward trendline resistance, currently positioned close to the psychological 0.6400 level. With continued strength, the prospect of reaching 0.6460 is worth considering.

Curious to know what’s on the horizon for AUD/USD? Download our free Q4 trading guide for exclusive insights into key market catalysts that should be on every trader’s radar and can influence the course of the Australian dollar!

AUD/USD TECHNICAL CHART

A graph on a computer screen  Description automatically generated

Euro Plunges After US CPI Data, Leaving EUR/USD at Risk Amid More Bullish Retail Bets

Euro Plunges After US CPI Data, Leaving EUR/USD at Risk Amid More Bullish Retail Bets

The Euro plunged over 0.8 percent against the US Dollar on Thursday after a higher-than-expected US CPI report boosted Treasury yields. That was the worst single-day drop since early October. EUR/USD’s drop pushed retail traders to boost upside exposure, which can be seen by taking a look at IG Client Sentiment (IGCS). The latter tends to function as a contrarian indicator. With that in mind, will the Euro continue lower from here?

EUR/USD Sentiment Outlook – Bearish

The IGCS gauge shows that about 69% of retail traders are net-long EUR/USD. Since most of them remain biased higher, this continues to hint that prices may fall down the road. This is as upside bets increased by 10.46% and 5.62% compared to yesterday and last week, respectively. With that in mind, the combination of overall exposure and recent changes offers a stronger bearish contrarian outlook.

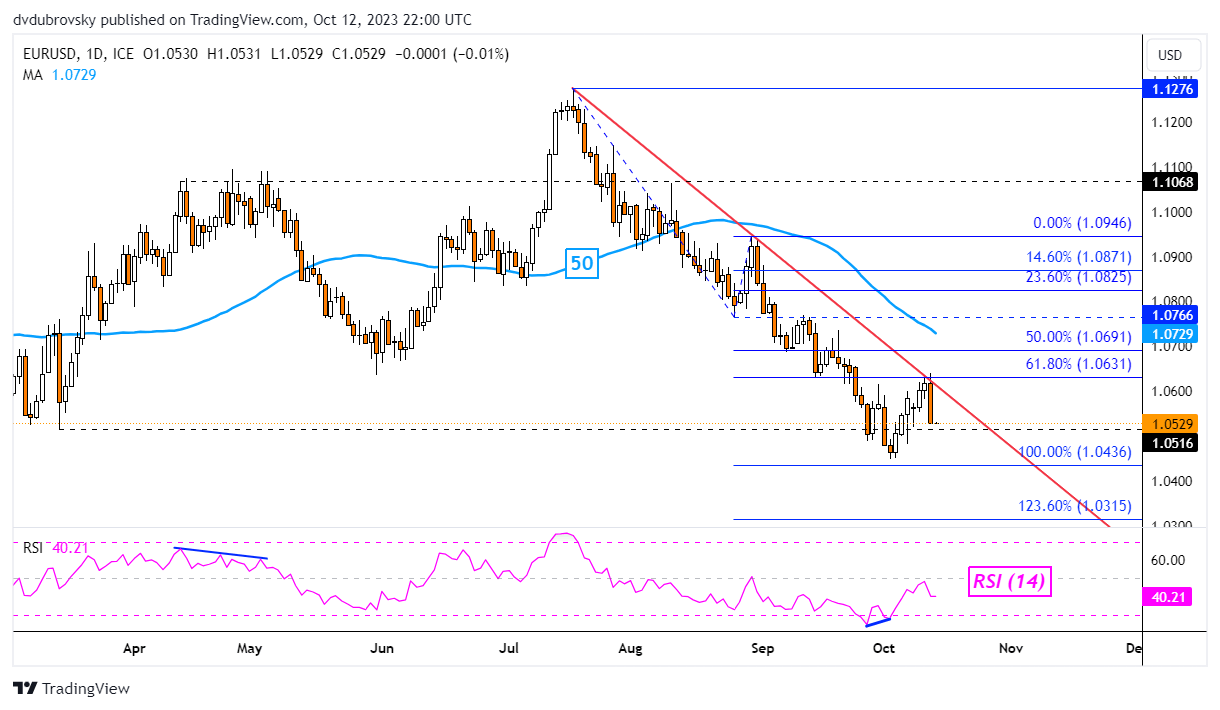
Euro Daily Chart

Focusing on the daily chart below, EUR/USD has turned lower following a rejection of the falling trendline from July. This has reinstated the broader downside focus following cautious gains since the beginning of this month. Now, immediate support is the March low of 1.0516. Below that is the 100% Fibonacci extension level of 1.0436.

Breaking lower opens the door to extending the broader downtrend, exposing the 123.6% Fibonacci extension level of 1.0315. On the other hand, a turn higher and push above the falling trendline would open the door to an increasingly bullish outlook. That exposes the 61.8% level of 1.0631.

Euro Daily Chart

The Mystery of Bearish Engulfings: Do they Reliably Predict Forex Price Reversals?

The Mystery of Bearish Engulfings: Do they Reliably Predict Forex Price Reversals?

A Bearish Engulfing (BE) is a candlestick pattern that can be identified when looking at virtually any financial trading instrument. All you need is an opening, high, low and closing price. As implied by the name, technicalists will often use these as signals that an upward-trending market might be readying to reverse. But as you might have heard past performance is not always indicative of future results.

This is not a report about the intricacies of Bearish Engulfings: which you may learn more about here. Rather, the purpose of this educational content is to test their effectiveness using price and price alone. This will come from the foreign exchange market (forex). At the end of the article, I will go over the key takeaways and some of the limitations of this study. In the meantime, let us set some ground rules.

Identifying Bearish Engulfings – EUR/USD, GBP/USD, USD/JPY, AUD/USD, USD/CAD

Almost 37,000 candles were analyzed between EUR/USD, GBP/USD, USD/JPY, AUD/USD and USD/CAD using daily data since 1995 from TradingView. One of the reasons why I chose the foreign exchange market is because of its unparalleled liquidity, especially amongst the major pairs. This helps produce smoother price action compared to other markets, such as stocks and cryptocurrencies.

How did I identify Bearish Engulfings? It was based on a set of rules I coded to search over each candle to recognize if it was valid. For this study, I focused on a near-term horizon, which translates to 20 days before and after an engulfing. In total, there are too many rules to go over. Instead, let us look at some of the most important ones:

Bearish Engulfing Detection Rules

  1. The Bearish Engulfing body must meet a minimum size requirement, it cannot be too small
  2. The body of the candle before the BE (the pre-candle) cannot be too small relative to the BE body
  3. Rather than the pre-candle low, the BE must close under the pre-candle open
  4. Before the BE, there must be the appearance of an uptrend (no downtrends or flat price action)
  5. The pre-candle close must also be a 20-day high close, with some cautious room for error

Limitations to these rules and subjectivity will be discussed at the end of this report. In the meantime, the chart below is an example of a detected EUR/USD Bearish Engulfing pulled on March 13th, 2005. This serves as an example of a clean one. Notice how the price was trending higher before the BE and the pre-candle close was a 20-day high close. After the BE, the price turned lower as one would expect.

In total, the code detected slightly over 200 Bearish Engulfings from a possible almost 37,000 candles. Of course, not all of them were as clean as the one below. If you would like to watch how some of the other cases appeared, I highly encourage you to check out this link to a Twitter thread I made that displays some of the Bearish Engulfings in each pair.
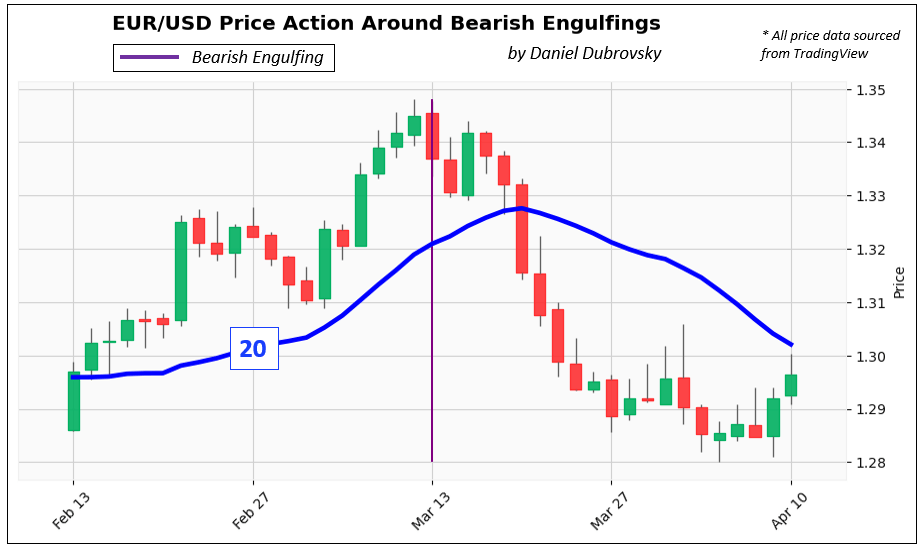
Identifying Bearish Engulfings – EUR/USD

37,000 Candles, Over 200 Bearish Engulfings, How Do the Trends Look Like?

Below is a chart that plots each Bearish Engulfing trend 20 days before and after its appearance. To make sure that every trend was in the same scale range, each BE (close) was indexed to 100 as a starting point.

In the period leading into the BE, you can see how the trends were rising with a consistent pattern and range. Then, the day before the BE was always the peak. This is what creates the dip into the BE, which represents the close under the pre-candle.

What happens after the Bearish Engulfing? The trends continue for 20 days and with each passing period, spread out in a cone or triangle-like fashion. The right side also exhibits a larger dispersion of prices (variance) than the left, with a wide range of peaks and troughs. At first glance, this speaks to randomness and pours cold water on the idea of Bearish Engulfings as consistent reversal signals. But we need to take a closer look.
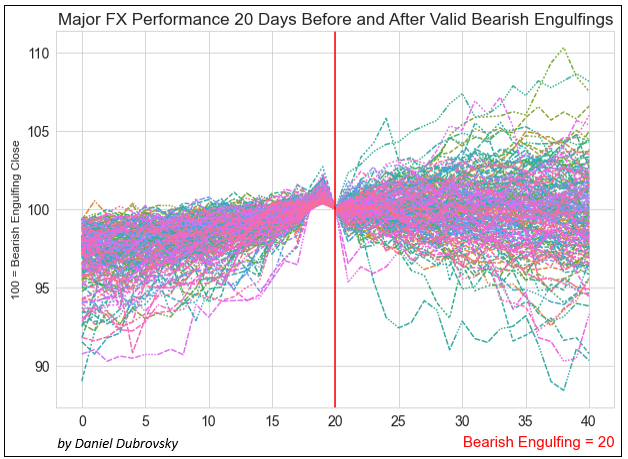
37,000 Candles, Over 200 Bearish Engulfings, How Do the Trends Look Like?

How Does the Average Bearish Engulfing Trend Look Like?

That is where the next chart comes in, which is the average Bearish Engulfing trend. This visualization confirms that the code was able to consistently capture the uptrend before the BE. Just like with the previous chart, you can see the top right before the BE before the price fell to 100, representing the dip into the engulfing. After the engulfing, prices continued lower, finishing -0.28% on average 20 days after the BE. So, it appears that there is a slight downward bias in the post-BE trend. I would argue that this is not the most important takeaway from this analysis.
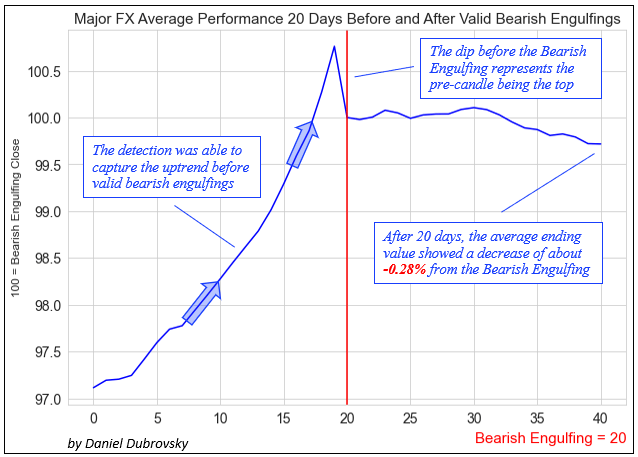
How Does the Average Bearish Engulfing Trend Look Like?

Bearish Engulfings: Reversal or Topping Signal?

The last chart overlays the average Bearish Engulfing series, with the percentage of trends that closed below the pre-candle for each day. For example: after 5 days, 71% of trends remained below the pre-candle close. After 10 days, this number shrank to 66%, then rose to 68% on the 15th day and finally ending at 65% on the 20th day. In other words, on average, about two-thirds (2/3) of trends remained below the top after one month.

Here is a fun fact: after 20 days, the ending price observations created a statistically significant normal distribution. This means we can alternatively use a Cumulative Distribution Function (CDF) to calculate the probability of a series in this sample finishing below the top. And just like with the results mentioned earlier, that clocks in at roughly 65% as well.
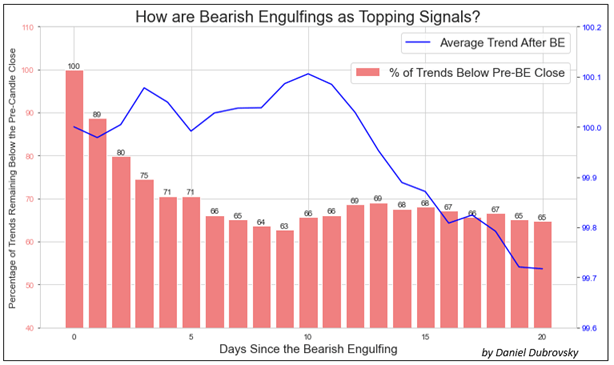
Bearish Engulfings: Reversal or Topping Signal?

What’s the Verdict on Bearish Engulfings?

After analyzing almost 37,000 candles between EUR/USD, GBP/USD, USD/JPY, AUD/USD and USD/CAD, identifying at least 200 Bearish Engulfings, it seems that this candlestick pattern functions better as a topping signal than a reversal one. While the average trend finished almost -0.3% after 20 days, 2/3 of them remained below the top. In other words, if we can identify valid Bearish Engulfings in this market, it might be worth paying attention to. But, let us go over some study limitations.

Study Limitations

While Bearish Engulfings can be observed universally between markets, understand that a specific subset of the forex market was analyzed for this study, and it might be the most relevant to the pairs studied. Furthermore, this is based on a sample of a little over 200 Bearish Engulfings. More might be needed to enhance the validity of this study, (or even disprove it).

As much as I tried to keep this study as objective as possible, there is some inherent subjectiveness in technical analysis. For example, while most people can universally agree on the dimensions of a Bearish Engulfing and how they appear, the background in which they form is more fluid. In this sample, I considered if the BE closed under the pre-candle open and not the pre-candle low. Some may debate that the latter is more proper.

Another important factor is the timeframe. This was conducted on daily data, but you could theoretically analyze different layers of time horizons. That also includes the duration you measure before and after the engulfing. This study was focused on near-term price action, but you could also analyze broader trends, such as 40 days before and after the Bearish Engulfing.


Is the Rebound in Crude Oil Over? Natural Gas Holds Gains After Bullish Break

Is the Rebound in Crude Oil Over? Natural Gas Holds Gains After Bullish Break

Crude Oil: Holds below crucial resistance

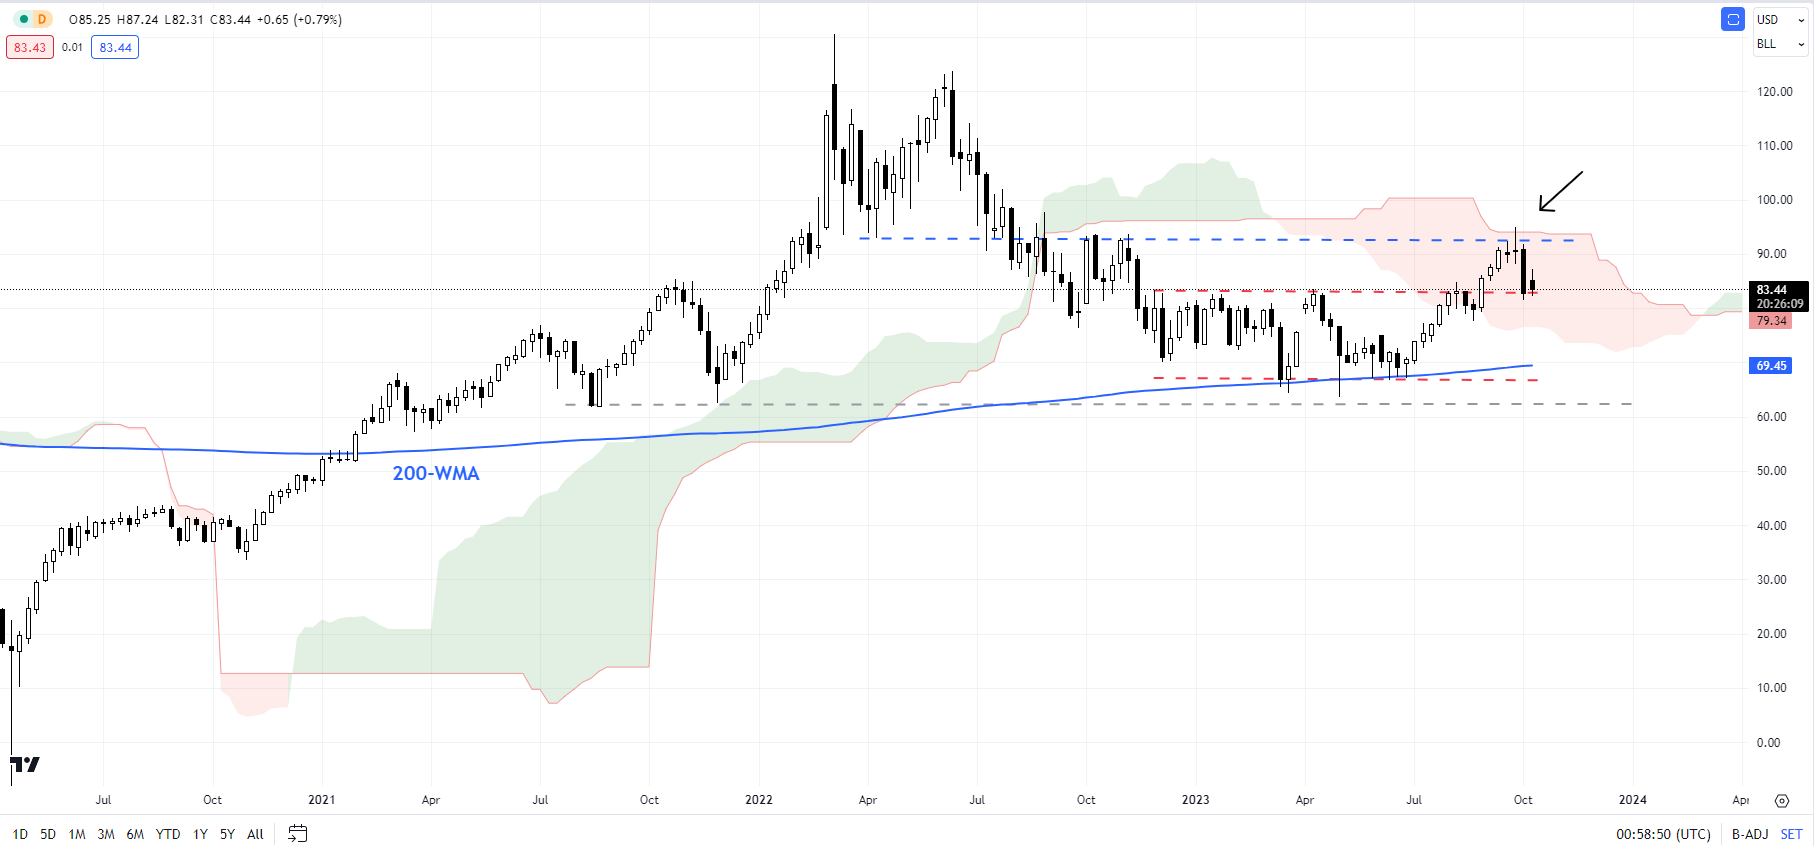
Crude oil has pulled back from a stiff converged barrier, including the Ichimoku cloud on the weekly charts and the October high of 93.00. Oil needs to cross above this resistance to be able to capitalize on the bullish breakout in September above quite a few times tested resistance on a horizontal trendline since the end of 2022, as highlighted in the previous update. See “Crude Oil to Test $100? Natural Gas is not Out of the Woods Yet,” published September 17.

Crude Oil Weekly Chart

image1.png

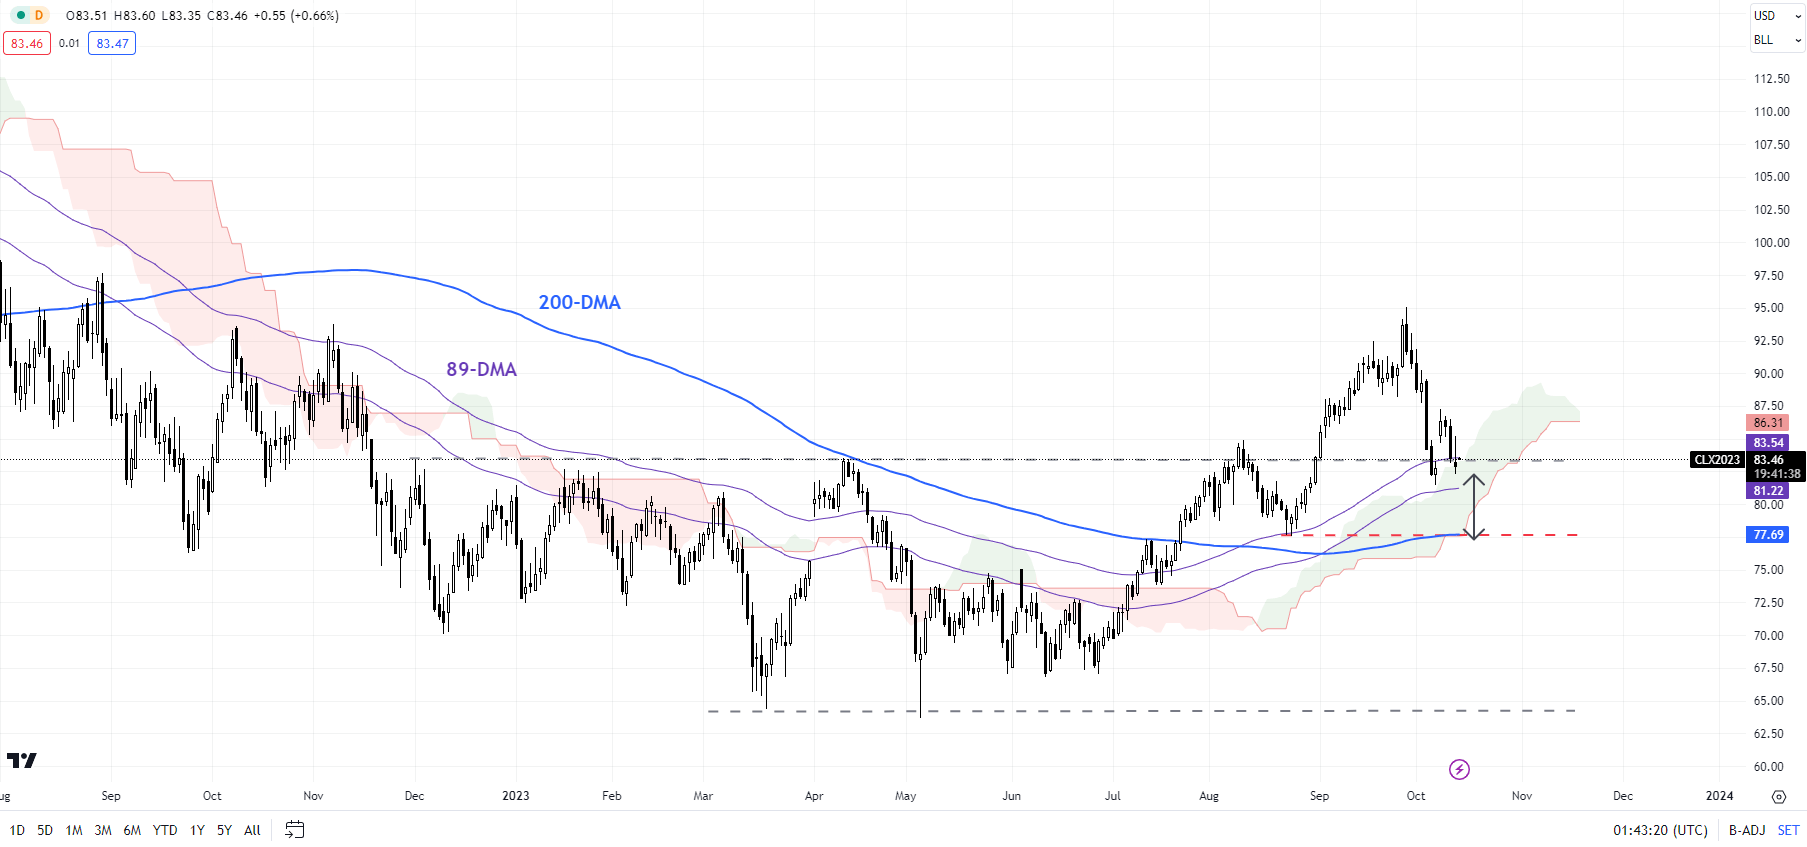
The breakout from the multi-month sideway zone triggered a double bottom (the March and May lows), pointing to a potential rise toward 103. The question then comes up – given the sharp retreat in the recent session, is the rebound over? Probably not. There is no doubt that the immediate upward pressure has faded somewhat (given the fall below the resistance-turned-support at about 84.00), it is too early to say that the bullish move is over.

Crude Oil Daily Chart

image2.png

That’s because crude oil continues to trade above the vital cushion zone, including the 200-day moving average, the 89-day moving average, and the August low of 77.50. A break below 77.00-81.00 is needed to confirm the rebound was over.

Looking for actionable trading ideas? Download our top trading opportunities guide packed with insightful tips for the fourth quarter!

Natural gas: Stabilizes after breakout

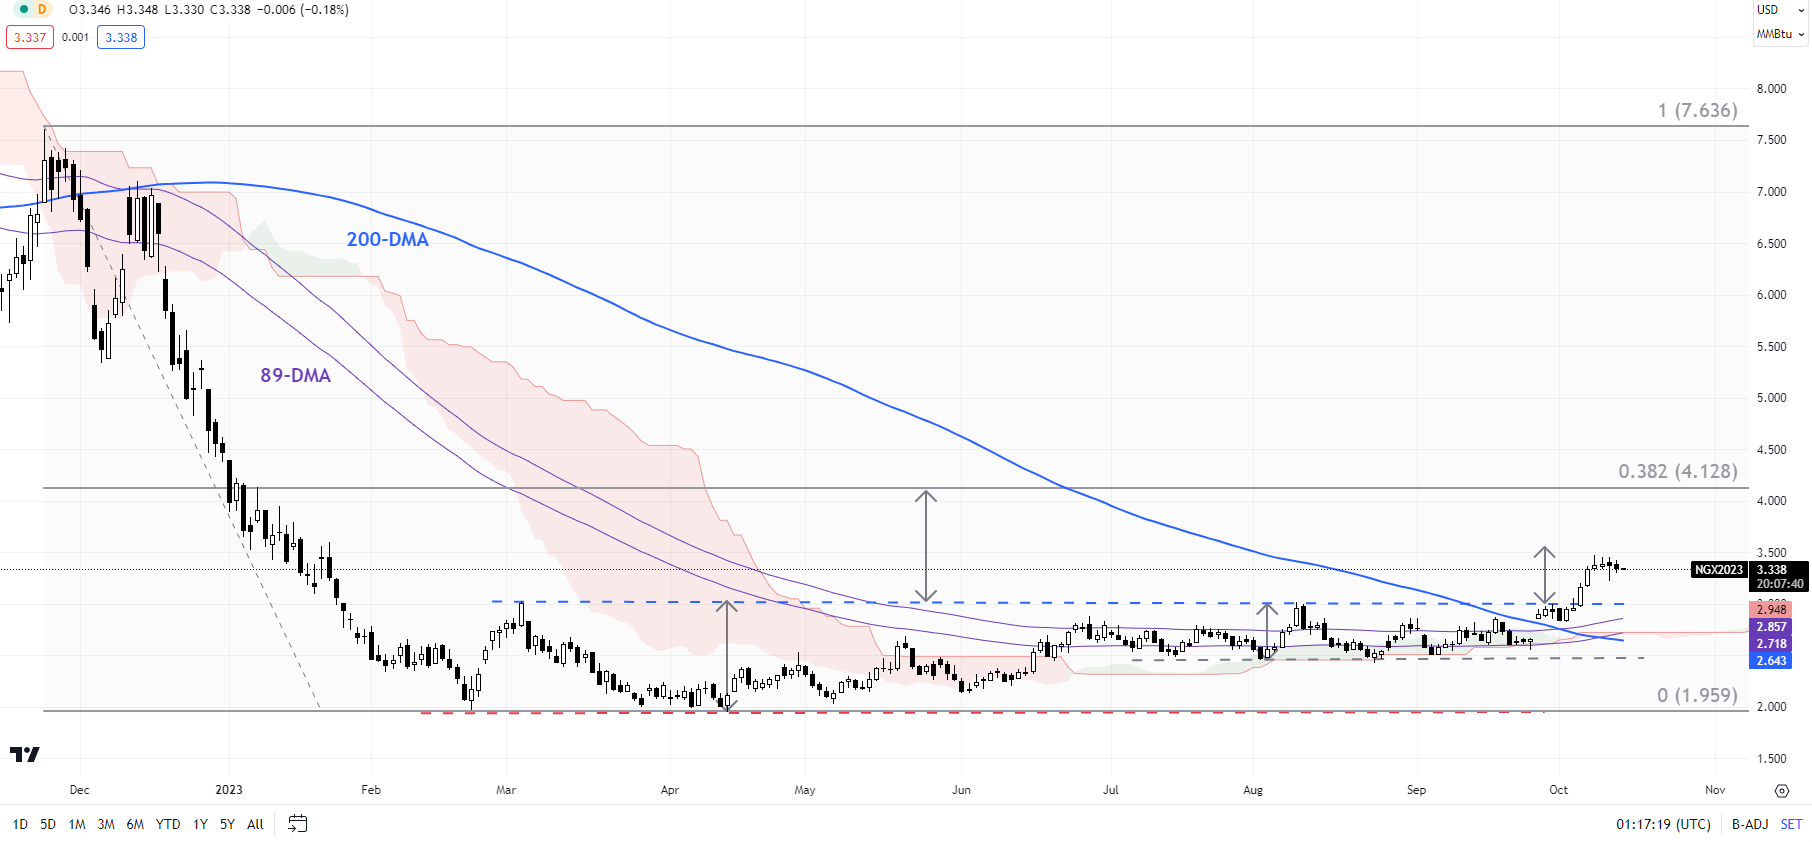
Natural gas is holding gains following the break earlier this month above crucial resistance at the March & August highs of 3.03. The cross above has triggered a significant break out from an eight-month-long sideways range, pointing to a rise to around 4.00-4.10, based on the price objective of the pattern.

For the first time since the end of 2022, has risen above the 200-day moving average and a decisive break above the 89-day moving average, suggesting that the base building may have taken place. For more details see “Bullish Natural Gas: Base May Have Been Built,” published October 9.

Natural Gas Daily Chart

image3.png

Natural gas faces immediate resistance at 3.25 (the 23.6% retracement of the November 2022-February 2023 fall, the stronger barrier at 4.20 (the 50% retracement. As highlighted in the previous update, natural gas needs to stay above the August low of 2.40 for the bullish bias to remain intact. Immediate support is at 3.03.

Elevate your trading skills and gain a competitive edge. Get your hands on the Crude oil outlook today for exclusive insights into key market catalysts that should be on every trader’s radar.

How to Trade After a News Release

How to Trade After a News Release

Post-release trading strategies

1. Trend following strategy

This strategy involves the use of multiple time frames, as well as, well-defined levels of support and resistance that come into play after a news release.

Traders can adopt this strategy when the current market price is approaching a well-defined level of support or resistance but isn’t quite there yet. The volatility after the news release has the potential to push the market toward the trendline. If price respects the trendline, traders can look to trade in the direction of the trend and trade the potential bounce.

The following 4 points are of assistance for this type of trade:

  1. Determine trend direction on a daily chart
  2. Draw support and resistance lines
  3. Select a forex time frame anywhere from 1 – 4 hours
  4. Buy near support in uptrend and sell near resistance in downtrend

Keep in mind that news releases have the potential to break through longstanding levels of support and resistance which underscores the importance of using tight stops when pursuing this strategy.

Post-release trend following strategy

2. Dual spike breakout strategy

This strategy involves waiting for market volatility to reveal a range before trading a break of that range and makes use of a five-minute chart. For illustrative purposes this section incorporates the US Non-Farm Payroll (NFP) release as this often has the greatest potential to move the market.

After the NFP release, wait 15-minutes for three five-minute candles to close. Take note of the highest price and the lowest price of the three closed candles. Next, place an entry order to go long at the highest price and an entry to go short at the lowest price. Once an order is triggered, targets can be set at twice the distance of the high/low channel while stops can be set above resistance for short trades and below support for long trades.

The disadvantage of this strategy is that volatility can push price above or below the short-term range, triggering an entry order, and then immediately reversing to hit a stop loss.

This strategy can be applied in the following way:

  1. Customize the chart settings to show 5- minute charts
  2. Take note of the highs and lows of the first three candles
  3. Set entry orders when price breaks above or below the range
  4. Set stops and limits
  5. Delete the unfilled order

Dual spike forex news trading strategy

3. News Reversal Strategy

The market can trade in one direction immediately after a major news release only to reverse and trade in the opposite direction.

The news reversal strategy looks to trade the news after the release and focuses on a sudden, sustained reversal in direction after a strong initial move in price.

The reversal could be the result of algorithms or, the market as a whole, feeling that there was an overreaction in price – prompting trades in the opposite direction.

The downside of this strategy is that no reversal takes place and the price continues trading in the direction on the initial spike.

How to implement the news reversal strategy:

  1. Initial spike in price: News with great market moving potential generally lead to a spike in price as the news is released.
  2. Look out for a reversal: Traders can wait 10-15 minutes for the reversal to bring price back to where it was before the release.
  3. Entry: Enter as price breaks above/below pre-release levels.
  4. Set multiple target levels: Traders should consider setting multiple target levels. As one is triggered, traders can take profit on half of the position and adjusting the stop on the remaining position to breakeven.

News reversal trading strategy

Trading forex after the release: Conclusion

Trading the news after the release can be a more conservative way to approach news trading. This is due to the emotions from the news release subsiding allowing a trader time to plan a technical set up for their trade. Regardless of your trading approach to news trading, risk management and utilizing small amounts or no leverage is critical to maintaining capital in your account to make the next trade.

Boost your forex trading knowledge

  • Download our free currency forecasts to stay abreast with the DailyFX expert view on forex market movements.
  • If you’re just starting out on your forex trading journey, download our free New to Forex trading guide to get to grips with the basics.

Trading after the news FAQ section

What type of news is most likely to move the market?

US economic data is so influential within global currency maekets that it is generally seen as the most important news. Additionally, it is important to note that not all news releases lead to increased volatility. Rather, there are a limited number of major news releases that have previously produced the greatest potential to move the market and some of these include:

  • US non-farm payrolls
  • US GDP
  • Us Federal Funds Rate announcement
  • ECB refinancing rate
  • Australian employment change
Gold and Silver Prices Head for Strong Finish this Week but Bearish Trends Remain

Gold and Silver Prices Head for Strong Finish this Week but Bearish Trends Remain

XAU/USD Analysis

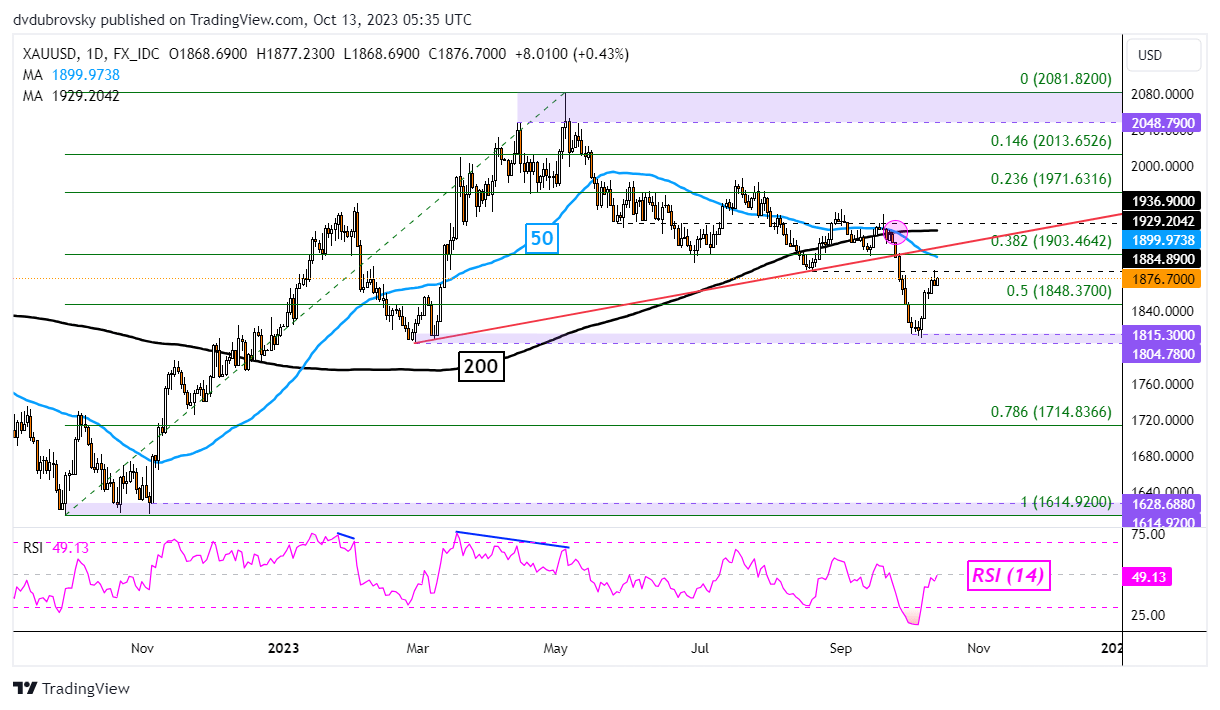
Gold prices are aiming higher heading into early European trade. At over 2.4 percent, XAU/USD is heading for the best week since the middle of March against the backdrop of increasingly cautious Fedspeak in recent days. Looking at the daily chart below, immediate resistance seems to be the 1884.89 inflection point from August.

Just above that, gold will be facing the 50- and 200-day moving averages. There was a bearish crossover in September which offered a broad downward technical bias. As such, XAU/USD is facing key levels of resistance heading into the weekend. In the event of a turn lower, the midpoint of the Fibonacci retracement level is below at 1848.37 before the 1804.78 – 1815.30 inflection point.

Gold Daily Chart

Gold Daily Chart

XAG/USD Analysis

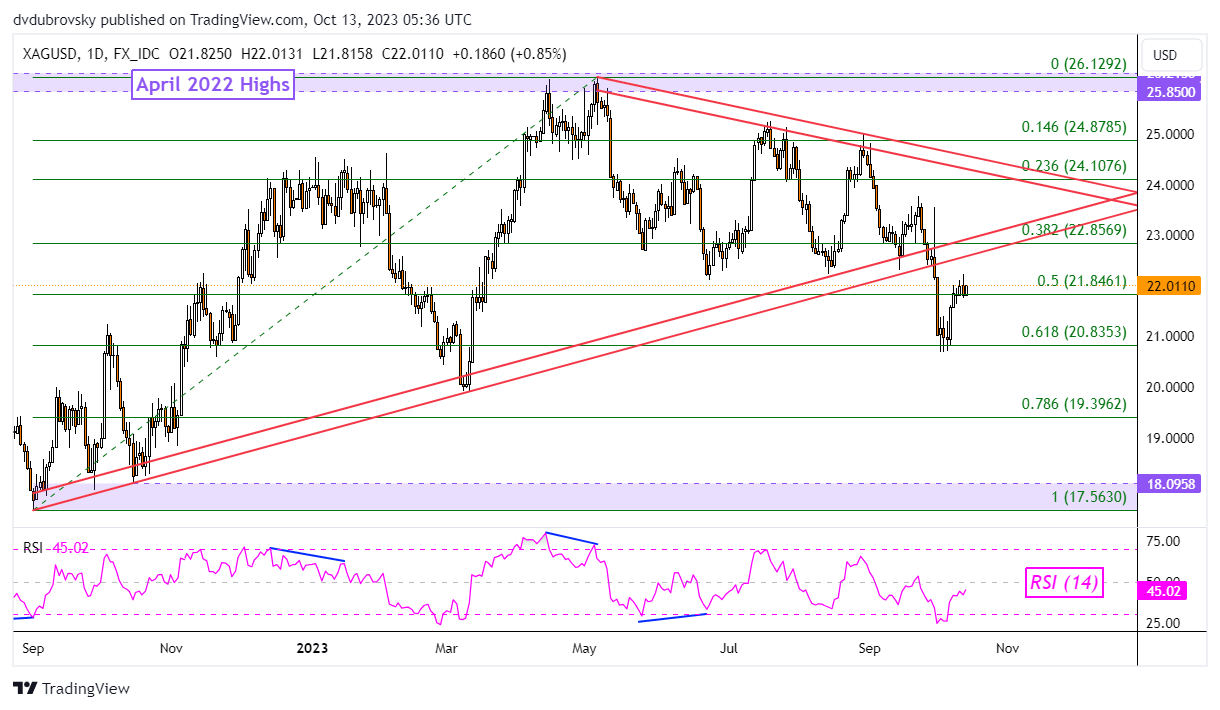
Meanwhile, silver prices are in a similar scenario. XAG/USD is up almost 2 percent this week. The last time we saw this precious metal push this aggressively was in the middle of September. From here, immediate resistance is the former rising range of support from September as well as the 38.2% Fibonacci retracement level of 22.85.

These may hold, reinstating the broader bearish bias since early May. In the event of a turn lower, immediate support seems to be the midpoint of the Fibonacci retracement at 21.84. Extending losses beyond that places the focus on the 61.8% level at 20.83. Clearing under the latter subsequently opens the door to resuming the downtrend.

Silver Daily Chart

Silver Daily Chart