EUR/USD Forecast: Lagarde’s G20 Appearance and US Inflation in the Limelight

EUR/USD Forecast: Lagarde’s G20 Appearance and US Inflation in the Limelight

Wednesday Overview

On Wednesday, the EUR/USD rose by 0.13%. Following a 0.37% gain on Tuesday, the EUR/USD ended the day at $1.06193. The EUR/USD fell to a low of $1.05795 before reaching a high of $1.06347.

ECB Monetary Policy Meeting Minutes and the IMF in Focus

The ECB monetary policy meeting minutes will garner investor interest. Recent ECB speeches have signaled an end to the ECB monetary policy tightening cycle. However, euro area inflation remains elevated, supporting the higher-for-longer interest rate outlook. A deviation from recent ECB member guidance to leave interest rates unchanged would need consideration.

Trading Derivatives carries a high level of risk to your capital and you should only trade with money you can afford to lose. Trading Derivatives may not be suitable for all investors, so please ensure that you fully understand the risks involved, and seek independent advice if necessary. A Product Disclosure Statement (PDS) can be obtained either from this website or on request from our offices and should be considered before entering into a transaction with us. Raw Spread accounts offer spreads from 0.0 pips with a commission charge of USD $3.50 per 100k traded. Standard account offer spreads from 1 pips with no additional commission charges. Spreads on CFD indices start at 0.4 points. The information on this site is not directed at residents in any country or jurisdiction where such distribution or use would be contrary to local law or regulation.

There are no euro area economic indicators to consider on Thursday. The lack of stats will leave the IMF/World Bank Annual Meetings and news updates from the Middle East in focus.

ECB President Christine Lagarde will attend the G20 Finance Ministers and Central Bank Governors meeting. Comments relating to inflation, the economic outlook, and monetary policy will influence the buyer appetite for the EUR/USD.

US CPI Report and Weekly Jobless Claims in the Spotlight

The US CPI Report will garner investor interest on Thursday. After the higher-than-expected producer price numbers, a pickup in inflationary pressures could reignite Fed rate hike bets.

Economists forecast the US annual inflation rate to soften from 3.7% to 3.6% and the core inflation rate to ease from 4.3% to 4.1%.

Weekly jobless claims forecasts signal tight labor market conditions. Economists predict initial jobless claims to increase from 207k to 210k.

Tight labor market conditions support wage growth. An upward trend in wages fuels consumer spending and demand-driven inflationary pressures. Higher interest rates raise borrowing costs, resulting in firms cutting costs, including staff and wages. Falling wages could force consumers to curb spending, easing demand-driven inflationary pressures.

However, the US CPI Report will likely have more influence on the appetite for the US dollar.

Beyond the numbers, news updates from the Middle East and FOMC member speeches need consideration. FOMC member Raphael Bostic is on the economic calendar to speak on Thursday.

Short-Term Forecast:

Near-term EUR/USD trends rest in the hands of the US CPI Report and news updates from the Middle East. A hotter-than-expected US CPI Report would support buyer appetite for the US dollar. An escalation in the Middle East conflict would also fuel demand for the US dollar as a safe haven currency.

EUR/USD Price Action

Daily Chart

The EUR/USD remained below the 50-day and 200-day EMAs, sending bearish price signals.

A EUR/USD move through the $1.06342 resistance level would give the bulls a run at the 50-day EMA.

The US CPI Report, central banks, and news updates from the Middle East will dictate EUR/USD movements.

A pickup in US inflationary pressures would support a EUR/USD return below $1.06 to target the $1.05230 support level.

The 14-period Daily RSI, 48.62, supports a EUR/USD drop below $1.06 before entering oversold territory.
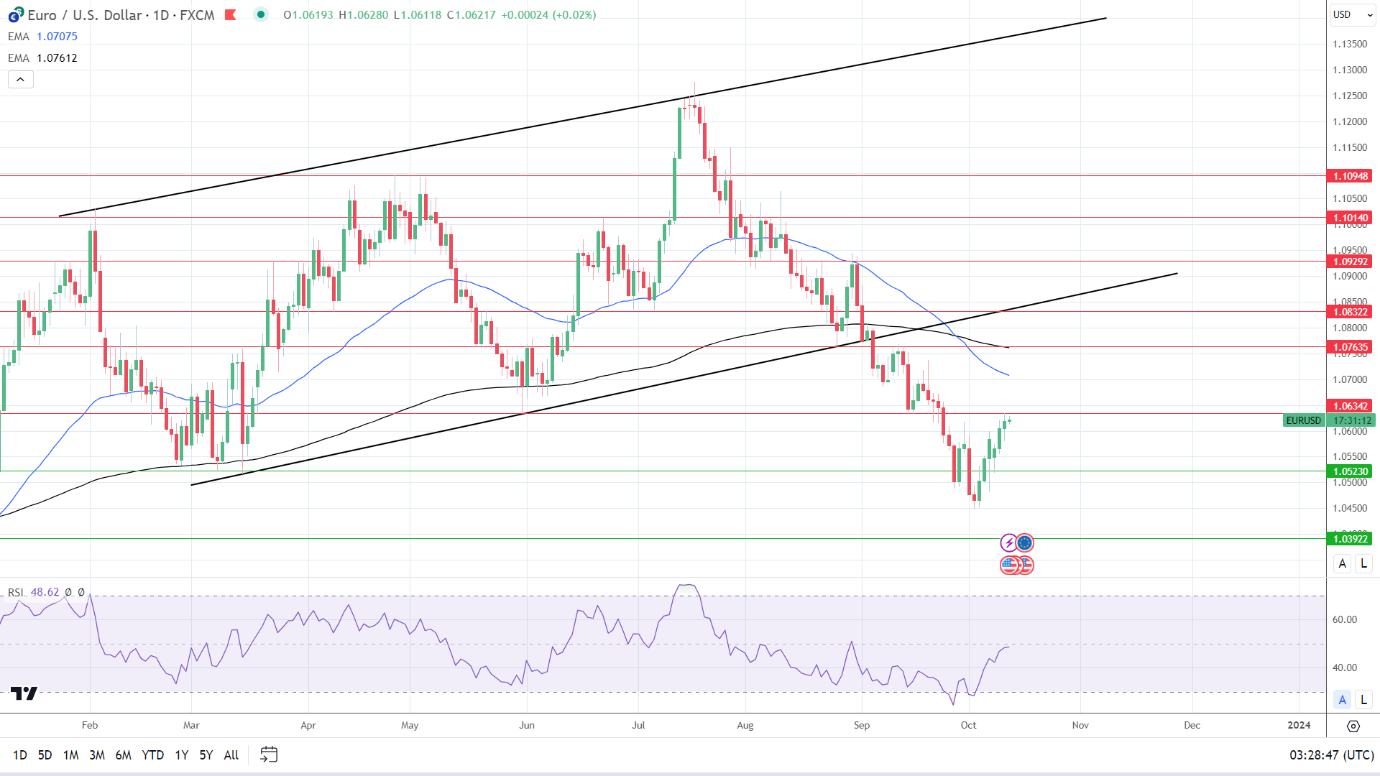
EUR/USD Daily Chart sends bearish price signals.
EURUSD 121023 Daily Chart

4-Hour Chart

The EUR/USD remains above the 50-day EMA while sitting below the 200-day EMA, sending bullish near-term but bearish longer-term price signals. A EUR/USD drop below $1.06 would bring the 50-day EMA and $1.05230 support level into play.

However, a EUR/USD move through the $1.06342 resistance level would give the bulls a run at the 200-day EMA.

The 14-period RSI on the 4-hour chart, 62.48, supports a EUR/USD break above the $1.06342 resistance level before entering overbought territory.
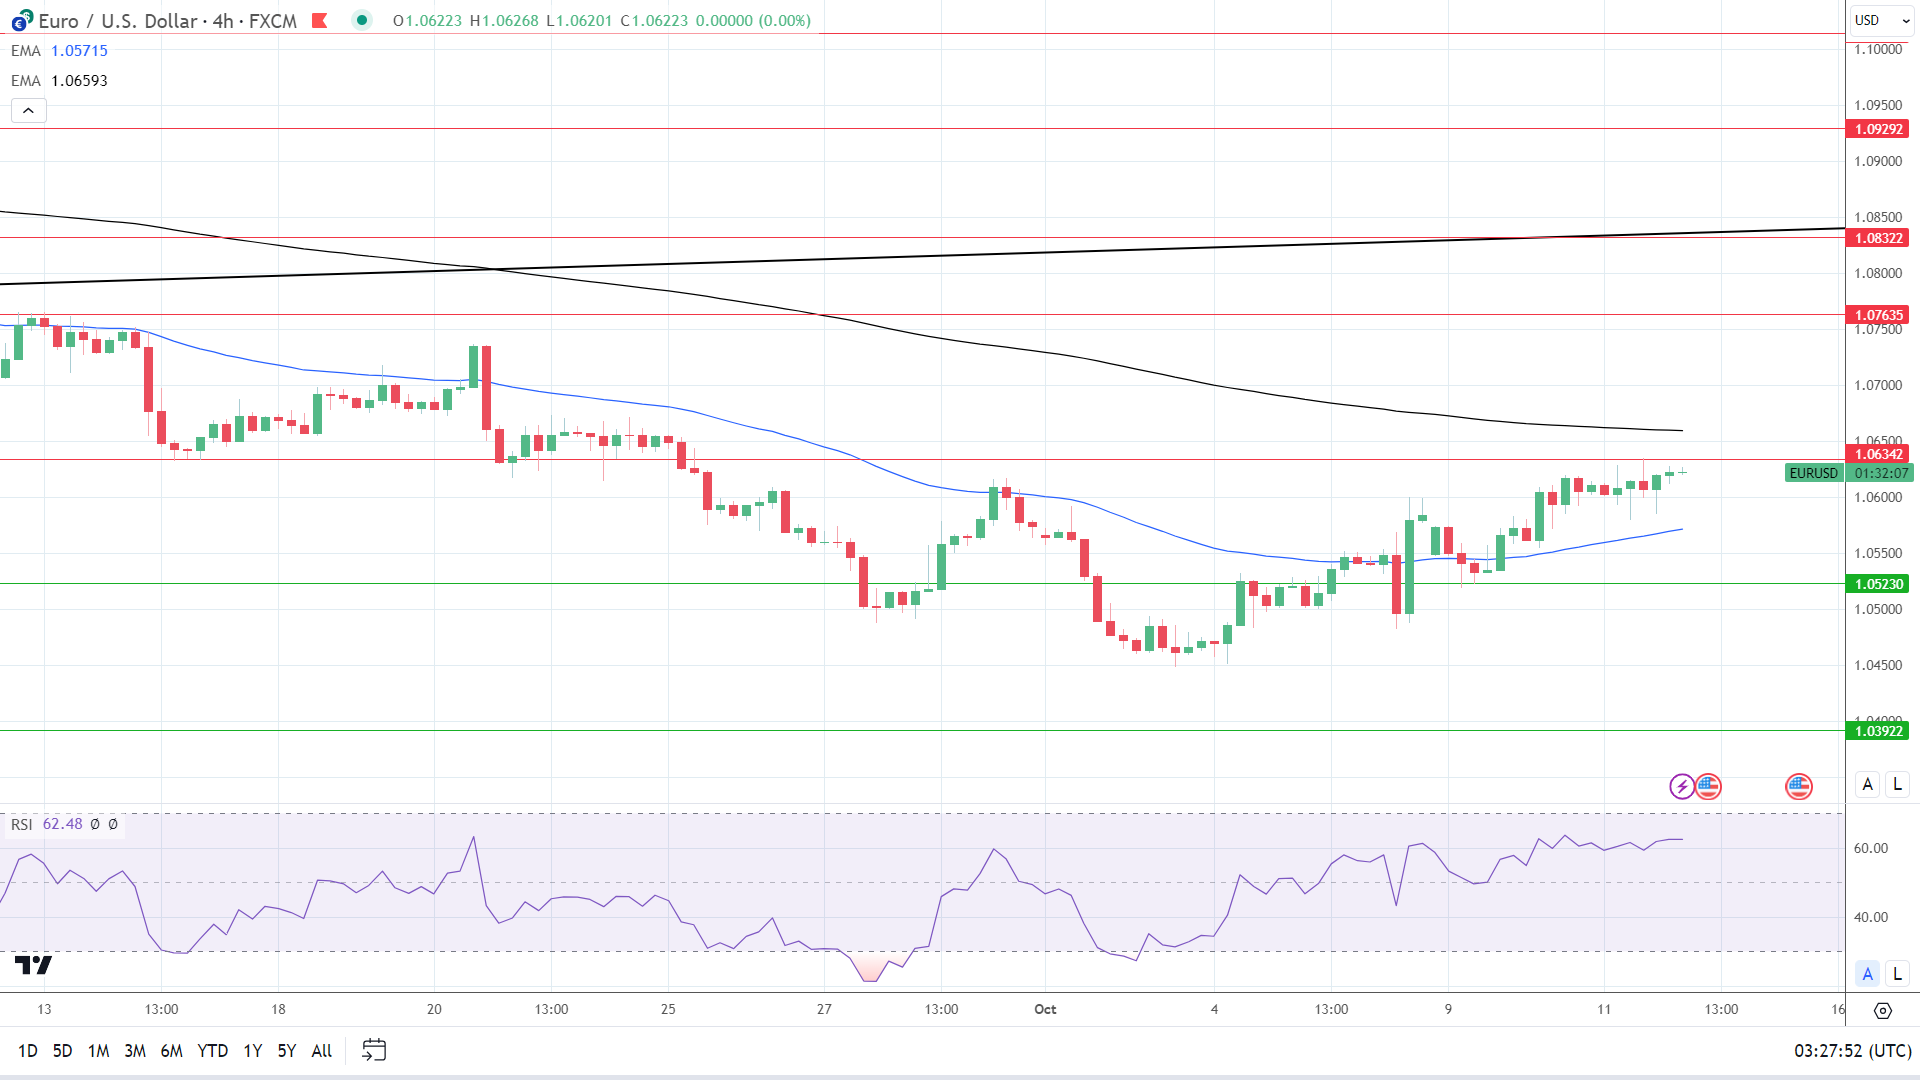
4-Hourly Chart sends bullish near-term price signals.
EURUSD 121023 4 Hourly Chart
Silver Prices Forecast: XAG/USD Edges Higher as Fed Officials Waffle on Rates

Silver Prices Forecast: XAG/USD Edges Higher as Fed Officials Waffle on Rates

Silver Soars on Soft Dollar and Falling Yields

Silver prices (XAG/USD) reached new heights last Thursday, scaling the favorable terrains of a soft U.S. dollar and diminished Treasury yields. Bolstered by higher gold prices, the ascent anticipates the release of the Consumer Price Index (CPI) data, which could further shape market sentiment and Federal Reserve interest rate decisions.

The Fed’s Jigsaw Puzzle

Minutes from the Federal Reserve’s September meeting unveiled an atmosphere of indecision, exposing splits among policymakers over interest rate trajectories. This uncertainty has put a dent in the U.S. Dollar Index, making the zero-yield asset of silver a beacon for traders. Concurrently, dwindling Treasury yields have augmented silver’s appeal.

Trading Derivatives carries a high level of risk to your capital and you should only trade with money you can afford to lose. Trading Derivatives may not be suitable for all investors, so please ensure that you fully understand the risks involved, and seek independent advice if necessary. A Product Disclosure Statement (PDS) can be obtained either from this website or on request from our offices and should be considered before entering into a transaction with us. Raw Spread accounts offer spreads from 0.0 pips with a commission charge of USD $3.50 per 100k traded. Standard account offer spreads from 1 pips with no additional commission charges. Spreads on CFD indices start at 0.4 points. The information on this site is not directed at residents in any country or jurisdiction where such distribution or use would be contrary to local law or regulation.

The CPI Factor

While Producer Price Index (PPI) figures recently outpaced expectations, coming in at a 0.5% rise for September as opposed to the forecasted 0.3%, they still represent a deceleration from August’s 0.7%. The CPI data set for release could be a significant fulcrum in shaping both the Fed’s rate policies and silver prices.

Geopolitics and Silver’s Allure

Geopolitical factors are also tipping the scales. Recent tensions between Israel and Hamas are driving investors towards the safe haven of Treasury bonds, indirectly supporting silver. Despite a dip in the holdings of the SPDR Gold Trust (GLD), the world’s largest gold-backed ETF, silver continues to captivate attention.

Short-Term Outlook: Bullish

In the short run, the prognosis for silver tilts bullish. The Federal Reserve’s murky stance on interest rates, a slackening U.S. dollar, and key economic indicators have made traders cautiously upbeat. The imminent CPI data may well be the catalyst that solidifies market direction in the coming weeks.

Technical Analysis

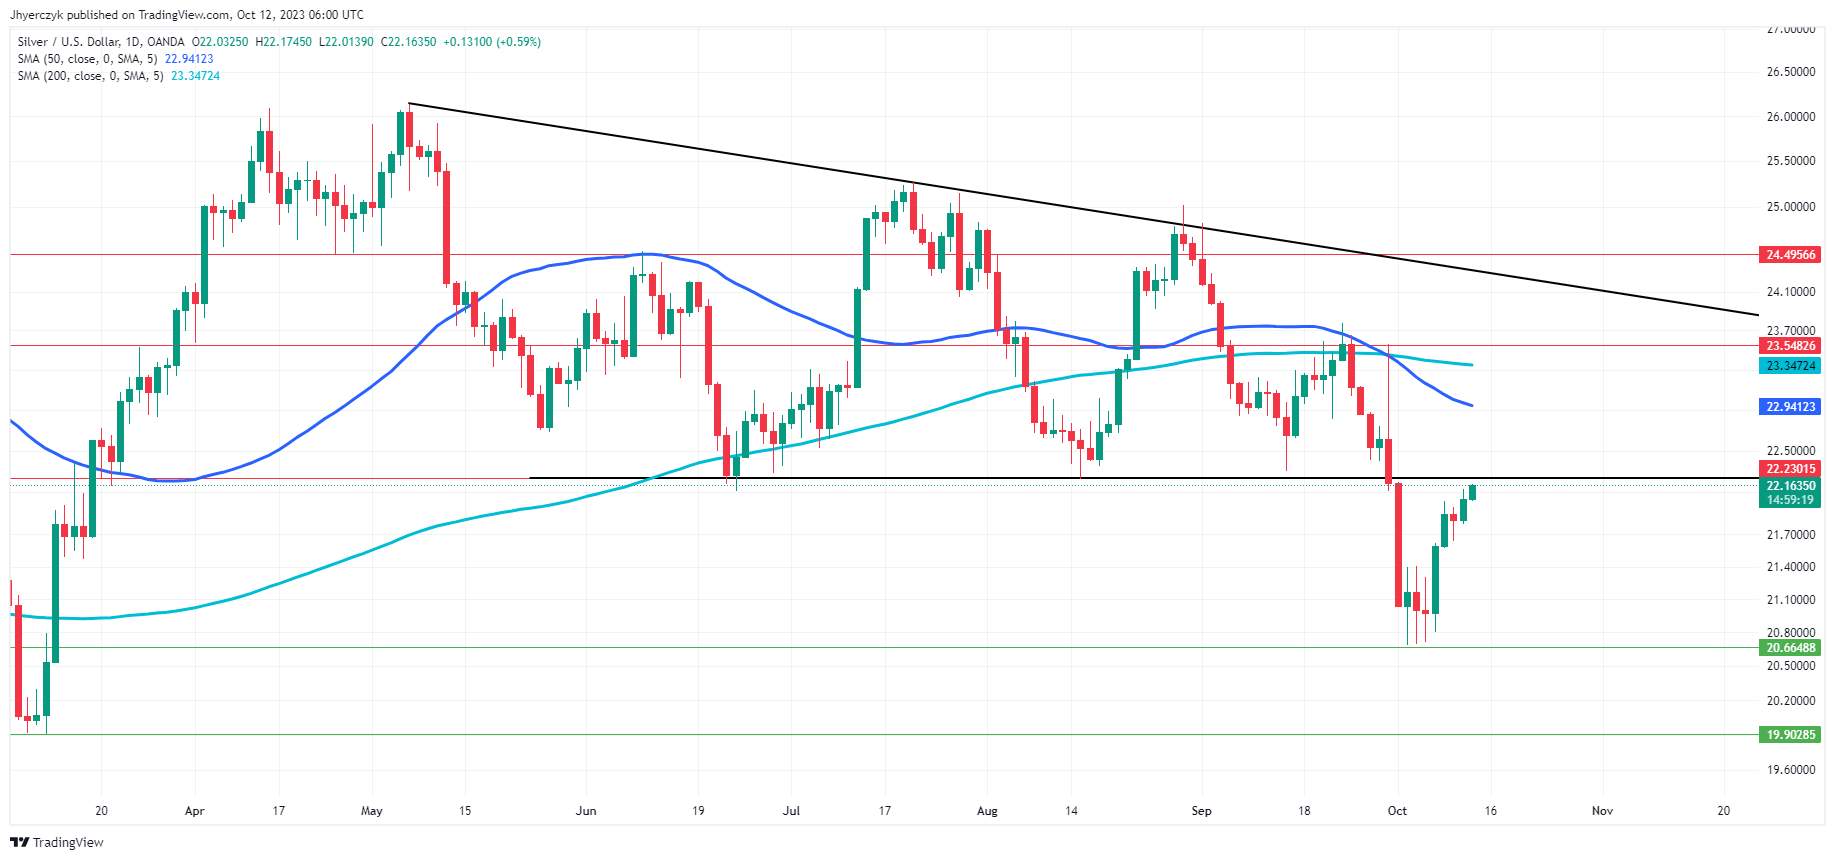
Daily Silver (XAG/USD)With the current daily price of Silver (XAG/USD) at $22.16, the commodity is trading below both its 200-day and 50-day moving averages, positioned at $23.35 and $22.94 respectively. This suggests a bearish momentum in the short and medium term.

However, the price hovers dangerously close to the trend line support at $22.23; recapturing it could fuel an acceleration to the upside, setting the stage for a challege of the trend line resistance at $24.33 and possibly the main resistance at $23.55.

Overall, given the price’s positioning relative to key moving averages and support levels, the current market sentiment leans bearish. However, the market is also poised for an upside breakout of $22.23 resistance. Essentially, trader reaction to this level will set the tone.

Gold Prices Forecast: XAU/USD Firms as Treasury Yields Dip Ahead of CPI Data

Gold Prices Forecast: XAU/USD Firms as Treasury Yields Dip Ahead of CPI Data

Gold Prices Soar Amid Fed Uncertainty and Geopolitical Tensions

Gold (XAU/USD) prices surged to a two-week high early Thursday, riding the tailwinds of a softer U.S. dollar and diminishing Treasury yields. The looming release of consumer price index (CPI) data adds another layer of anticipation, potentially impacting both interest rate decisions by the Federal Reserve and the broader market sentiment.

The Fed’s Cautious Stance and Its Impact

Minutes from the Federal Reserve’s September meeting displayed an air of caution, revealing divisions among policymakers on the path of interest rates.

Trading Derivatives carries a high level of risk to your capital and you should only trade with money you can afford to lose. Trading Derivatives may not be suitable for all investors, so please ensure that you fully understand the risks involved, and seek independent advice if necessary. A Product Disclosure Statement (PDS) can be obtained either from this website or on request from our offices and should be considered before entering into a transaction with us. Raw Spread accounts offer spreads from 0.0 pips with a commission charge of USD $3.50 per 100k traded. Standard account offer spreads from 1 pips with no additional commission charges. Spreads on CFD indices start at 0.4 points. The information on this site is not directed at residents in any country or jurisdiction where such distribution or use would be contrary to local law or regulation.

Several Fed officials have also expressed differing opinions on whether further rate hikes are warranted this year, leaving traders speculating about the next moves.

This uncertainty has weakened the U.S. Dollar Index, making gold—an asset that does not yield interest—increasingly attractive. The yields on Treasury bonds have followed a similar pattern, further buoying gold prices.

Economic Indicators: PPI and Upcoming CPI Data

Inflation indicators are under the microscope, with the producer price index (PPI) recently exceeding expectations by rising 0.5% in September, compared to the anticipated 0.3%. However, this pace represents a slowdown from the 0.7% increase seen in August. The CPI data due later today at 12:30 GMT could be a crucial determinant in the Federal Reserve’s rate-setting decisions and thereby influence gold’s market dynamics.

Geopolitical Climate

The current geopolitical scene is also playing a role, with tensions from the Israel-Hamas conflict causing a flight to the safety of Treasury bonds and, indirectly, supporting the bullish case for gold. These factors are contributing to the asset’s allure, despite the SPDR Gold Trust, the world’s largest gold-backed exchange-traded fund, reporting a fall in its holdings.

Short-Term Forecast

For the short term, the outlook for gold is tilting bullish. Given the Federal Reserve’s ambiguous position on interest rates, a weakened U.S. dollar, and a series of impactful economic indicators, traders are cautiously optimistic. The release of today’s CPI data could serve as the tipping point, setting the course for both interest rates and gold prices in the weeks to come.

Technical Analysis

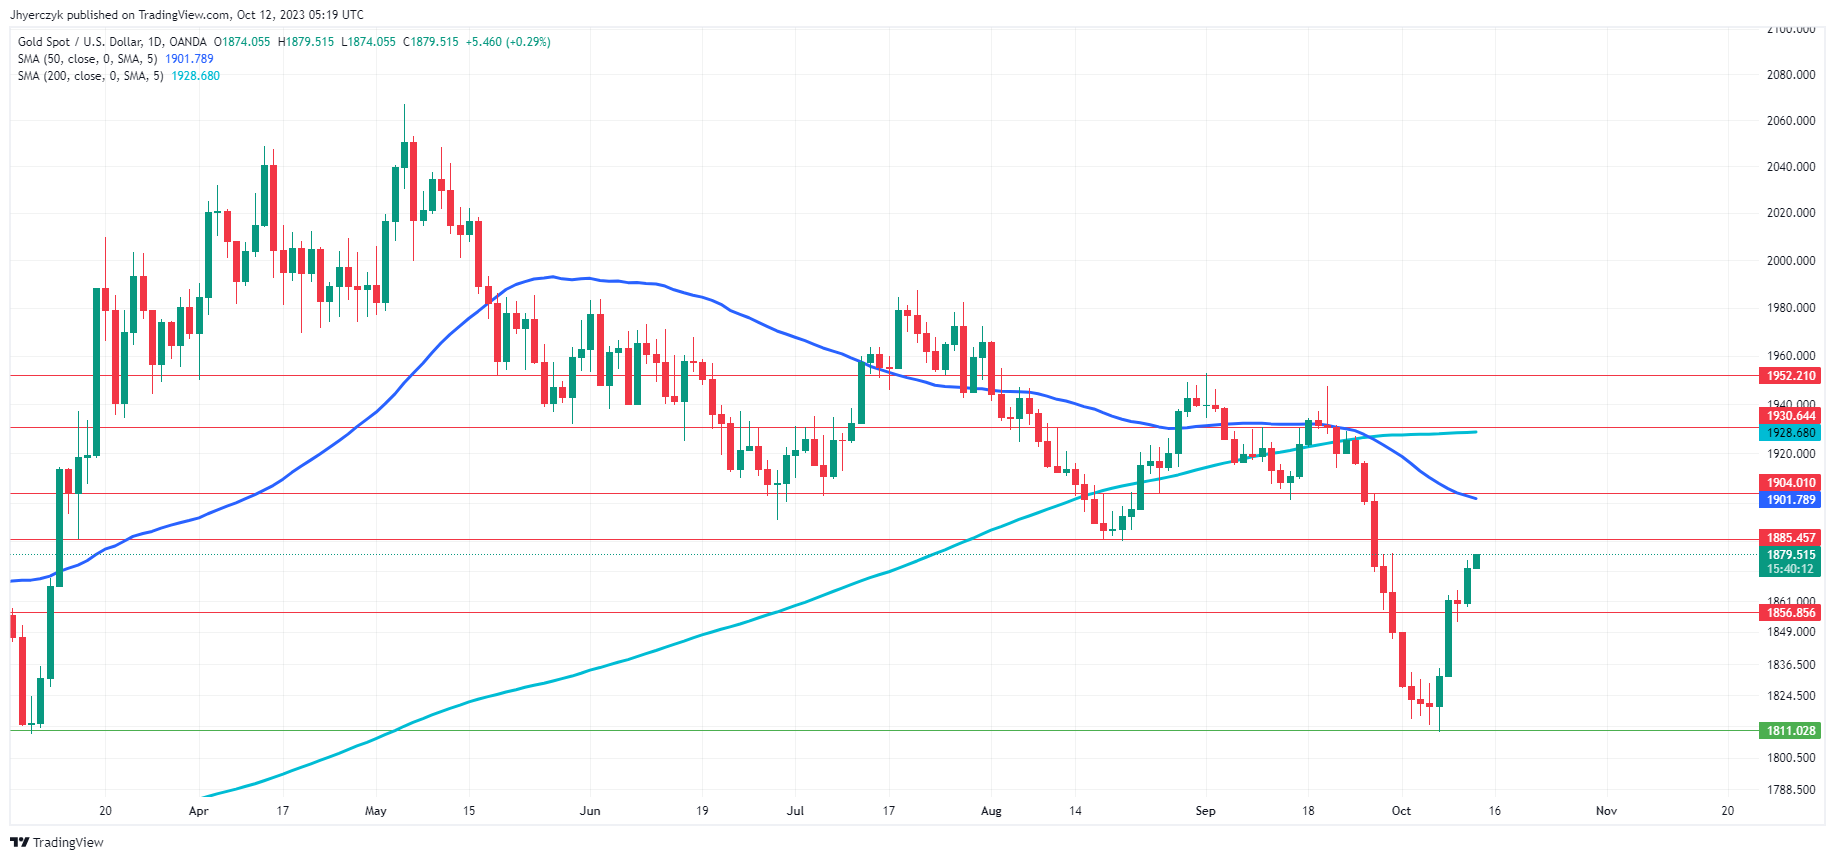
Daily Gold (XAU/USD)Daily gold (XAU/USD) at 1879.55, is hovering below both the 50-day and 200-day moving averages, at 1901.79 and 1928.68 respectively, suggesting bearish sentiment in the short and medium-term.

It’s also positioned between the minor resistance level of 1885.46 and the minor support level of 1811.03, indicating a range-bound movement for now.

Though closer to breaking the minor resistance, the price needs to convincingly breach 1904.01, the main resistance, to confirm a bullish turn. This will also put the market on the strong side of the 50-day moving average at 1901.80.

Technically, the overall market sentiment leans bearish, primarily because the price remains under the key moving averages. However, momentum appears to have shifted to the upside, following Friday’s reversal bottom and this week’s subsequent follow-through.

UK Economy Expands by 0.2% Thanks To Services Sector Output

UK Economy Expands by 0.2% Thanks To Services Sector Output

UK GDP Estimate

On Thursday, the UK’s monthly GDP estimate attracted investor interest. The UK economy expanded by 0.2% in August vs. a 0.6% contraction in July. Economists forecast the UK economy to expand by 0.2% in August. Notably, economists predicted industrial and manufacturing production to drag on growth.

According to the Office for National Statistics,

  • The services sector saw output grow by 0.4%, supporting the economic recovery.
  • However, consumer-facing-services recorded a 0.6% fall in output. Output declined by 0.2% in July.
  • Industrial production declined by 0.7% following a 1.1% slide in July.
  • Manufacturing production fell by 0.8%, a drag on headline production.
  • However, industrial production grew by 1.2% in the three months to August when compared to the three months to May.
  • The UK economy expanded by 0.3% over the three months to August, with services output up by a modest 0.1%.

The August report demonstrated the resilience of the UK economy. Significantly, the resilience may offer the Bank of England an opportunity to push rates higher to tackle sticky inflation.

On Monday, Bank of England Monetary Policy Committee member Catherine Mann discussed the need for more aggressive monetary policy measures.

GBP to USD Reaction to the UK GDP Estimate

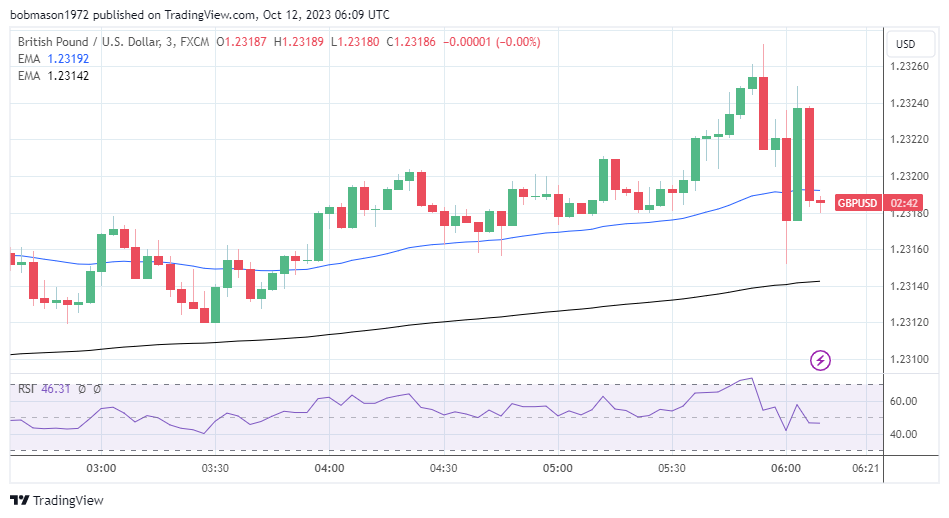
Before the release of the UK GDP Estimate, the GBP/USD fell to a pre-stat low of $1.22983 before rising to a high of $1.23272.

However, in response to the report, the GBP/USD fell to a post-stat low of $1.23152 before rising to a high of $1.23249.

This morning, the GBP/USD was up 0.05% to $1.23186.

GBP/USD shows a mixed reaction to UK growth figures.
GBPUSD 3 Minute Chart 121023

Next Up

Bank of England (BoE) Chief Economist Huw Pill is on the BoE Calendar to speak. The GBP/USD will likely respond to views on inflation, the economy, and monetary policy.

Later in the session, the US CPI Report will garner investor interest. Economists forecast the US annual inflation rate to soften from 3.7% to 3.6%. Core inflation will also move the dial. Economists expect core inflation to ease from 4.3% to 4.1%.

With inflation in the spotlight, Fed commentary also warrants consideration. FOMC member Raphael Bostic is on the economic calendar to speak on Thursday. On Tuesday, the Atlanta Fed President supported an end to rate hikes. A deviation from the dovish outlook would need consideration.

Crude Oil Price Forecast: Bears Reload but Energy Market Outlook Stays Positive

Crude Oil Price Forecast: Bears Reload but Energy Market Outlook Stays Positive

Crude oil prices, as measured by WTI futures, extended losses on Wednesday, falling for the second consecutive session and erasing most of Monday’s vigorous rally, a brief upswing that came in the wake of last weekend’s events in the Middle East. To give some background, the militant group Hamas launched a deadly incursion into Israel from the Gaza Strip early Saturday, leading to the most substantial loss of civilian lives in the history of the Jewish nation.

As a response, Israeli Prime Minister Benjamin Netanyahu initiated a military offensive against Hamas, ordering extensive aerial attacks in Gaza and imposing a total siege on the coastal enclave to eradicate the operational centers and dismantle the strongholds of the extremist group. As of Wednesday, the number of dead had topped 1000 on each side of the war.

Although Israel is not a major crude producer, the ongoing conflict’s implications for oil could be substantial if major players are drawn into the crisis. For instance, should conclusive evidence emerge implicating Iran in the terrorist incidents in any way, the West could be forced to impose new economic sanctions on the Islamic Republic’s energy sector, a situation that could further tighten markets.

Eager to gain a better understanding of where the oil market is headed? Download our Q4 trading forecast for enlightening insights!

To stay ahead of future market trends, traders must maintain a vigilant watch over the evolving geopolitical situation in the Middle East. If tensions intensify and bring Israel and Iran into open confrontation, oil prices could rally violently, especially if the United States intervenes directly in the fray in support of its regional ally. The situation could get uglier if Tehran closes the vital Strait of Hormuz in response to perceived aggression. This would be very bullish for oil prices.

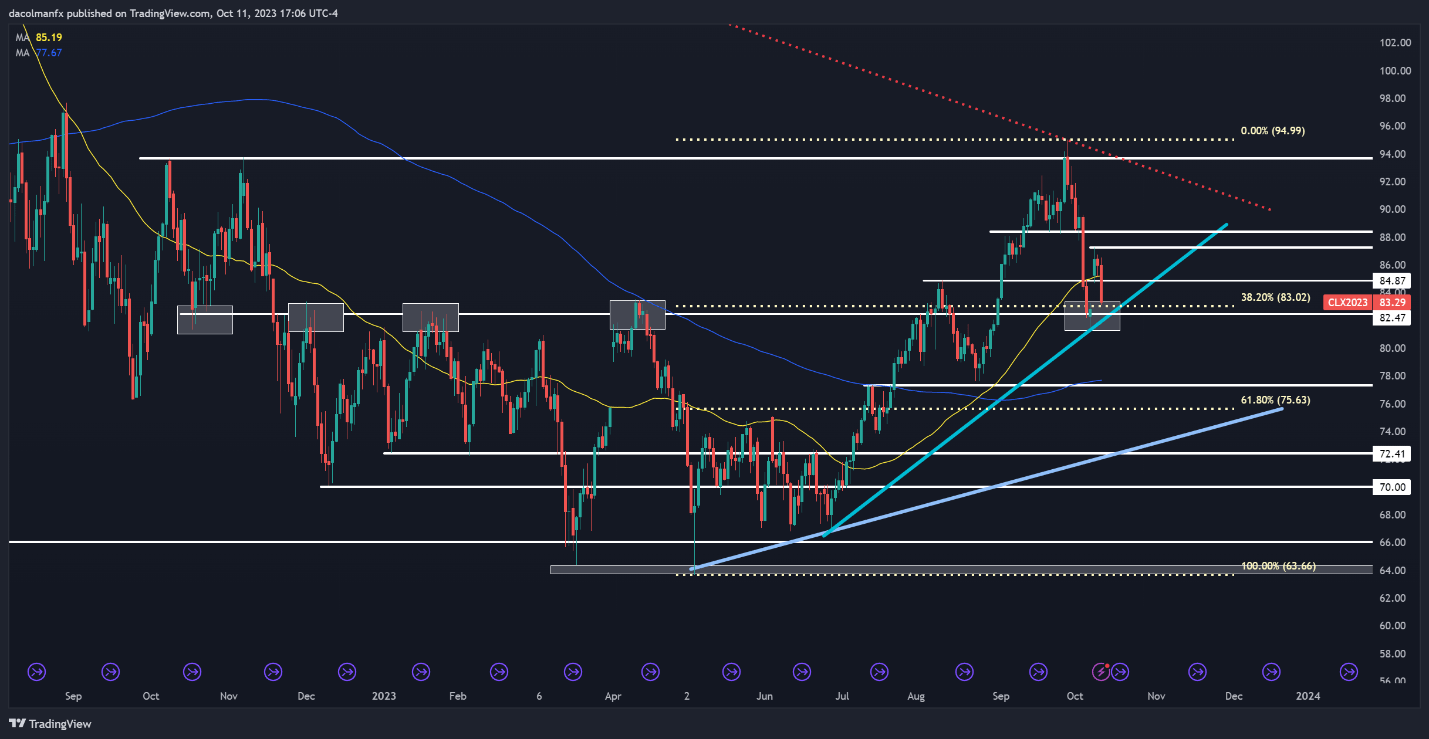
From a technical perspective, oil prices have fallen towards an important support near the $83.00 handle after Wednesday’s pullback – a key level that aligns with the 38.2% Fibonacci retracement of the 2023 rally. If the bears manage to breach this floor and push prices below trendline resistance at $82.00, we could see a drop toward $77.50.

On the other hand, if WTI manages to resume its rebound, initial resistance is situated at $85.00. While surmounting this obstacle may pose a challenge for buyers, a successful breakout has the potential to bolster the bullish momentum, opening the path for a move to $87.25, followed by $88.40. On further strength, a retest of the yearly high becomes more likely.

Start your voyage to becoming a knowledgeable oil trader today. Don’t let the occasion to acquire vital insights and strategies pass you by – obtain your ‘How to Trade Oil’ guide immediately!

CRUDE OIL (WTI FUTURES) TECHNICAL CHART

A screenshot of a graph  Description automatically generated

Light Crude Oil Futures Chart Created Using TradingView

Crude Oil Price Forecast: Bears Reload but Energy Market Outlook Stays Positive

Crude Oil Price Forecast: Bears Reload but Energy Market Outlook Stays Positive

Crude oil prices, as measured by WTI futures, extended losses on Wednesday, falling for the second consecutive session and erasing most of Monday’s vigorous rally, a brief upswing that came in the wake of last weekend’s events in the Middle East. To give some background, the militant group Hamas launched a deadly incursion into Israel from the Gaza Strip early Saturday, leading to the most substantial loss of civilian lives in the history of the Jewish nation.

As a response, Israeli Prime Minister Benjamin Netanyahu initiated a military offensive against Hamas, ordering extensive aerial attacks in Gaza and imposing a total siege on the coastal enclave to eradicate the operational centers and dismantle the strongholds of the extremist group. As of Wednesday, the number of dead had topped 1000 on each side of the war.

Although Israel is not a major crude producer, the ongoing conflict’s implications for oil could be substantial if major players are drawn into the crisis. For instance, should conclusive evidence emerge implicating Iran in the terrorist incidents in any way, the West could be forced to impose new economic sanctions on the Islamic Republic’s energy sector, a situation that could further tighten markets.

Eager to gain a better understanding of where the oil market is headed? Download our Q4 trading forecast for enlightening insights!

To stay ahead of future market trends, traders must maintain a vigilant watch over the evolving geopolitical situation in the Middle East. If tensions intensify and bring Israel and Iran into open confrontation, oil prices could rally violently, especially if the United States intervenes directly in the fray in support of its regional ally. The situation could get uglier if Tehran closes the vital Strait of Hormuz in response to perceived aggression. This would be very bullish for oil prices.

From a technical perspective, oil prices have fallen towards an important support near the $83.00 handle after Wednesday’s pullback – a key level that aligns with the 38.2% Fibonacci retracement of the 2023 rally. If the bears manage to breach this floor and push prices below trendline resistance at $82.00, we could see a drop toward $77.50.

On the other hand, if WTI manages to resume its rebound, initial resistance is situated at $85.00. While surmounting this obstacle may pose a challenge for buyers, a successful breakout has the potential to bolster the bullish momentum, opening the path for a move to $87.25, followed by $88.40. On further strength, a retest of the yearly high becomes more likely.

Start your voyage to becoming a knowledgeable oil trader today. Don’t let the occasion to acquire vital insights and strategies pass you by – obtain your ‘How to Trade Oil’ guide immediately!

CRUDE OIL (WTI FUTURES) TECHNICAL CHART

A screenshot of a graph  Description automatically generated


Gold Price Outlook: XAU/USD May Rise as Retail Bets Turn Less Net-Long

Gold Price Outlook: XAU/USD May Rise as Retail Bets Turn Less Net-Long

Gold prices are up over 2.3 percent this week so far, setting the stage for the best 5-day performance since the middle of March if gains are sustained. In response, retail traders have been becoming increasingly bearish as of late. This can be seen by taking a look at IG Client Sentiment (IGCS), which often functions as a contrarian indicator. With that in mind, will XAU/USD continue higher from here?

Gold Sentiment Outlook – Bullish

The IGCS gauge shows that about 83% of retail traders are net-long gold. Since the majority of them are biased to the upside, this continues to hint that prices may continue lower down the road. But, downside bets have increased by 18.59% and 26.67% compared to yesterday and last week, respectively. With that in mind, recent changes in exposure hint that prices may soon reverse higher.

XAU/USD Daily Chart

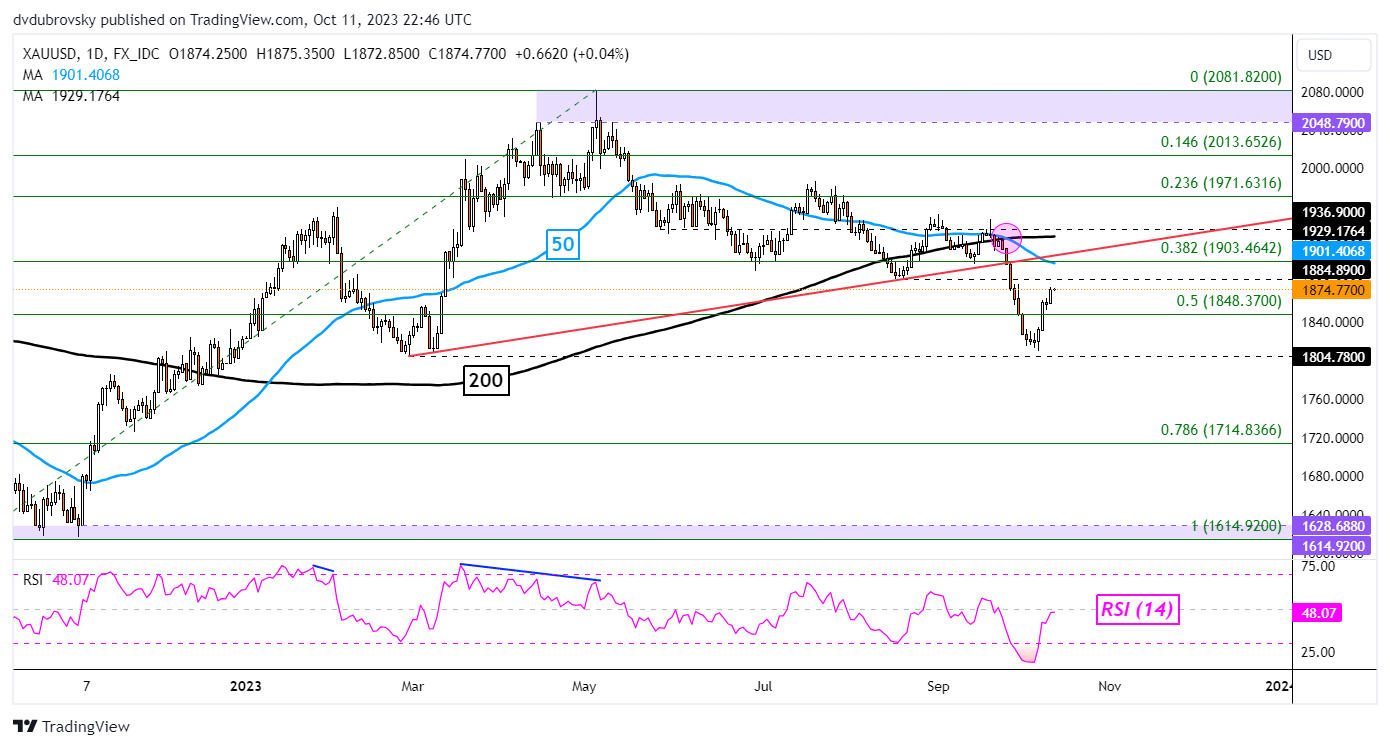
On the daily chart below, gold has continued to bounce off the February low of 1804.78, subsequently confirming a break above the midpoint of the Fibonacci retracement level of 1848.37. That is placing the focus on the 1884.89 inflection point as immediate resistance with the 50-day moving average nearing just above that.

There has been a bearish Death Cross in play between the 50- and 200-day moving averages since September, which is underscoring a broader bearish technical bias. If the moving average holds, key support below is the February low. Taking it out will open the door to resuming the downtrend.

image2.png

US Dollar Slides on Fed Tilt but CPI Fears Linger. Will Treasury Yields Go Lower?

US Dollar Slides on Fed Tilt but CPI Fears Linger. Will Treasury Yields Go Lower?

The US Dollar has been struggling this week against the Euro, Sterling and Swiss Franc but it has faired better against the Yen and commodity-linked currencies.

Undermining the outlook for the ‘big dollar’ has been the notable tilt in the stance of the Federal Reserve.

Until this week, the debate had been symmetrically focussed on a hike or no hike scenario for the next Federal Open Market Committee (FOMC) meeting.

However, in the last few days, the market has seen a shift toward the risks for policy going forward being balanced and this has opened the prospect of a potential cut at some stage further down the track.

The less hawkish rhetoric started on Monday from several Fed speakers and has continued into the middle of the week, culminating with the release of the FOMC meeting minutes from the September conclave overnight.

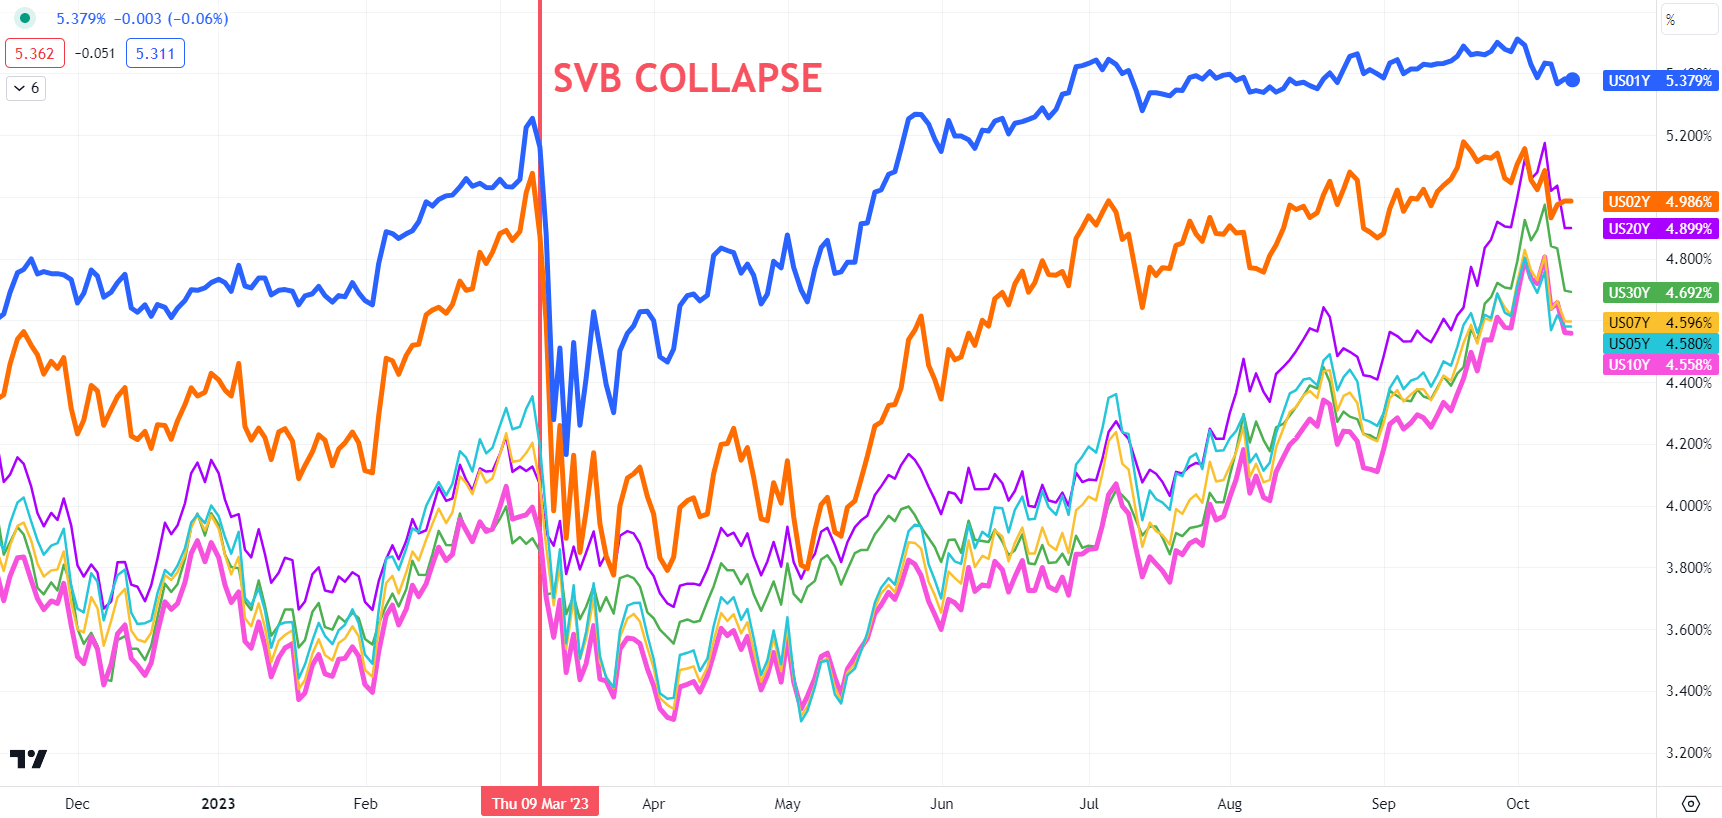
The commentary from Fed members Jefferson, Logan, Kashkari and Daly, among others, pointed to the higher yields at the back end of the Treasury curve effectively doing some of the desired tightening for the Fed without them having to raise the short-end target rate.

The benchmark 10-year bond nudged 4.88% last Friday, the highest return for the low-risk asset since 2007. It collapsed to trade below 4.55% overnight and remains near that level at the time of going to print, potentially undoing some of the Fed’s desired tightening.

From the FOMC minutes released yesterday, the statement specifically said, “Participants generally judged that, with the stance of monetary policy in restrictive territory, risks to the achievement of the Committee’s goals had become more two-sided.”

With the Fed appearing to signal a reluctance to hike and the tumbling of Treasury yields, not surprisingly, the US Dollar has been languishing against most of the major currencies.

The Swiss Franc has seen the largest gains this week reversing the moves of last week when USD/CHF made a seven-month high.

A benign inflation environment there has allowed the Swiss National Bank (SNB) to refrain from aggressive monetary policy tightening.

Its target rate of 1.75% is well below that of the other major central banks other than the Bank of Japan (BoJ), which has a negative interest rate policy (NIRP).

US PPI data overnight came in hotter than expected at 2.2% year-on-year to the end of September against 1.6% anticipated.

Later today the focus will be on US CPI but it appears that it would take a large miss to reshape the market’s outlook for the Fed’s rate path.

A Bloomberg survey of economists is estimating that year-on-year headline CPI will be 3.7% to the end of September. To learn more about trading the news, click on the banner below.

TREASURY YIELDS ACROSS THE CURVE

image1.png


Australian Dollar Outlook: AUD/USD or EUR/AUD, Aussie Picture Remains Bearish

Australian Dollar Outlook: AUD/USD or EUR/AUD, Aussie Picture Remains Bearish

In recent days, the Australian Dollar has been aiming higher of late with some mixed progress among major currency pairs. Looking at the daily chart below, AUD/USD has turned cautiously higher have positive RSI divergence persisted. The latter indicated that downside momentum was fading, hinting that a turn higher might have been in the cards.

Now, the exchange rate is sitting just under the 50-day moving average. In August, a bearish Death Cross emerged between the 20- and 50-period lines, offering a downward technical bias. As such, despite recent gains, the technical bias remains bearish. Besides the moving average, immediate resistance seems to be the 0.6459 inflection point.

The latter was established back in May. Breaking higher exposes the 0.6568 inflection point from the March low. Otherwise, turning lower places the focus on support which is the November low of 0.6272.

AUD/USD Daily Chart

AUD/USD Daily Chart

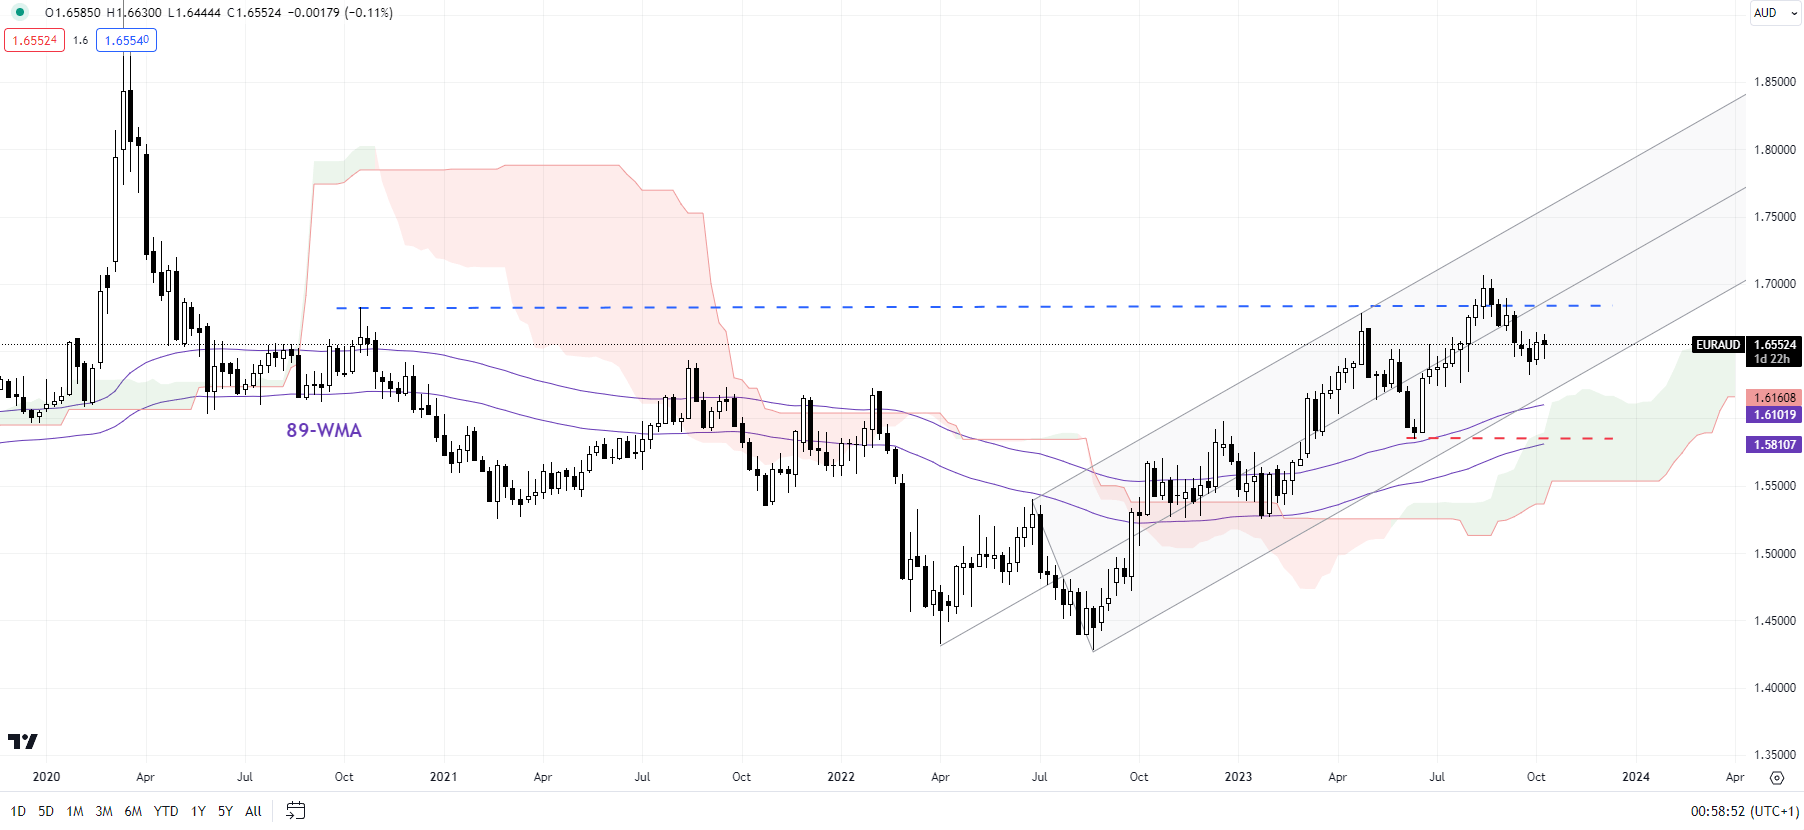
Switching to the Euro, EUR/AUD has been in a cautious downtrend since August. But, the exchange rate remains in an overall uptrend. The latter seems to be upheld by rising support from the beginning of this year – see chart below.

From here, immediate resistance appears to be the combination of the 23.6% Fibonacci retracement level of 1.6638 and the 50-day moving average slightly above that. Clearing these would open the door to potentially revisiting the July peak of 1.7065.

Otherwise, a turn lower places the focus on rising support from the beginning of this year which may reinstate the broader uptrend. Breaking lower opens the door to offering an increasingly bearish technical bias.

EUR/AUD Daily Chart

EUR/AUD Daily Chart

Is Euro’s Downtrend Over? EUR/USD, EUR/AUD, EUR/NZD Price Setups

Is Euro’s Downtrend Over? EUR/USD, EUR/AUD, EUR/NZD Price Setups

The euro appears to have garnered some cushion for now, thanks to the apparent shift in Fed rhetoric. The question then comes up is this a game changer for EUR/USD?

From a monetary policy perspective, the divergence in policy outlook appears to be reducing. The minutes of the FOMC meeting stressed the need for proceeding carefully in determining the extent of additional policy tightening. In recent days, the key Fed officials have indicated the sharp rise in yields / financial conditions has reduced the need for further interest rate hikes. Similarly, two ECB officials on Wednesday saw a reduced likelihood of additional tightening as the disinflation process is underway.

However, the economic growth divergence in favor of the US could limit the rebound in EUR/USD. The US economy appears to be on a solid footing, whereas the Euro area economy’s underperformance could drag – the rise in German real estate insolvencies could be another headwind.

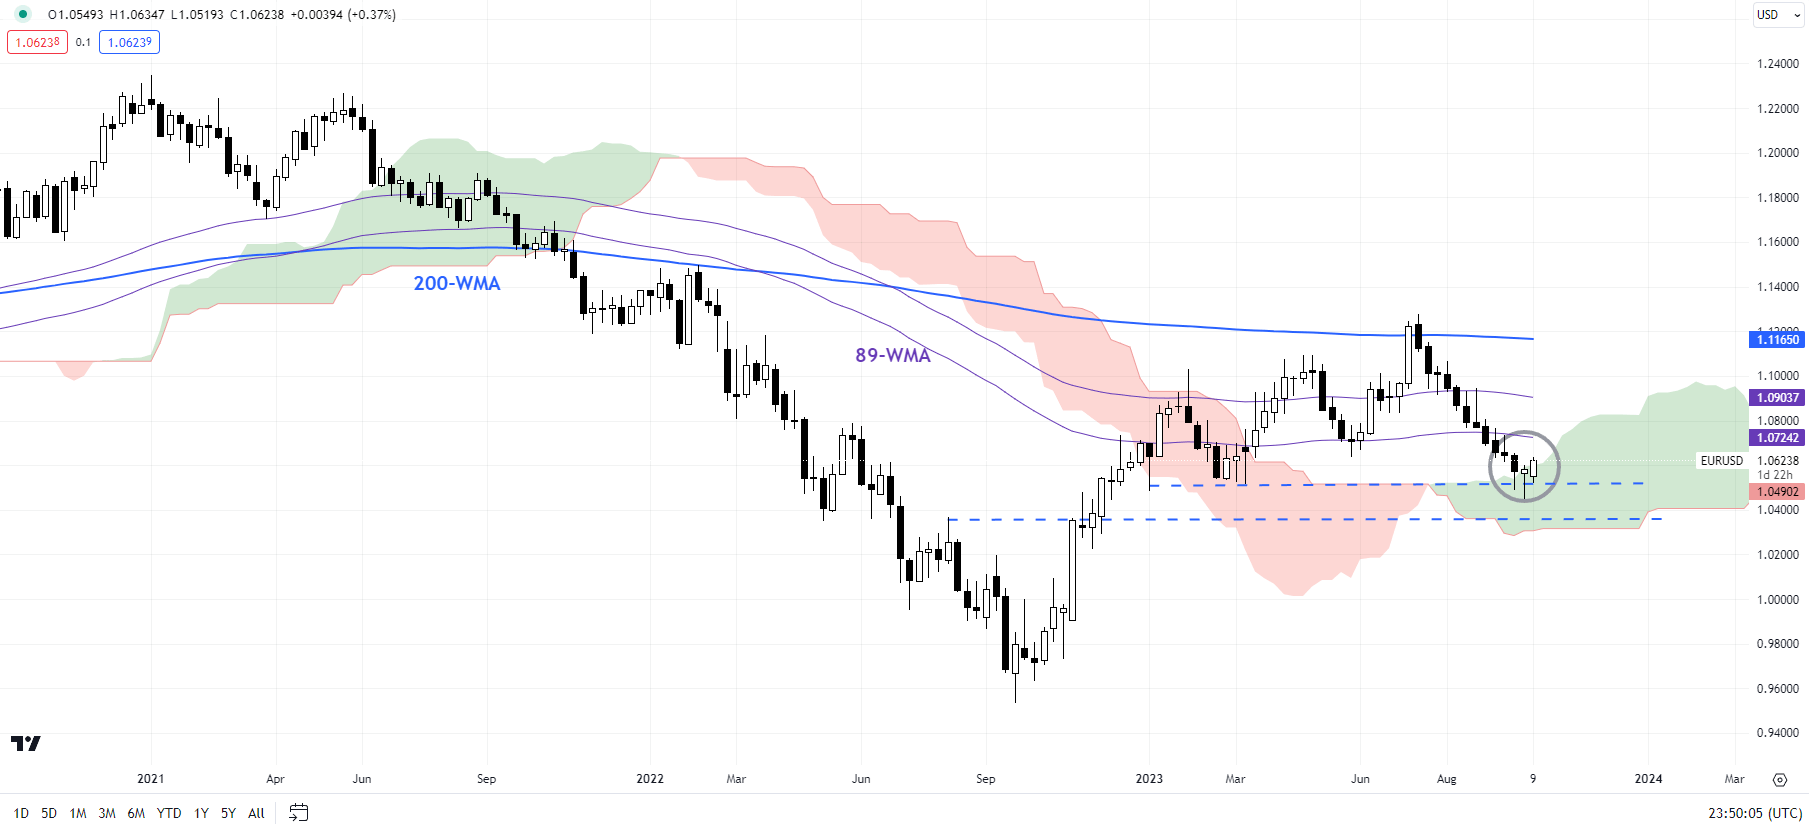
EUR/USD Weekly Chart

image1.png

EUR/USD: Major support holds

On technical charts, EUR/USD is attempting to rebound from crucial support zones, including the March low of 1.0500 and the lower edge of the Ichimoku cloud on the weekly charts. The rebound comes three weeks after the prospect of it was first highlighted in “Euro Could Be Due for a Minor Bounce: EUR/USD, EUR/JPY, EUR/GBP, Price Setups,” published September 19.

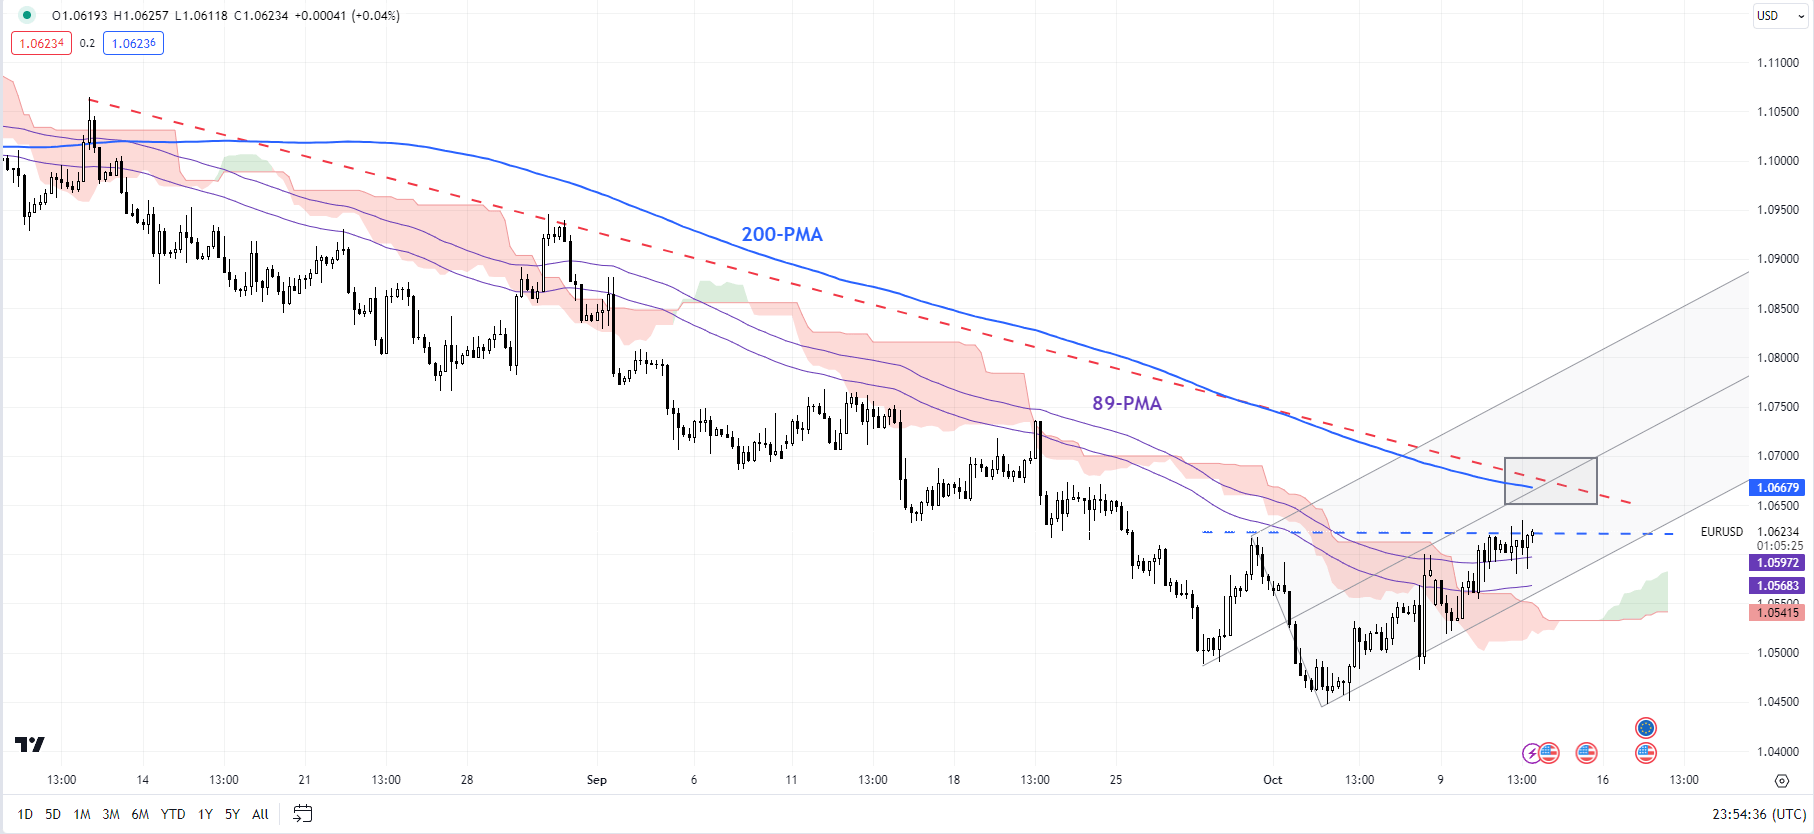
EUR/USD 240-Minute Chart

image2.png

Supercharge your trading prowess with an in-depth analysis of gold‘s outlook, offering insights from both fundamental and technical viewpoints. Claim your free Q4 trading guide now!

EUR/USD is now approaching a tough converged hurdle, including the 200-period moving average on the 240-minute charts, a downtrend line from August, slightly above the end-September high of 1.0620. A crack above this resistance area is needed for the immediate downside risks to fade. Zooming out, a hold above 1.0300-1.0500 is crucial to keep the broader recovery pattern intact from the broader recovery that started last year.

EUR/AUD Weekly Chart

image3.png

EUR/AUD: Uptrend hasn’t been derailed

Despite the recent retreat, the broader uptrend in EUR/AUD remains intact, as reflected in the higher-highs-higher-lows sequence since 2022. The cross appears to be nicely guided by a rising pitchfork channel since last year. Unless the cross falls below the June low of 1.5850, the path of least resistance remains sideways to up in the interim. While 1.5850 is in place, the probability of an eventual rise above resistance at the August peak of 1.7050 is high.

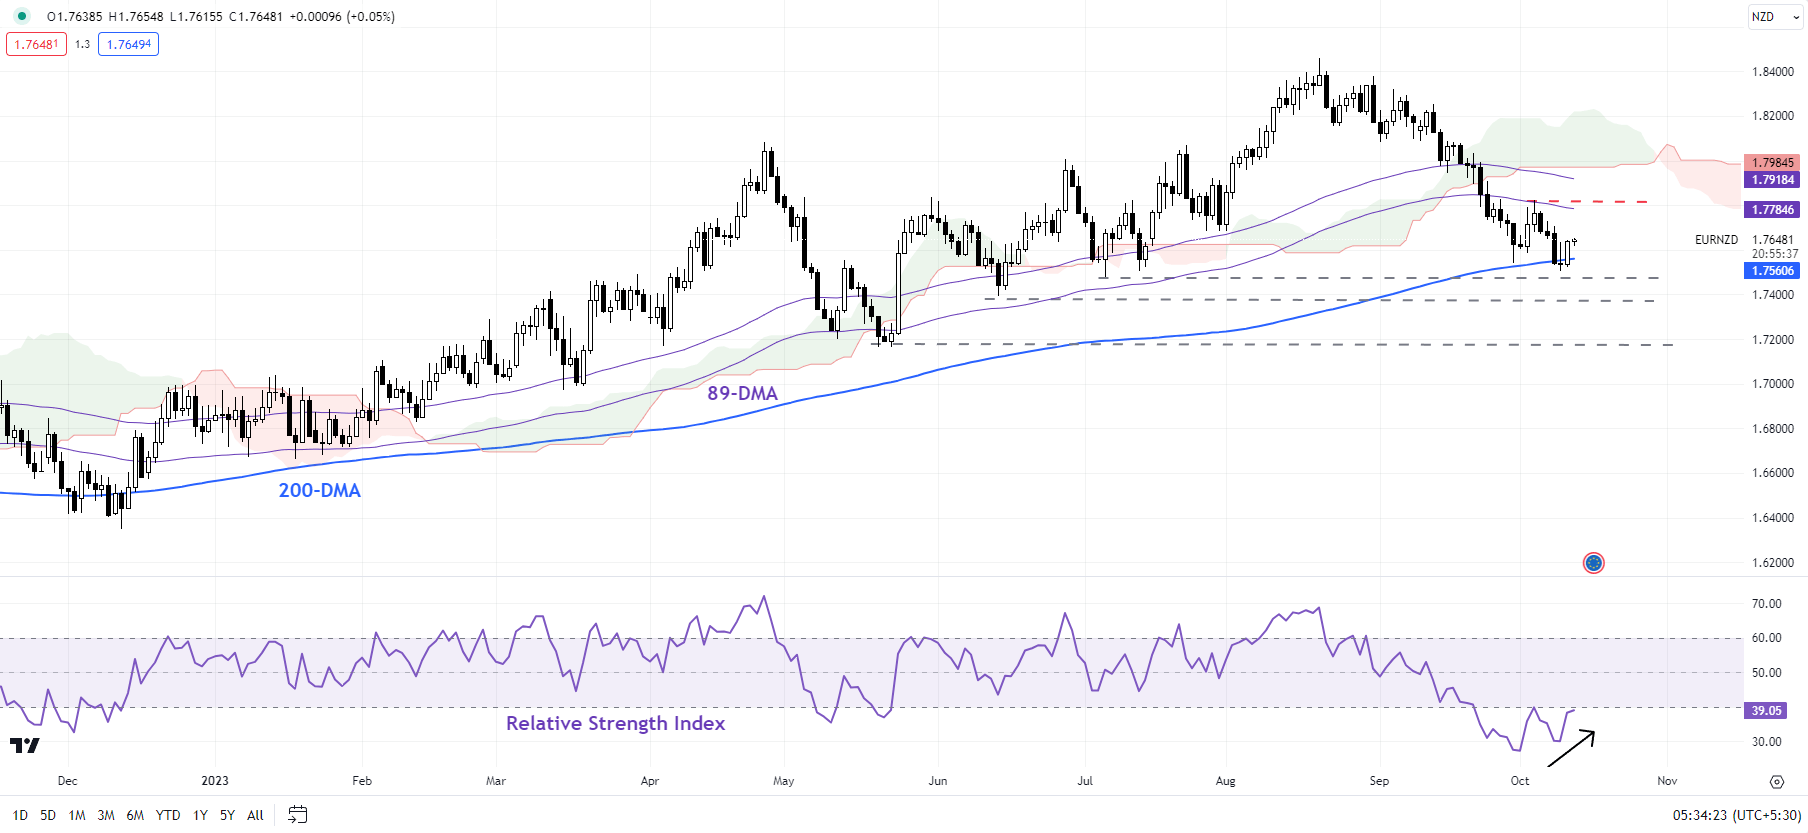
EUR/NZD Daily Chart

image4.png

EUR/NZD: Slide is losing steam

A positive divergence (ascending 14-day Relative Strength Index associated with declining price) on the daily charts suggests that EUR/NZD’s slide appears to losing steam. The cross is testing fairly strong support on the 200-day moving average, not too far from the June and July lows, with stronger support at the May low of 1.7165. However, EUR/NZD would need to crack above the early-October high of 1.7825 for the immediate downside risks to dissipate.