Crude Oil Gaps Lower as Stockpiles Build and Fed in Focus Ahead of US CPI. Lower WTI?

Crude Oil Gaps Lower as Stockpiles Build and Fed in Focus Ahead of US CPI. Lower WTI?

Crude oil steadied in Asian trade today after tumbling overnight in the wake of a surge in stockpiles. The move lower unfolded despite favourable conditions for equities after more hawkish comments from Fed speakers.

Data released overnight saw the American Petroleum Institute (API) report reveal an accumulation of 12.94 million barrels for the week ended October 6th. This was much higher than the 1.3 million increase anticipated and comes after a depletion of 4.21 million prior.

The market’s focus now turns toward the official Energy Information Agency (EIA) stockpile figures that are due later today. The WTI futures contract is near US$ 83 bbl while the Brent contract is a touch above US$ 85.50 bbl.

US CPI will also be released and will come into sharper focus after US PPI beats estimates to the upside, coming in at 2.2% year-on-year to the end of September against 1.6% anticipated.

A Bloomberg survey of economists is estimating that year-on-year headline CPI will be 3.7% to the end of September. To learn more about trading the news, click on the banner below.

Federal Reserve Governor Christopher Waller and Boston Federal Reserve President Susan Collins joined the conga line of Fed board members spruiking a less hawkish mantra this week.

Federal Open Market Committee (FOMC) meeting minutes released overnight support the thesis with the bank specifically saying, “Participants generally judged that, with the stance of monetary policy in restrictive territory, risks to the achievement of the Committee’s goals had become more two-sided.”

To learn more about trading markets around news event, click on the banner below.

Equity markets appeared to cheer the news with the Dow Jones, S&P 500 and Nasdaq all finishing higher by 0.19%, 0.43% and 0.71% respectively.

APAC equities took the lead with a sea of green across the board today. Chinese stocks sailed with an extra tailwind when it was announced that the national wealth fund had been buying stocks in the four largest Chinese banks.

Futures are pointing toward a steady start for the European and North American cash session.

Currency markets have been fairly quiet so far in the Thursday session after the US Dollar slipped against the major pairs yesterday but gained against commodity-linked currencies. Gold remains firm, trading near US$ 1,880 an ounce.

After the vital UK data this morning, there will be a plethora of ECB speakers ahead of the US CPI figures.

WTI CRUDE OIL TECHNICAL SNAPSHOT

The WTI futures contract filled in the gap created at the start of this week today.

Although this technical feature is not as pronounced as it was back in April, it may have some bearish implications.

It should be noted though that past performance is not indicative of future results.

Support may lie near the breakpoints of 83.53,83.34 or the prior low at 81.50.

Nearby resistance could be at the breakpoints of 84.89, 87.76, 88.15 and 88.19. On the downside.

WTI CHART
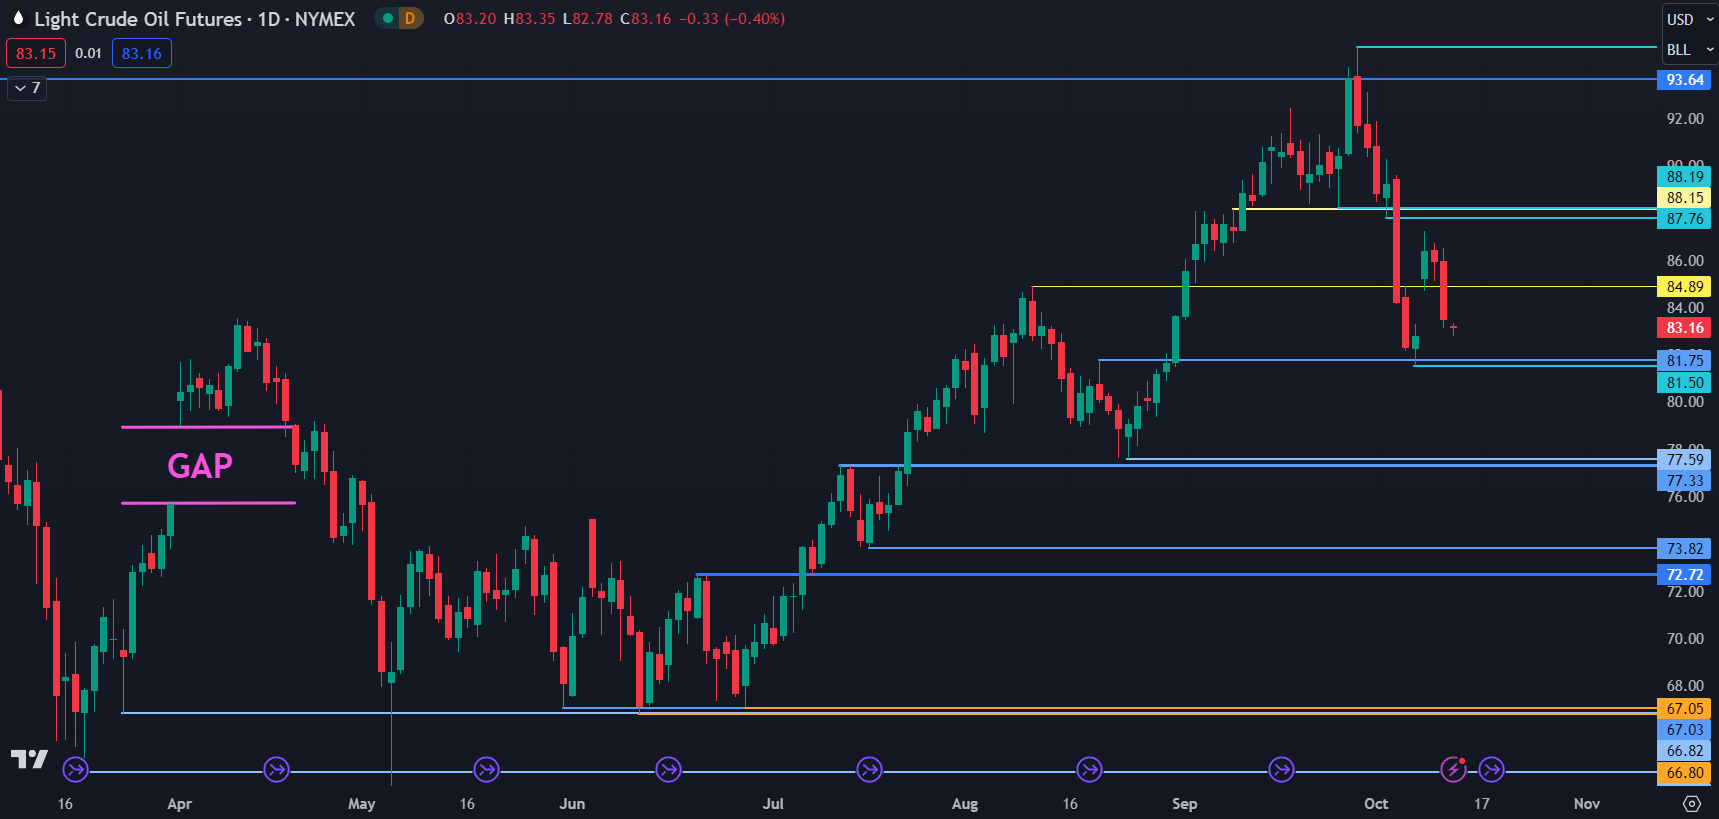
image1.png


UK Breaking News: Monthly GDP Returns to Growth in August, GBP Lower

UK Breaking News: Monthly GDP Returns to Growth in August, GBP Lower

UK GDP Posts a Positive Response to Worse-Than-Expected Decline in July

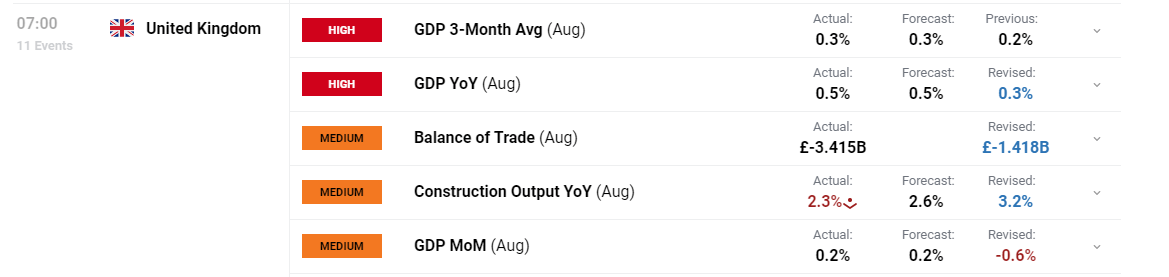
UK GDP revealed a positive response to July’s shock contraction – which was revised lower to -0.6% from an initial estimate of -0.5%. GDP in the month of August rose by 0.2% as expected. The three-month average, a more smoothed measure of GDP, rose 0.3% – in line with forecasts.

image1.png

The services sector grew by 0.4% in August and there were contractions in the production sector and in construction. The path of UK GDP has been choppy in 2023 – a sign of an uncertain economic outlook both domestically and internationally as the global growth slowdown takes hold.

Progress is being made on the inflation front but still remains high compared to other developed economies. The Bank of England will now be looking ahead to next week’s unemployment data and average earnings figures after seeing positive developments in the job market (moderate easing) and concerning wage data which recently breached the 8% mark – a concern for the central bank.

Immediate Market Reaction

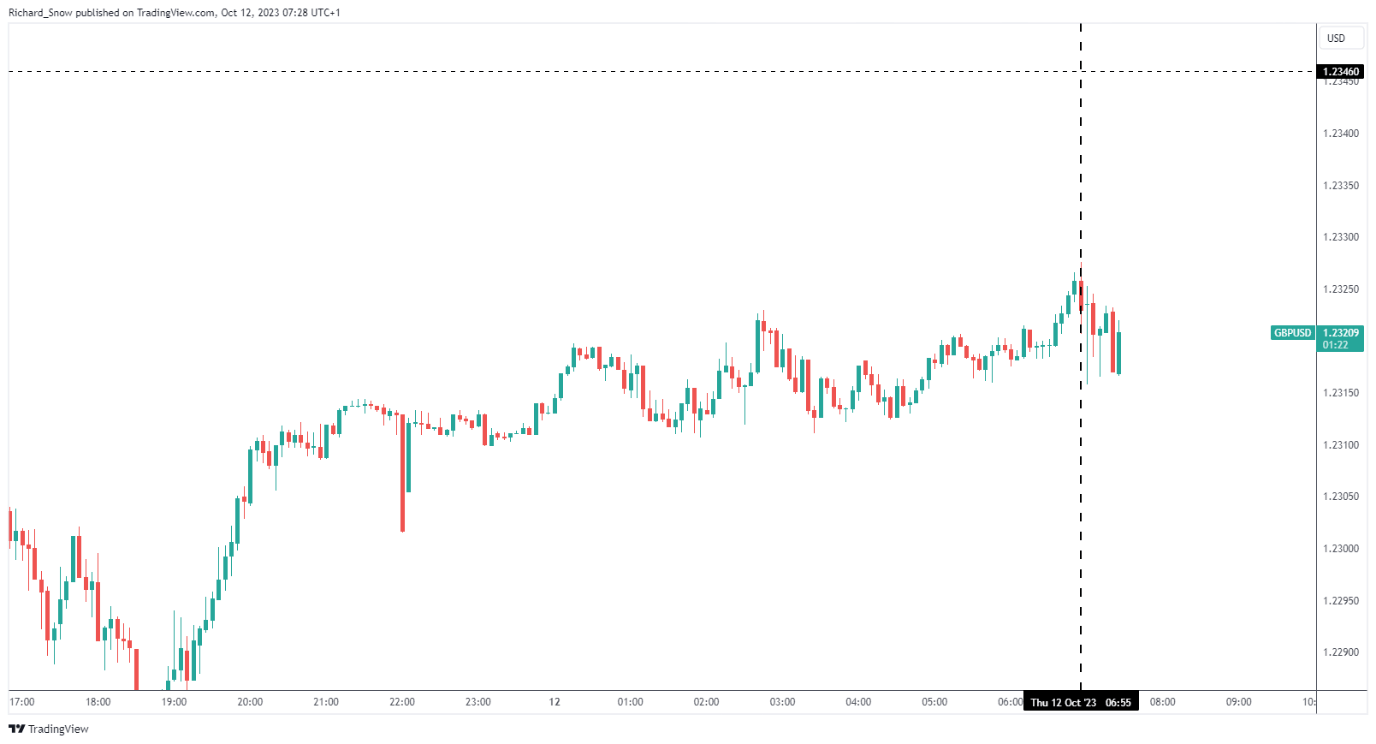
Cable initially dropped on the release of the data but has subsequently reversed the decline and trades marginally higher than it did in the moments before the data release.

GBP/USD 5-minute chart

image2.png

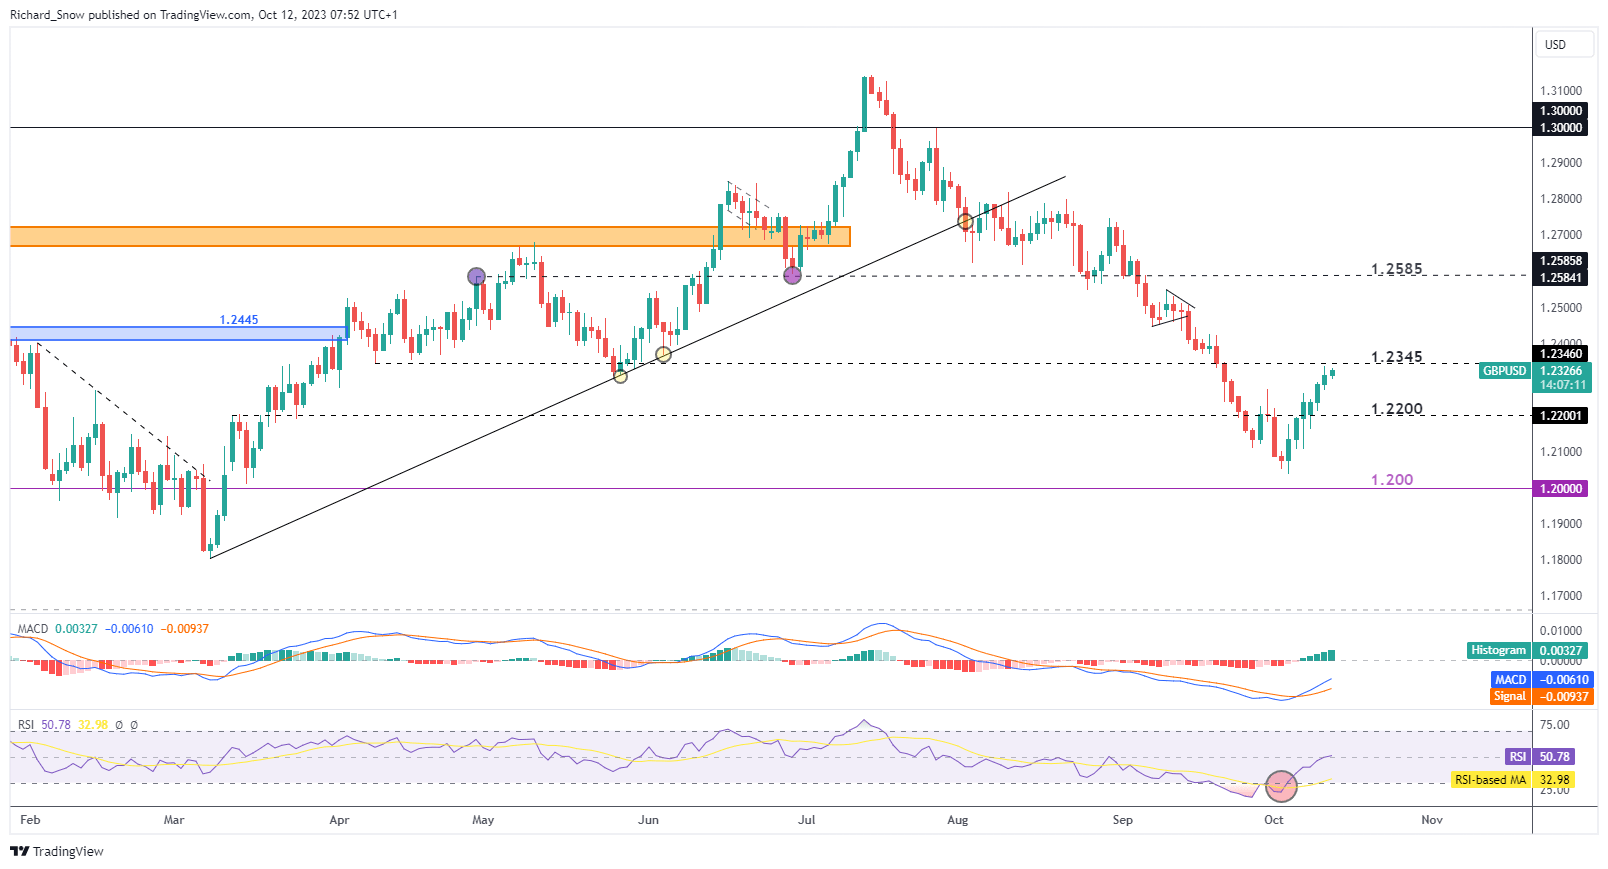
GBP/USD has benefitted from the recent dollar selloff, enabling the pair to lift off the recent swing low which came in ahead of the psychological level of 1.2000.

GBP/USD Daily Chart

image3.png


US Dollar Index News: DXY Dips Despite Rising PPI, Market Awaits Fed Minutes

US Dollar Index News: DXY Dips Despite Rising PPI, Market Awaits Fed Minutes

Dollar Dips Ahead of Fed Minutes

The US Dollar weakened marginally against a group of major currencies, as traders turned their attention to the upcoming Federal Reserve minutes. The move came despite a hotter-than-expected producer price index (PPI), which hinted at rising inflationary pressures in the U.S. economy. Investors remain cautious, awaiting Thursday’s consumer inflation report.

Inflation on the Horizon

The Labor Department’s latest report revealed that the PPI rose by 0.5% in September, exceeding Dow Jones estimates of a 0.3% increase. Stripping out food and energy, the core PPI showed a 0.3% uptick, further beating forecasts. The increase came mainly from a surge in gasoline prices and a moderate rise in the cost of services, suggesting that inflation pressures are not abating.

Trading Derivatives carries a high level of risk to your capital and you should only trade with money you can afford to lose. Trading Derivatives may not be suitable for all investors, so please ensure that you fully understand the risks involved, and seek independent advice if necessary. A Product Disclosure Statement (PDS) can be obtained either from this website or on request from our offices and should be considered before entering into a transaction with us. Raw Spread accounts offer spreads from 0.0 pips with a commission charge of USD $3.50 per 100k traded. Standard account offer spreads from 1 pips with no additional commission charges. Spreads on CFD indices start at 0.4 points. The information on this site is not directed at residents in any country or jurisdiction where such distribution or use would be contrary to local law or regulation.


Market Reaction and Future Indicators

Despite the PPI’s potential as an inflation indicator, markets showed minimal immediate reaction, although Treasury yields did inch lower. Investors are holding their breath for the more closely-watched consumer price index set to release on Thursday. This data, along with the PPI, could influence the Federal Reserve’s future monetary policy decisions.

Fed Outlook

Central bank officials recently hinted that they may not need to hike rates further due to the spontaneous rise in Treasury yields, which has itself tightened financial conditions. The market currently expects the Fed to hold off on any more rate hikes for the time being, but that could change with new economic data.

Short-Term Forecast

Short-Term Forecast The dollar index remains on a downtrend, hovering near two-week lows. Given the ongoing geopolitical tensions and upcoming economic releases, the short-term market sentiment appears bearish for the U.S. dollar. Further clarity will likely come from the Fed minutes and consumer inflation data later this week.

Technical Analysis

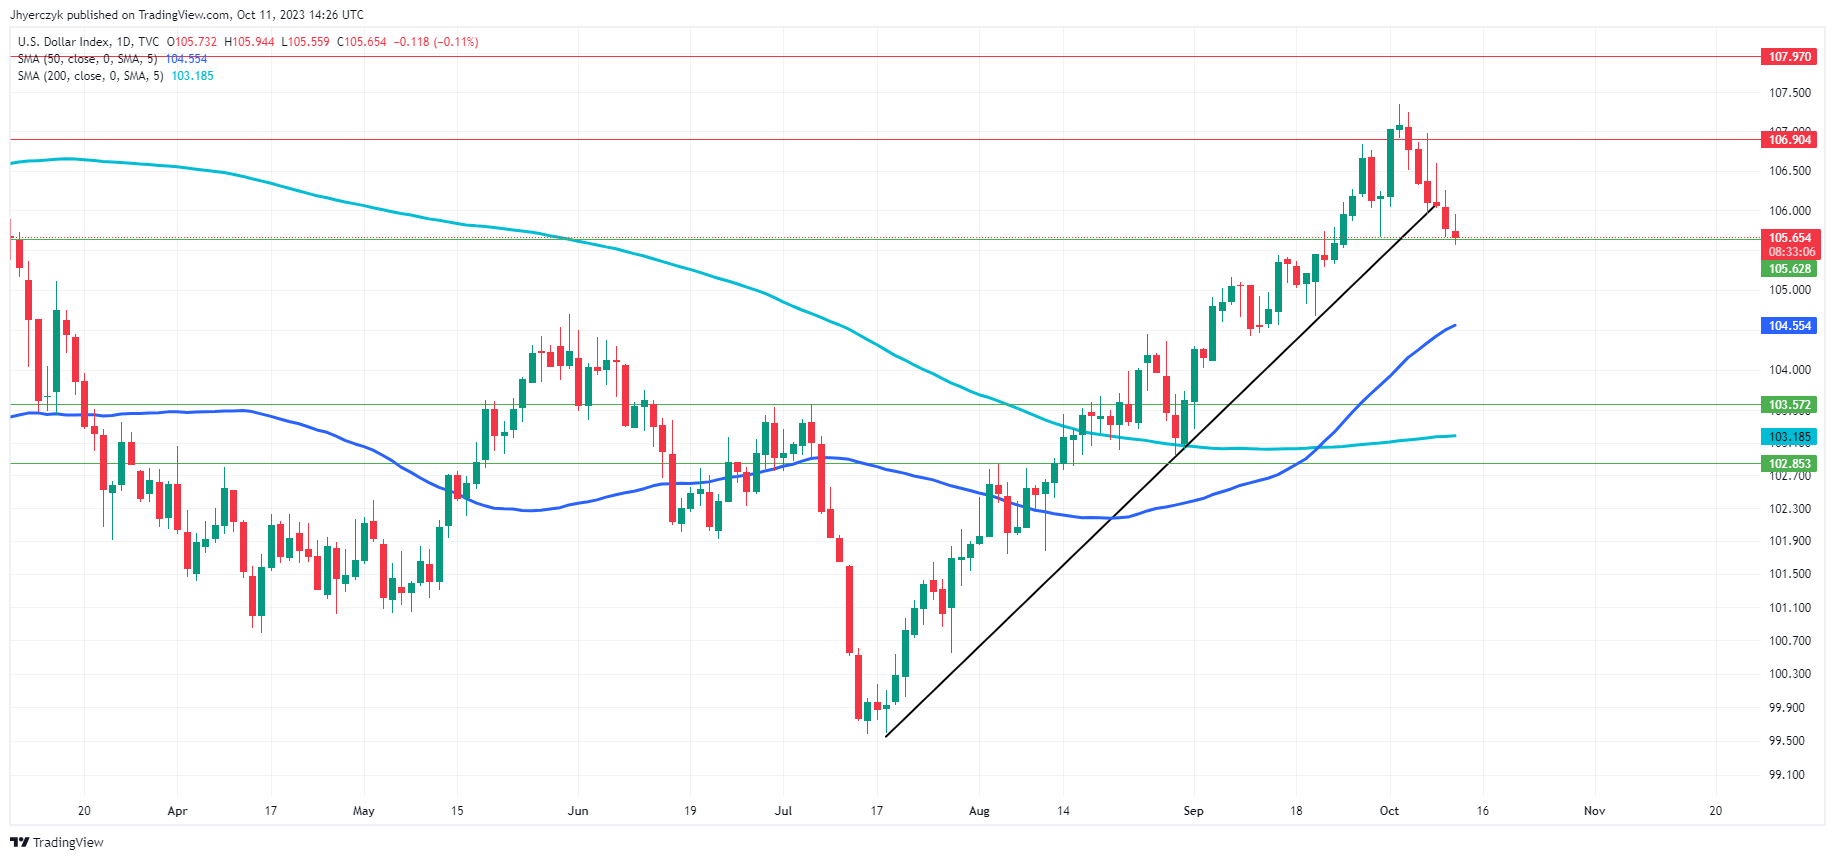
Daily US Dollar Index (DXY)The US Dollar Index (DXY) is currently trading at 105.659, positioned above both its 200-Day and 50-Day moving averages, at 103.185 and 104.554 respectively.

This ordinarily signals bullish sentiment, but the index is on the weaker side of the uptrending support line, introducing a note of caution.

With no immediate trend line resistance data, breaking below the existing trend line support at 106.317 could place the index in a vulnerable position. In that scenario, the 50-Day moving average would be the next target, introducing bearish potential.

Overall, despite trading above key moving averages, the DXY exhibits a tenuous, cautiously bearish sentiment due to its proximity to critical support levels.

Gold Price Forecast – Gold Markets Rally

Gold Price Forecast – Gold Markets Rally

Gold Market Technical Analysis

Gold has completely ignored the PPI numbers coming out twice what they were expected to be in the United States, and despite the fact that inflation is so strong, it looks like the traders in the markets are going to continue to see gold at least attempt to rally. The CPI numbers on Thursday will probably be much more impactful, and it’s probably worth noting that the 50-Day EMA is getting ready to cross below the 200-Day EMA, kicking off the so-called “death cross.” We also have the $1900 level in that general vicinity, which of course has a lot of market memory attached to it.

Trading Derivatives carries a high level of risk to your capital and you should only trade with money you can afford to lose. Trading Derivatives may not be suitable for all investors, so please ensure that you fully understand the risks involved, and seek independent advice if necessary. A Product Disclosure Statement (PDS) can be obtained either from this website or on request from our offices and should be considered before entering into a transaction with us. Raw Spread accounts offer spreads from 0.0 pips with a commission charge of USD $3.50 per 100k traded. Standard account offer spreads from 1 pips with no additional commission charges. Spreads on CFD indices start at 0.4 points. The information on this site is not directed at residents in any country or jurisdiction where such distribution or use would be contrary to local law or regulation.


Gold will continue to move right along with bond markets, so pay close attention to those yields. If those yields start to turn around and rally again, that will be absolutely toxic for gold. Given enough time, there could come in the “safety trade”, into the gold market at least, which may be part of what we have seen over the last couple of days. The $1800 level underneath is a major support level, and an area that would be difficult to break through.

In general, this is a market that I believe continues to be noisy, but it has had a nice relief rally, something that probably get sold into. On the other hand, if we break above those moving averages above, that opens up the possibility of a move to the $1950 level, and then possibly even the $2000 level. That being said, I don’t think it’s going to be an easy move to make that happen, but if we get above those moving averages, I would assume that we should eventually get to that $2000 level.

All things being equal, you need to be cautious with your position sizing but I do recognize that it’s also become a bit of a short-term trading environment. That’s probably true with most markets around the world, so I don’t know that gold would or should be any different at this point in time. We’ve had a nice rally, but we still have a long way to go to change everything in the opposite direction.

EUR/USD Forecast – Euro Pulls Back After PPI

EUR/USD Forecast – Euro Pulls Back After PPI

Euro vs US Dollar Technical Analysis

The euro initially shot higher during the trading session on Wednesday, but gained back some of the gains as it looks like the PPI numbers came out at 0.5% month over month, instead of the anticipated 0.2%, and year-over-year rose 2.2%, versus the estimated 1.6%. In other words, there is a lot of inflation out there, and therefore it will be interesting to see how this plays out. That being said, some of the reaction may be muted due to the fact that CPI comes out on Thursday, which is something that people pay a bit more attention to in the United States.

Trading Derivatives carries a high level of risk to your capital and you should only trade with money you can afford to lose. Trading Derivatives may not be suitable for all investors, so please ensure that you fully understand the risks involved, and seek independent advice if necessary. A Product Disclosure Statement (PDS) can be obtained either from this website or on request from our offices and should be considered before entering into a transaction with us. Raw Spread accounts offer spreads from 0.0 pips with a commission charge of USD $3.50 per 100k traded. Standard account offer spreads from 1 pips with no additional commission charges. Spreads on CFD indices start at 0.4 points. The information on this site is not directed at residents in any country or jurisdiction where such distribution or use would be contrary to local law or regulation.

That being said, it will be interesting to see how this plays out as the euro is currently dancing around the 1.06 level. This is a large, round, psychologically significant figure, and an area where a lot of people will be paying close attention to. The market breaking down from here could open up and move down to the 1.05 level, and the CPI numbers might be what kicks things off.

Ultimately, this is a market that continues to look for a narrative of hope, so therefore it should be noted that traders in America at least, are trying to find a bullish narrative regardless of what happens. That typically means a softer US dollar, but the reality is that big money seems to look at interest rates much quicker, which of course although having fallen over the last couple of days, the reality is that you still get paid to hold US dollars against the euro.

Furthermore, the euro has to deal with the recession in the European Union, so that doesn’t bode well either. With that being the case, I do think that eventually the selling returns, and if the CPI number on Thursday comes in hot, that could be the catalyst. All things being equal, I think you have to look at this through the prism of the longer-term trend, but also recognize that the erratic and narrative panic driven trading will continue to cause a lot of noisy behavior. In other words, you have to be extraordinarily nimble and get in and out of the market as quickly as possible.

Natural Gas Prices Forecast: Futures Retreat After Hitting Nine-Month High

Natural Gas Prices Forecast: Futures Retreat After Hitting Nine-Month High

Natural Gas Pulls Back

Natural gas futures are trading lower, breaking a four-day winning streak that propelled prices to a nine-month high. Traders are cashing in, influenced by a short-term outlook for moderate demand. At 13:44 GMT, the futures were down $0.077 or -2.28%, standing at $3.305.

Market Factors

Several elements contributed to the retreat in natural gas prices. The decline comes after six consecutive sessions of gains, where prices hit $3.3820/mmBtu, the highest since January. External factors like a 35% hike in European TTF gas prices due to geopolitical tensions and disruptions in supply chains played a part. However, the key driver was last week’s bullish EIA report and cooler temperature trends in the northern U.S.

Trading Derivatives carries a high level of risk to your capital and you should only trade with money you can afford to lose. Trading Derivatives may not be suitable for all investors, so please ensure that you fully understand the risks involved, and seek independent advice if necessary. A Product Disclosure Statement (PDS) can be obtained either from this website or on request from our offices and should be considered before entering into a transaction with us. Raw Spread accounts offer spreads from 0.0 pips with a commission charge of USD $3.50 per 100k traded. Standard account offer spreads from 1 pips with no additional commission charges. Spreads on CFD indices start at 0.4 points. The information on this site is not directed at residents in any country or jurisdiction where such distribution or use would be contrary to local law or regulation.

Weather Outlook

Weather data suggests moderate to seasonal demand for natural gas in the coming week. While the northern U.S. will experience cooler temperatures, the southern U.S. is expected to have comfortable highs, affecting natural gas demand. Additionally, a weak tropical system is projected to bring rain to the Gulf Coast, further moderating demand.

Global Influences

U.S. natural gas futures were also impacted by rising gas prices in Europe and potential tropical cyclones in the Gulf of Mexico. The European gas benchmark soared due to Middle East conflicts and colder weather, while a storm in the Gulf could further tighten supplies.

Short-Term Forecast

The market sentiment appears to be bearish in the short term, with traders taking profits after the recent spike. The presence of moderate weather conditions and geopolitical tensions could continue to influence natural gas prices, making the market volatile for the time being.

Technical Analysis

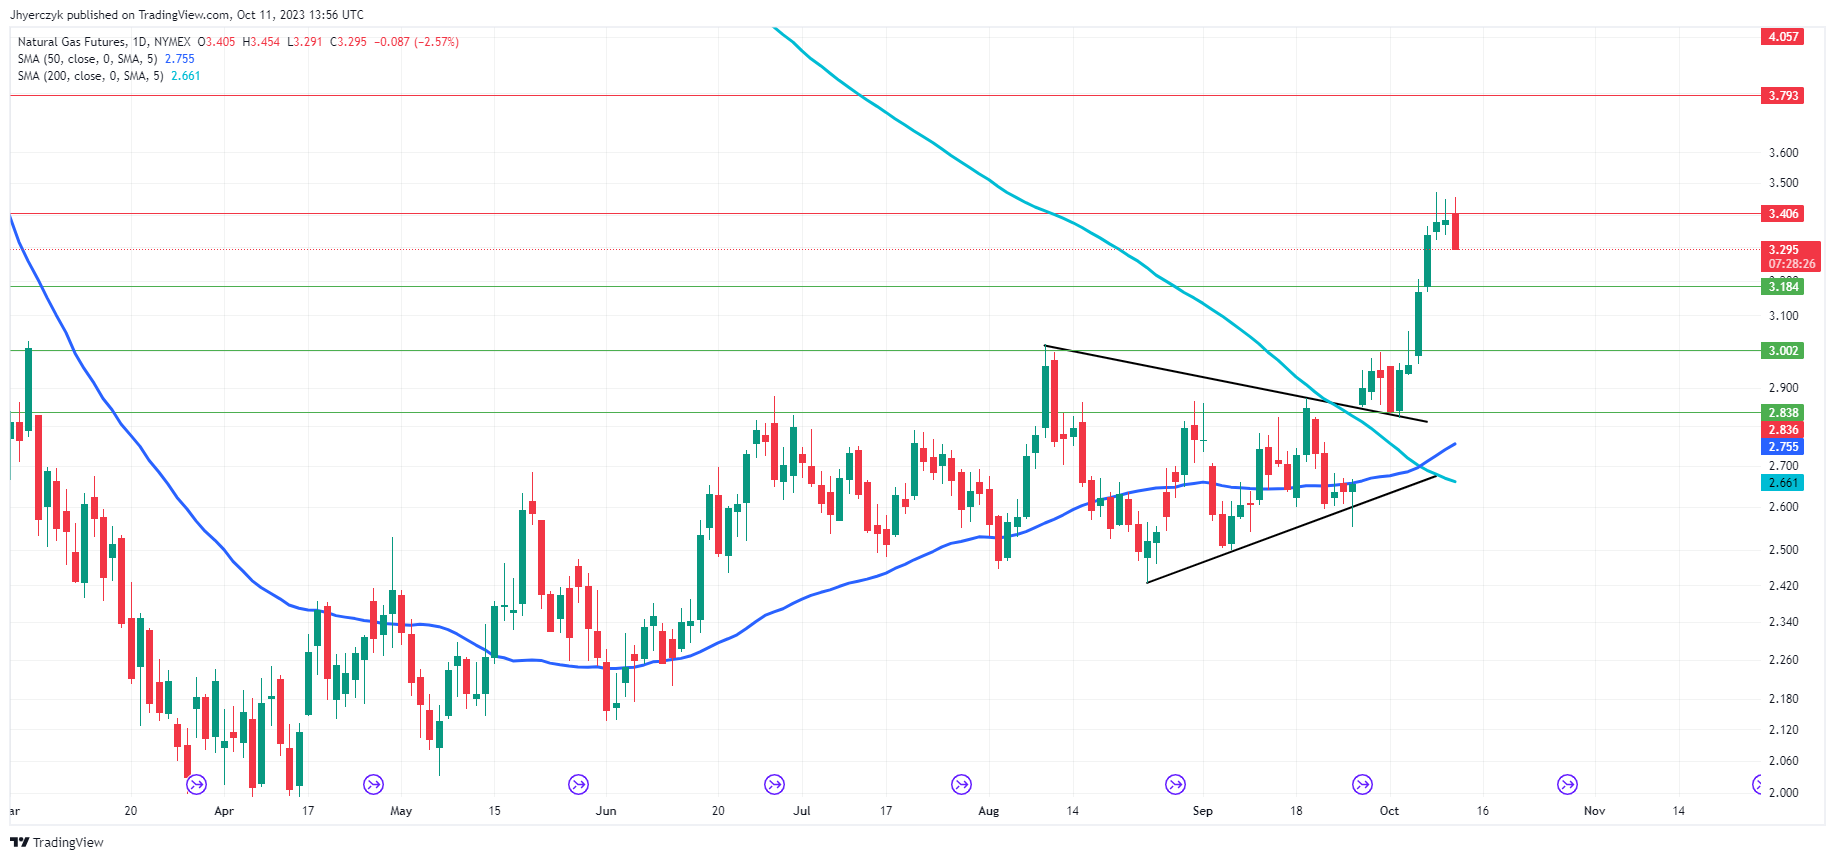
Daily Natural GasThe current daily price of natural gas at $3.279 sits above both the 200-Day and 50-Day moving averages, at $2.661 and $2.755 respectively, signaling bullish momentum. But the steep vertical movement has put the market in a vulnerable position.

While the market has pulled back from its recent high of $3.382, it’s still holding above minor support at $3.184 and well above the main support at $3.002.

There’s potential for upside movement, if minor and main resistance levels at $3.406 and $3.793 respectively, are overtaken. However, if support fails, the charts indicate a pullback into  the first support at $3.184 is possible, given the early downside momentum.

Given these indicators and the market’s ability to maintain levels above both moving averages and key support, the current market sentiment for natural gas appears to be cautiously bullish.

Surging Energy Costs Push U.S. Producer Prices Beyond Expectations

Surging Energy Costs Push U.S. Producer Prices Beyond Expectations

Unexpected Surge in Producer Prices

U.S. producer prices in September rose more than economists had predicted, primarily due to escalating energy costs. The Producer Price Index (PPI) for final demand gained 0.5%, according to a recent report from the Labor Department. This exceeded the Reuters poll’s forecast of a 0.3% rise. On a year-over-year basis, the increase was 2.2%, marginally up from the 2.0% figure in August, signaling persistent inflationary pressures, albeit at a moderated pace.

Diving Deeper Into Core PPI Metrics

Excluding the more volatile components of food, energy, and trade services, the core PPI increased by 0.2%, identical to its performance in the previous month. Over the course of 12 months through September, this so-called core PPI escalated by 2.8%, showing a slight deceleration from 2.9% in August. This is a crucial metric for gauging the underlying inflationary trends that the Federal Reserve watches closely, and its moderate upward movement could impact future interest rate decisions.

Economic Resilience Amid Tightening Monetary Policy

The U.S. economy continues to demonstrate resilience despite a series of rate hikes. An impressive 336,000 jobs were generated in September, nearly doubling what was projected. This robust jobs growth has had a palpable impact on market sentiment, with financial markets largely expecting the Federal Reserve to hold interest rates steady in their upcoming policy meeting scheduled for October 31 to November 1.

Role of Federal Officials and Bond Yields

Earlier this week, key Fed officials hinted at a reconsideration of further rate hikes, primarily because of rising yields on long-term U.S. government bonds. Since March, the Federal Reserve has tightened monetary policy by raising its benchmark interest rate by a substantial 525 basis points, reaching the current range of 5.25% to 5.50%. The uptick in long-term bond yields could act as a deterrent to additional rate hikes, and the central bank may opt for a more cautious stance going forward.

Outlook: A Mixed Bag with Cautious Optimism

While the market appears cautiously bullish due to better-than-expected jobs numbers and a slight moderation in core inflation, uncertainty looms large. The Federal Reserve’s next move is still in flux and will be influenced by a myriad of economic indicators, including the upcoming consumer price data. With so many variables at play, traders and investors are advised to keep a keen eye on forthcoming economic releases and Fed communications, as they could be pivotal in shaping market dynamics.

Oil Prices Forecast: Geopolitics, OPEC Output, Dollar Weakness Shape the Market

Oil Prices Forecast: Geopolitics, OPEC Output, Dollar Weakness Shape the Market

Geopolitical Tensions Stoke Oil Prices, But Fundamentals Remain In Play

Oil markets remained jittery on Wednesday, with Brent crude inching up 0.3% to $87.91 a barrel and U.S. West Texas Intermediate (WTI) climbing 0.2% to $86.14 a barrel. The modest gains come in the wake of military tensions in the Middle East, stoking fears of potential supply disruptions. Despite the geopolitical ruckus, markets saw a pullback on Tuesday after a significant surge on Monday.

Middle East Conflict and Oil Supply

The ongoing conflict between Israel and Palestine has traders on edge, though Israel itself is not a significant crude oil producer. The concern lies in the escalation of conflict that could affect Middle East supply, exacerbating an already expected deficit for the year. U.S. officials have implicated Iran in the Hamas attacks, adding another layer of uncertainty, although concrete evidence remains elusive.

Trading Derivatives carries a high level of risk to your capital and you should only trade with money you can afford to lose. Trading Derivatives may not be suitable for all investors, so please ensure that you fully understand the risks involved, and seek independent advice if necessary. A Product Disclosure Statement (PDS) can be obtained either from this website or on request from our offices and should be considered before entering into a transaction with us. Raw Spread accounts offer spreads from 0.0 pips with a commission charge of USD $3.50 per 100k traded. Standard account offer spreads from 1 pips with no additional commission charges. Spreads on CFD indices start at 0.4 points. The information on this site is not directed at residents in any country or jurisdiction where such distribution or use would be contrary to local law or regulation.

The Dollar and Federal Reserve

The dollar weakened against a basket of currencies, providing additional tailwinds to oil prices. With the Federal Reserve’s September policy meeting minutes on the horizon, investors are awaiting signals. So far, Fed officials have indicated no immediate need for further rate hikes, which could keep the dollar soft and potentially bolster oil demand.

Signs of Easing Sanctions on Venezuela

On the supply front, Venezuela and the U.S. are in talks that may lead to some easing of sanctions, allowing more Venezuelan crude into the market. While this development could offset some supply concerns, traders remain focused on the Middle East as the primary driver of volatility.

Short-term Outlook: Bullish

Given the recent geopolitical risks and a softer dollar, the oil market appears bullish in the short-term. However, the situation is fluid, with Venezuela-U.S. talks and Federal Reserve policy also in the mix. Traders should keep an eye on Brent crude, which is expected to stabilize between $90-$100/bbl in Q4 2023, but could breach the higher end if Middle East tensions escalate.

In summary, the oil market remains a battlefield of geopolitical risks, potential supply changes, and economic policy shifts. Navigating this complex terrain will require traders to remain vigilant and agile.

Technical Analysis

Daily Light Crude Oil FuturesWith the current daily price of light crude oil futures at $86.24, the market is trading above its 200-Day moving average of $77.67 but slightly above its 50-Day moving average of $85.19. This indicates a bullish short-term trend yet tempered by longer-term considerations.

Main and minor support levels stand at $82.68 and $88.21 respectively, while resistance is at $92.49 and $97.67. The market is currently more proximate to support levels, suggesting it’s in a cautious bullish phase.

Today’s focus is on moving averages and support/resistance levels. Overall, the sentiment leans bullish but warrants vigilance because of the recent steep sell-off from the $95.03 top on September 23.

DAX Index: US Inflation, the Fed and the Middle East Conflict in Focus

DAX Index: US Inflation, the Fed and the Middle East Conflict in Focus

DAX Tuesday Overview

On Tuesday, the DAX rallied by 1.95%. Reversing a 0.67% loss from Monday, the DAX ended the day at 15,424.

The Perfect Storm

News of China intending to increase its budget deficit to boost economic activity fueled demand for DAX-listed stocks. Dovish Fed commentary speeches resonated during the European session, contributing to the positive sentiment.

Trading Derivatives carries a high level of risk to your capital and you should only trade with money you can afford to lose. Trading Derivatives may not be suitable for all investors, so please ensure that you fully understand the risks involved, and seek independent advice if necessary. A Product Disclosure Statement (PDS) can be obtained either from this website or on request from our offices and should be considered before entering into a transaction with us. Raw Spread accounts offer spreads from 0.0 pips with a commission charge of USD $3.50 per 100k traded. Standard account offer spreads from 1 pips with no additional commission charges. Spreads on CFD indices start at 0.4 points. The information on this site is not directed at residents in any country or jurisdiction where such distribution or use would be contrary to local law or regulation.

Investors brushed aside the IFM Global Economic Outlook Report despite the IMF downwardly revising euro area growth forecasts. Hopes of an end to the synchronized monetary policy tightening by central banks acted as a tailwind.

On Tuesday, FOMC members voiced further support for pausing interest rate hikes. FOMC members Raphael Bostic and Neel Kashkari soothed investor jitters over a more aggressive Fed rate path.

The US equity markets responded to an IMF upward revision to US growth forecasts and the dovish Fed comments. On Tuesday, the S&P 500 and the Dow rose by 0.52% and 0.40%, respectively. The Nasdaq Composite Index gained 0.58%.

The Tuesday Market Movers

Auto stocks found much-needed support on China stimulus hopes. BMW rallied 3.03%, with Continental and Volkswagen ending the day with gains of 2.34% and 2.27%. Porsche and Mercedes Benz Group rose by 1.83% and 1.81%, respectively.

However, Daimler Truck Holding bucked the trend, falling by 0.73%.

Adidas resumed the Monday rally, rising by 2.26% on expectations of an upward revision to profit forecasts.

Middle East Conflict, the IMF, and US Producer Prices

Commentary from the IMF/World Bank Meetings and news updates from the Middle East need monitoring throughout the Wednesday session. However, US producer price figures could spook investors before consumer inflation figures on Thursday. A larger-than-expected rise in producer prices may refuel Fed rate hike bets.

With inflation in the spotlight, FOMC member commentary also warrants consideration. FOMC members Raphael Bostic and Christopher Waller are on the economic calendar to speak before the Fed minutes. The Fed meeting minutes are out after the European closing bell.

Voting member Christopher Waller will likely have more impact on the markets. Comments relating to the US economy, the Middle East Conflict, and interest rates would influence market sentiment.

The DAX was down 24 points, while the NASDAQ mini was up 27 points this morning.

Short-Term Forecast

China stimulus news, an end to monetary policy tightening cycles, and easing risks of a long-lasting Middle East conflict will likely support further gains. However, US inflation figures and escalation in the Middle East conflict could adversely affect market risk sentiment.

DAX Technical Indicators

Daily Chart

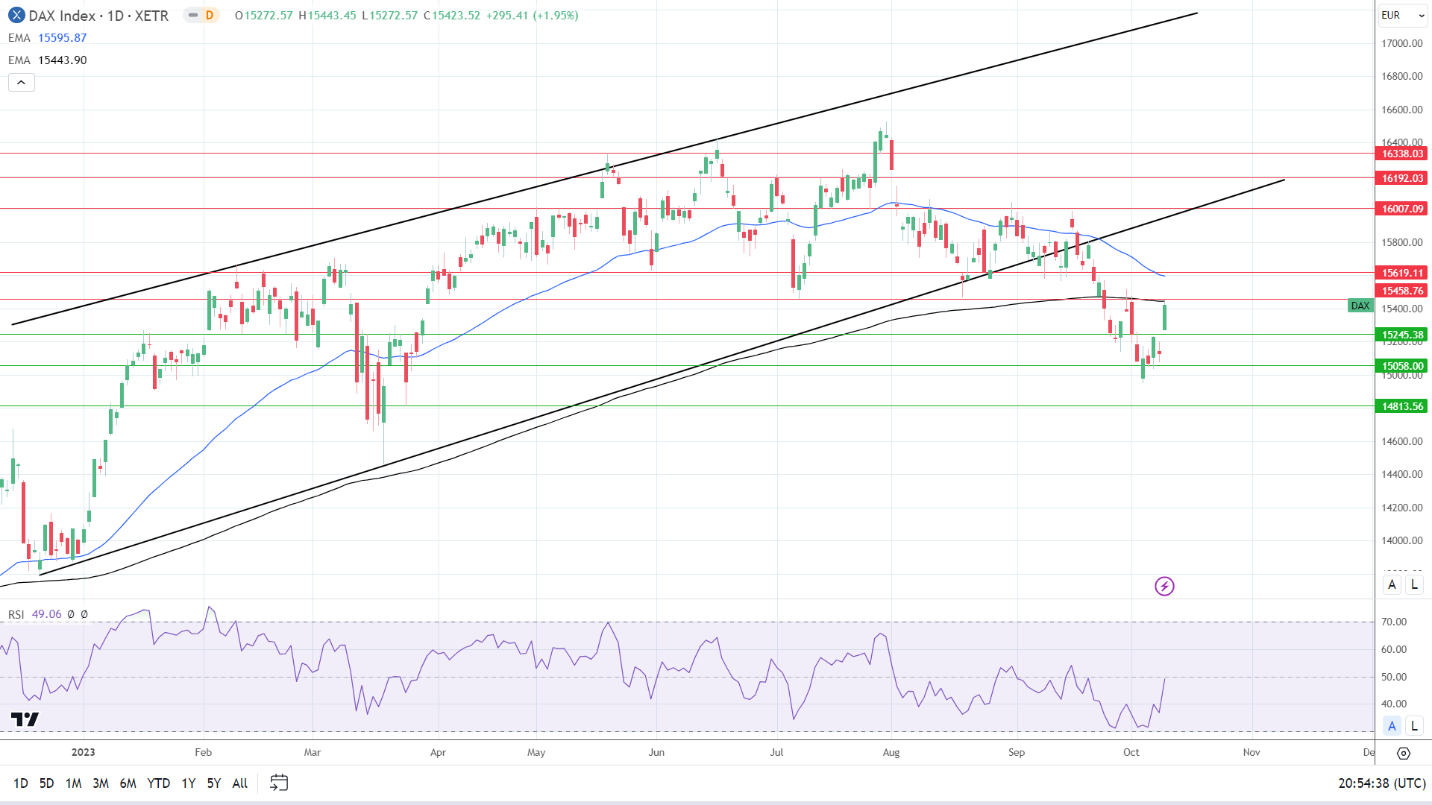
The DAX remained below the 50-day and the 200-day EMAs, sending bearish price signals.

A break above the 200-day EMA and the 15,459 resistance level would support a move toward the 50-day EMA and the 15,619 resistance level. However, selling pressure will likely intensify at the 15,459 resistance level. The 200-day EMA is confluent with the resistance level.

Near-term trends will likely hinge on Fed and ECB forward guidance, news updates from the Middle East, and US inflation figures.

Failure to break above the 200-day EMA would leave the 15,245 support level in play.

The 14-day RSI reading of 49.06 indicates that the DAX could fall through the 15,058 support level before reaching the oversold territory.

DAX Daily Chart sends bearish price signals.
DAX 111023 Daily Chart

4-Hourly Chart

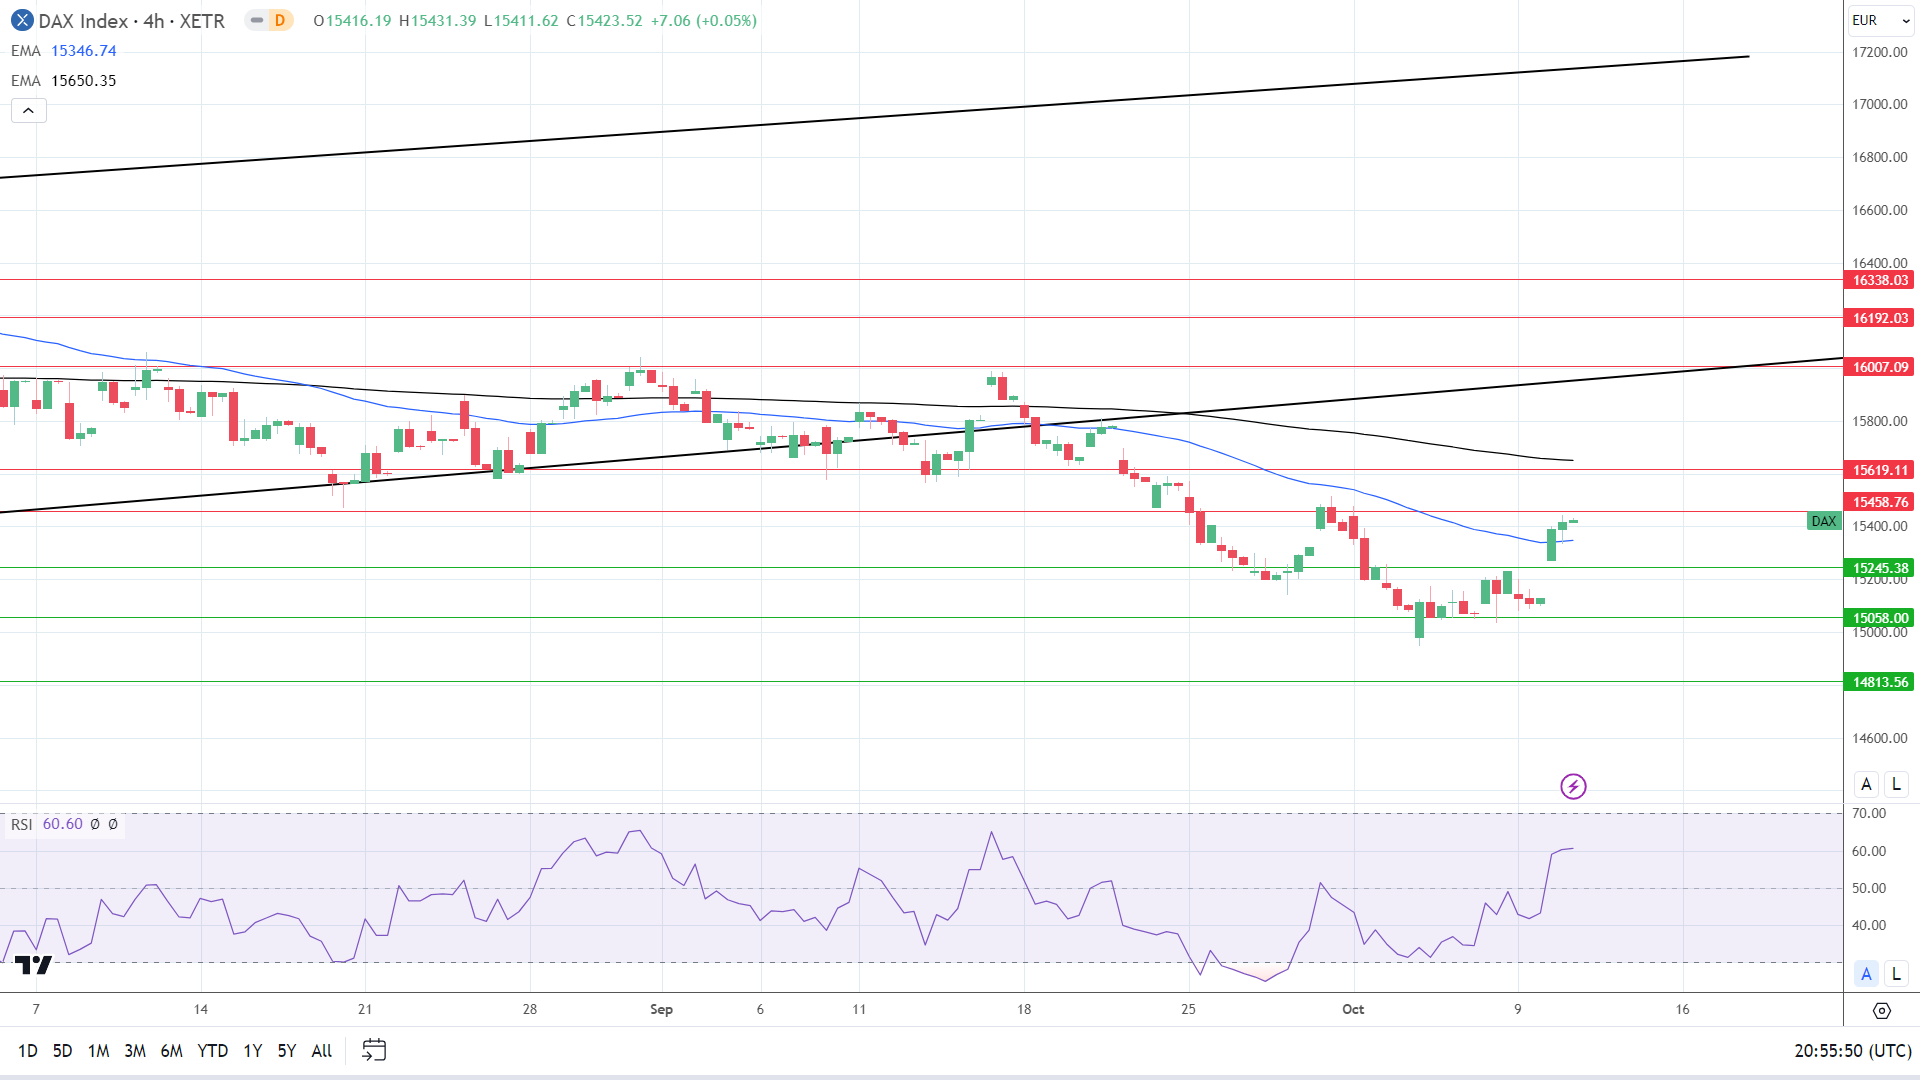
The DAX hovers above the 50-day EMA while remaining below the 200-day EMA, sending bullish near-term but bearish longer-term price signals. A DAX break above the 15,459 resistance level would support a move to the 15,619 resistance level and 200-day EMA.

However, a drop below the 50-day EMA would support a break below the 15,245 support level to bring the 15,058 support level into view.

The 60.60 14-4 hour RSI reading supports a DAX break above the 15,459 resistance level before entering the overbought territory.

4-Hourly Chart sends bullish near-term price signals.
DAX 111023 4-Hourly Chart
USD/JPY Forecast: Anticipating Yen Moves Amid US Producer Prices Update

USD/JPY Forecast: Anticipating Yen Moves Amid US Producer Prices Update

Tuesday Overview of USD/JPY Movements

On Tuesday, the USD/JPY gained 0.14%. Partially reversing a 0.49% loss from Monday, the USD/JPY ended the day at 148.709. The USD/JPY fell to a low of 148.161 before reaching a high of 149.097.

Bank of Japan Tankan Survey and the Middle East in Focus

The Reuters Tankan Index survey garnered investor interest this morning. In October, the Reuters Tankan Index held steady at 4 vs. a forecast of 2.

Trading Derivatives carries a high level of risk to your capital and you should only trade with money you can afford to lose. Trading Derivatives may not be suitable for all investors, so please ensure that you fully understand the risks involved, and seek independent advice if necessary. A Product Disclosure Statement (PDS) can be obtained either from this website or on request from our offices and should be considered before entering into a transaction with us. Raw Spread accounts offer spreads from 0.0 pips with a commission charge of USD $3.50 per 100k traded. Standard account offer spreads from 1 pips with no additional commission charges. Spreads on CFD indices start at 0.4 points. The information on this site is not directed at residents in any country or jurisdiction where such distribution or use would be contrary to local law or regulation.

The Reuters Tankan survey canvasses 200 manufacturers and 200 non-manufacturers, offering the Bank of Japan (BoJ) pre-quarterly Tankan survey signals. Weak numbers may force the BoJ to maintain negative rates.

While the survey-based figures will draw interest, geopolitical tensions in the Middle East remain a focal point. An escalation in the Middle East conflict will likely fuel demand for the Japanese Yen.

However, BoJ board member commentary also warrants consideration. Monetary policy intentions in the wake of the IMF forecasts will influence the appetite for the Yen.

US Producer Prices, the Fed Minutes, and Fed Speakers in the Spotlight

US inflation is in the spotlight again this week. A larger-than-expected increase in producer prices could reignite bets on a Fed rate hike. Economists forecast core producer prices to increase 2.3% year-over-year in September, up from 2.2% in August.

Producer prices filter through to consumer prices. The tight US labor market continues to fuel consumption and demand-driven inflationary pressures. High demand pushes producer prices higher, forcing the Fed to take a more aggressive interest rate trajectory to curb demand.

Higher interest rates raise borrowing rates and force firms to cut costs. In uncertain labor market conditions, wage growth slows, causing consumers to curb spending on non-essential items, easing demand-driven inflationary pressures.

Beyond the numbers, FOMC member speeches and the FOMC meeting minutes also need consideration. FOMC members Raphael Bostic and Christopher Waller are on the economic calendar to speak.

Short-term Forecast

The USD/JPY sits in the hands of central bank commentary, US inflation numbers, and news updates from the Middle East. A spike in US producer prices would reflect a pickup in demand, which may force the Fed to rethink plans to pause interest rate hikes.

USD/JPY Price Action

Daily Chart

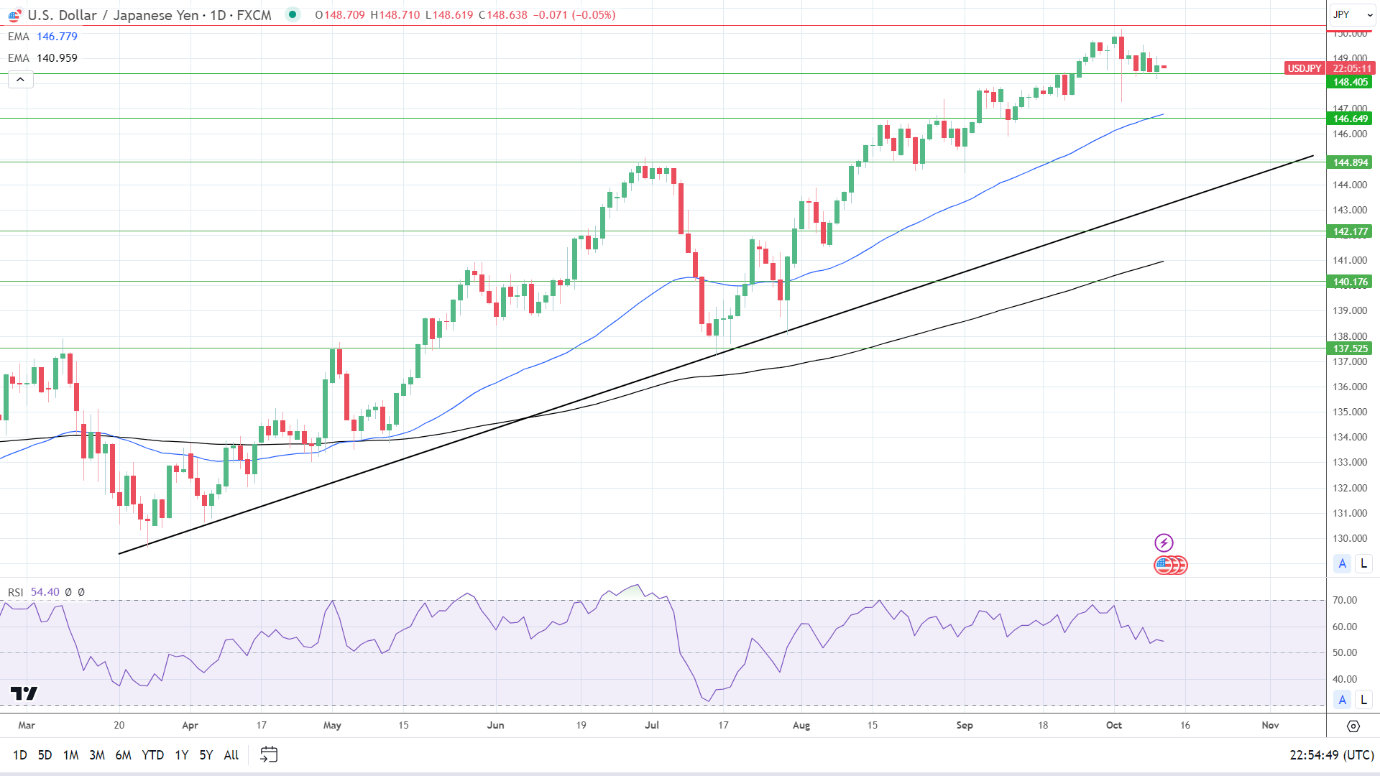
The USD/JPY sat above the 50-day and 200-day EMAs, affirming bullish price signals. A break below the 148.405 support level would support a move toward the 50-day EMA and 146.649 support level.

An escalation in the Middle East conflict and dovish Fed commentary would drive demand for the Yen.

However, hotter-than-expected US producer prices and the easing threat of a prolonged Middle East conflict would drive buyer demand for the USD/JPY.

A USD/JPY return to 149 would give the bulls a run at the 150.293 resistance level.

The 14-day RSI at 54.40 supports a USD/JPY move to the 150.293 resistance level before entering overbought territory.

USD/JPY Daily Chart sends bullish price signals.
USDJPY 111023 Daily Chart

4-Hourly Chart

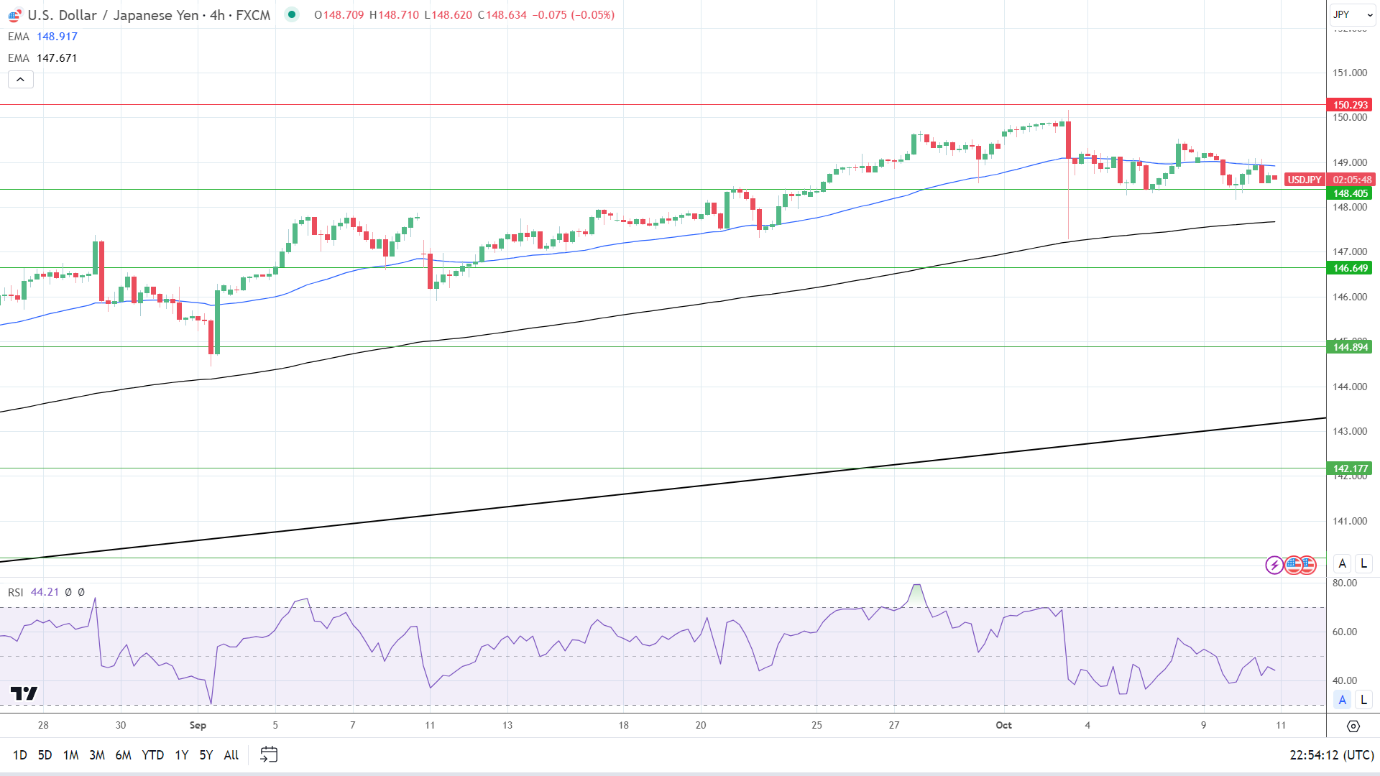
The USD/JPY remains below the 50-day EMA while sitting above the 200-day EMA, sending bearish near-term but bullish longer-term price signals. A break below the 148.405 support level would would bring the 200-day EMA into play.

However, a move through the 50-day EMA would support a move to the 150.293 resistance level.

The 44.21 14-4 Hourly RSI indicates a USD/JPY decline to the 200-day EMA before entering oversold territory.

4-Hourly Chart sends bearish near-term price signals.
USDJPY 111023 4-Hourly Chart