Silver Prices Forecast: Fed Policy Confusion, Middle East Tensions Set the Tone

Silver Prices Forecast: Fed Policy Confusion, Middle East Tensions Set the Tone

Silver Finds Balance Amid Policy and Geopolitical Turbulence

On Wednesday, spot silver (XAG/USD) is holding its ground at $21.88 per ounce. This balance is influenced by contrasting winds: dovish undertones from Federal Reserve officials have weakened the dollar, while geopolitical tensions involving Israel and Hamas are driving investors toward safe-haven assets like silver.

Rate Hike Speculation Wanes

The Federal Reserve has been at the forefront of discussions concerning interest rate hikes for months. However, recent comments from Fed officials are sparking a debate on the necessity and timing of further hikes. Minneapolis Fed President Neel Kashkari and Atlanta Fed President Raphael Bostic have cast doubts on the urgency for additional hikes.

Trading Derivatives carries a high level of risk to your capital and you should only trade with money you can afford to lose. Trading Derivatives may not be suitable for all investors, so please ensure that you fully understand the risks involved, and seek independent advice if necessary. A Product Disclosure Statement (PDS) can be obtained either from this website or on request from our offices and should be considered before entering into a transaction with us. Raw Spread accounts offer spreads from 0.0 pips with a commission charge of USD $3.50 per 100k traded. Standard account offer spreads from 1 pips with no additional commission charges. Spreads on CFD indices start at 0.4 points. The information on this site is not directed at residents in any country or jurisdiction where such distribution or use would be contrary to local law or regulation.

This dovish outlook is not isolated; it seems to be a growing sentiment among other top Fed officials as well. These statements have resulted in a weaker dollar, indirectly boosting the appeal of silver for investors.

Macro Factors: Inflation and Safe Havens

Inflation, a significant concern earlier this year, is showing signs of retreating. San Francisco Fed President Mary Daly has indicated that inflation levels are gradually pulling back. This lessening inflationary pressure reduces the opportunity cost of holding silver, an asset that doesn’t yield interest.

On another front, geopolitical tensions emanating from the Middle East, particularly the Israel-Hamas conflict, have spurred demand for safe-haven investments. In times of uncertainty, assets like silver often become the go-to choice for investors looking to hedge against volatility.

Economic Indicators and Sentiment

In the short term, speculators are keenly eyeing the release of the Fed’s September meeting minutes, due to be released at 18:00 GMT, and the U.S. Consumer Prices Index (CPI) data on Thursday.

Both are pivotal for gauging the economic landscape and, by extension, the Fed’s next move. A higher-than-expected CPI could reignite talks of tighter monetary policy, which would undoubtedly put pressure on silver prices.

Short-Term Outlook: Data Dependent

Considering the various influencing factors, the short-term trajectory for silver is notably mixed. While geopolitical tensions provide a supportive backdrop, the metal’s future moves will be heavily dictated by the upcoming U.S. economic indicators and the Federal Reserve’s policy direction. Thus, the immediate outlook for silver remains delicately balanced between these contrasting market forces.

Technical Analysis
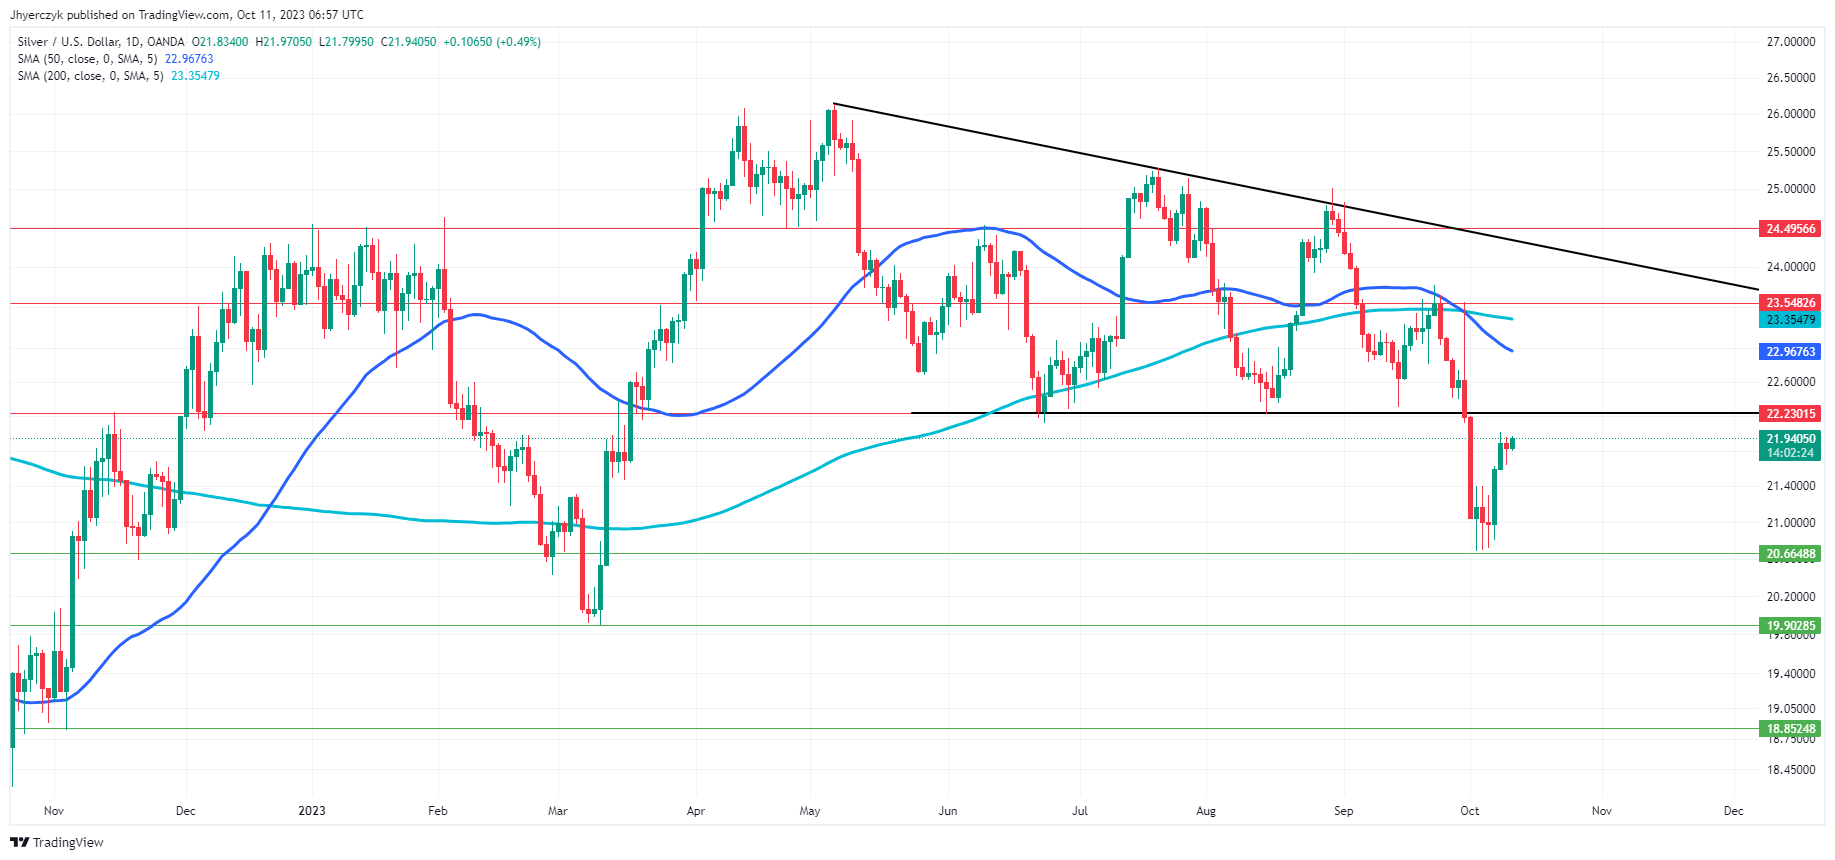
Daily Silver (XAG/USD)In the silver (XAG/USD) market, the current price of $21.93 is nearing the trend line support at $22.23, which also coincides with the minor resistance level. A break above this dual threshold would typically indicate a bullish reversal, especially significant given that the commodity is rallying from a lower position.

The current price is also not far below the 50-Day moving average of $22.97, adding another layer of potential bullish momentum if surpassed. Considering all these factors, the market sentiment appears to be on the cusp of shifting from bearish to bullish, contingent on breaking and sustaining above these key levels.

Gold Prices Forecast: US CPI, Fed Minutes to Dictate XAU/USD Future Value

Gold Prices Forecast: US CPI, Fed Minutes to Dictate XAU/USD Future Value

Gold Prices Pause Amid Rate Hike Debate

Gold (XAU/USD) prices showed resilience as the dollar weakened following comments by Federal Reserve officials that a surge in Treasury yields may reduce the need for further rate hikes. Spot gold hovered at $1,860.29 per ounce, close to its highest level since late September, while U.S. gold futures remained steady at $1,873.90.

Fed’s Rate Hike Questioned

Several top Fed officials have started questioning the speed and necessity of future interest rate hikes. Minneapolis Fed President Neel Kashkari suggested that the rise in long-term Treasury yields could make additional hikes less urgent. Meanwhile, Atlanta Fed President Raphael Bostic sees no more rate hikes on the horizon. This dovish outlook has pushed the dollar to a near two-week low against other major currencies.

Trading Derivatives carries a high level of risk to your capital and you should only trade with money you can afford to lose. Trading Derivatives may not be suitable for all investors, so please ensure that you fully understand the risks involved, and seek independent advice if necessary. A Product Disclosure Statement (PDS) can be obtained either from this website or on request from our offices and should be considered before entering into a transaction with us. Raw Spread accounts offer spreads from 0.0 pips with a commission charge of USD $3.50 per 100k traded. Standard account offer spreads from 1 pips with no additional commission charges. Spreads on CFD indices start at 0.4 points. The information on this site is not directed at residents in any country or jurisdiction where such distribution or use would be contrary to local law or regulation.

Inflation and Opportunity Costs

The debate over interest rates comes at a time when U.S. inflation has receded from its peak, according to San Francisco Fed President Mary Daly. Higher interest rates generally make gold, which yields no interest, less attractive to investors. But as rate hike expectations diminish, the opportunity cost of holding gold decreases.

Market Watch: Upcoming Data and Mid-East Tensions

Investors are eyeing two major releases this week for cues: the Fed’s September meeting minutes and the U.S. Consumer Prices Index (CPI). A higher-than-expected CPI could again raise prospects of tighter monetary policy, potentially pressuring gold prices. Meanwhile, ongoing conflicts in the Middle East continue to act as a tailwind for the safe-haven asset.

Short-term Outlook: Mixed

In the short term, gold’s trajectory appears mixed. Despite safe-haven buying amid geopolitical tensions, the metal’s next major move will likely be dictated by upcoming U.S. economic data and Fed policy. If the Fed signals a more hawkish stance, it could cap gold’s gains, making the short-term outlook uncertain at best.

Technical Analysis

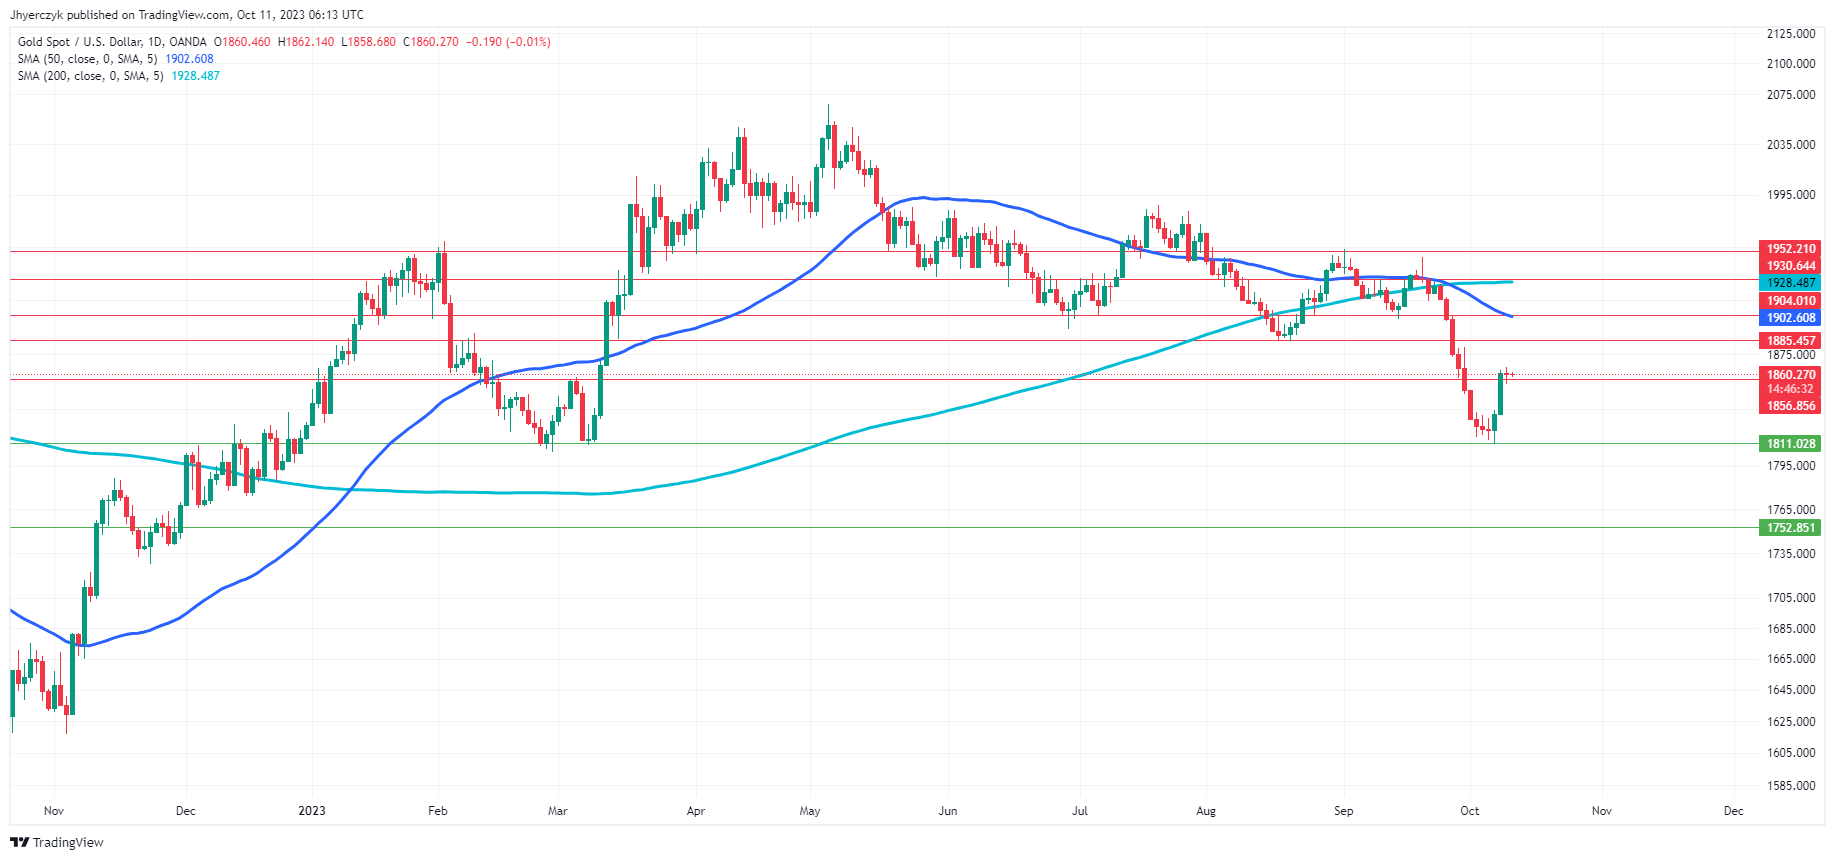
Daily Gold (XAU/USD)Gold (XAU/USD) is currently trading at $1860.31, positioned below both the 200-Day and 50-Day moving averages, at $1928.49 and $1902.61 respectively, indicating a bearish undertone.

Despite this, the asset is trading above its main and minor support levels of $1752.85 and $1811.03. Resistance levels loom at $1856.86 and $1885.46.

Overall, the market sentiment leans bearish due to the price’s position relative to the key moving averages. However, momentum may begin to shift to the upside if buyers can overcome the minor resistance at $1856.86.

EUR/USD Forecast: ECB vs. Fed – Balancing Inflation, Growth, and Geopolitical Risks

EUR/USD Forecast: ECB vs. Fed – Balancing Inflation, Growth, and Geopolitical Risks

Tuesday Overview

On Tuesday, the EUR/USD gained 0.37%. Reversing a 0.17% loss from Monday, the EUR/USD ended the day at $1.06051. The EUR/USD fell to a low of $1.05543 before reaching a high of $1.06197.

German Inflation and IMF/World Bank Meetings in Focus

Finalized German inflation figures for September drew investor interest on Wednesday. The German annual inflation rate softened from 6.1% to 4.5% vs. a prelim 4.5%.

Trading Derivatives carries a high level of risk to your capital and you should only trade with money you can afford to lose. Trading Derivatives may not be suitable for all investors, so please ensure that you fully understand the risks involved, and seek independent advice if necessary. A Product Disclosure Statement (PDS) can be obtained either from this website or on request from our offices and should be considered before entering into a transaction with us. Raw Spread accounts offer spreads from 0.0 pips with a commission charge of USD $3.50 per 100k traded. Standard account offer spreads from 1 pips with no additional commission charges. Spreads on CFD indices start at 0.4 points. The information on this site is not directed at residents in any country or jurisdiction where such distribution or use would be contrary to local law or regulation.


The softer inflation figures supported ECB plans to leave interest rates unchanged. However, inflation remains elevated relative to target, forcing the ECB to keep rates higher for longer at the expense of the euro area economy.

Higher interest rates increase borrowing costs, leading firms to reduce staff and wages. Reduced disposable income can make consumers limit non-essential spending, affecting the euro area economy. With private consumption making up over 50% of the Eurozone GDP and the services sector over 70%, a decrease in spending impacts the economy significantly.

On Tuesday, the IMF downwardly revised growth forecasts for China and the Eurozone.

A weaker Eurozone economic outlook, elevated inflation, and higher for longer ECB interest rates will likely further impact the economy. The trajectory looks precarious for the EUR/USD, with the Middle East conflict another consideration for investors.

ECB President Lagarde is on the ECB calendar to speak on Wednesday. Comments relating to the IMF forecasts and interest rates will influence the EUR/USD.

The ECB Consumer Expectations Survey is also crucial. It could raise recession concerns if consumer expectations decline regarding income, labor, and the economy. A significant drop in consumer sentiment may offset the impact of dovish Fed remarks on the EUR/USD.

Producer Prices and Fed Commentary in the Spotlight

US producer prices will capture investor attention on Wednesday. A significant increase might challenge beliefs about the Fed pausing rate hikes. Higher producer prices affect consumer prices. A tight labor market boosts consumer spending, leading to demand-driven inflation. This report comes before the crucial US CPI Report.

With inflation in the spotlight again, FOMC member commentary also warrants consideration. FOMC members Christopher Waller and Raphael Bostic will speak before the Fed releases the FOMC meeting minutes.

The IMF upwardly revised the US growth forecast for 2023. A pickup in inflationary pressures could reignite bets on a Fed rate hike.

Short-Term Forecast:

US inflation numbers, the IMF economic forecasts, and uncertainty about the Middle East conflict may return the EUR/USD to sub-$1.05. Near-term direction likely hinges on forward guidance and geopolitics.

EUR/USD Price Action

Daily Chart

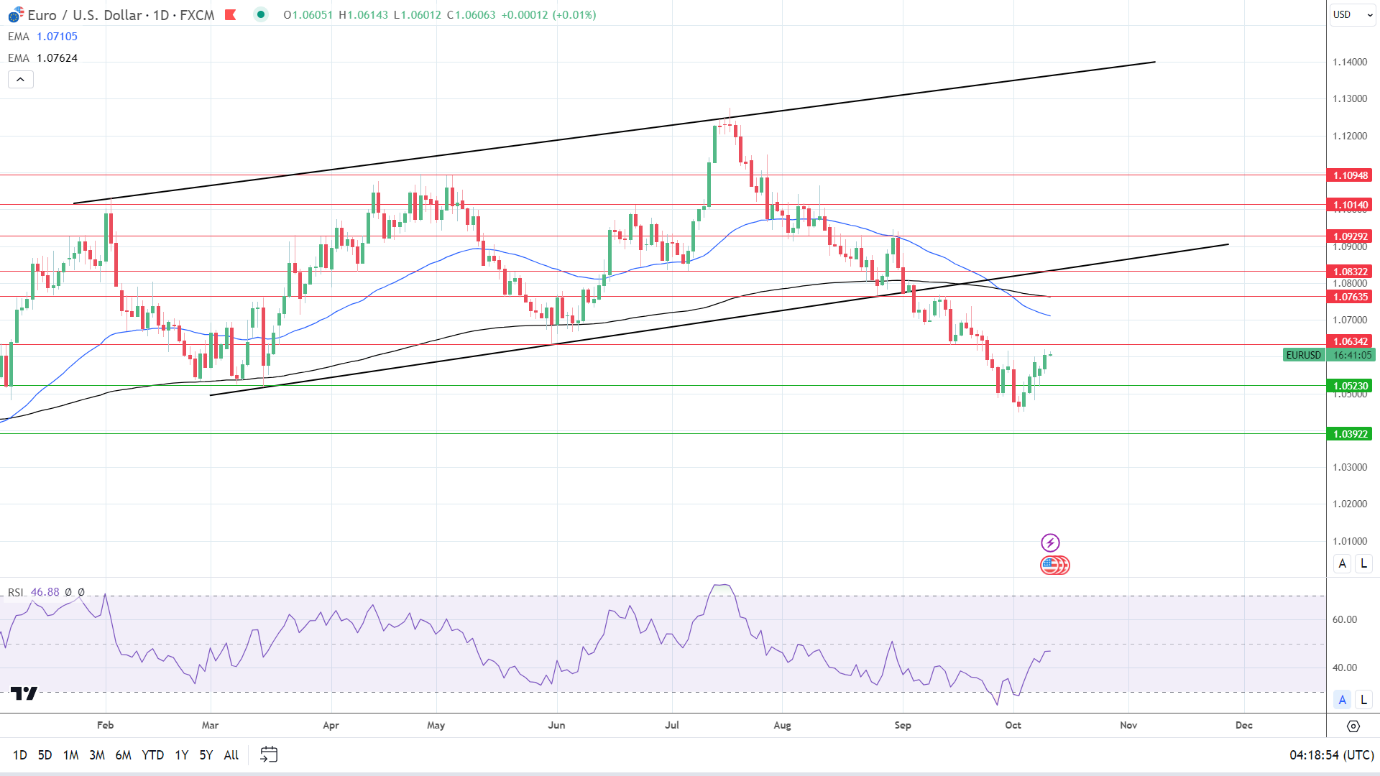
The EUR/USD sat below the 50-day and 200-day EMAs, affirming bearish price signals.

A EUR/USD break above the $1.06342 resistance level would support a move toward the 50-day EMA.

Central bank commentary, news updates from the Middle East, and US producer prices will be pre-Fed minutes focal points.

Hawkish Fed commentary and a larger-than-expected rise in consumer prices may bring the $1.05230 support level into play. A break below the support level would give the bears a run at $1.05.

The 14-period Daily RSI, standing at 46.88, suggests that the EUR/USD could fall through the $1.05230 support level before entering oversold territory.

EUR/USD Daily Chart sends bearish price signals.

EURUSD 111023 Daily Chart

4-Hour Chart

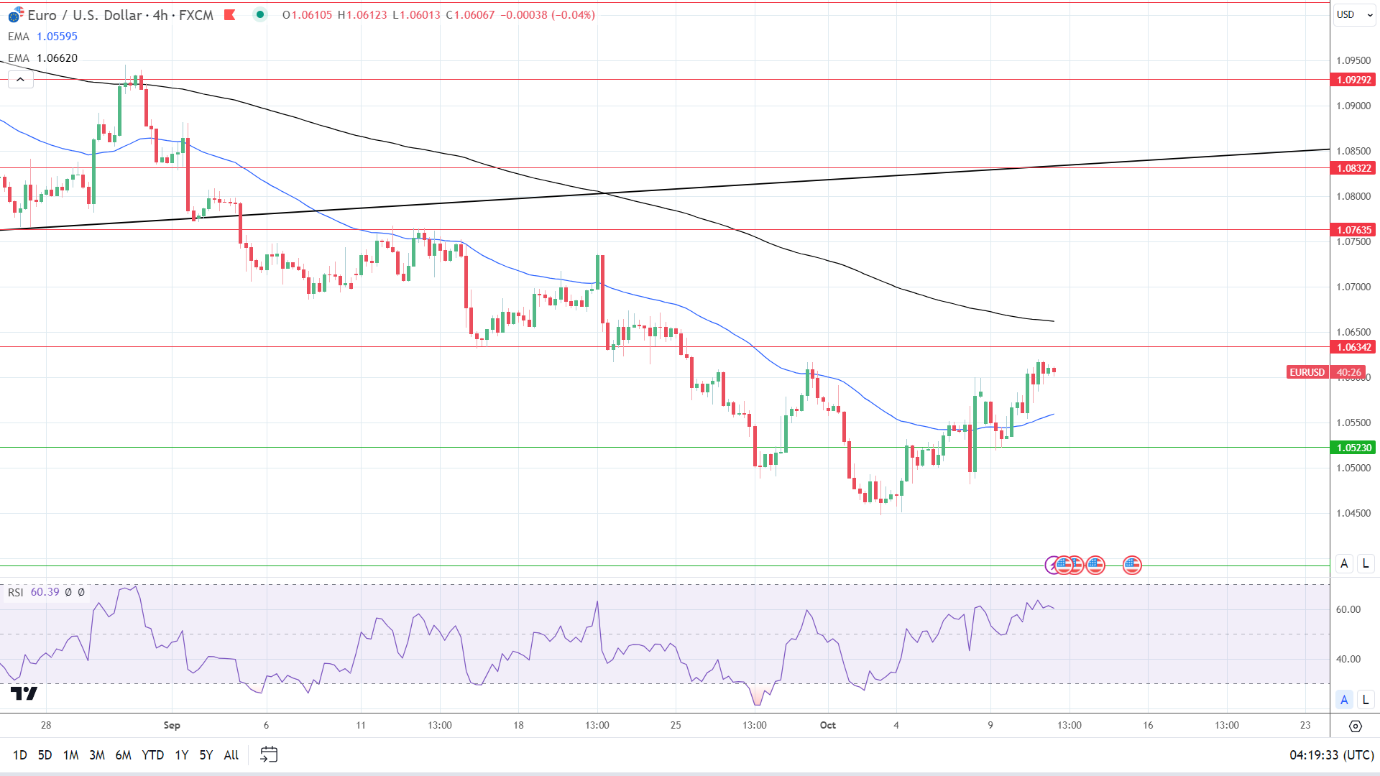
The EUR/USD hovers above the 50-day EMA while remaining below the 200-day EMA, sending bullish short-term but bearish longer-term price signals. A EUR/USD break above the $1.06342 resistance level would support a move to the 200-day EMA.

However, a fall through the 50-day EMA would bring the $1.05230 support level into play.

The 14-period RSI on the 4-hour chart, 60.39, indicates that the EUR/USD could break above the $1.06342 resistance level before entering overbought territory.

4-Hourly Chart sends bullish near-term price signals.
EURUSD 111023 4 Hourly Chart
Gold Price Update: XAU/USD Remains Vulnerable to Retail Trader Positioning Bets

Gold Price Update: XAU/USD Remains Vulnerable to Retail Trader Positioning Bets

At +1.5%, gold prices are so far on course for the best week since the middle of July. Yet, despite recent gains, retail traders have not been increasing their downside exposure as one would usually expect. This can be seen by looking at IG Client Sentiment (IGCS), which usually functions as a contrarian indicator. In fact, as we are about to see, the outlook is seemingly not looking rosy.

Gold Sentiment Outlook – Bearish

The IGCS gauge shows that about 86% of retail traders are net-long gold. Since the vast majority are biased to the upside, this continues to hint that prices may fall down the road. Despite recent gains, upside exposure has increased by almost 8% compared to a week ago. This is as downside bets increased by 5.45% over the same period. The combination of overall positioning and recent changes continues to produce a bearish contrarian trading bias outlook.


XAU/USD Daily Chart

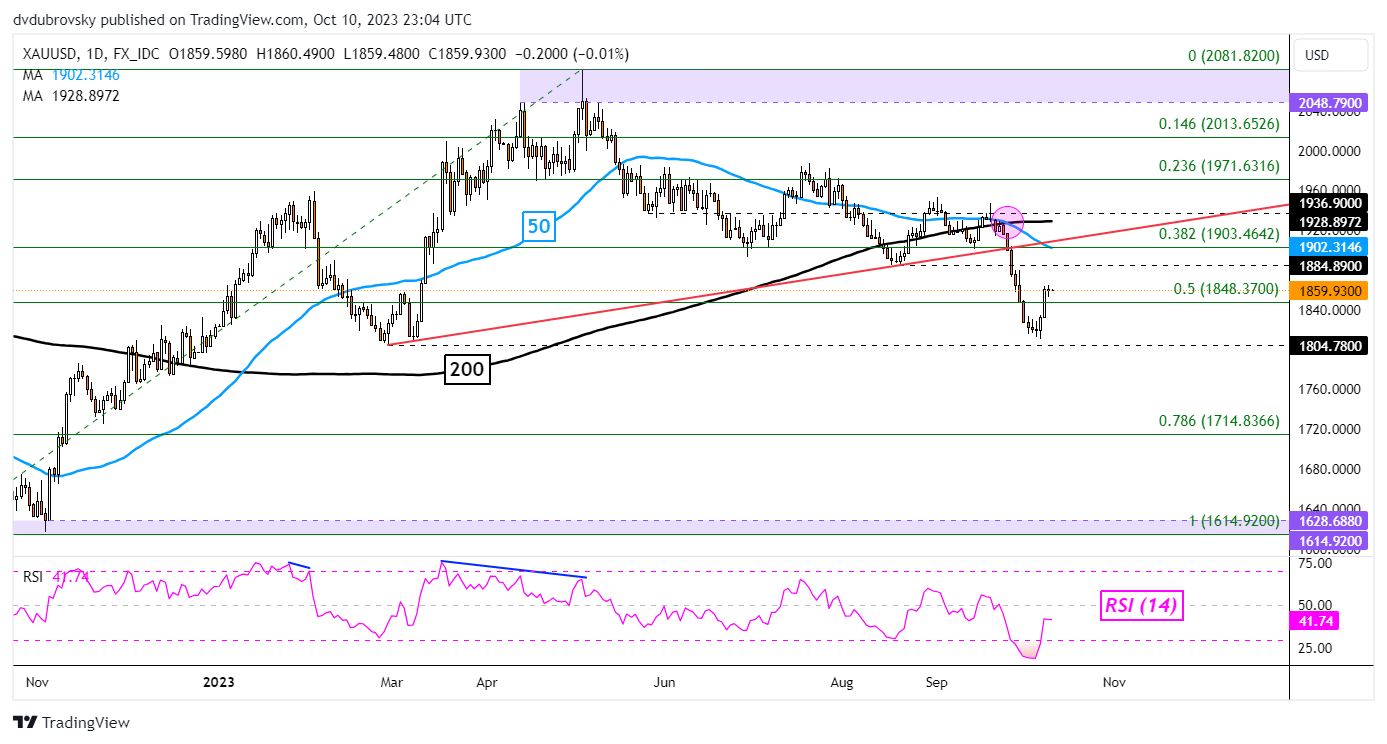
On the daily chart, gold has pushed back above the midpoint of the Fibonacci retracement level of 1848.37. Further upside confirmation has been lackluster. Further to the point, a bearish Death Cross emerged between the 200- and 50-day moving averages not long ago after prices broke under key rising support from February.

As such, the overall technical posture remains bearish biased for the yellow metal. Further upside progress is needed to overturn this outlook. Immediate resistance seems to be the 1884.89 inflection point, followed by the 50-day moving average. In the event of a turn lower, keep a close eye on the February low of 1804.78.

XAU/USD Daily Chart

Chart Created in Trading View

Euro Technical Outlook – Trend Versus Ranges for EUR/USD, EUR/JPY and EUR/CHF

Euro Technical Outlook – Trend Versus Ranges for EUR/USD, EUR/JPY and EUR/CHF

EUR/USD TECHNICAL ANALYSIS

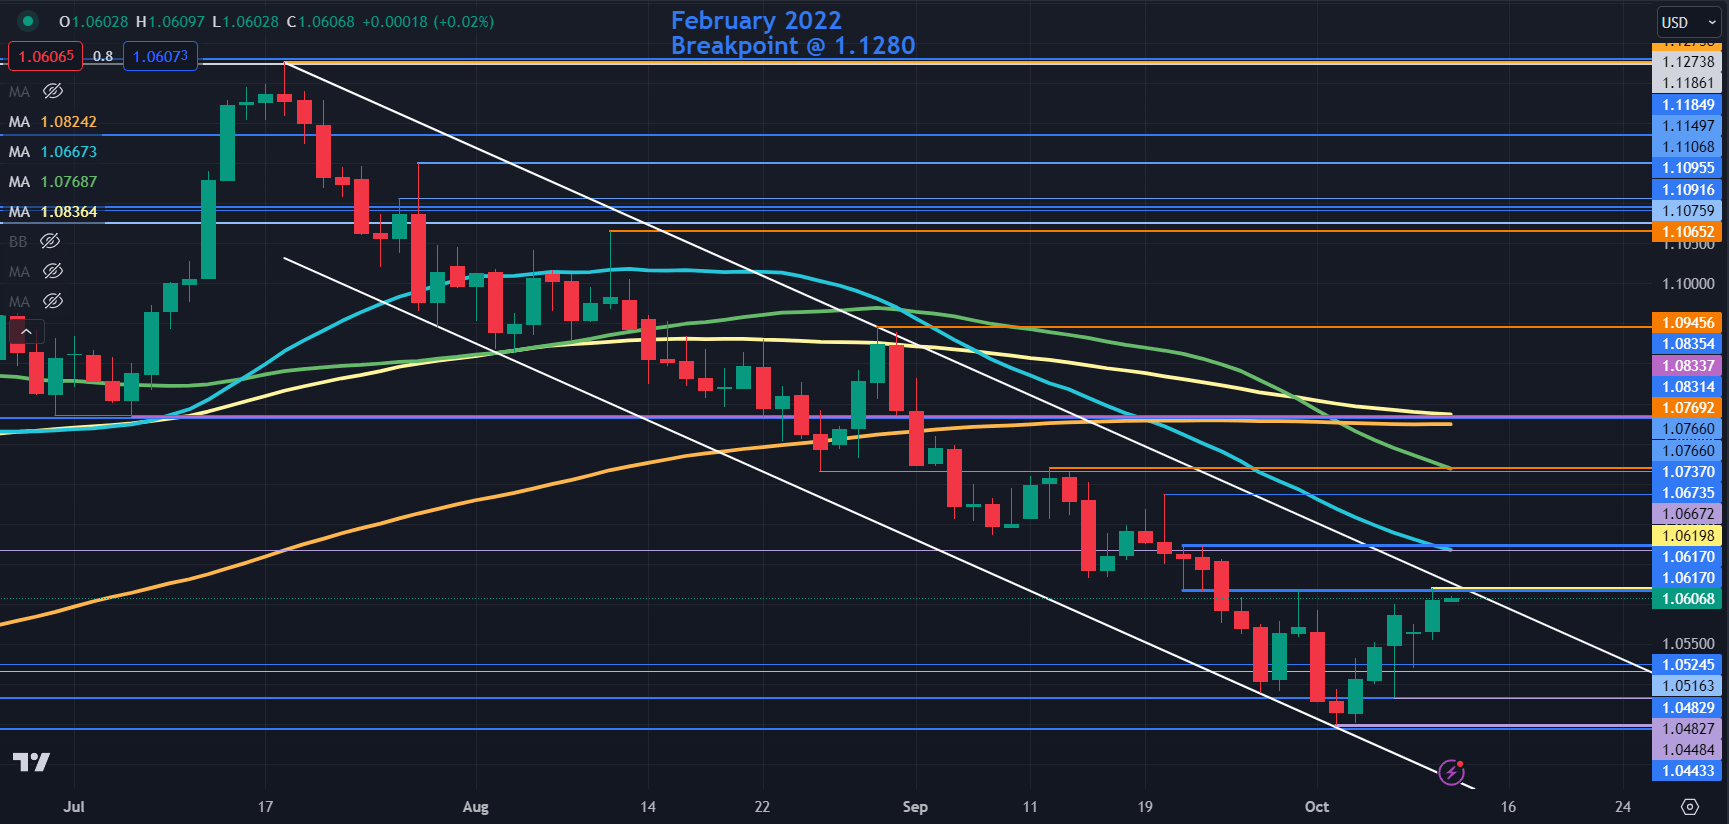
EUR/USD jumped higher again overnight as it continues to rally off the eleven-month low seen last week at 1.0448.

The peak seen overnight was unable to overcome a breakpoint and prior high near 1.0520 and it may continue to offer resistance ahead of a descending trend line.

Further up, resistance could be at another prior peak at 1.0673 which coincides with the 34-day simple moving average (SMA). Similarly, resistance might be near 1.0770 where there is a recent high and the 55-day SMA.

Above those levels, the 100- and 200-day SMAs may offer resistance near the breakpoint at 1.0830.

Despite the recent run-up, EUR/USD remains in a descending trend channel and with the price below these medium and longer-term SMAs, overall bearish momentum could be intact until these SMAs have been vanquished.

On the downside, support might lie near the breakpoints and lows of early 2023 that were tested recently with 1.0480 and 1.0440 as potential levels of note.

EUR/USD DAILY CHART

image1.png

Chart Created in TradingView

EUR/JPY TECHNICAL ANALYSIS

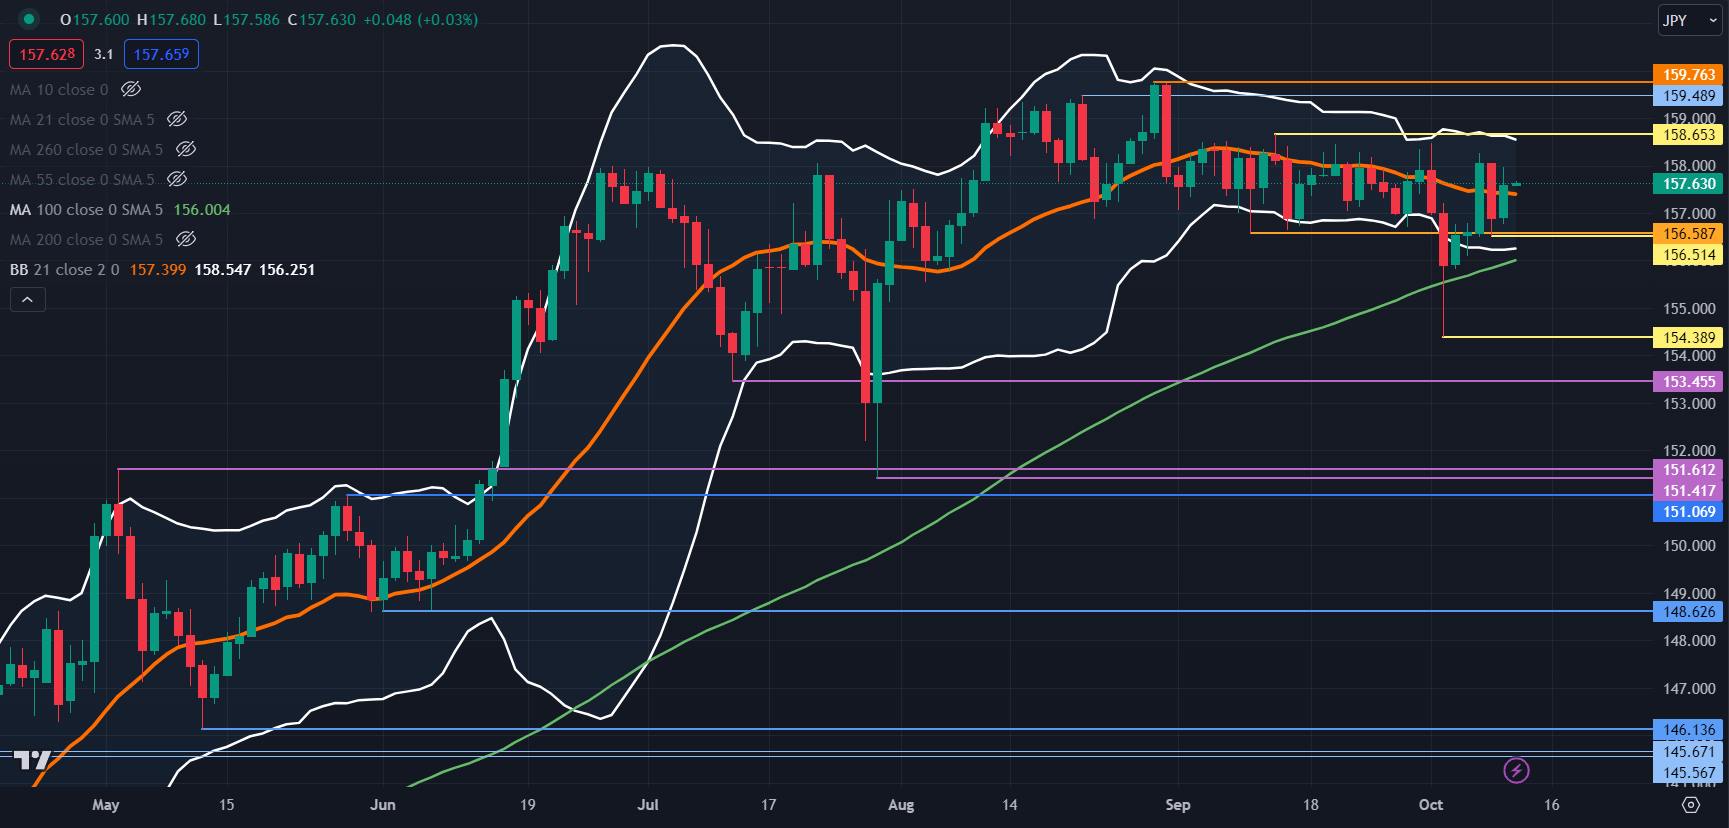
EUR/JPY appears to have rejected the move lower of last week when it traded down to a three-month low of 154.39.

That dip broke below the September low and the 55-day Simple Moving Average (SMA) before closing back above all of them in the proceeding sessions.

The sell-off also broke below the lower band of the 21-day simple moving average (SMA) based Bollinger Band. After closing back inside the band, a run higher ensued and the price has since consolidated back within the range.

A feature of Bollinger Bands is to easily identify the level of volatility in the market by the width of the bands.

The current relative narrowness of the bands and the rejection of the move lower might suggest that there is a lack of directional conviction for EUR/JPY for now.

This may provide opportunities for range trading strategies. To learn more about range trading, click on the banner below.

Support could be at the breakpoint and a recent low toward 156.50. On a sustained move lower, the levels to watch might be at the previous lows and breakpoints of 154.39, 153.45, 151.60, 151.40 and 151.07.

On the top side, the recent highs of 158.65 and 159.76 may offer resistance.

EUR/JPY DAILY CHART

image2.png

EUR/CHF TECHNICAL ANALYSIS

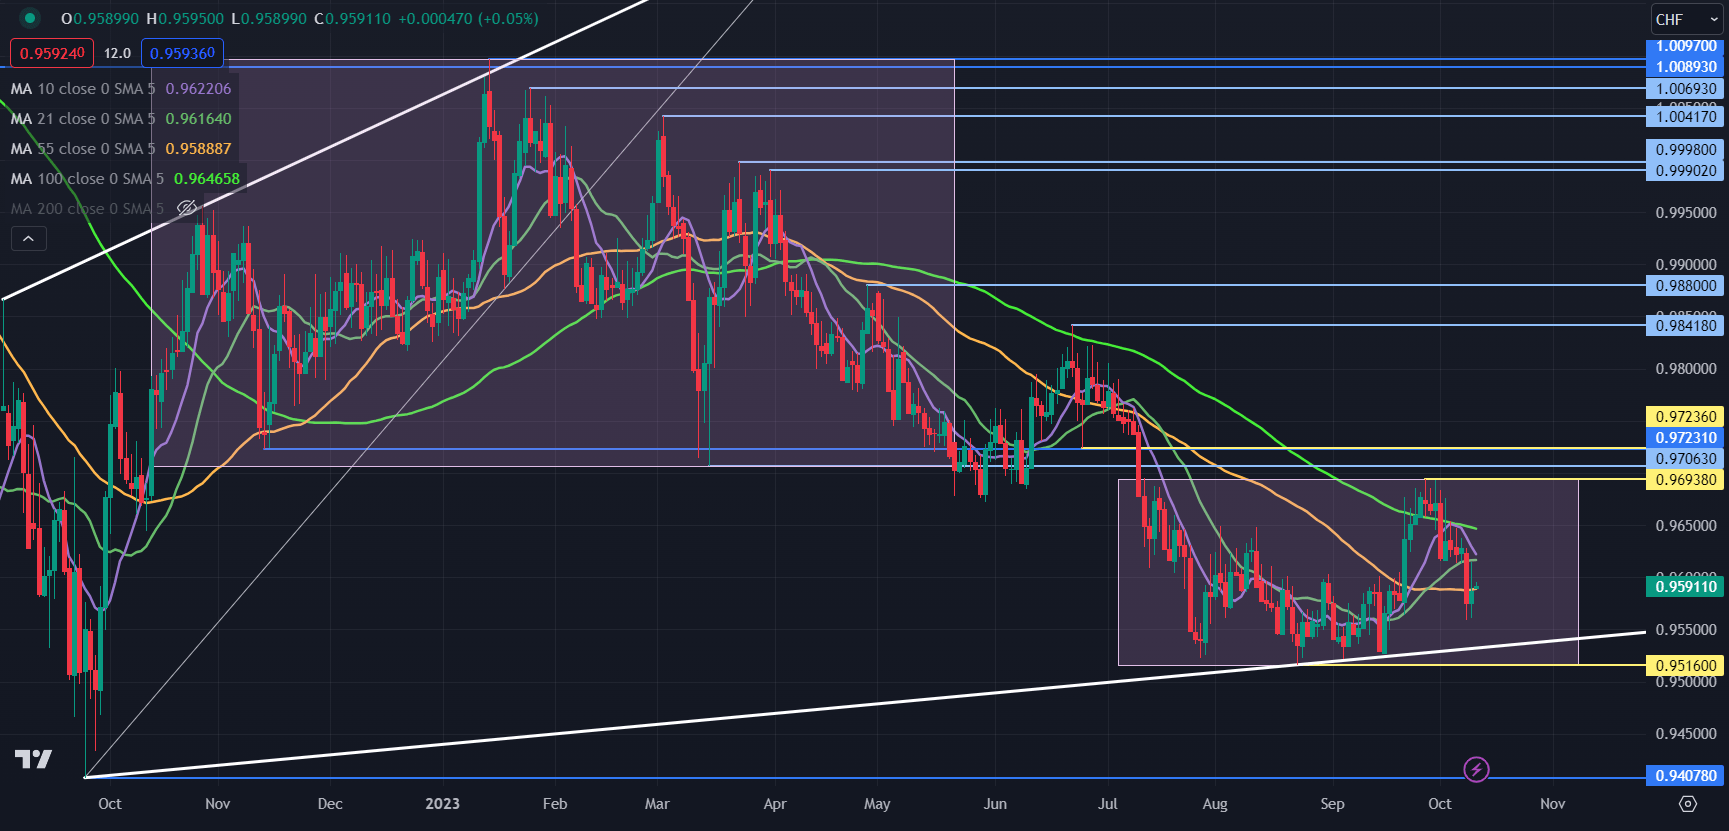
EUR/CHF has been contained and trading between 0.9500 and 0.9700 for 3 months in what appears to be a range trading environment. This seems to be a characteristic of EUR/CHF from time to time.

The 10-, 21-, 34-, 55- and 100-day SMAs are all grouped together within this range, which may confirm a lack of direction for EUR/CHF, not too dissimilar to EUR/JPY above.

If either side of that range is penetrated, a breakout trade opportunity may evolve. To learn more about breakout trading, click on the banner below.

Support might be at an ascending trendline, currently near 0.9535 ahead of the previous lows at 0.9516 and 0.9408.

On the upside, resistance could be at the 100-day SMA which is currently near 0.9650, ahead of the prior peak and breakpoints at 0.9694, 0.9706 and 0.9723.

EUR/CHF DAILY CHART

image3.png


US Dollar Faces Reversal Risk Ahead of Inflation Report as DXY Breaks Key Trendline

US Dollar Faces Reversal Risk Ahead of Inflation Report as DXY Breaks Key Trendline

The US Dollar (DXY Dollar Index) is heading for a loss this week so far ahead of the highly-anticipated Consumer Price Index (CPI) report. If losses are sustained, the -0.3% drop could be the worst 5-day performance since the middle of July. Meanwhile, things are looking increasingly bearish on the daily chart. Let us take a look at how the currency is shaping up ahead of the inflation report.

On Thursday, US headline inflation is seen weakening to 3.6% y/y in September from 3.7% y/y in August. This is known as disinflation. Disinflation is a period where prices are still rising but at a slower pace compared to prior. This should not be confused with deflation (falling prices). Core CPI, which excludes volatile food and energy costs (underlying inflation), is seen dropping to 4.1% y/y from 4.3% prior.

The Federal Reserve is probably more interested in the latter. It should be noted that from my fourth-quarter outlook, the lag effect of slowing rental property prices will likely continue making its way into core CPI. As such, this might continue pressuring core inflation lower in the coming months, which is what I am expecting from this report on Thursday.

Such an outcome would likely support recent cautious commentary coming from the Federal Reserve, which has been adding slight downward pressure to Treasury yields. In turn, that has been pushing the US Dollar lower, particularly as stock markets rise again. This results in less demand for safety, which works against the haven-linked currency.

US Dollar Technical Analysis

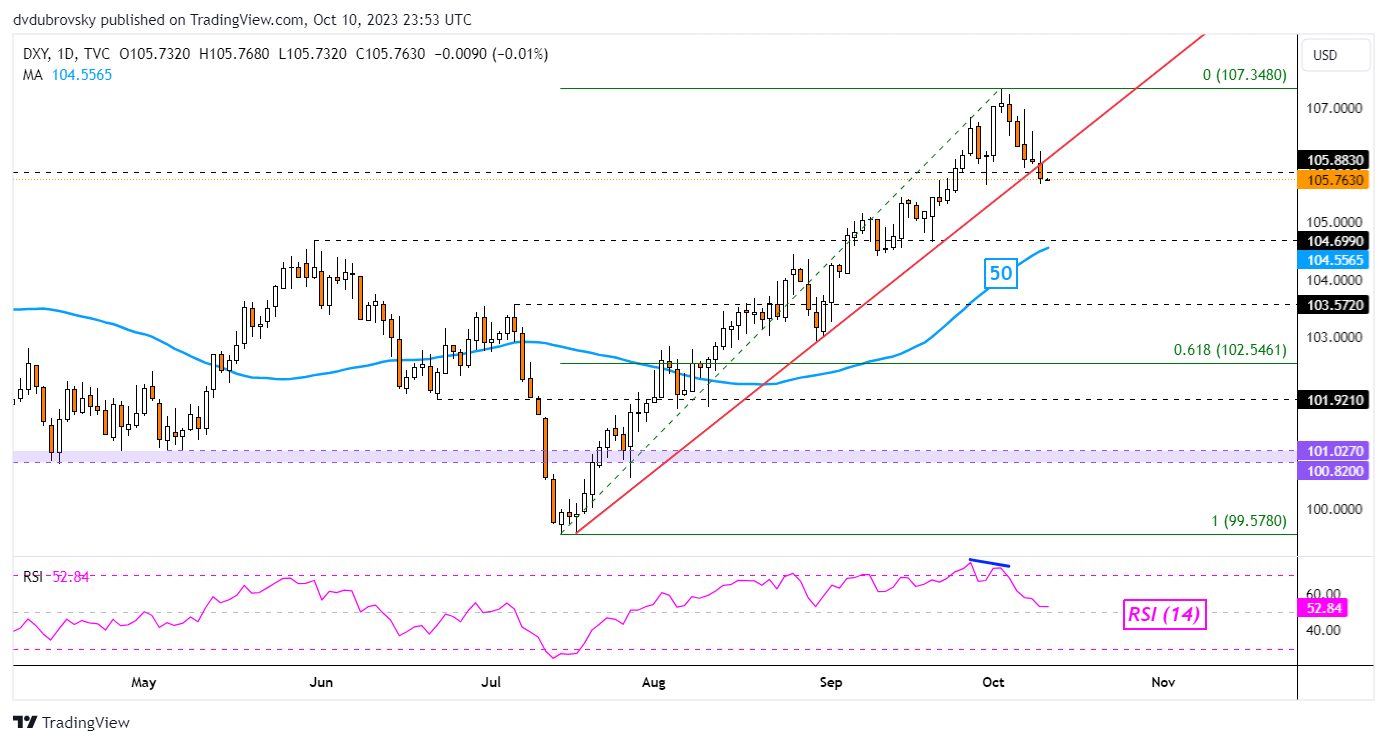
Taking a look at the DXY daily chart below, we can see that the currency broke under a key rising trendline from July. While confirmation is lacking, this could be an early indication of an impending reversal. This also follows negative RSI divergence, showing that upside momentum was fading leading into the turn lower. From here, key support is the 104.69 inflection point below.

DXY Daily Chart

image1.png

Japanese Yen Aided by Fed Pause View, Geopolitics; USD/JPY, GBP/JPY, AUD/JPY

Japanese Yen Aided by Fed Pause View, Geopolitics; USD/JPY, GBP/JPY, AUD/JPY

Dovish comments from US Federal Reserve officials coupled with the violence in Israel and Gaza have put a lid on US Treasury yields, boosting the Japanese yen.

Dallas Fed president Lorie Logan and Fed Vice Chair Philip Jefferson on Monday suggested that the sharp rise in yields has tightened financial conditions, lessening the need for further interest rate hikes. Markets are now pricing in around a 10% chance of a 25 basis points hike by the Fed when it meets next month, down from around a 28% chance a week ago. Moreover, the yen appears to have attracted some safe-haven bids on account of a flare up in geopolitical tensions.

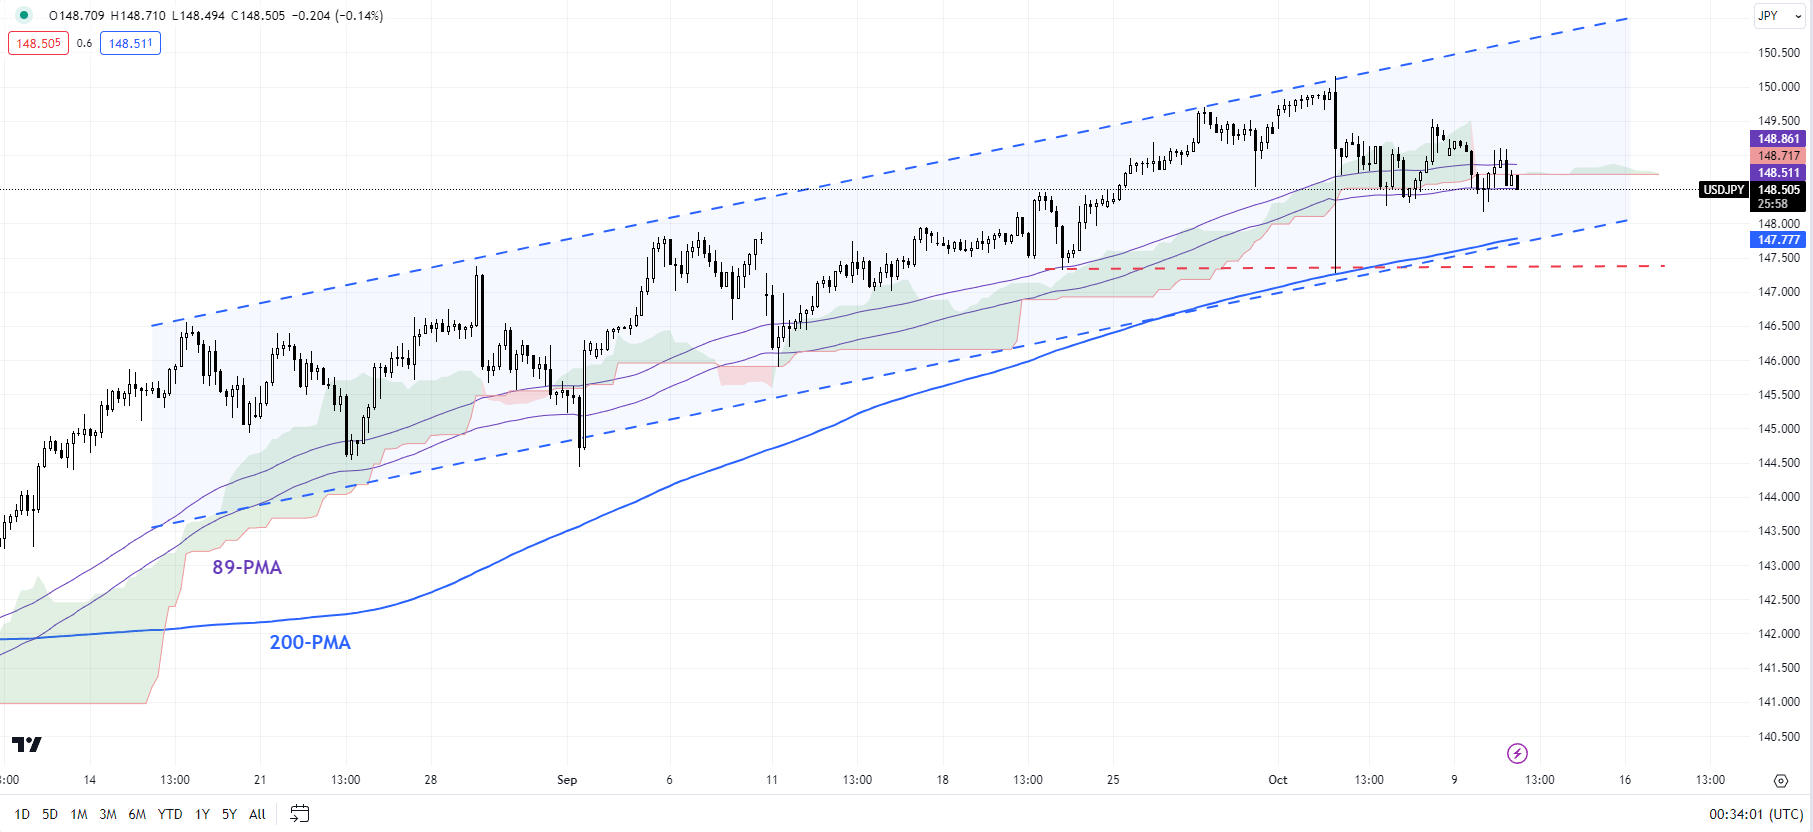
The pause in the yen’s slide against the US dollar is a welcome sign as it hovers in the range that invited intervention by Japanese authorities last year. The yen has been under pressure as BOJ’s persistent ultra-easymonetary policydiverges from its peers where central banks remain hawkish.

USD/JPY 240-Minute Chart


image1.png

Having said that, unless global central banks take a step back from the hawkishness and/or BOJ steps up its hawkishness, the path of least resistance for the yen remains sideways to down. For more details, see “Japanese Yen Tumbles as BOJ Maintains Status Quo: USD/JPY Eyes 150,” published September 22.

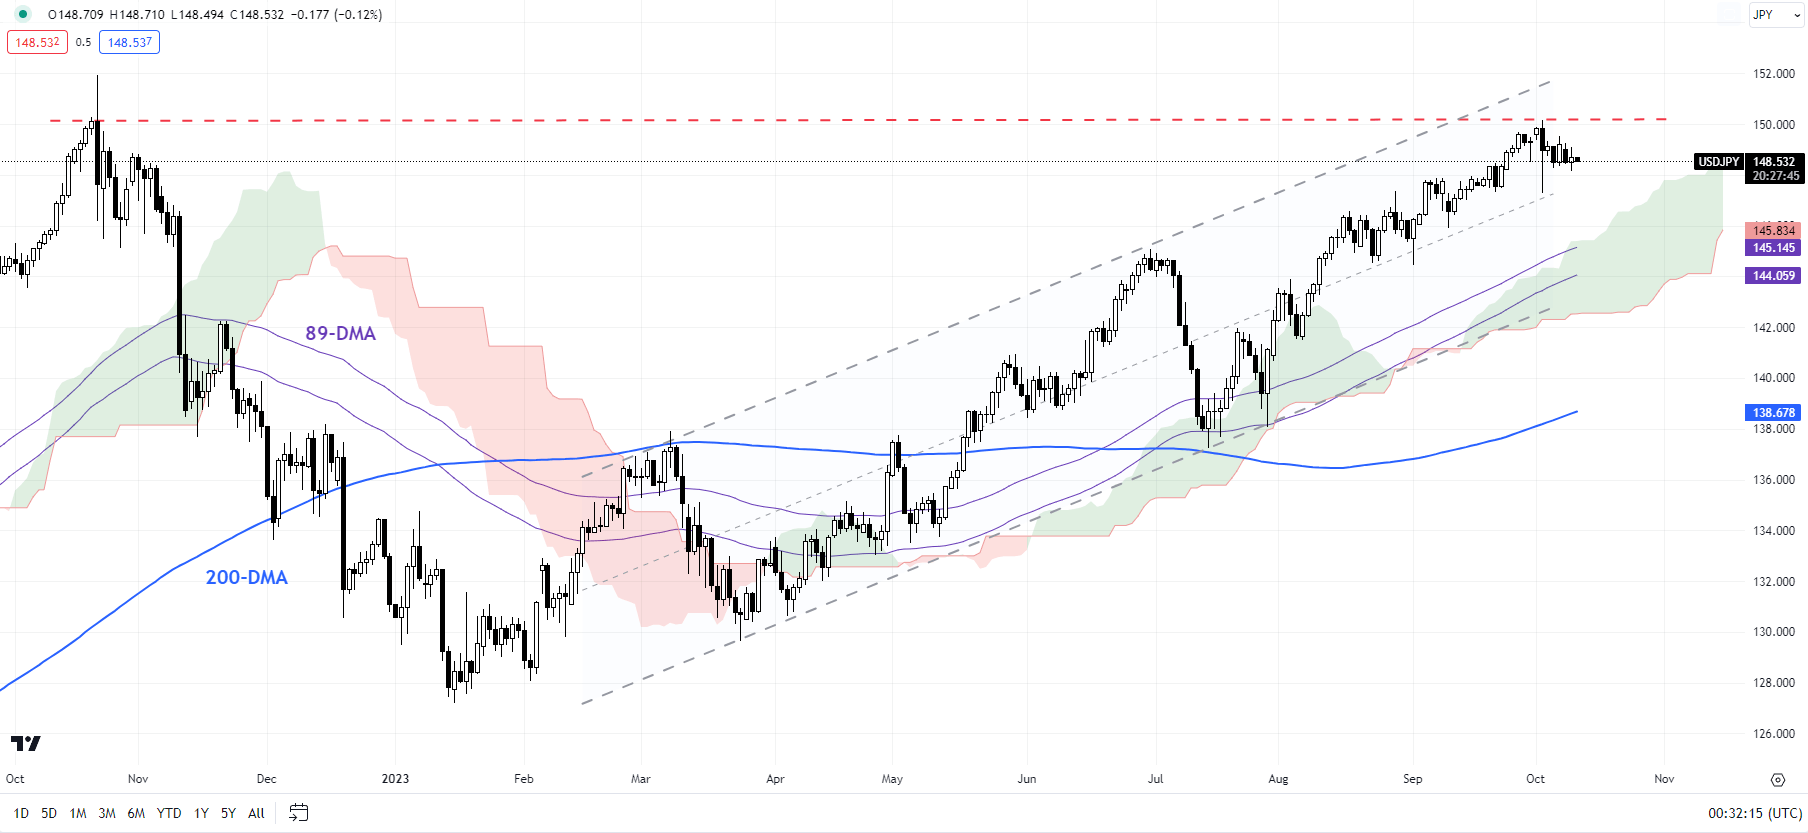
USD/JPY Daily Chart

image2.png

Chart Created by Manish Jaradi Using TradingView

If you’re puzzled by trading losses, why not take a step in the right direction? Download our guide, “Traits of Successful Traders,” and gain valuable insights to steer clear of common pitfalls that can lead to costly errors.

USD/JPY: 147.35 is key support

USD/JPY continues to hold under stiff resistance at the psychological 150 mark, not too far from the 2022 high of 152.00. A potential lower high created last week raises the risk of a test of the 200-period moving average, around the early-October low of 147.35. This support is strong and may not break in the first attempt at least. Given the buoyant upward momentum on the daily chart, the pair could continue to hover in the 147.00-150.00 range in the interim. However, any break below 147.35 would confirm that the broader upward pressure was easing.

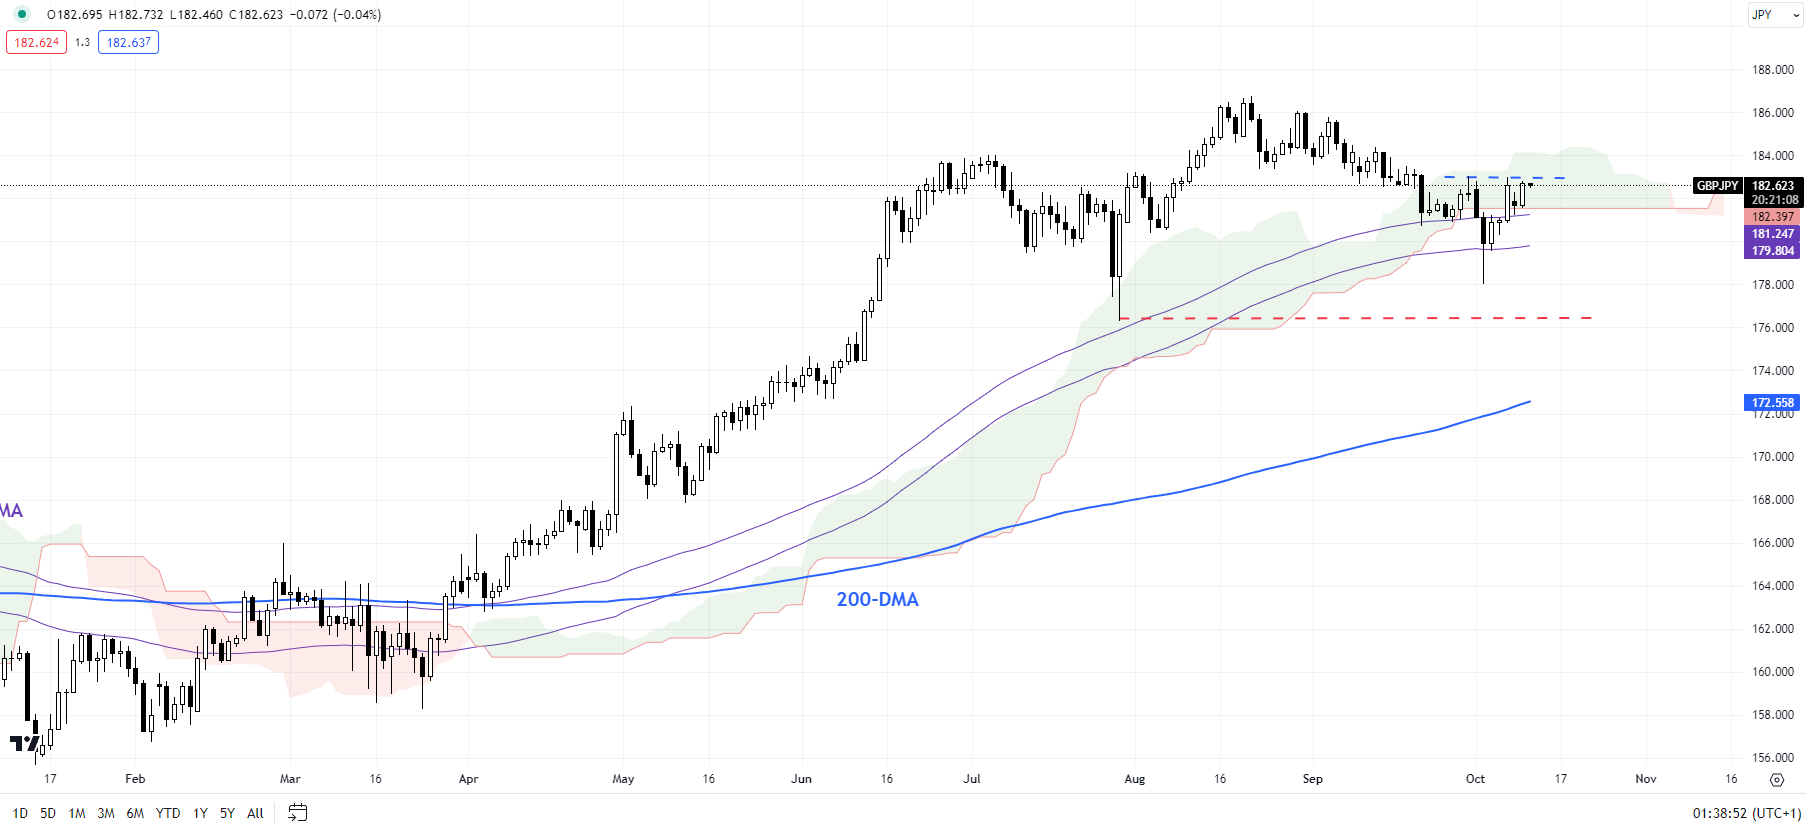
GBP/JPY Daily Chart

image3.png

GBP/JPY: Bullish move ahead?

GBP/JPY is now testing key resistance at last week’s high of 183.00. Any break above could clear the path up to the August high of 186.75. Importantly, the cross’ hold above strong converged support on the 89-day moving average confirms that the broader trend remains up and the recent sideways price action is a pause, rather than a reversal of the uptrend.

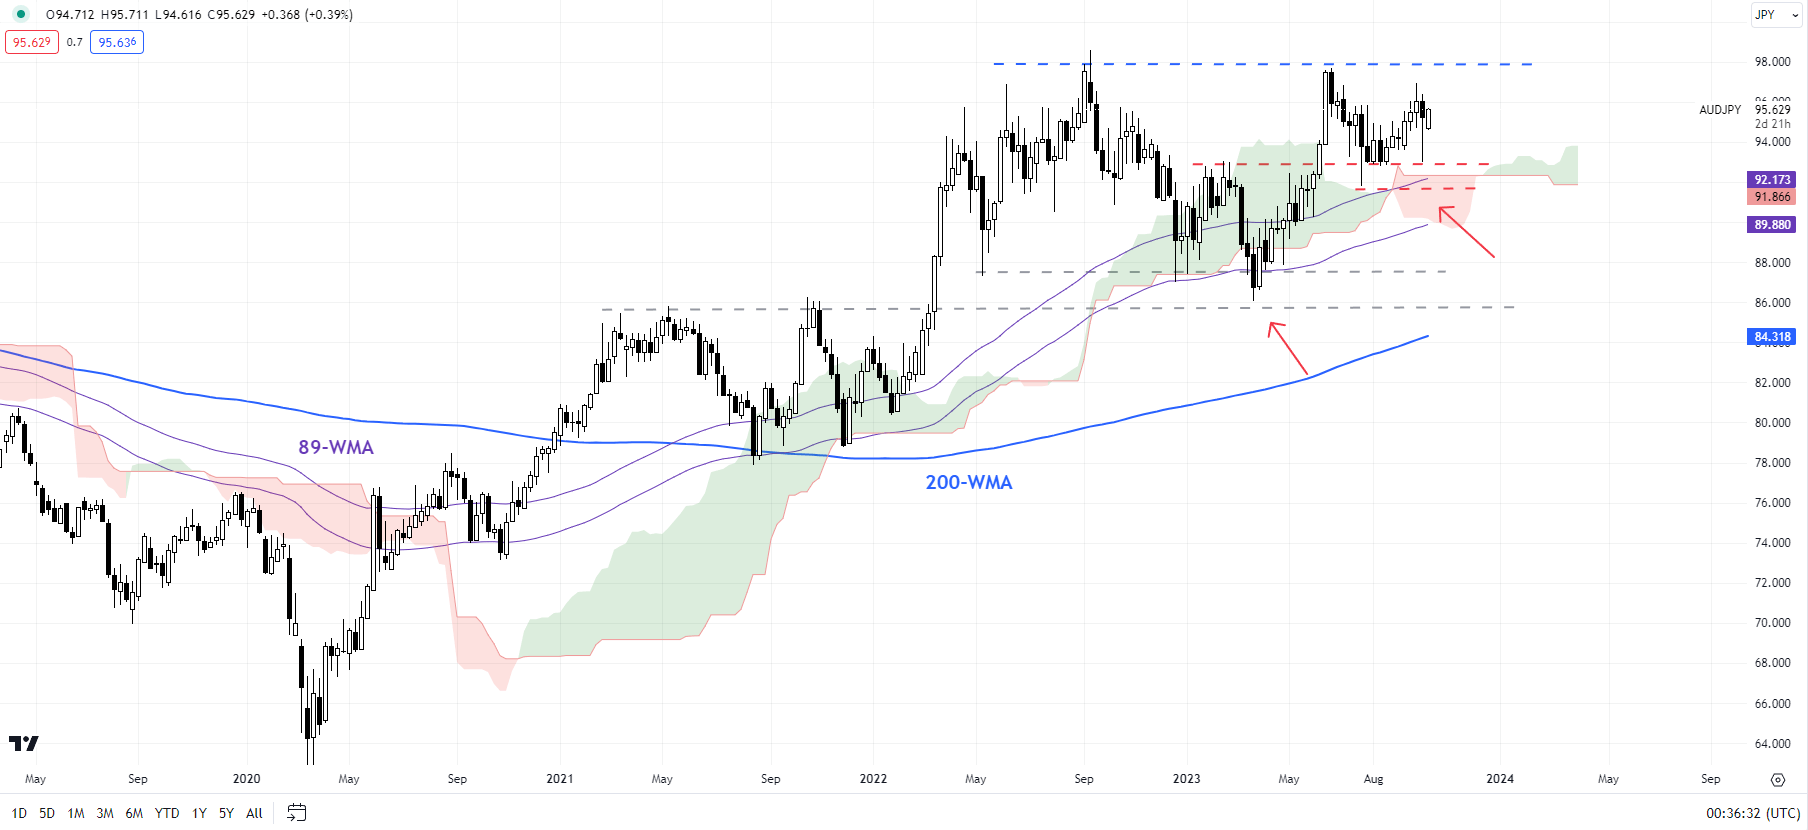
AUD/JPY Weekly Chart

image4.png

AUD/JPY: Range likely

AUD/JPY continues to hold above quite strong converged support at the 89-day moving average, the February high, and the lower edge of the Ichimoku cloud on the daily charts, ashighlighted in the previous update. However, unless the cross clears the June high of 97.70 the path of least remains sideways at best.

Australian Dollar Pauses as US Dollar Sinks on a Dovish Fed. Will AUD/USD Reverse?

Australian Dollar Pauses as US Dollar Sinks on a Dovish Fed. Will AUD/USD Reverse?

The Australian Dollar pondered the recent rally today after more indications that the Federal Reserve has hit the wait-and-see button while the RBA is contemplating the consequences of its rate hike cycle.

The situation in the Middle East continues to prompt markets to assess the risks associated with the potential impacts across asset classes.

Crude oil has been steadying so far on Wednesday with the WTI futures contract holding above US$ 86 bbl while the Brent contract is near US$ 88 bbl.

After the North American close, San Francisco Fed President Mary Daly maintained the mantra that had been articulated by other Fed board members this week. That is higher back-end bond yields in Treasuries might be doing the tightening work for the Fed.

It appears that the bank is signalling for a pause at its meeting at the end of this month and potentially further afield. Interest rate markets are ascribing only a low probability of a hike.

While the change in tack is less hawkish, there is not anything in the language so far to suggest any easing in monetary conditions is forthcoming.

Ms Daly was also open to the suggestion that the so-called ‘neutral rate’ for the Fed might be higher than the 2.5% previously widely perceived to be the case.

However she made it clear that the current Fed funds policy rate of 5.25 – 5.50% is a restrictive stance to deal with high inflation and is well above the theoretical neutral rate.

In regard to a soft landing for the US economy, Minneapolis Federal Reserve President Neel Kashkari opined that “It is looking more favourable.”

Wall Street finished its cash session higher and APAC equities have followed the lead with a sea of green across the region with South Korea’s KOSPI index leading the way, adding more than 2.5%.

Treasury yields are little changed so far with the 2-year note near 5% while the 10-year is around 4.65% and spot gold is settling near US$ 1,860 at the time of going to print.

On the flipside of the rosy outlook, famed investor Paul Tudor Jones said that the geopolitical environment is the worst that he has seen. He also sees a recession in the US in 2024 and said that the US is in its weakest financial position since World War II.

Elsewhere, the Reserve Bank of Australia (RBA) Assistant Governor Chris Kent made comments today highlighting the problems around the time lags in the transmission effect of monetary policy.

He also said, “Some further tightening may be required to ensure that inflation, that is still too high, returns to target.”

AUD/USD was slightly softer in the aftermath and NZD/USD also went lower today ahead of a national election in New Zealand this weekend.

AUD/USD TECHNICAL ANALYSIS SNAPSHOT

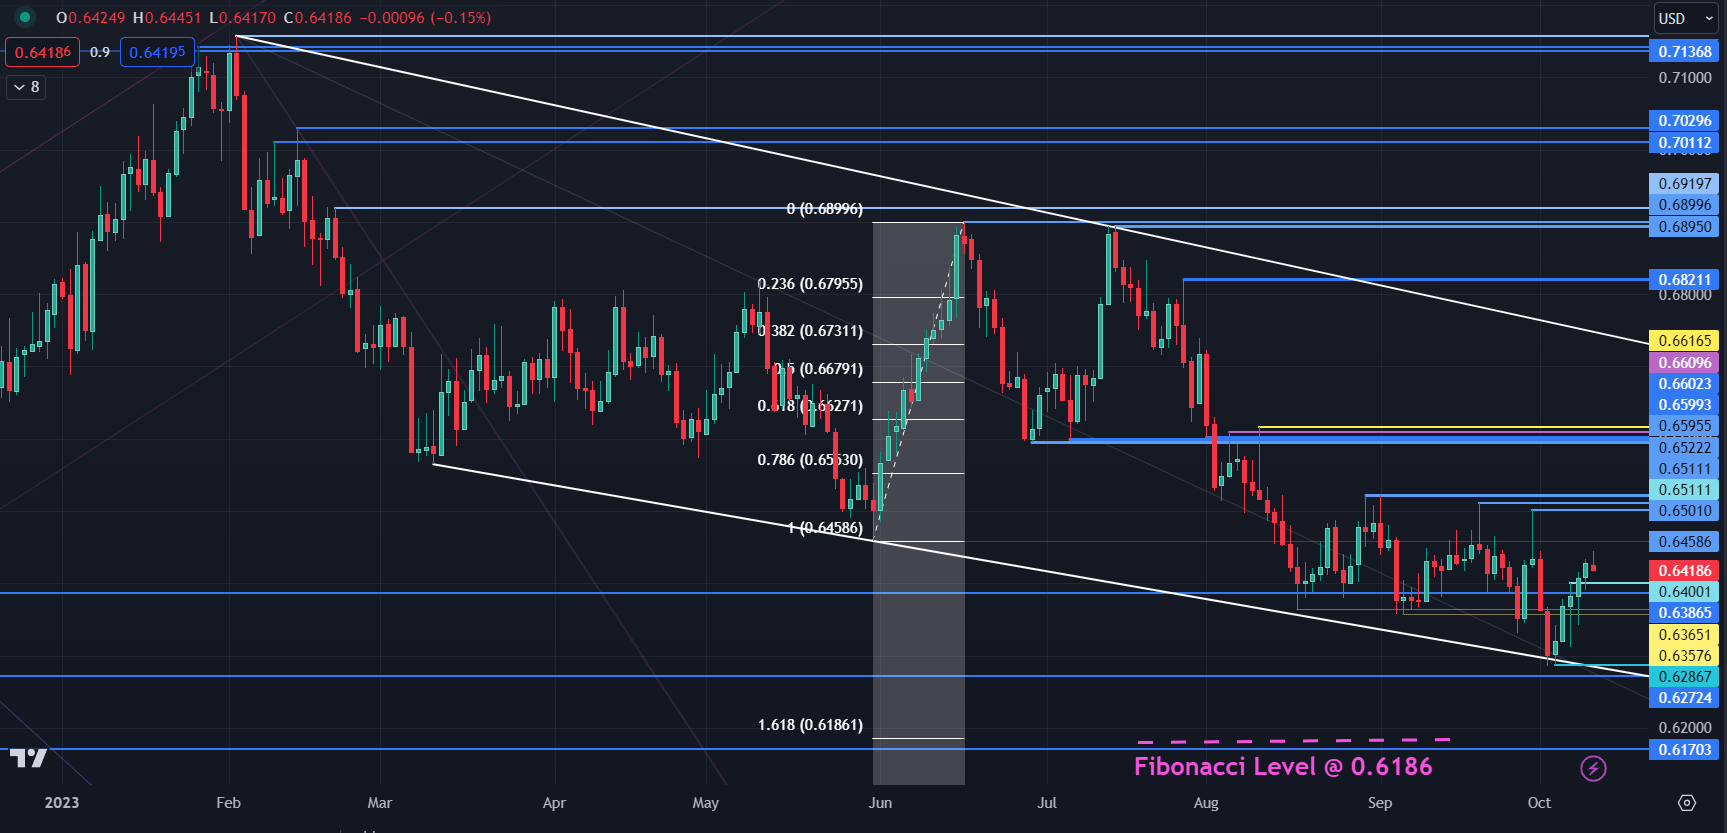
AUD/USD rejected a move below a descending trendline last week but overall remains in a descending trend channel. To learn more about trend trading, click on the banner below.

It briefly traded above a historical breakpoint of 0.6387 on Friday but was unable to sustain the move and it may continue to offer resistance.

The 0.6500 – 0.6520 area contains a series of prior peaks and might be a notable resistance zone. Further up, the 0.6600 – 0.6620 area might be another resistance zone with several breakpoints and previous highs there.

On the downside, support may lie near the previous lows of 0.6285, 0.6270 and 0.6170.

The latter might also be supported at 161.8% Fibonacci Extension level at 0.6186. To learn more about Fibonacci techniques, click on the banner below.

image1.png


British Pound Ahead of US CPI: GBP/USD, EUR/GBP, GBP/AUD Price Setups

British Pound Ahead of US CPI: GBP/USD, EUR/GBP, GBP/AUD Price Setups

After weeks of losses, the British pound is attempting to rebound as US Federal Reserve rate hike expectations scale back ahead of the key US inflation and UK GDP data.

Markets are now pricing in around a 10% chance of a 25 basis points hike by the Fed when it meets next month, down from around a 28% chance a week ago following dovish remarks from key Fed officials. Dallas Fed president Lorie Logan and Fed Vice Chair Philip Jefferson on Monday suggested that the sharp rise in yields has tightened financial conditions, lessening the need for further interest rate hikes. Atlanta Fed President Raphael Bostic said on Tuesday he thinks the Fed doesn’t need to raise interest rates anymore.

The greenback’s failure to attract meaningful safe-haven bids despite the escalation in geopolitical tensions possibly indicates that interest rates/monetary policy is a significant driver. In this regard, the key focus is on US CPI data due Thursday: headline inflation eased to 3.6% on-year last month from 3.7% in August, while core inflation eased to 4.1% on-year from 4.3% previously. The moderation in inflation could provide an excuse to unwind some of the long USD positions, especially in the context of the shift in rates view since Monday.

GBP/USD 240-Minute Chart

image1.png

Another focus is UK GDP data is due Thursday. On a three-month average basis, GDP grew 0.3% in August from 0.2% previously. A slowing UK economy has hurt the pound, especially against the US dollar, which has benefited from a solid US economy. However, any signs that UK growth is improving could prompt speculative positioning to be reassessed – moved to minor shorts last week just a few months after longs hit the highest since GFC in July. For more discussion on GBP’s underperformance, see “Pound’s Resilience Masks Broader Fatigue: GBP/USD, EUR/GBP, GBP/JPY Setups,” published August 23.

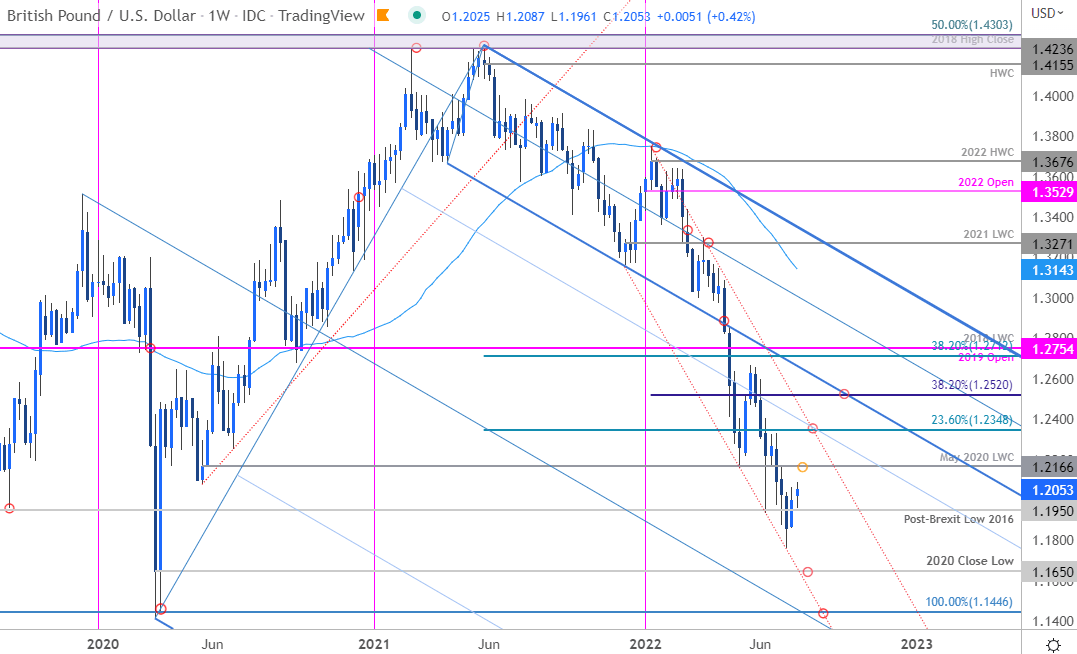
GBP/USD: Testing vital support

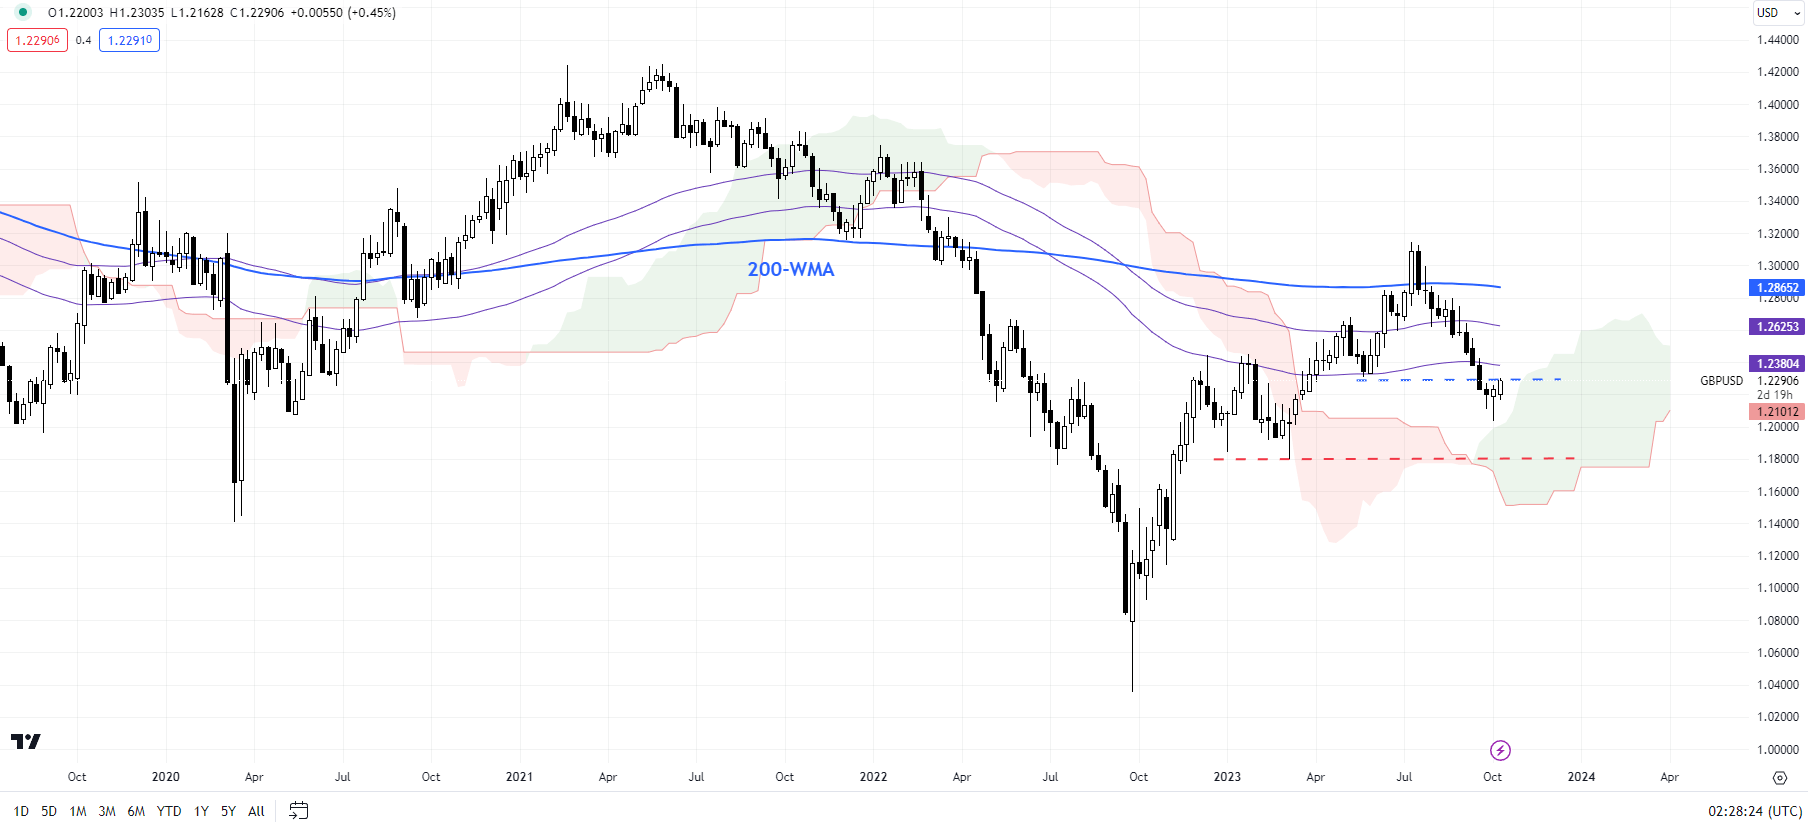
On technical charts, GBP/USD’s rise above last week’s high is an encouraging sign, raising the prospect of some recovery given the slide from July. The recent gains have come about from near-strong converged support at the early 2023 lows of around 1.1800, not too far from the lower edge of the Ichimoku cloud on the weekly charts.

GBP/USD Weekly Chart

image2.png

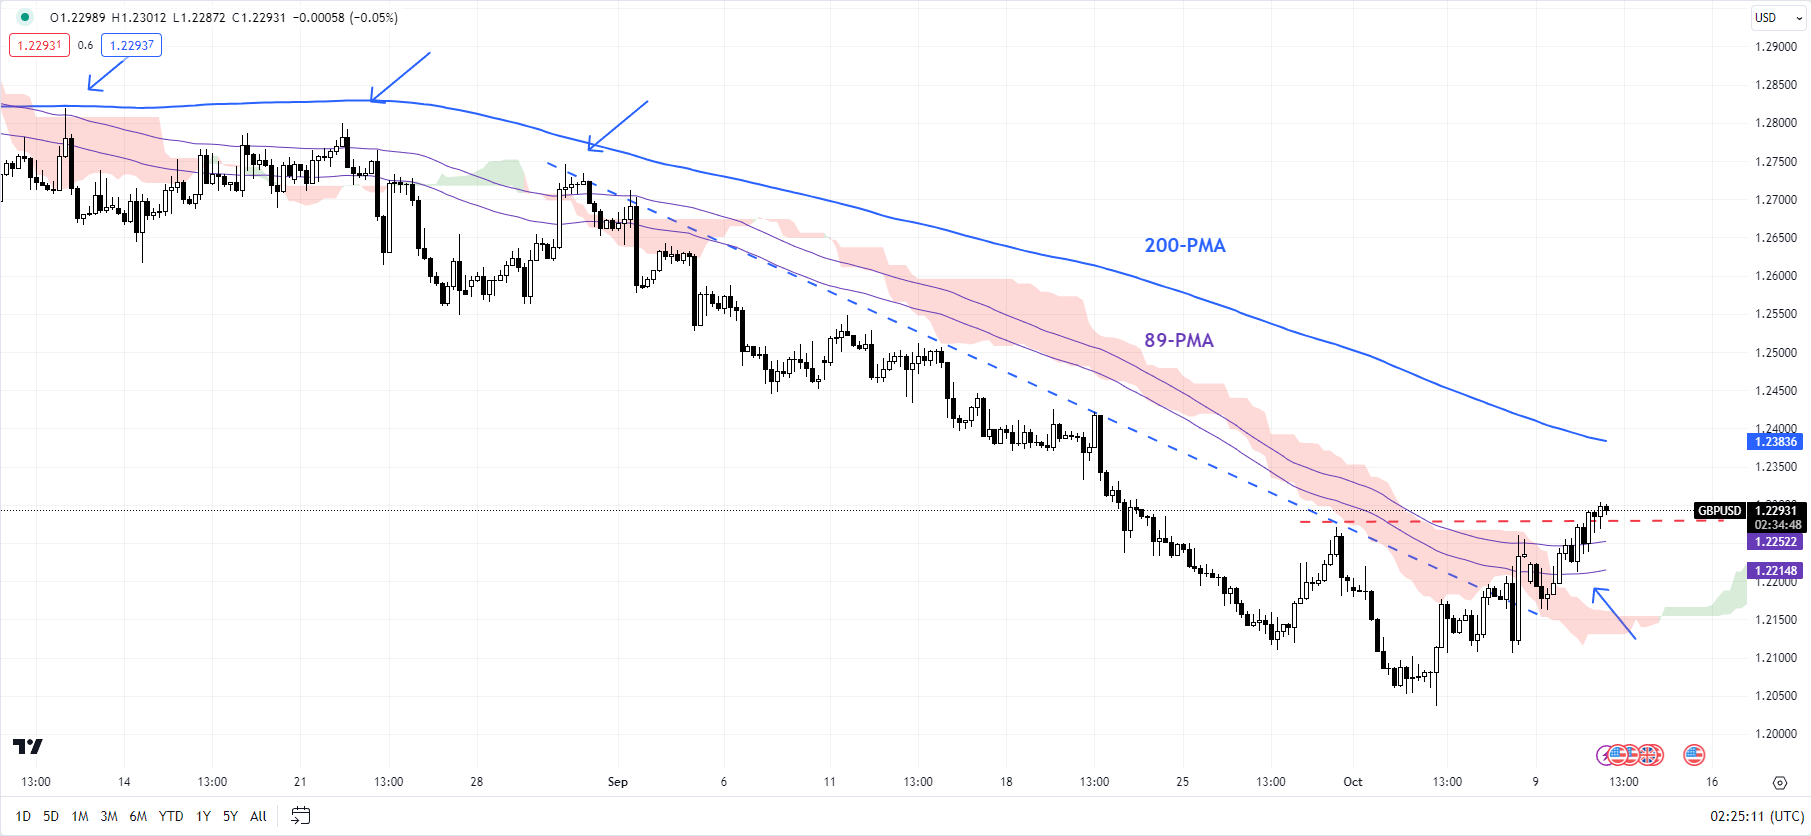
On intraday charts, GBP/USD is testing a crucial resistance area, including the end-September high of 1.2275, near the 200-period moving average on the 240-minute chart. A break above the 1.2275-1.2375 region is needed for the immediate bearish risks to dissipate. Until then, the path of least resistance remains sideways to down in the interim.

Looking for actionable trading ideas? Download our top trading opportunities guide packed with insightful tips for the fourth quarter!

EUR/GBP Daily Chart

image3.png

EUR/GBP: Retreat confirms ongoing range

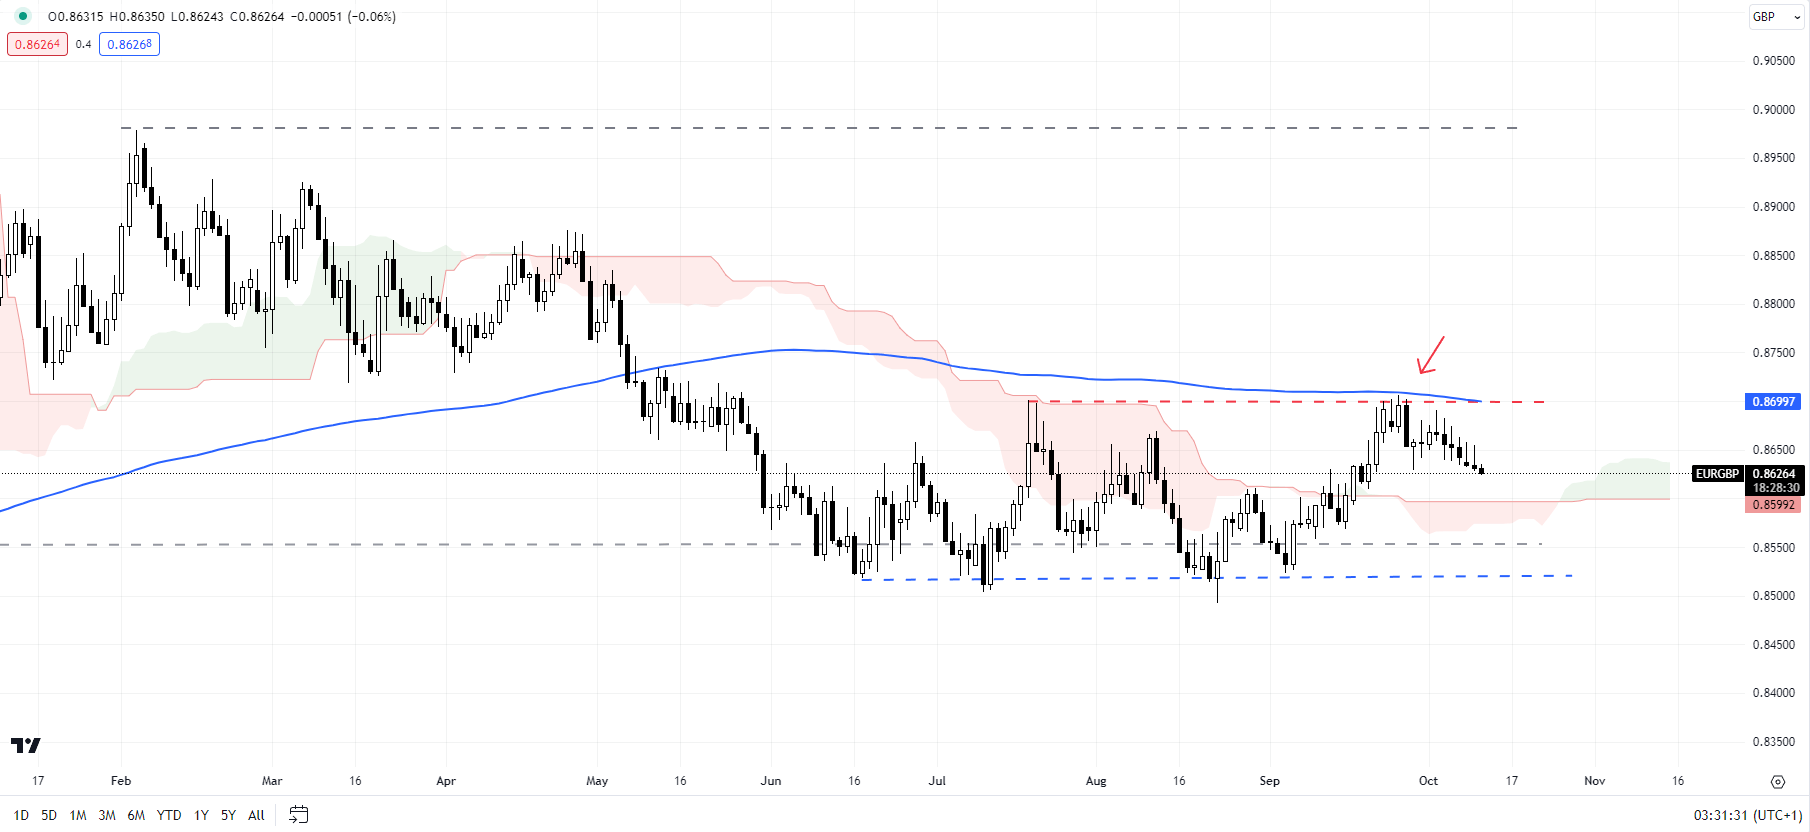
EUR/GBP retreat from a stiff converged ceiling at the mid-July high of 0.8700, coinciding with the 200-day moving average confirms that the cross remains within its well-established range since June. The cross looks set to retest the converged floor on a horizontal trendline from June and another horizontal trendline since late 2022 (at about 0.8550-0.8600). As highlighted in the previous update, the broader bias remains down for the cross. See “British Pound Ahead of UK GDP: GBP/USD, EUR/GBP, GBP/JPY Setups,” published September 13.

GBP/AUD 240-Minute Chart

image4.png

GBP/AUD: Mild recovery in progress

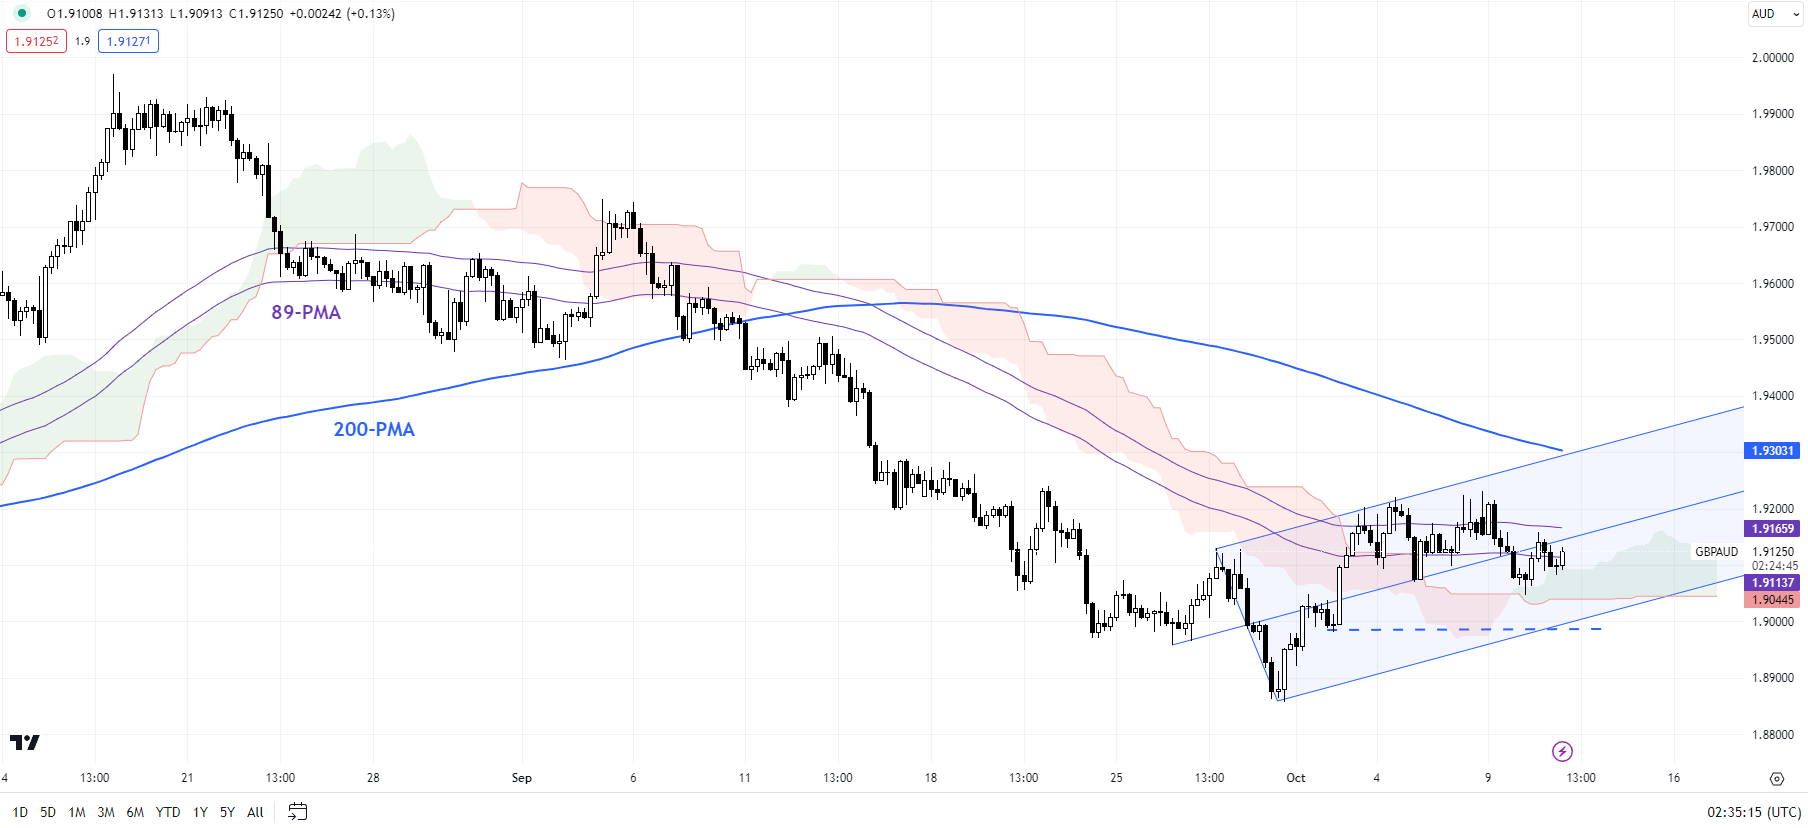
GBP/AUD’s rise above minor resistance at the end-September high of 1.9125 has shifted the focus to the 200-period moving average (now at about 1.9300), which is a more significant barrier to cross. A break above the average is needed to confirm that the immediate downside risks have faded. Looking at the broader picture, the odds of further gains remain high. Any break above the average could open the door toward the early-September low of 1.9450.

USD/CAD Price Forecast: Loonie Pauses on Upcoming US Drivers

USD/CAD Price Forecast: Loonie Pauses on Upcoming US Drivers

CANADIAN DOLLAR FUNDAMENTAL BACKDROP

The Canadian dollar braces ahead of US PPI and the FOMC minutes respectively. Yesterday’s dovish remarks by the Fed’s Logan that there may be ‘less need for the Fed to raise rates” weighed negatively on the USD despite an increased demand for the safe haven currency due to the Israel-Palestine (Hamas) conflict.

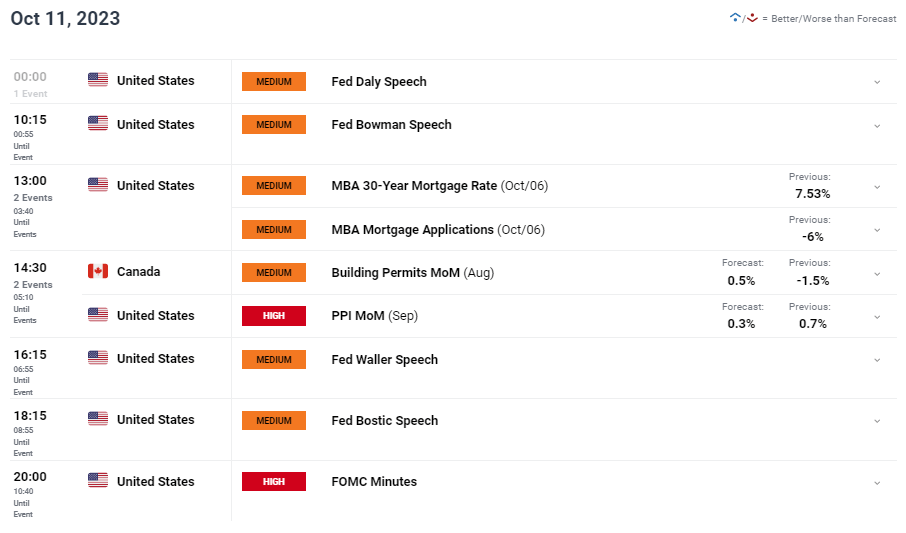
Later today (see economic calendar below) will see further Fed speakers give their addresses while US PPI could give an indication to the inflationary backdrop in the US. PPI is generally viewed as a leading indicator and if we see an upside surprise, this could suggest that CPI figures moving forward could remain elevated.

The FOMC minutes is likely to favor the hawkish narrative as the prior meeting resulted in a reinforcement of the ‘higher for longer’ narrative that could keep the greenback supported.

Crude oil prices stay buoyed on the war in the Middle East as contagion fears grip investors minds with regard to possible supply disruptions. The loonie will continue to benefit from this viewpoint should the war escalate and considering OPEC raised the demand forecast, crude oil may extend its recent rally.

From a Canadian perspective, building permit data is scheduled and with expectations hinting at 0.5% growth, USD/CAD bears could push the pair lower.

Want to stay updated with the most relevant trading information? Sign up for our bi-weekly newsletter and keep abreast of the latest market moving events!

USD/CAD ECONOMIC CALENDAR (GMT +02:00)

image1.png

TECHNICAL ANALYSIS

USD/CAD DAILY CHART

image2.png

Chart prepared by Warren Venketas, IG

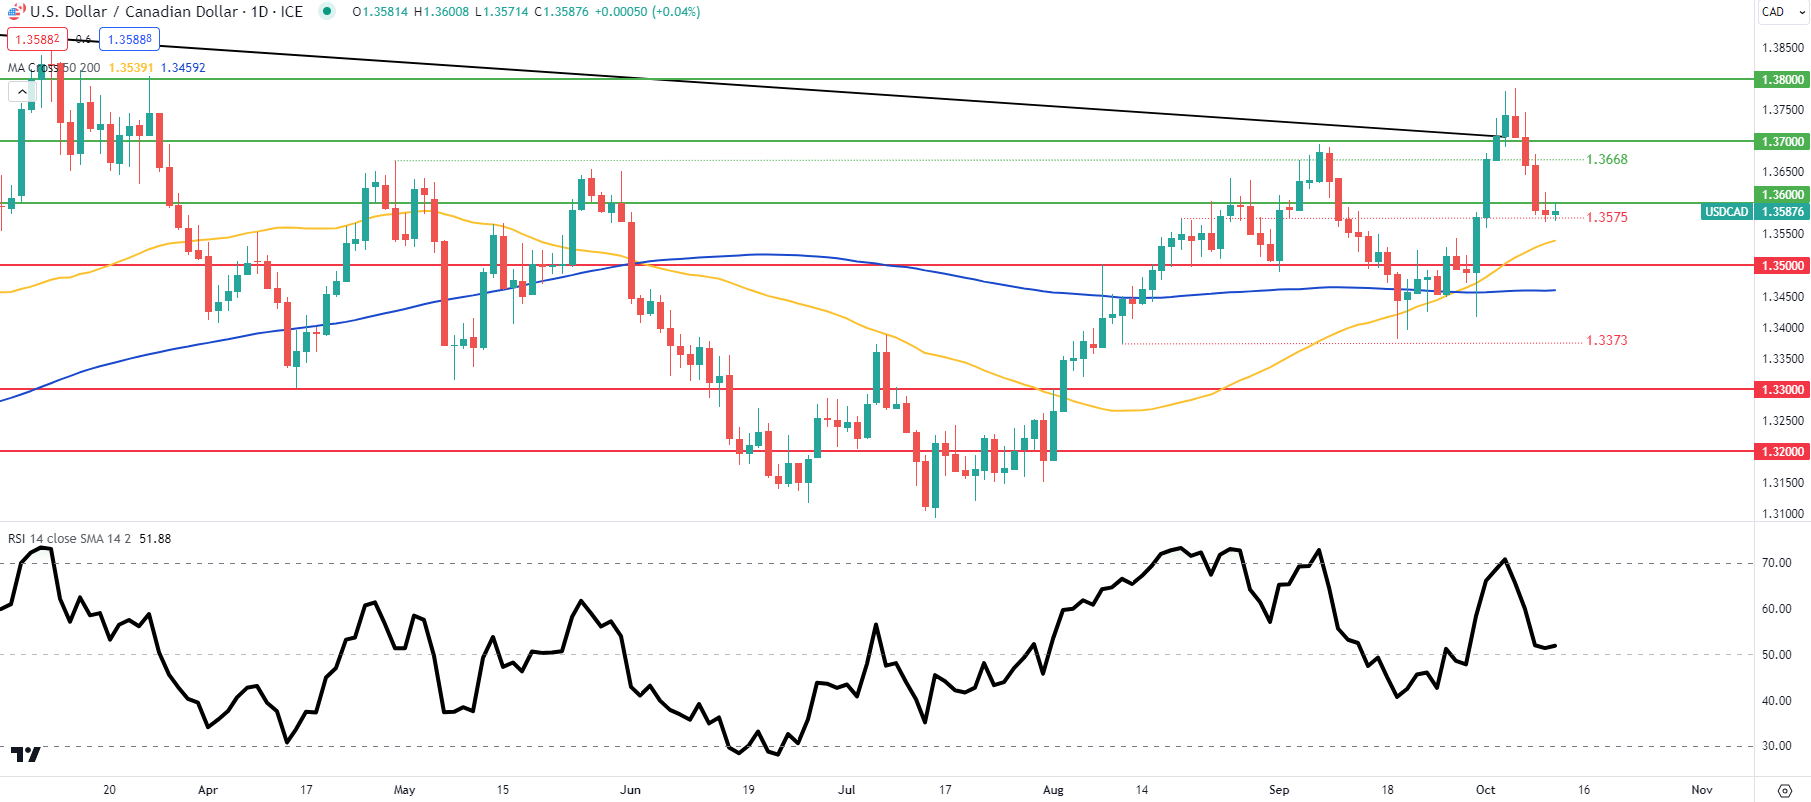
USD/CAD price action on the daily chart above highlights market hesitancy at this point with two doji candlesticks presenting themselves. The Relative Strength Index (RSI) reaffirms this with the oscillator favoring neither bullish nor bearish momentum around the midpoint 50 level. A confirmation close below 1.3575 may catalyze a move lower ahead of tomorrow’s US CPI print.