Oil Prices Forecast: Middle East Conflict Could Alter Inventory Landscape

Oil Prices Forecast: Middle East Conflict Could Alter Inventory Landscape

Oil Markets Jittery Amid Israel-Hamas Conflict

Mounting tensions between Israel and Hamas have stoked volatility in oil markets, undoing some of last week’s steep losses. Although Israel is not a key crude producer, the conflict has implications for Middle East oil supply and has resulted in the shutdown of Israel’s port of Ashkelon and its oil terminal. Furthermore, the strife could thwart a potential rapprochement between Saudi Arabia and Israel, affecting future oil output.

At 05:12 GMT, December Brent crude oil futures are trading $87.75, down $0.40 or -0.41% and December WTI crude oil futures are at $84.24, down $0.36 or -0.43%.

Trading Derivatives carries a high level of risk to your capital and you should only trade with money you can afford to lose. Trading Derivatives may not be suitable for all investors, so please ensure that you fully understand the risks involved, and seek independent advice if necessary. A Product Disclosure Statement (PDS) can be obtained either from this website or on request from our offices and should be considered before entering into a transaction with us. Raw Spread accounts offer spreads from 0.0 pips with a commission charge of USD $3.50 per 100k traded. Standard account offer spreads from 1 pips with no additional commission charges. Spreads on CFD indices start at 0.4 points. The information on this site is not directed at residents in any country or jurisdiction where such distribution or use would be contrary to local law or regulation.

Supply Concerns Heighten

Hamas’ military assault on Israel, and Israel’s subsequent airstrikes on Gaza, have escalated geopolitical risks that could disrupt oil supplies. U.S.-Saudi efforts to broker a deal with Israel hang in the balance, potentially limiting increased output next year as part of the deal. Market fears are exacerbated by potential U.S. sanctions tightening on Iran, another significant oil player, in response to the conflict.

Demand-Supply Balance in Jeopardy

Last week, Brent and WTI benchmarks plummeted around 11% and 8%, respectively, amid bleak global demand prospects. Now, this Israel-Hamas conflict threatens to further imbalance the supply-demand dynamics. Goldman Sachs suggests the turmoil could delay normalization between Israel and Saudi Arabia, affecting Saudi’s production plans, while any U.S. action against Iran might constrict Iranian exports further.

Venezuela: A Silver Lining

Amid the chaos, there is some positive news on the supply front. Talks between Venezuela and the U.S. are advancing, potentially allowing a foreign oil firm to lift Venezuelan crude, mitigating some supply tightness orchestrated by Saudi Arabia and Russia.

Short-Term Forecast: Bullish

In the immediate term, the oil market is likely to remain volatile, experiencing both supply concerns and shifts in geopolitical landscapes. Risk-averse investors should brace for heightened market sensitivity, as conflicts can dramatically shift market sentiments overnight.

Crude Oil Technical Analysis
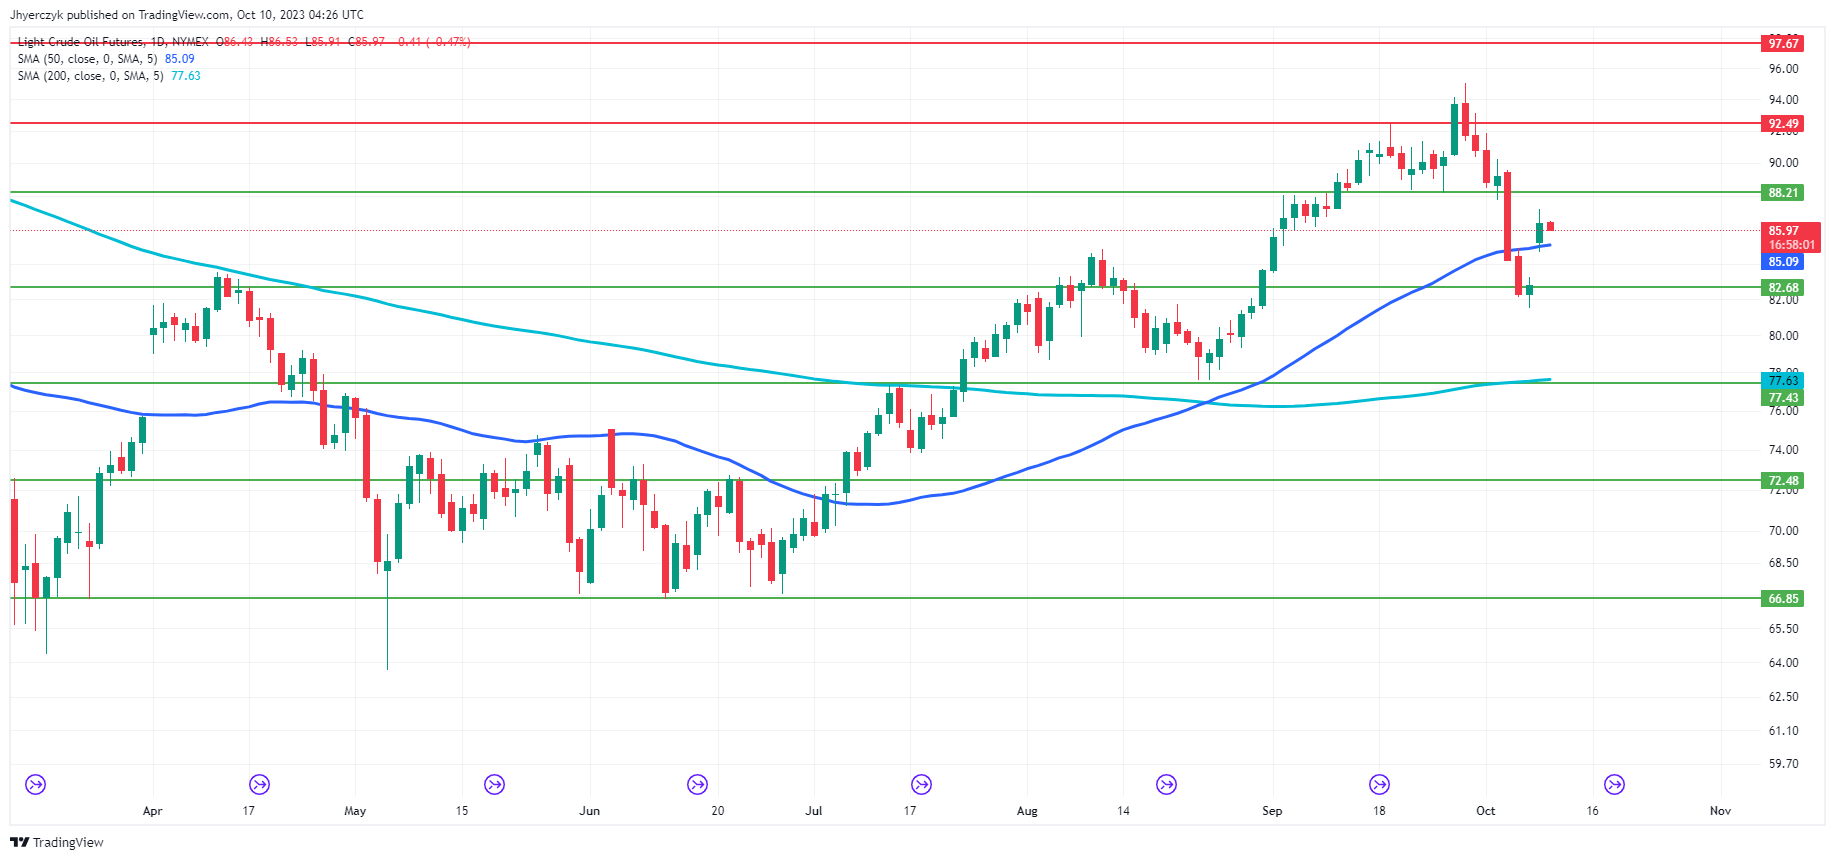
Daily Light Crude Oil FuturesThe current daily price of light crude oil futures at 85.97 is marginally above the 50-Day moving average of 85.09, indicating short-term bullish momentum. It’s also significantly higher than the 200-Day moving average of 77.63, reinforcing a longer-term bullish trend.

The price sits between the main support at 82.68 and minor resistance at 92.49, further suggesting a bullish outlook. However, with the price recently slipping from 86.38 to 85.97, short-term caution is advised.

Overall, the market sentiment appears to be cautiously bullish.

Crude Oil Price Surge in Focus After Hamas Attacked Israel, Retail Bets Remain Bullish

Crude Oil Price Surge in Focus After Hamas Attacked Israel, Retail Bets Remain Bullish

Crude oil prices gapped higher at Monday’s open and closed the session 4.35% higher, marking the best single-day performance since early April. This followed weekend developments as Hamas attacked Israel, inflating supply disruption woes. According to Bloomberg, the outbreak “threatens to embroil both the US and Iran”. The latter has recently been a contributor of extra supply this year.

In response, retail traders have been increasing upside exposure in crude oil as of late. This can be seen via IG Client Sentiment (IGCS), which often functions as a contrarian indicator. With that in mind, while supply disruption fears may offer near-term support, increasingly bullish retail bets may serve as a bearish prospect for oil.

Crude Oil Sentiment Outlook – Bearish

According to IGCS, about 73% of retail traders are net-long crude oil. Since most of them remain biased to the upside, this continues to hint that prices may fall down the road. This is as upside bets increased by 19.36% and 94.04% compared to yesterday and last week, respectively. With that in mind, recent changes in IGCS offer an increasingly bearish contrarian trading bias.

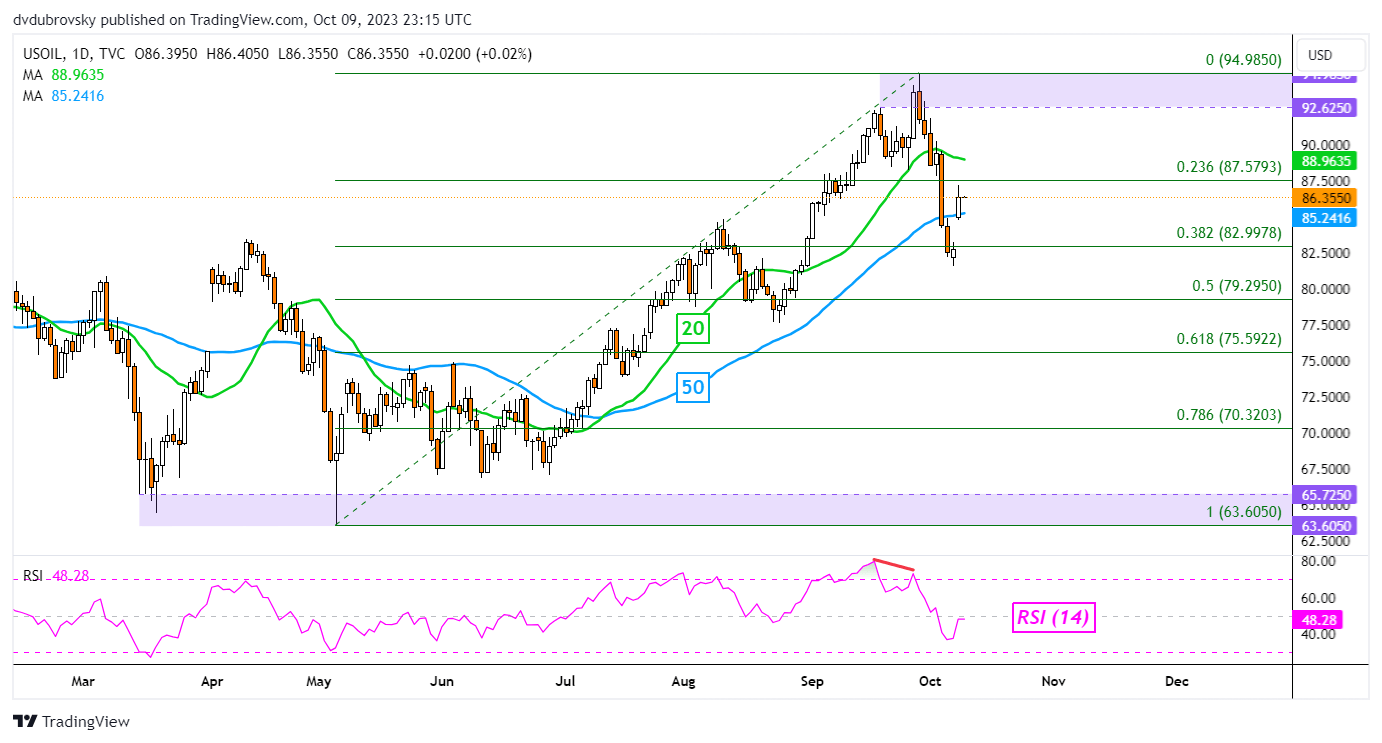
Looking at the daily chart, WTI bounced off the 38.2% Fibonacci retracement level of 82.99 following recent fundamental developments. This also undermined the breakout under the 50-day moving average, which has since been reversed. Resuming the uptrend entails a push above the 92.62 – 94.98 resistance zone. Meanwhile, breaking under support exposes the midpoint of the retracement at 79.29.

Crude Oil Daily Chart

Crude Oil Daily Chart


Gold Price Rallies as US Dollar Slips and Volatility Ticks Up. Higher XAU/USD?

Gold Price Rallies as US Dollar Slips and Volatility Ticks Up. Higher XAU/USD?

The gold price bounced hard off a seven-month low to start this week in the aftermath of the outbreak of war in the Middle East, trading back above US$ 1,860 a troy ounce.

The perceived haven status of the precious metal helped to underpin but it has also seen the tailwinds of a weaker US Dollar with Treasury yields reversing the gains seen last week.

The benchmark 10-year bond eclipsed 4.88% on Friday, the highest return for the low-risk asset since 2007.

It has since collapsed below 4.65% this week after dovish comments from Federal Reserve Vice Chair Philip Jefferson and the Dallas Fed President Lorie Logan.

Somewhat ironically, both central bankers cited higher long-end Treasury yields as a reason to be less hawkish going forward. The interest rate market has now pretty much ruled out another hike by the Fed and sees a cut by the middle of next year.

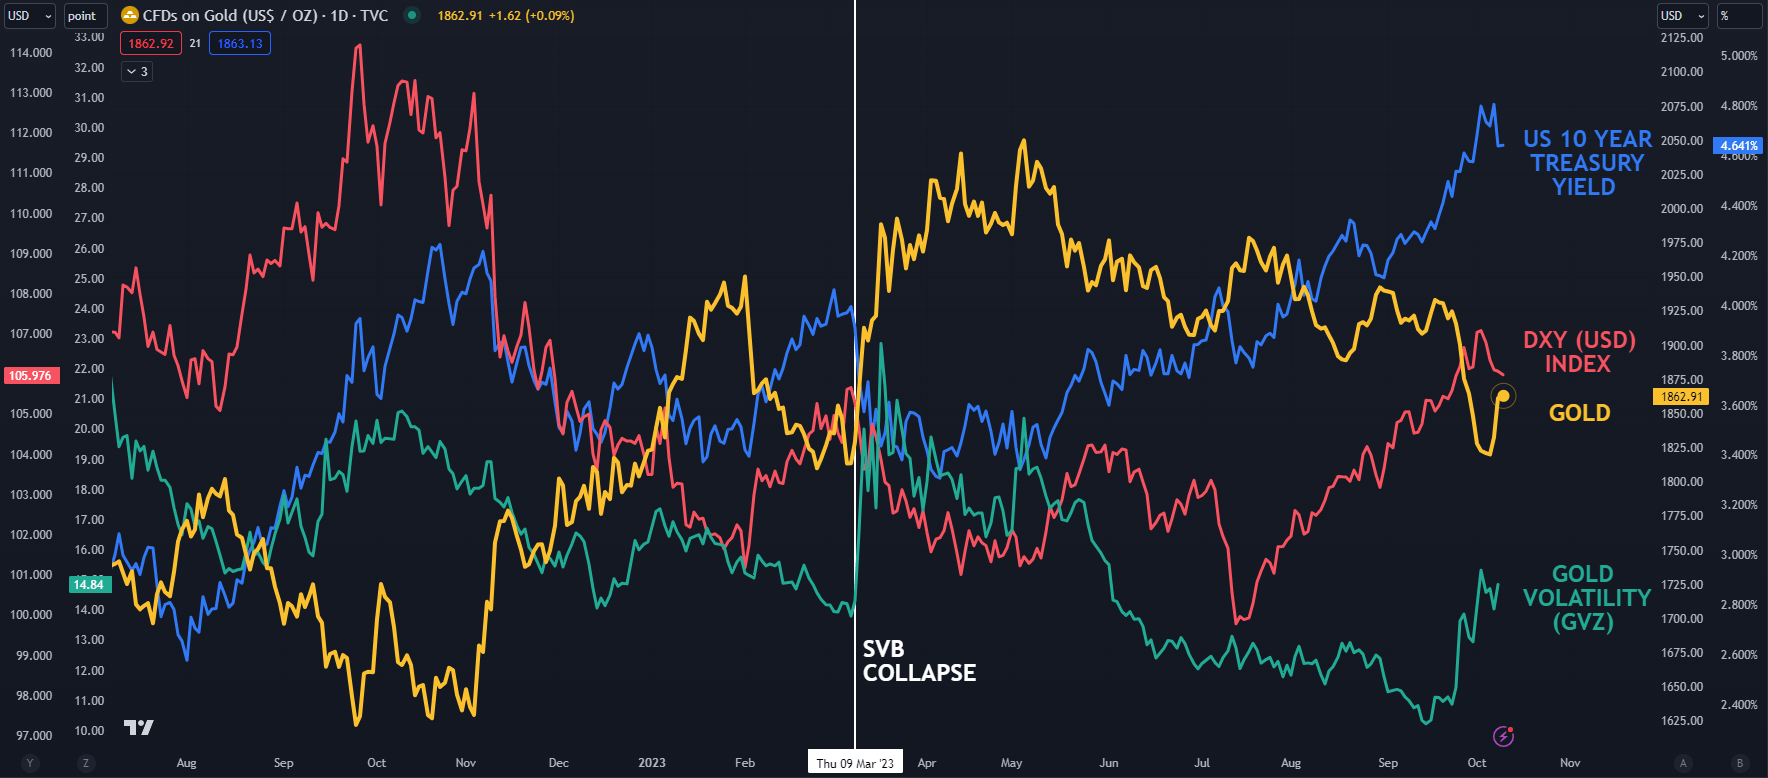
Recent moves have seen volatility pick up for gold as measured by the GVZ index. This may suggest that further notable moves in the gold price might evolve.

The GVZ index measures volatility in the gold price in a similar way that the VIX index gauges volatility in the S&P 500.

SPOT GOLD, DXY (USD) INDEX, US 10-YEAR TREASURY AND GVZ INDEX

image1.png

Chart created in TradingView

GOLD TECHNICAL ANALYSIS SNAPSHOT

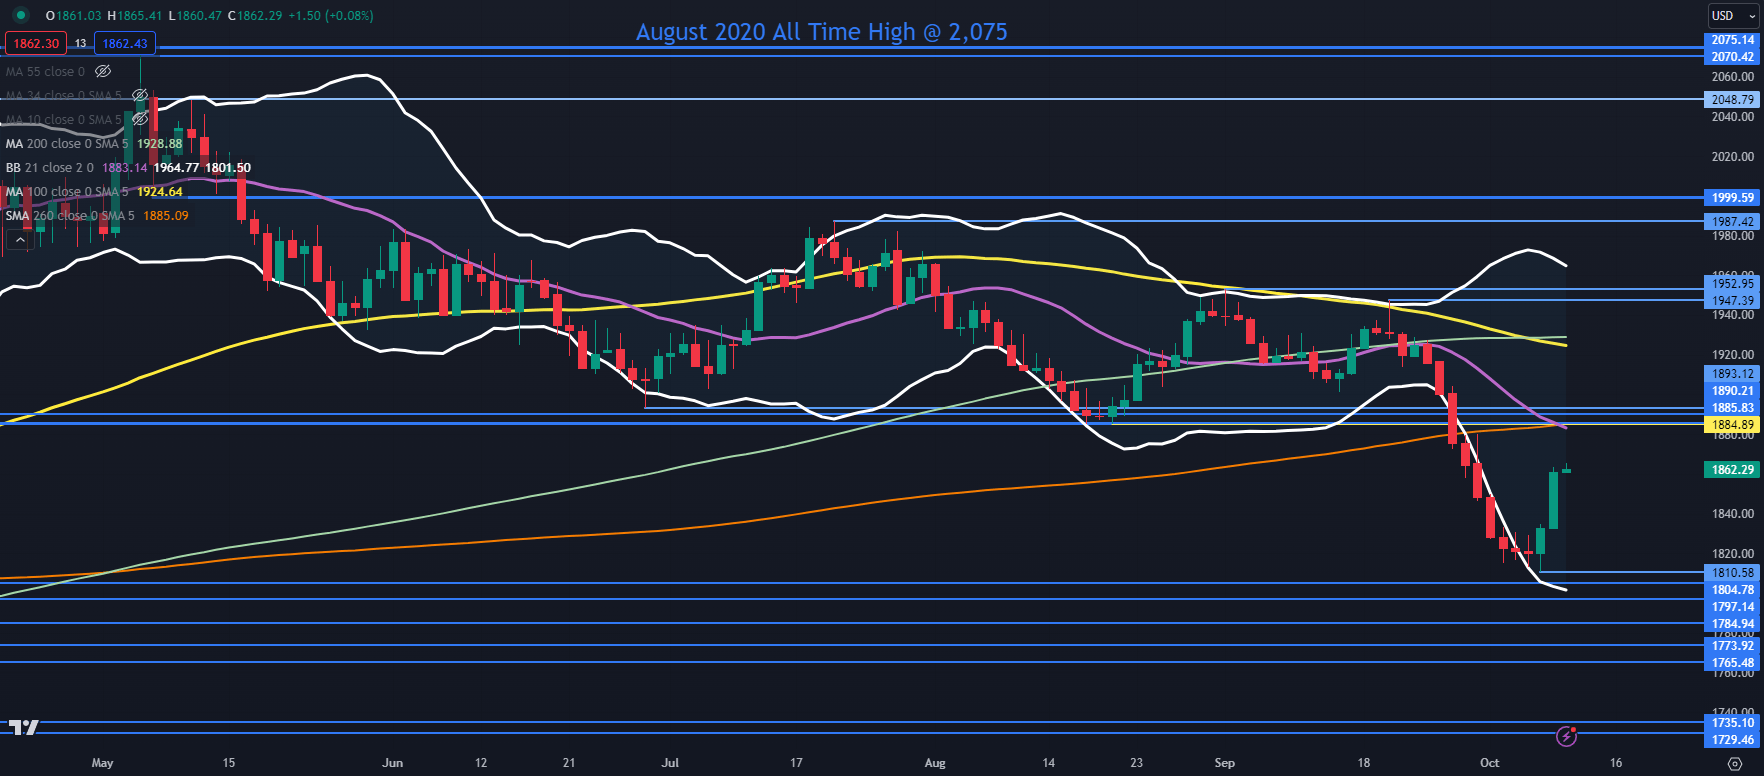
The recent sell-off broke below the lower band of the 21-day simple moving average (SMA) based Bollinger Band.

Last Thursday it closed back inside the band to signal a pause in the bearish run and the consequent reversal. Click on the banner below to learn more bout Bollinger Bands.

Resistance could be in the 1885 – 1895 area where there are a series of breakpoints with the 21- and 260-day SMAs just below that zone, which may add to resistance.

Further up, the 100- and 200-day SMA lie ahead of 1930 and could offer resistance.

On the downside, support might be at the previous lows of 1810, 1805, 1797, 1785, 1774, 1766 and 1735.

SPOT GOLD CHART

image2.png


British Pound Technical Update: Sterling Makes Progress, but Broader Bearish Posture Holds

British Pound Technical Update: Sterling Makes Progress, but Broader Bearish Posture Holds

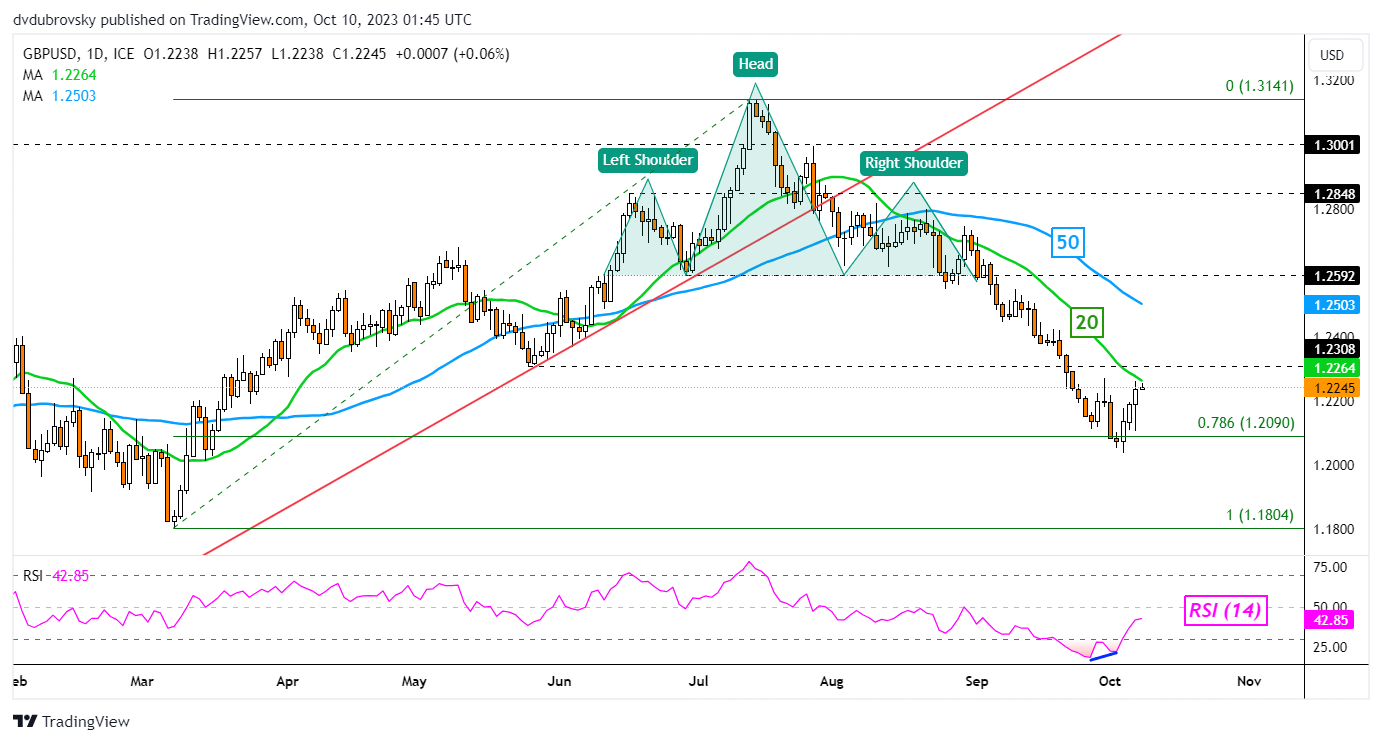
The British Pound has been making upside progress against the US Dollar and Euro. With regards to GBP/USD, the past 3 trading sessions have produced a gain of about 0.9%. This is marking the best 3-day performance since the middle of July. Recent gains have brought Sterling to the edge of the 20-day Moving Average on the daily chart below.

This also followed positive RSI divergence, showing that downside momentum was fading. The moving average may hold, reinstating the broader downside focus. If not, the 50-day could be tested thereafter. As such, while GBP/USD has been pushing higher recently, further progress is needed to offer a bullish technical bias. Clearing under support exposes the March low of 1.1804.

GBP/USD – Daily Chart

GBP/USD – Daily Chart

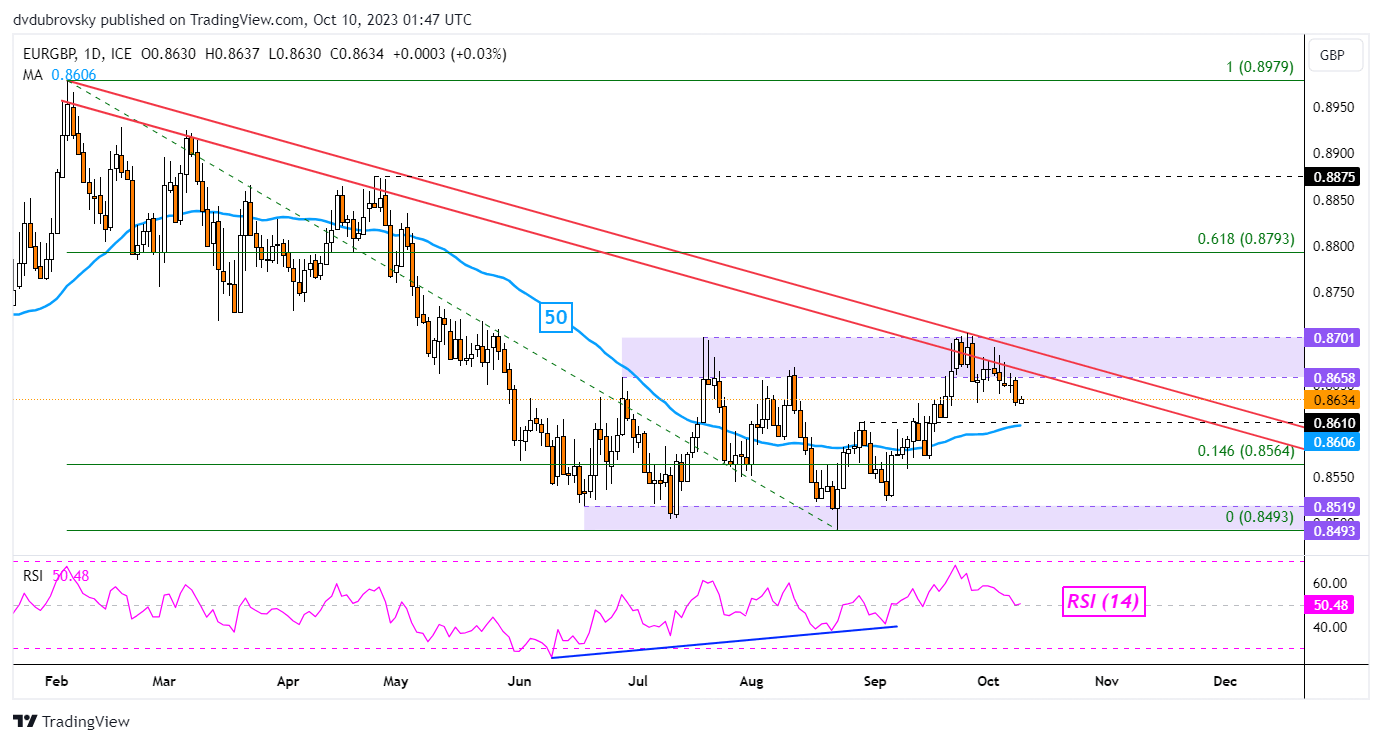
Meanwhile, things are also looking slightly optimistic in EUR/GBP for the British Pound. Recently, prices rejected the 0.8658 – 0.8701 resistance zone, as well as the falling range of resistance from February. This is placing the focus back towards a neutral technical bias where the exchange rate fluctuates between resistance (0.8701 – 0.8658) and support (0.8493 – 0.8519).

Immediate support is a combination of the 50-day moving average and the 0.861 inflection point. Breaking lower places the focus on the minor 14.6% Fibonacci retracement at 0.8564. Breaking under this exposes the zone of support. Otherwise, a bullish technical bias entails clearing the range of resistance, exposing the 61.8% Fibonacci retracement level.

EUR/GBP – Daily Chart

image2.png


S&P 500 & Nasdaq Rebound from Key Support; How Much More Upside?

S&P 500 & Nasdaq Rebound from Key Support; How Much More Upside?

Despite the escalation in geopolitical tensions, US indices have rebounded from key support after an apparent dovish shift by US Federal Reserve officials. Dallas Fed president Lorie Logan and Fed Vice Chair Philip Jefferson highlighted the recent tightening in financial conditions as a result of the sharp rise in yields, lessening the need for further interest rate hikes.

Oversold conditions, light positioning, and positive seasonality raise the bar for a material downside in US equities ahead of the upcoming earnings season. At the same time, rising US real yields/cost of borrowing pose constraints on the upside.

S&P 500: Holds 200-DMA support

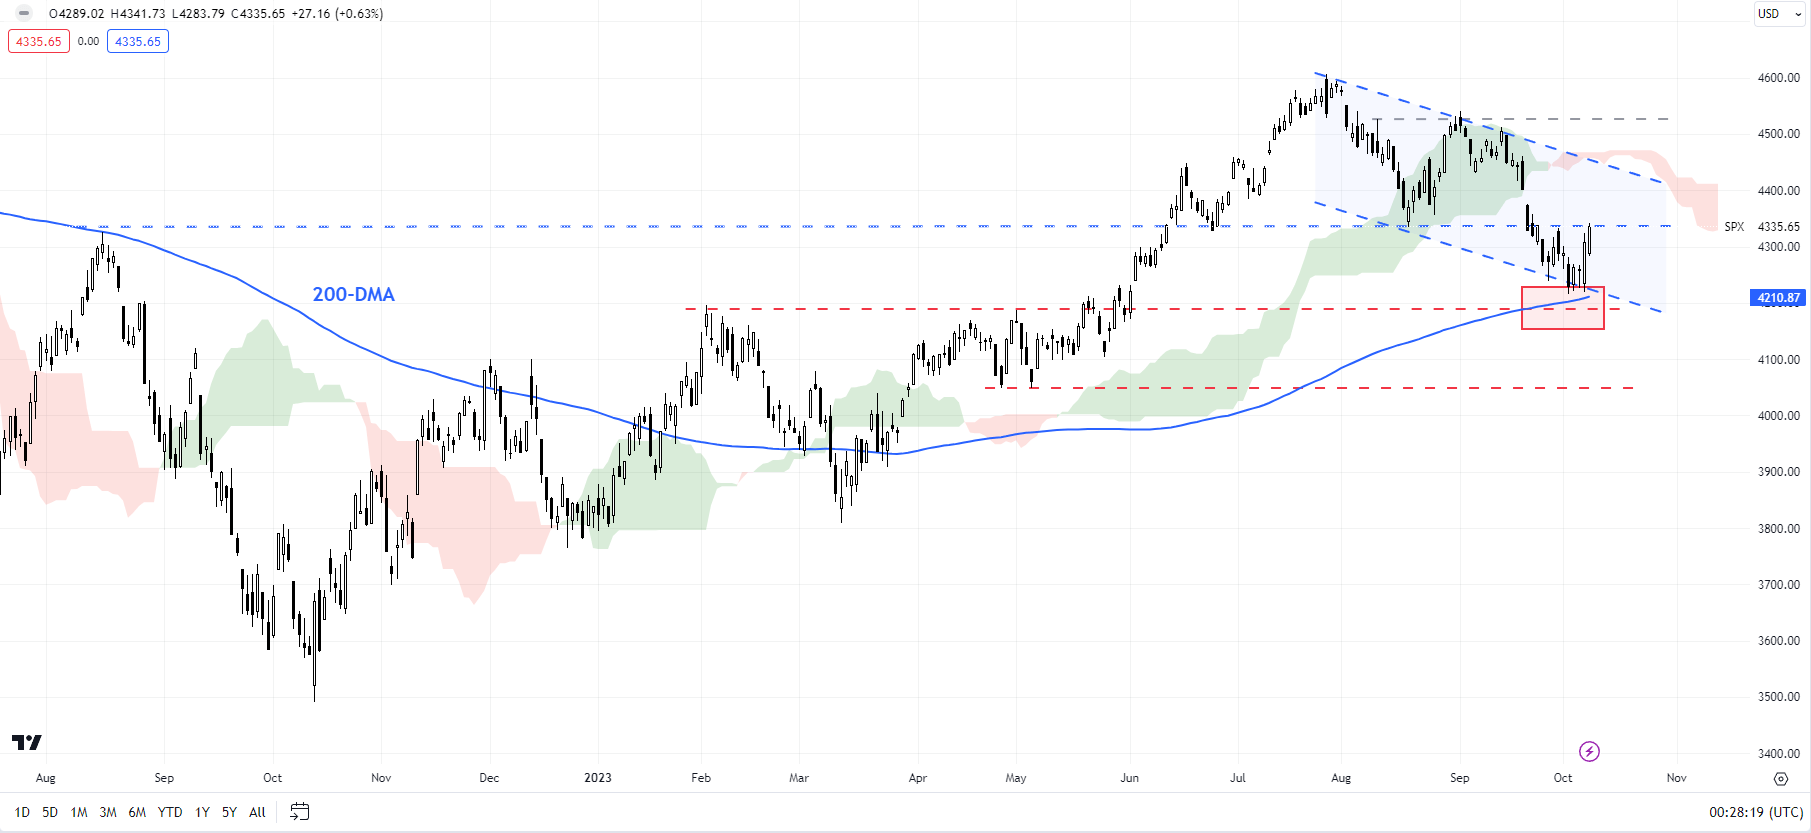
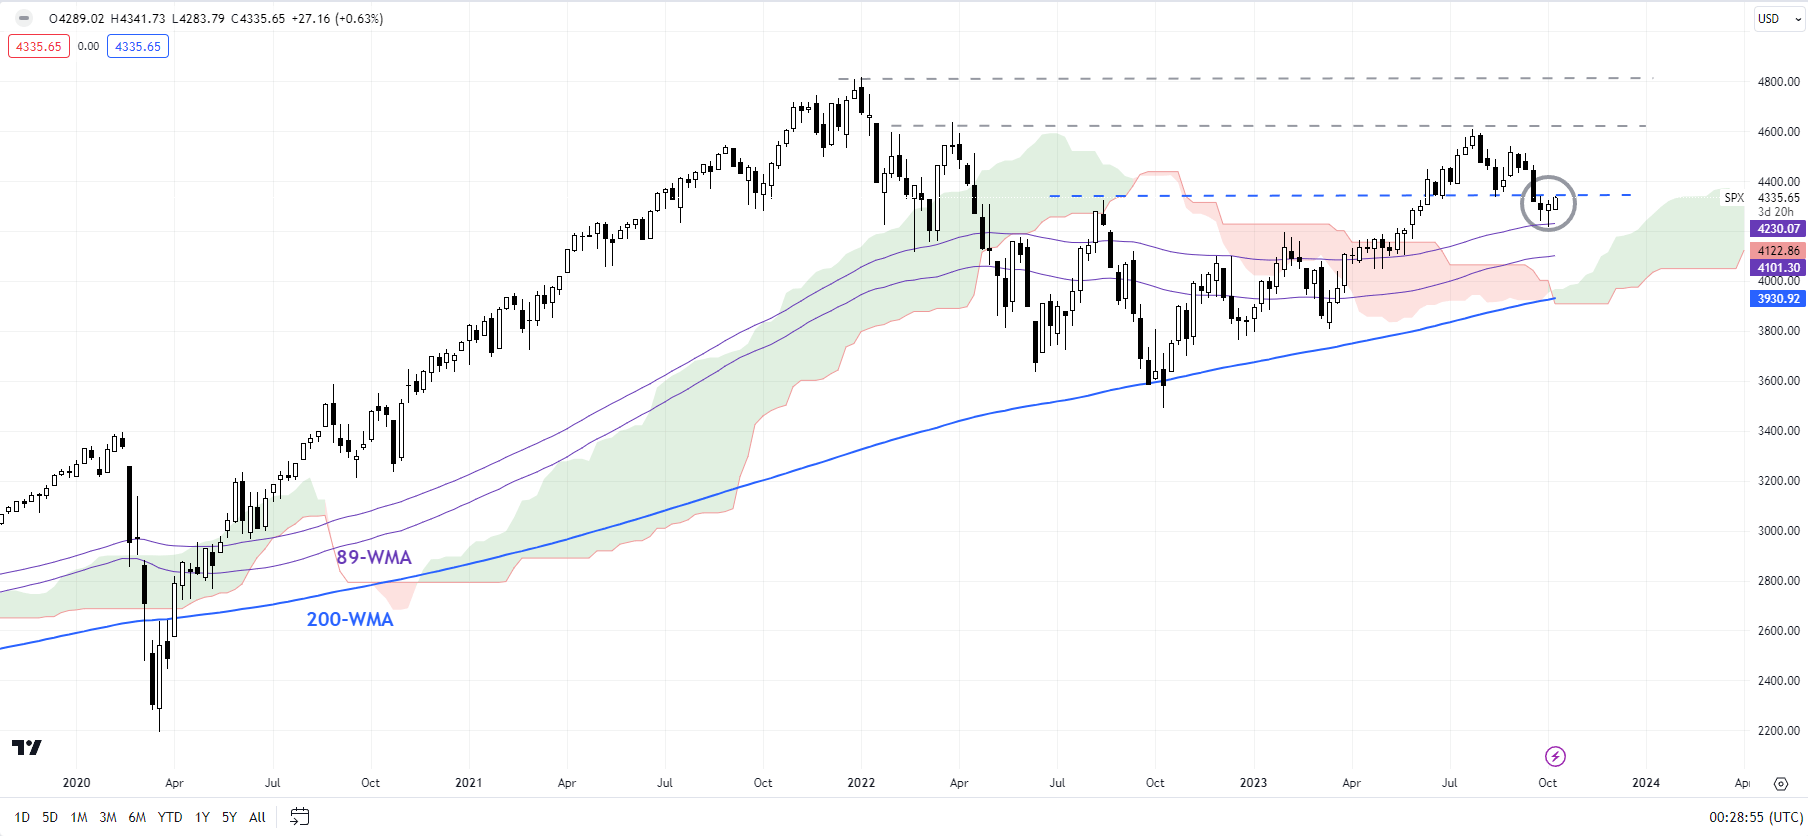
The S&P 500 is holding above quite strong converged support on the 200-day moving average and the lower edge of a declining channel from August,a risk highlighted in the previous update. This follows a fall below vital converged support, including the June low of 4325 and the lower edge of the Ichimoku cloud on the daily charts last month, which confirmed that the broader upward pressure had faded.

S&P 500 Daily Chart

image1.png

Unless the index is able to clear, at minimum, the early-September high of 4542, the path of least resistance is broadly sideways at best. Ahead of 4542, the index needs to deal with the mid-August low of 4335 followed by the upper edge of the channel. On the downside, any break below the 200-day moving average could expose the downside initially toward the end-April low of 4050.

S&P 500 Weekly Chart

image2.png


Nasdaq 100: Rebounds from Key Support

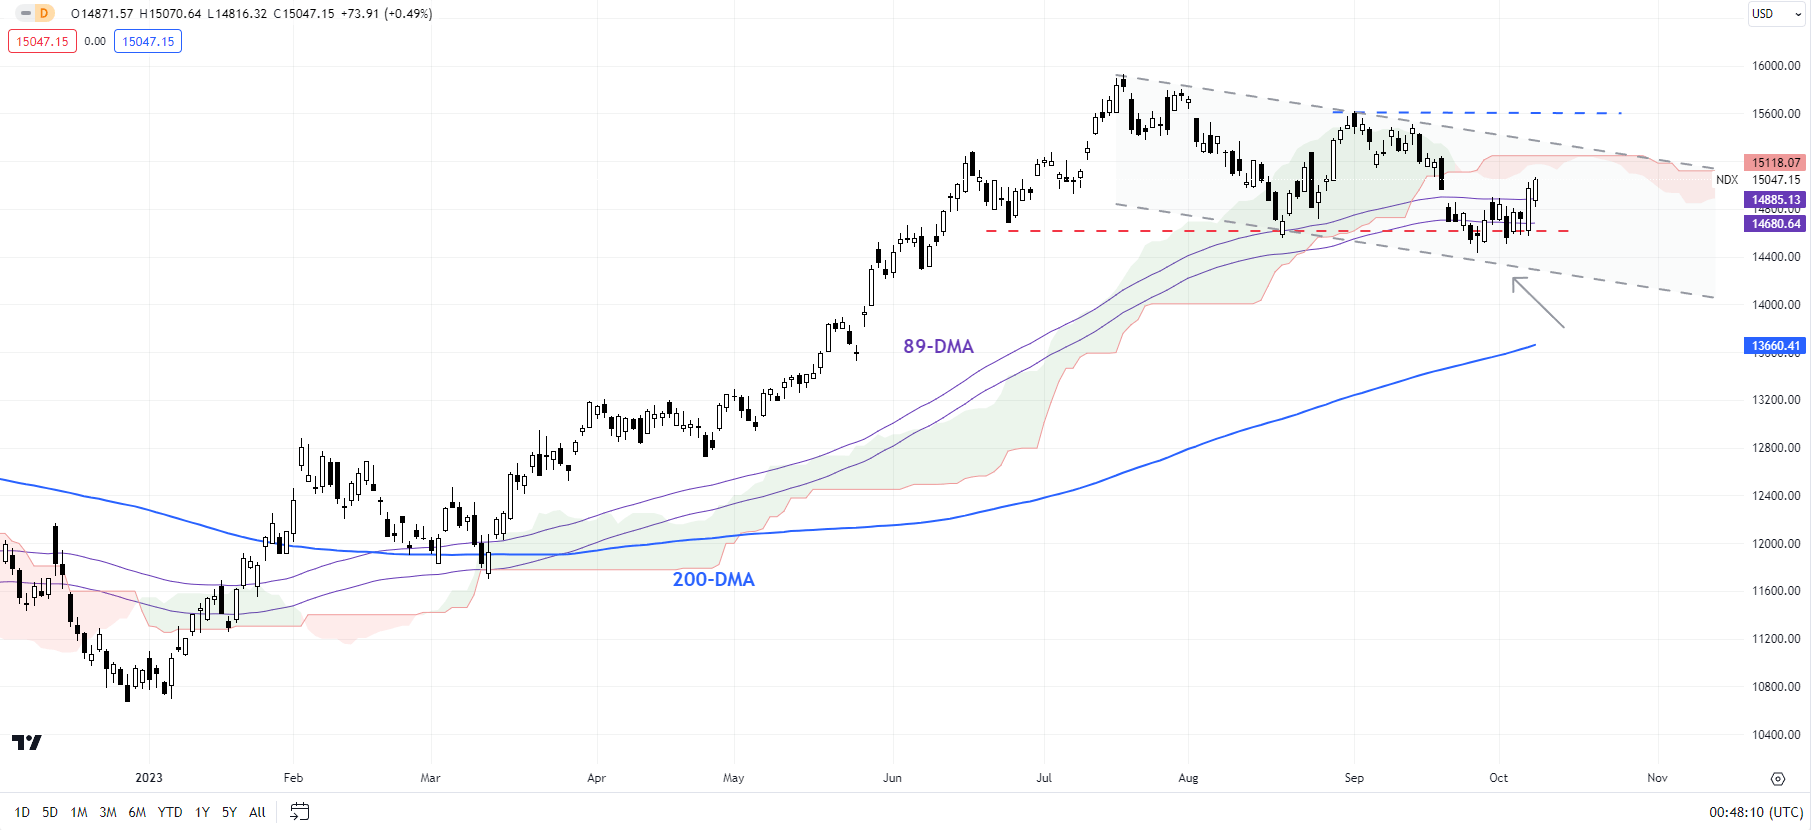
The Nasdaq 100 index’s rise on Monday above minor resistance at last week’s high of 14900 has reduced immediate downside risks. This follows a rebound from crucial converged support: a horizontal trendline from June (at about 14550-14560), the lower edge of a slightly downward-sloping channel from July, and the mid-August low.

Nasdaq 100 Daily Chart

image3.png

This support has been vital and a break below would trigger a head & shoulders pattern – the left shoulder is at the June high, the head is at the July high, and the right shoulder is at the early-September high. Still, for the bearish pattern to be negated, the index needs to clear significant hurdles at the early-September high of 15618, not too far from the July high of 15932.

From a big-picture perspective, as highlighted in arecent update, the momentum on the monthly charts has been feeble compared with the huge rally since late 2022, raising the risk of a gradual weakening, similar to the gradual drift lower in gold since May. For more discussion, see “Is Nasdaq Following Gold’s Footsteps? NDX, XAU/USD Price Setups,” published August 14.

Euro Holds Ground as US Dollar Faces Headwinds on a Dovish Fed. Higher EUR/USD?

Euro Holds Ground as US Dollar Faces Headwinds on a Dovish Fed. Higher EUR/USD?

The Euro has held recent gains with currencies settling into Tuesday’s trade after a busy start to the week as markets look to decipher the implications of a protracted conflict evolving in Israel and Palestine.

Spot gold remains above US$ 1,860 on perceived haven status and an overall weaker US Dollar that is on the backfoot with Treasury yields peeling lower after dovish Fed speak overnight.

Federal Reserve Vice Chair Philip Jefferson and Dallas Fed President Lorie Logan both cited the backing up of long-end Treasury yields as potentially doing the desired tightening that the Fed had been trying to achieve.

Physical Treasury markets re-opened today after a holiday Monday and the 10-year note is trading below 4.65% after nudging 4.88% last Friday.

Equities have been buoyed by the prospect of the Fed holding fire on any further hawkishness.

Japan’s Nikkei 225 index rallied over 2% today after returning from a holiday on Monday. Most APAC equity indices are in the green with the exception of mainland China where the CSI 300 index slid around 0.50%.

Equity indices futures are pointing toward a steady start for European and US bourses.

EUR/USD is trading near 1.0560 at the time of going to print while GBP/USD is holding above 1.2200.

Crude oil and natural gas futures remain buoyed on the unfolding Middle East situation with the WTI futures contract near US$ 86 bbl while the Brent contract is a touch above US$ 87.50 bbl.

Several fed speakers will be crossing the wires later today, including Roberto Perli, Raphael Bostic, Christopher Waller, Neill Kashkari and Mary Daly

The ECB’s Francois Villeroy de Galhau will also be making comments today.

EUR/USD TECHNICAL ANALYSIS SNAPSHOT

EUR/USD remains in a descending trend channel despite the recent rally.

Nearby resistance could be at the breakpoint and recent high at 1.0617 ahead of another prior peak at 1.0673 that coincides with the 34-day simple moving average (SMA).

Further up, the 100- and 200-day SMAs may offer resistance near the breakpoint at 1.0830.

On the downside, support might lie near the recent lows of 1.0480 and 1.0440.


Asian Indices Hold Support on Dovish Fed Remarks: Hang Seng, Kospi, Topix Setups

Asian Indices Hold Support on Dovish Fed Remarks: Hang Seng, Kospi, Topix Setups

Hang Seng Index: Downward momentum is picking up

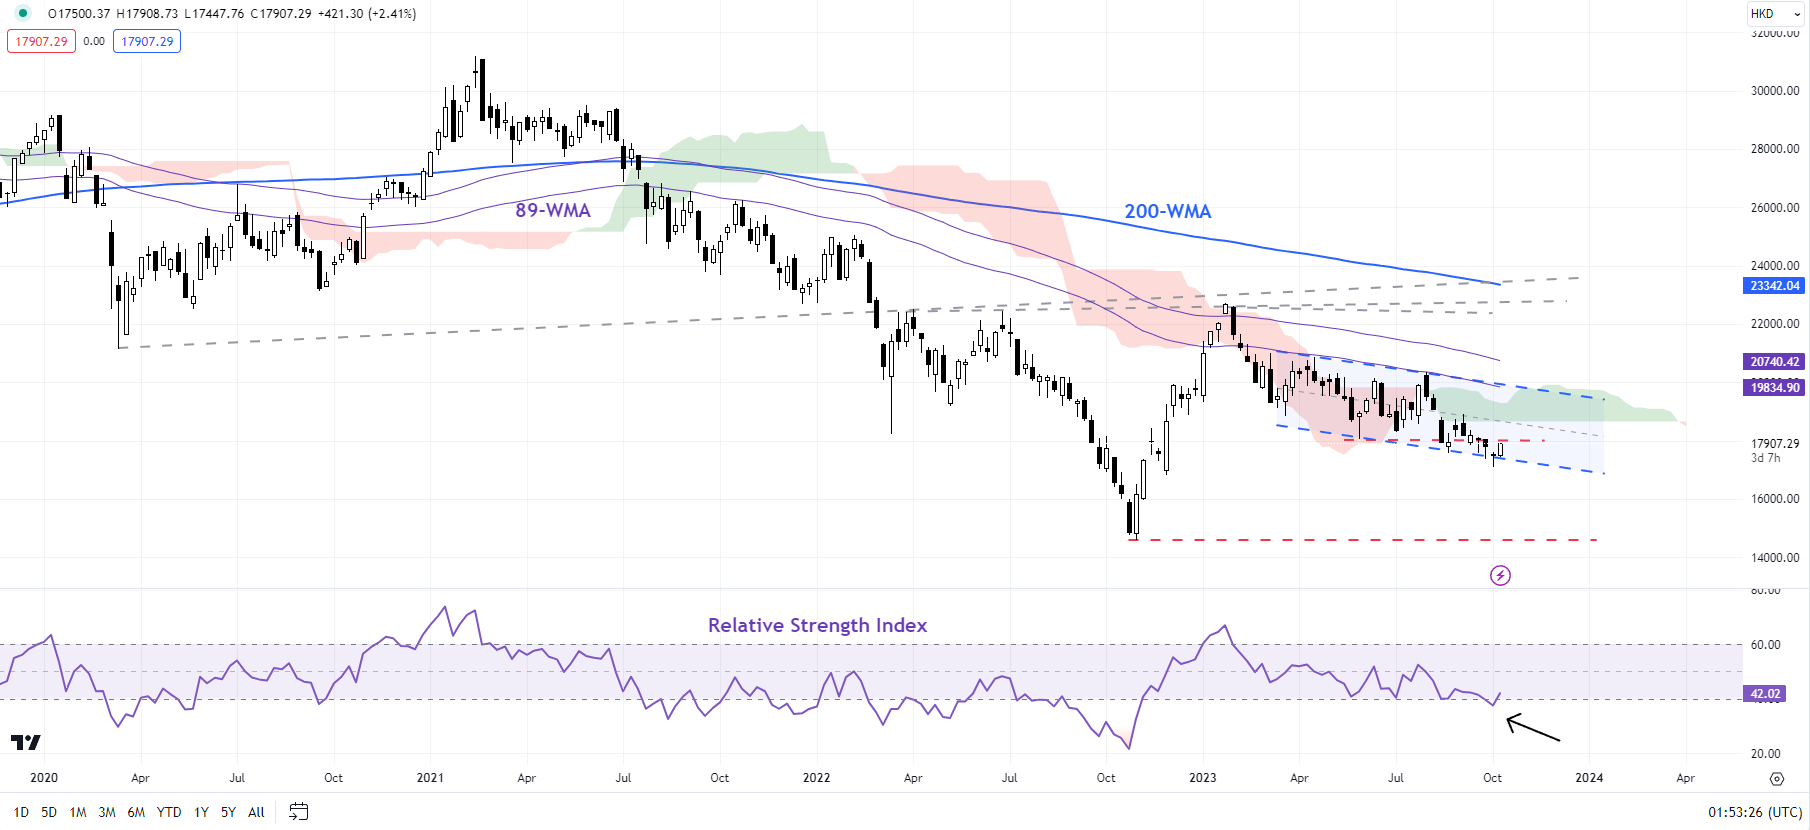
Hang Seng is attempting to rebound from near a crucial cushion area, including the May low of about 18000 and the lower edge of a declining channel since early 2023 (at about 17400). Oversold and under-ownership conditions limit a significant downside potential from here, especially given a spate of policy support measures recently. For more discussion see, “Q4 Trade Opportunity: HK/China Equities Could be Due for a Rebound,” published October 9. Below that, the next support is at the 2022 low of 14600.

Hang Seng Index Daily Chart

image1.png

Chart Created Using TradingView

On lower timeframe charts, the index is testing a stiff hurdle at Friday’s high of 17935 – a break above this ceiling is needed for immediate downside risks to fade. Beyond the very near term, Hang Seng needs to, at minimum, clear the early-September high of 18900 to raise the odds for a turnaround in the medium-term downtrend.

Kospi: The downside could be limited for now

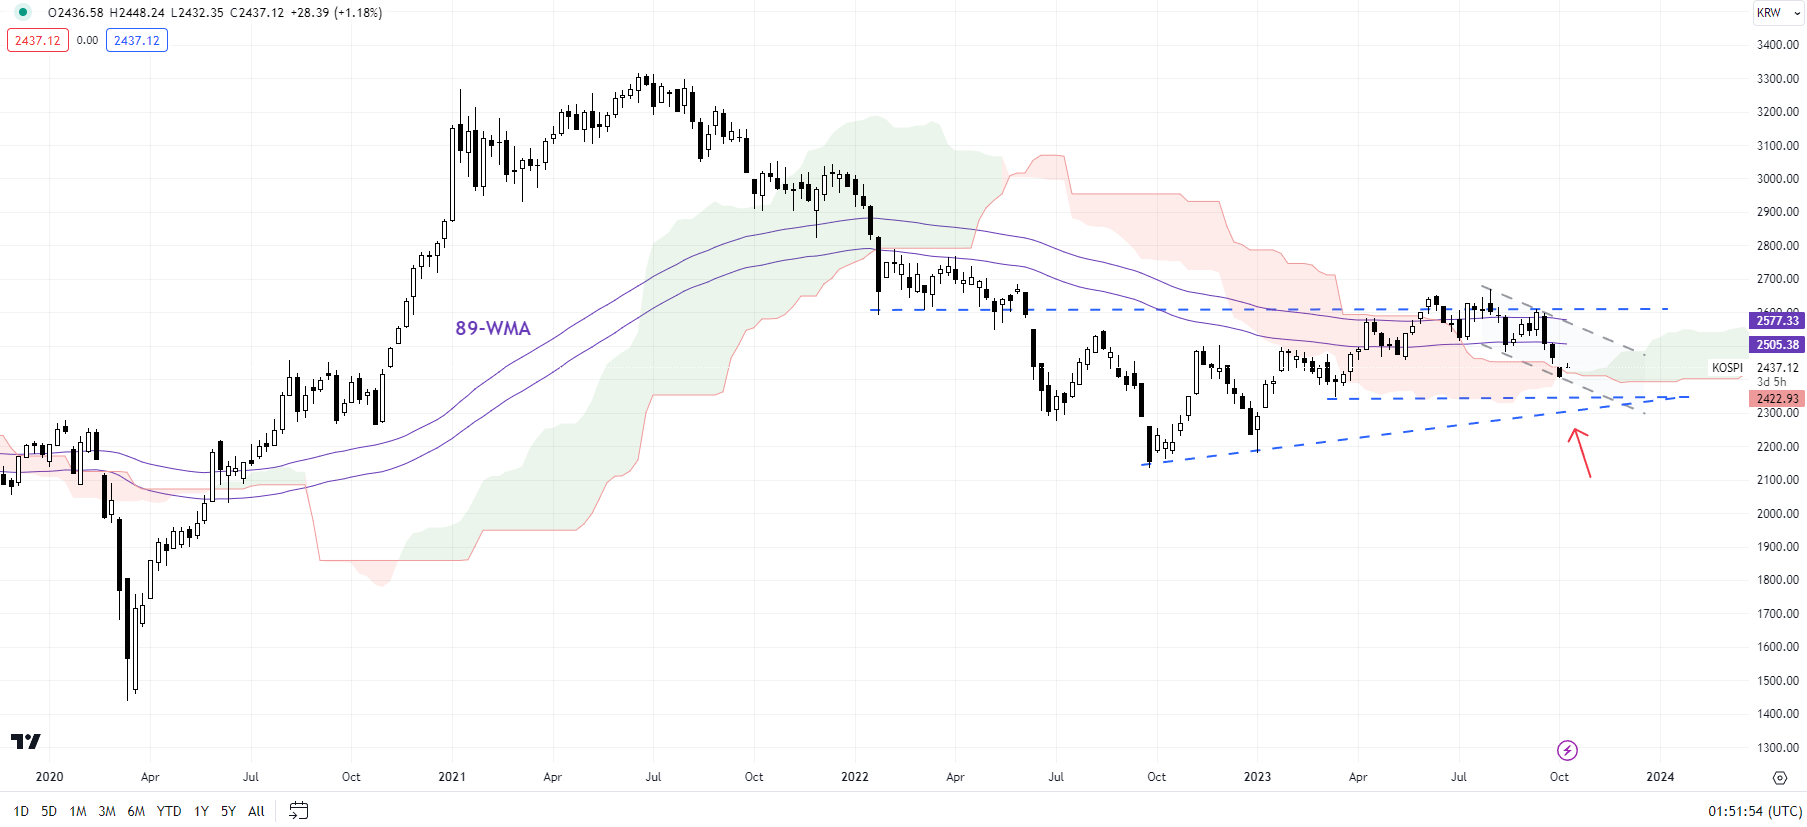
Kospi is nearing fairly strong converged support, including the lower edge of the Ichimoku cloud on the weekly charts, around the lower edge of a declining channel from August. While the upward pressure had undoubtedly eased in the near term, Kospi would need to fall below the March low of 2350 for material downside risks to emerge. In the absence, the bias appears to be sideways to up.

Kospi Weekly Chart

image2.png

Earlier last month, Kospi fell below vital support at the July low of 2515, confirming that the multi-week uptrend was about to change. The index’s fall below 2515 has triggered a minor double top (the June and August highs) that opened the way toward 2380. Major support is at the March low of 2350 – the index needs to remain above this support if the eight-month-long rally has to extend.

Topix: Tough support to restrict downside

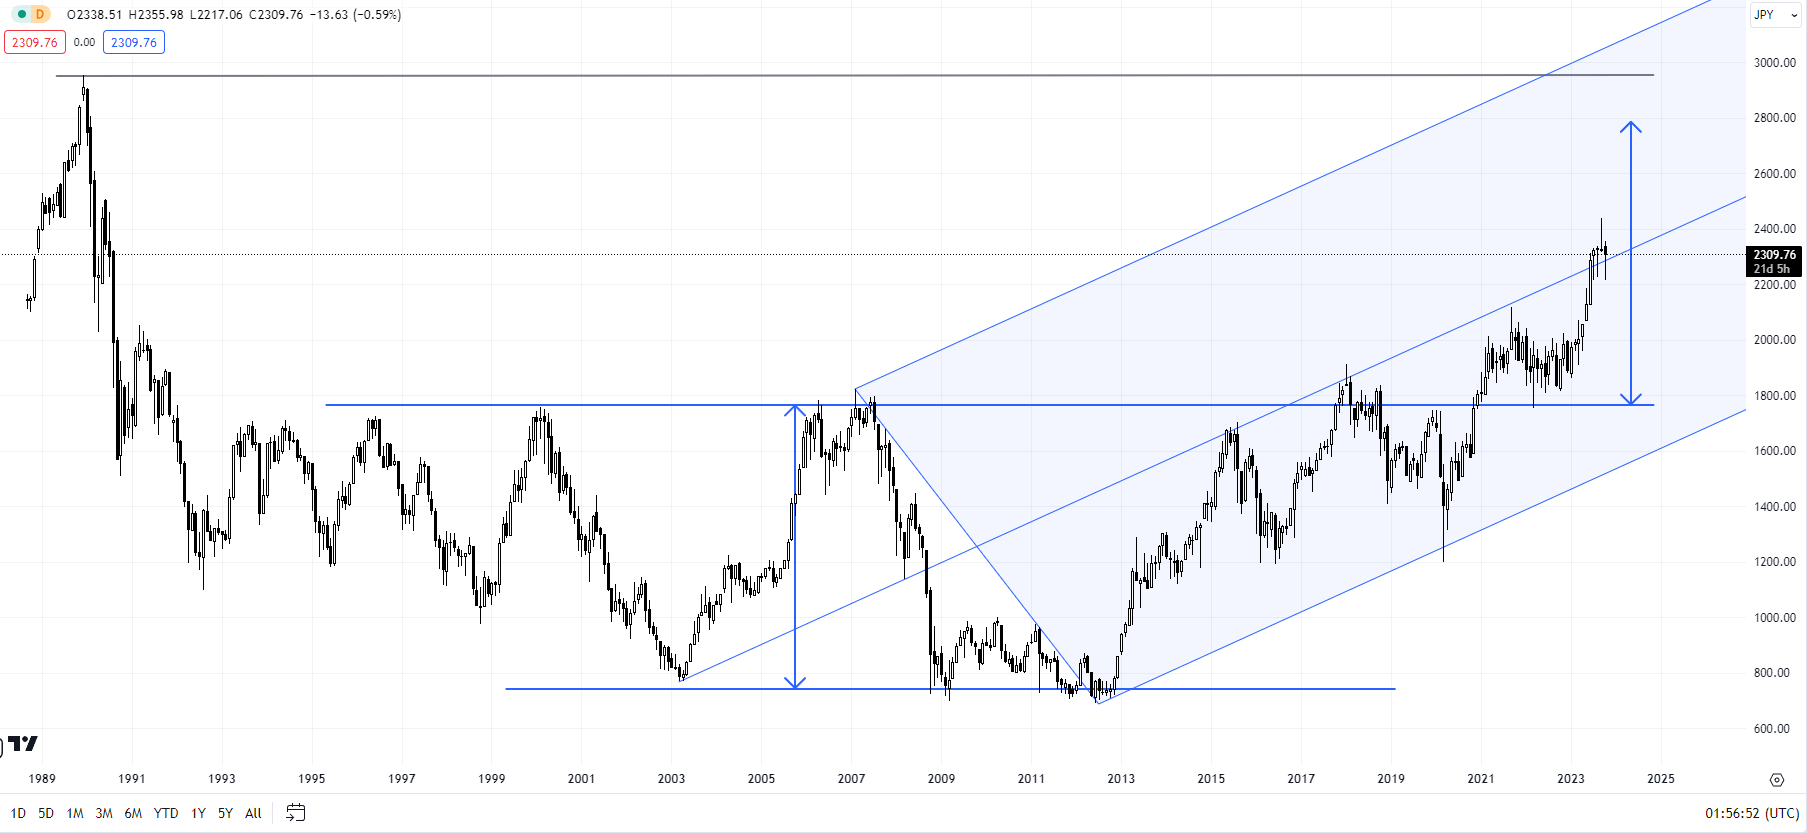
Topix has rebounded from near a vital floor at the July and August lows of 2225. This support is strong and is unlikely to break easily in the context of the broader uptrend. Chances are that the recent retreat is nothing but a consolidation/pause within the uptrend. The retreat came about from around a tough resistance on the medium line of a rising pitchfork channel from 2003 – which has truncated rallies in recent years.

Topix Monthly Chart

image3.png

The index has shown gradual signs of strength in recent years, with the break above a horizontal trendline from the mid-1990s turning out to be unambiguously bullish. Unless the index falls below the resistance-turned-support at the 2021 high of 2120, the broader upward pressure remains intact

Crypto News: Sam Bankman-Fried Trial Set to Resume with Crypto-Spot ETF Updates in Focus

Crypto News: Sam Bankman-Fried Trial Set to Resume with Crypto-Spot ETF Updates in Focus

HTX Global Hacker Returned Stolen Funds

On Saturday, Lookonchain announced the return of 4,999 ETH in stolen funds to Huobi Global.

The hacker acknowledged the white hat bonus offer, providing a wallet address for payment. Additionally, the hacker outlined the weakness in the system, saying,

Trading Derivatives carries a high level of risk to your capital and you should only trade with money you can afford to lose. Trading Derivatives may not be suitable for all investors, so please ensure that you fully understand the risks involved, and seek independent advice if necessary. A Product Disclosure Statement (PDS) can be obtained either from this website or on request from our offices and should be considered before entering into a transaction with us. Raw Spread accounts offer spreads from 0.0 pips with a commission charge of USD $3.50 per 100k traded. Standard account offer spreads from 1 pips with no additional commission charges. Spreads on CFD indices start at 0.4 points. The information on this site is not directed at residents in any country or jurisdiction where such distribution or use would be contrary to local law or regulation.

“Your system hot wallet private key leak, you should change system hot wallet address and reduce the system hot wallet rate.”

Hackers accessed a Huobi hot wallet in late September, stealing 5,000 ETH. Huobi announced a 5% white hat bonus to the hackers.

Sam Bankman-Fried Trial to Resume after a Bruising Start to Proceedings

Former FTX CEO Sam Bankman-Fried will return to court for the resumption of the US vs. Sam Bankman-Fried (SBF) trial.

Last week, FTX co-founder Gary Wang delivered damaging testimony. Under questioning, Gary Wang admitted committing crimes at FTX, naming Sam Bankman-Fried, Caroline Ellison, and Nishad Singh as co-conspirators. Significantly, Wang said they allowed Alameda Research to withdraw unlimited funds under SBF direction to write code to grant Alameda Research access to FTX user accounts.

SBF lawyers will likely cross-examine Wang before the prosecution moves on to new witnesses. Former CEO of Alameda Research Caroline Ellison may testify against SBF this week. Ellison agreed to give testimony against SBF as part of a plea deal with the US Department of Justice.

As the trial progresses, the crypto community may attempt to distance themselves from SBF.

Amicus Curiae attorney John E. Deaton had this to say about SBF and SBF sympathizers,

“People who believe SBFraud is a good guy who made mistakes, and FTX grew too fast, and it all got away from him, should NEVER be in charge of other people’s money, and certainly, should never be interviewed by 60 Minutes or any other news outlet. And yes, his parents are 100% complicit.”

Technical Analysis

Bitcoin Analysis

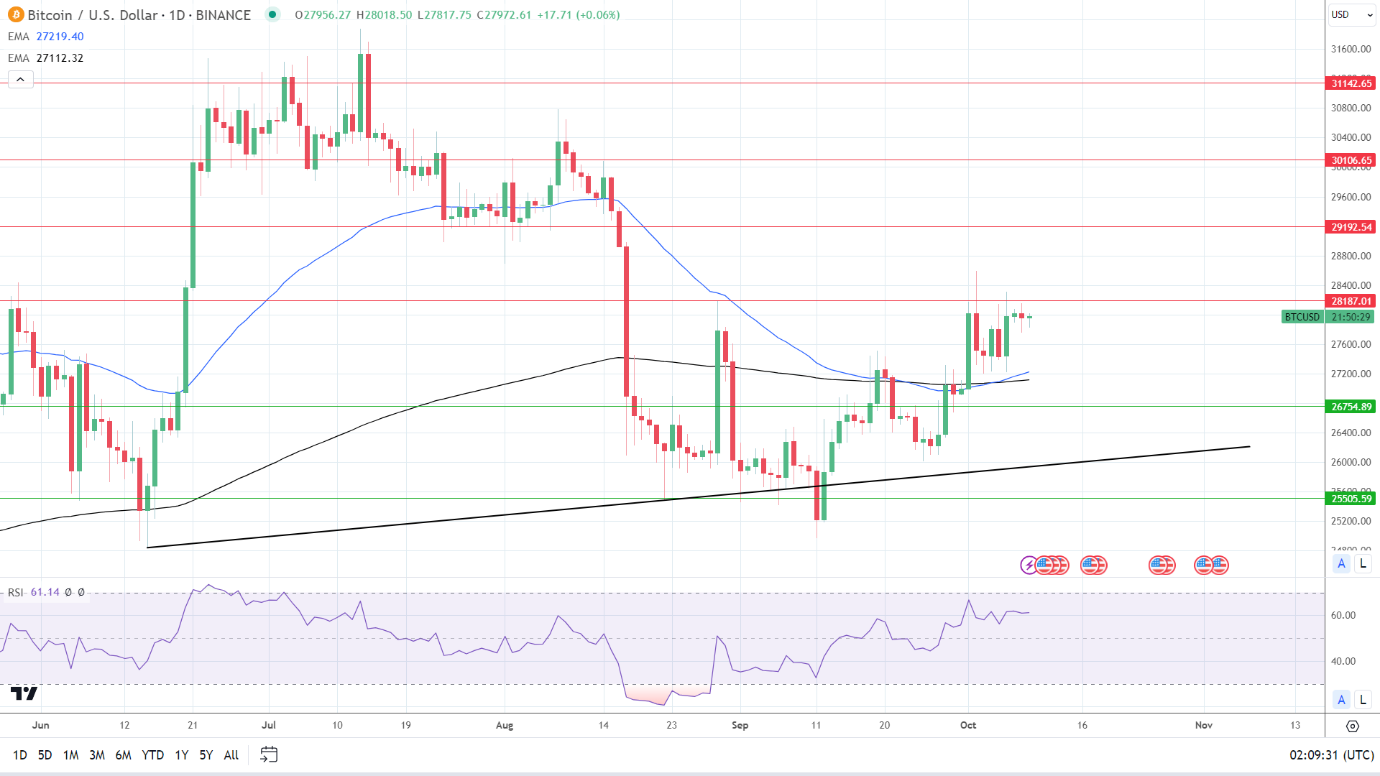
BTC sat above the 50-day and 200-day EMAs, affirming bullish price signals. The 50-day EMA pulled further away from the 200-day EMA, reaffirming a bullish trend.

A BTC move through the $28,187 resistance level would support a run at the October high of $28,593.

However, a break below the EMAs would give the bears a run at the $26,755 support level.

BTC-spot ETF-related updates and SEC v Coinbase (COIN) and Ripple case-related news would offer direction.

The 14-Daily RSI reading of 61.14 suggests a BTC move through the $28,187 resistance level before entering overbought territory.

BTC Daily Chart sends bullish price signals.
BTCUSD 091023 Daily Chart

Ethereum Analysis

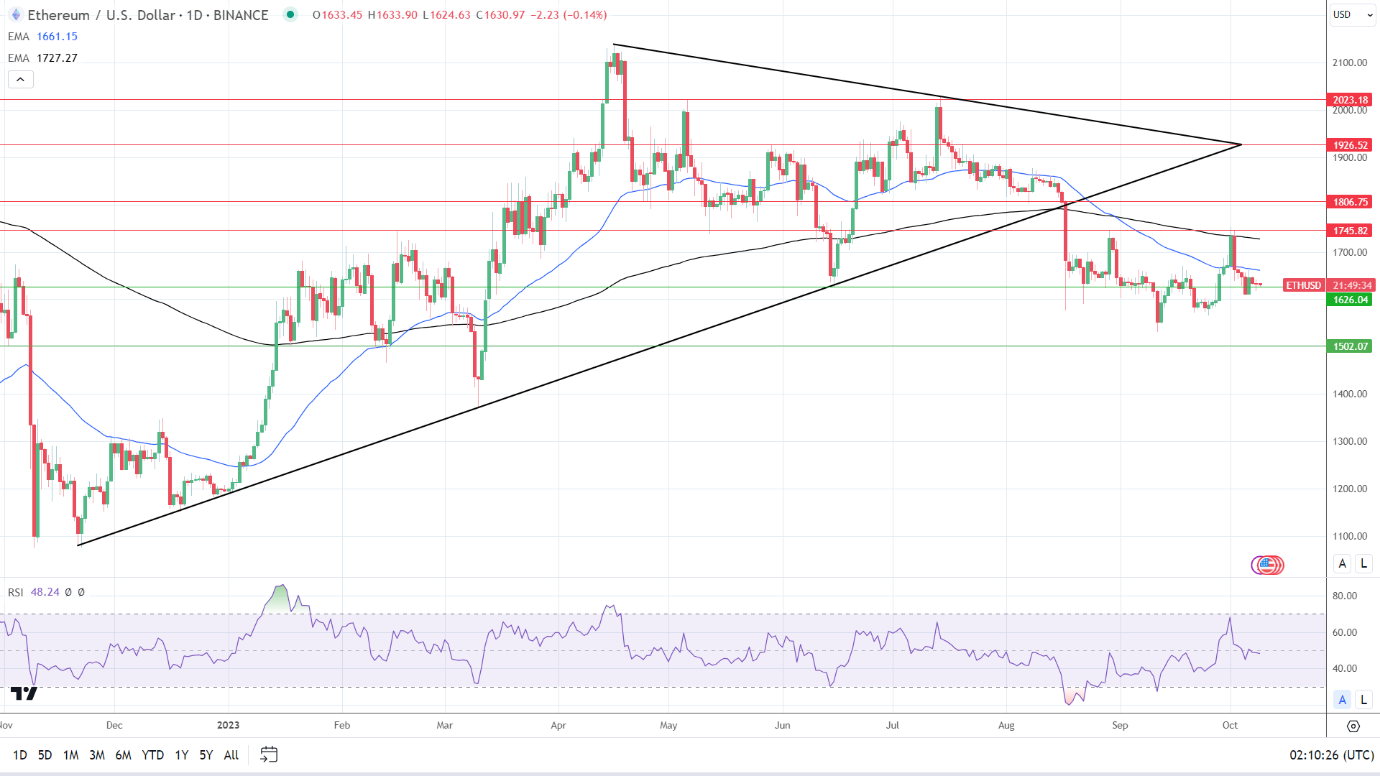
ETH sat below the 50-day and 200-day EMAs, affirming bearish price signals.

An ETH break above the 50-day EMA would give the bulls a run at the 200-day EMA and $1,746 resistance level.

Inflows into ETH-Futures ETFs and ETH-spot ETF-related news will likely influence buyer appetite.

However, a fall below the $1,626 support level would support a move to $1,600. An ETH break below $1,600 would bring the $1,502 support level into view.

The 14-Daily RSI reading of 48.24 indicates an ETH fall below $1,600 before entering oversold territory.

ETH Daily Chart sends bearish price signals.
ETHUSD 091023 Daily Chart
DAX Index: Geopolitical Tensions and the German Economy in Focus

DAX Index: Geopolitical Tensions and the German Economy in Focus

DAX Friday Overview

On Friday, the DAX gained 1.06%. Reversing a 0.20% loss from Thursday, the DAX ended the week down 1.02% to 15,230.

German Factory Orders and US Wage Growth Offer Support

Trading Derivatives carries a high level of risk to your capital and you should only trade with money you can afford to lose. Trading Derivatives may not be suitable for all investors, so please ensure that you fully understand the risks involved, and seek independent advice if necessary. A Product Disclosure Statement (PDS) can be obtained either from this website or on request from our offices and should be considered before entering into a transaction with us. Raw Spread accounts offer spreads from 0.0 pips with a commission charge of USD $3.50 per 100k traded. Standard account offer spreads from 1 pips with no additional commission charges. Spreads on CFD indices start at 0.4 points. The information on this site is not directed at residents in any country or jurisdiction where such distribution or use would be contrary to local law or regulation.

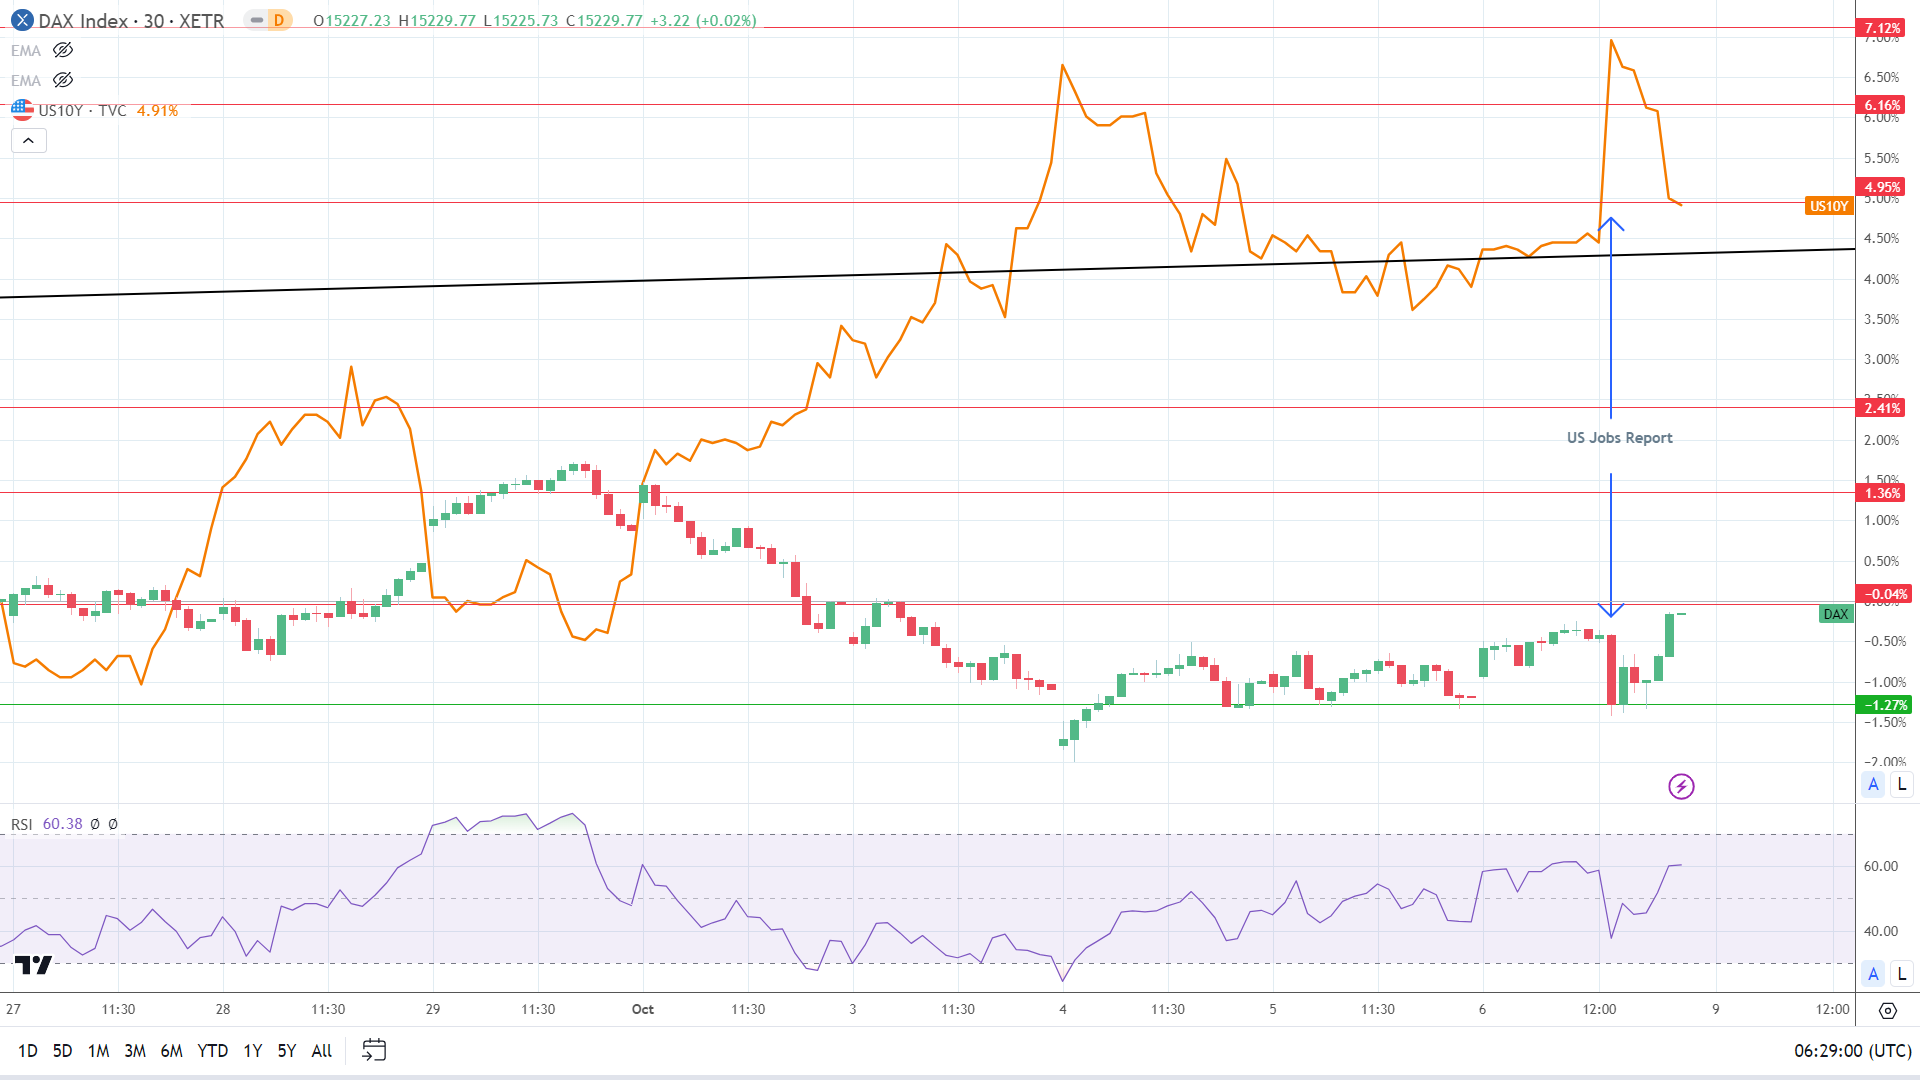
However, the US Jobs Report spooked investors late in the European session. A surge in nonfarm payrolls dragged the DAX into the red before a final-hour rebound. Softer wage growth and a steady unemployment rate eased bets on a more hawkish Fed rate path.

The DAX was inversely correlated with US 10-year Treasury yields as investors considered the likely impact of the Jobs Report on the Fed rate path.

DAX inversely correlated to 10-year US Treasury yields on US Jobs Report release.
DAX 091023 30 Minute ChartThe US equity markets responded favorably to the softer US wage growth and steady unemployment rate. On Friday, the NASDAQ Composite Index gained 1.60%, with the S&P 500 and the Dow rising by 1.18 and 0.87%, respectively.

The Friday Market Movers

Zalando surged by 6.45% to top the DAX. Recent economic indicators fueled hopes of a turnaround in the German economy, driving buyer appetite.

Auto stocks were also up despite the auto sector reporting a fall in factory orders in August. Daimler Truck Holding rallied 2.32%, with Continental (1.87%) and BMW (1.51%) also making solid gains. Porsche and Volkswagen trailed, rising by 0.24% and 0.26%, respectively.

German Industrial Production and China in Focus

Ahead of the European session, movement across the Chinese markets will garner interest. Reopening after the Golden Week holidays, a pullback in the Chinese equity markets will likely weigh on the DAX.

However, investors will respond to the conflict in the Middle East and the threat of a wider regional conflict.

From the economic calendar, the German economy will be in the spotlight again on Monday. After the positive response to the factory orders report, the DAX will likely react to a pickup in German industrial production.

Economists forecast a 0.1% fall in industrial production vs. a decline of 0.8% in July. Investors may show less reaction to a larger-than-expected fall in production. The jump in German factory orders points to a near-term pickup in factory output.

Beyond the numbers, ECB commentary may also influence the appetite for DAX-listed stocks. ECB Executive Board members Luis de Guindos and Andrea Enria are on the ECB calendar to speak today.

Fed Commentary to Influence Treasury Yields and the DAX

Later today, FOMC member speeches will likely influence US Treasury yields and the appetite for riskier assets. FOMC voting members Philip Jefferson, Lorie Logan, and Michael Barr are on the calendar to speak. Comments relating to the US Job Report, the Middle East conflict, and interest rate moves need consideration.

The DAX and NASDAQ mini were down 71 and 113 points this morning. Risk aversion stemming from the conflict in the Middle East left the markets in negative territory.

Short-Term Forecast

Recent German economic indicators suggest a possible turning point for the German economy. A likely end to ECB rate hikes and a pickup in economic activity would support a DAX return to 16,000. However, near-term trends will likely hinge on updates from the Middle East.

DAX Technical Indicators

Daily Chart

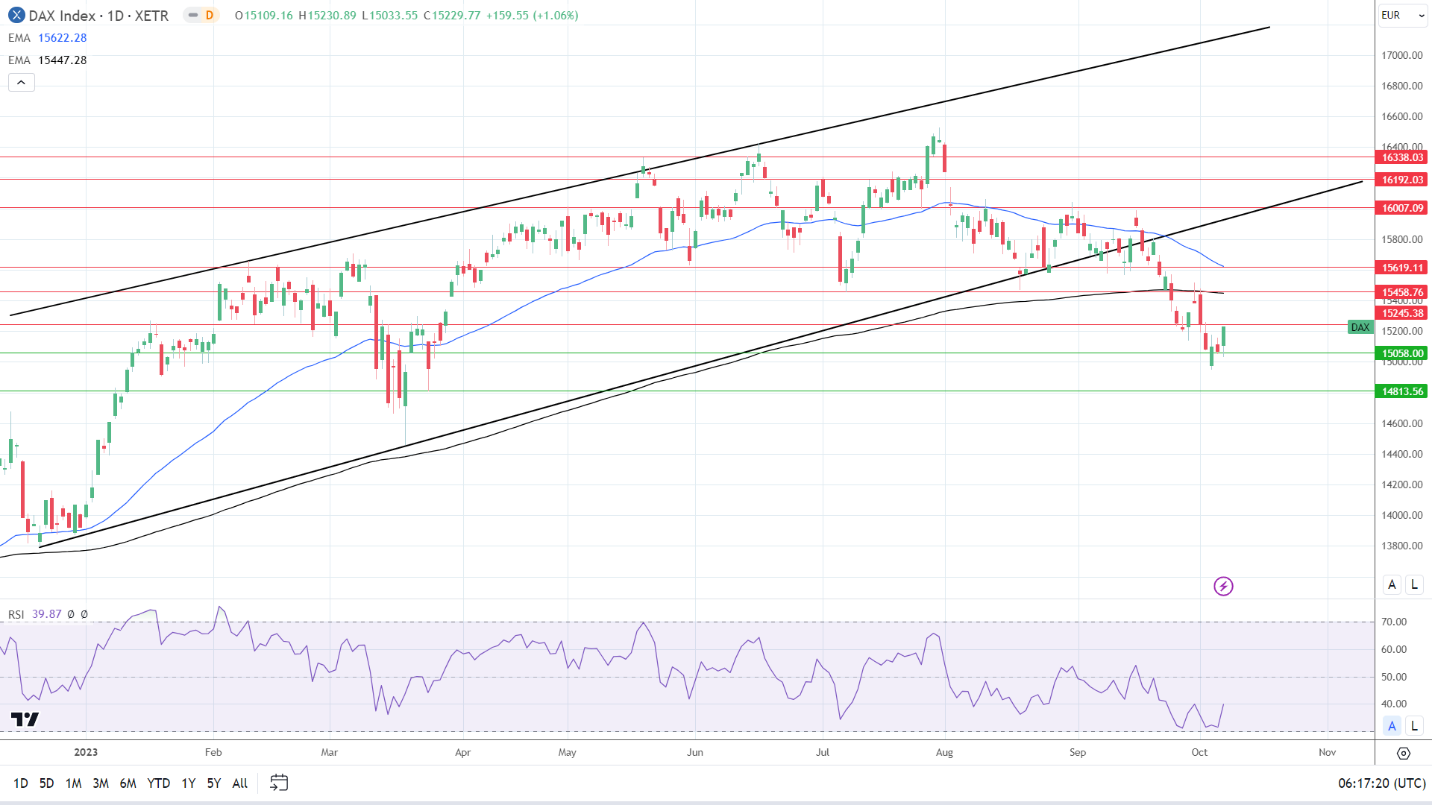
The DAX remained below the 50-day and 200-day EMAs, sending bearish price signals. A break above the 15,245 resistance level would support a move to the 200-day EMA and the 15,459 resistance level.

Easing geopolitical tensions and upbeat German industrial production figures would support a positive session.

However, selling pressure may intensify at 15,450. The 200-day EMA is confluent with the 15,459 resistance level.

Risk-off sentiment and hawkish Fed commentary would weigh on the appetite for riskier assets.

A DAX drop below 15,200 would bring the 15,058 support level into play.

The 14-day RSI reading of 39.87 supports a DAX break below the 15,058 support level before entering oversold territory.

DAX Daily Chart sends bearish price signals.
DAX 091023 Daily Chart

4-Hourly Chart

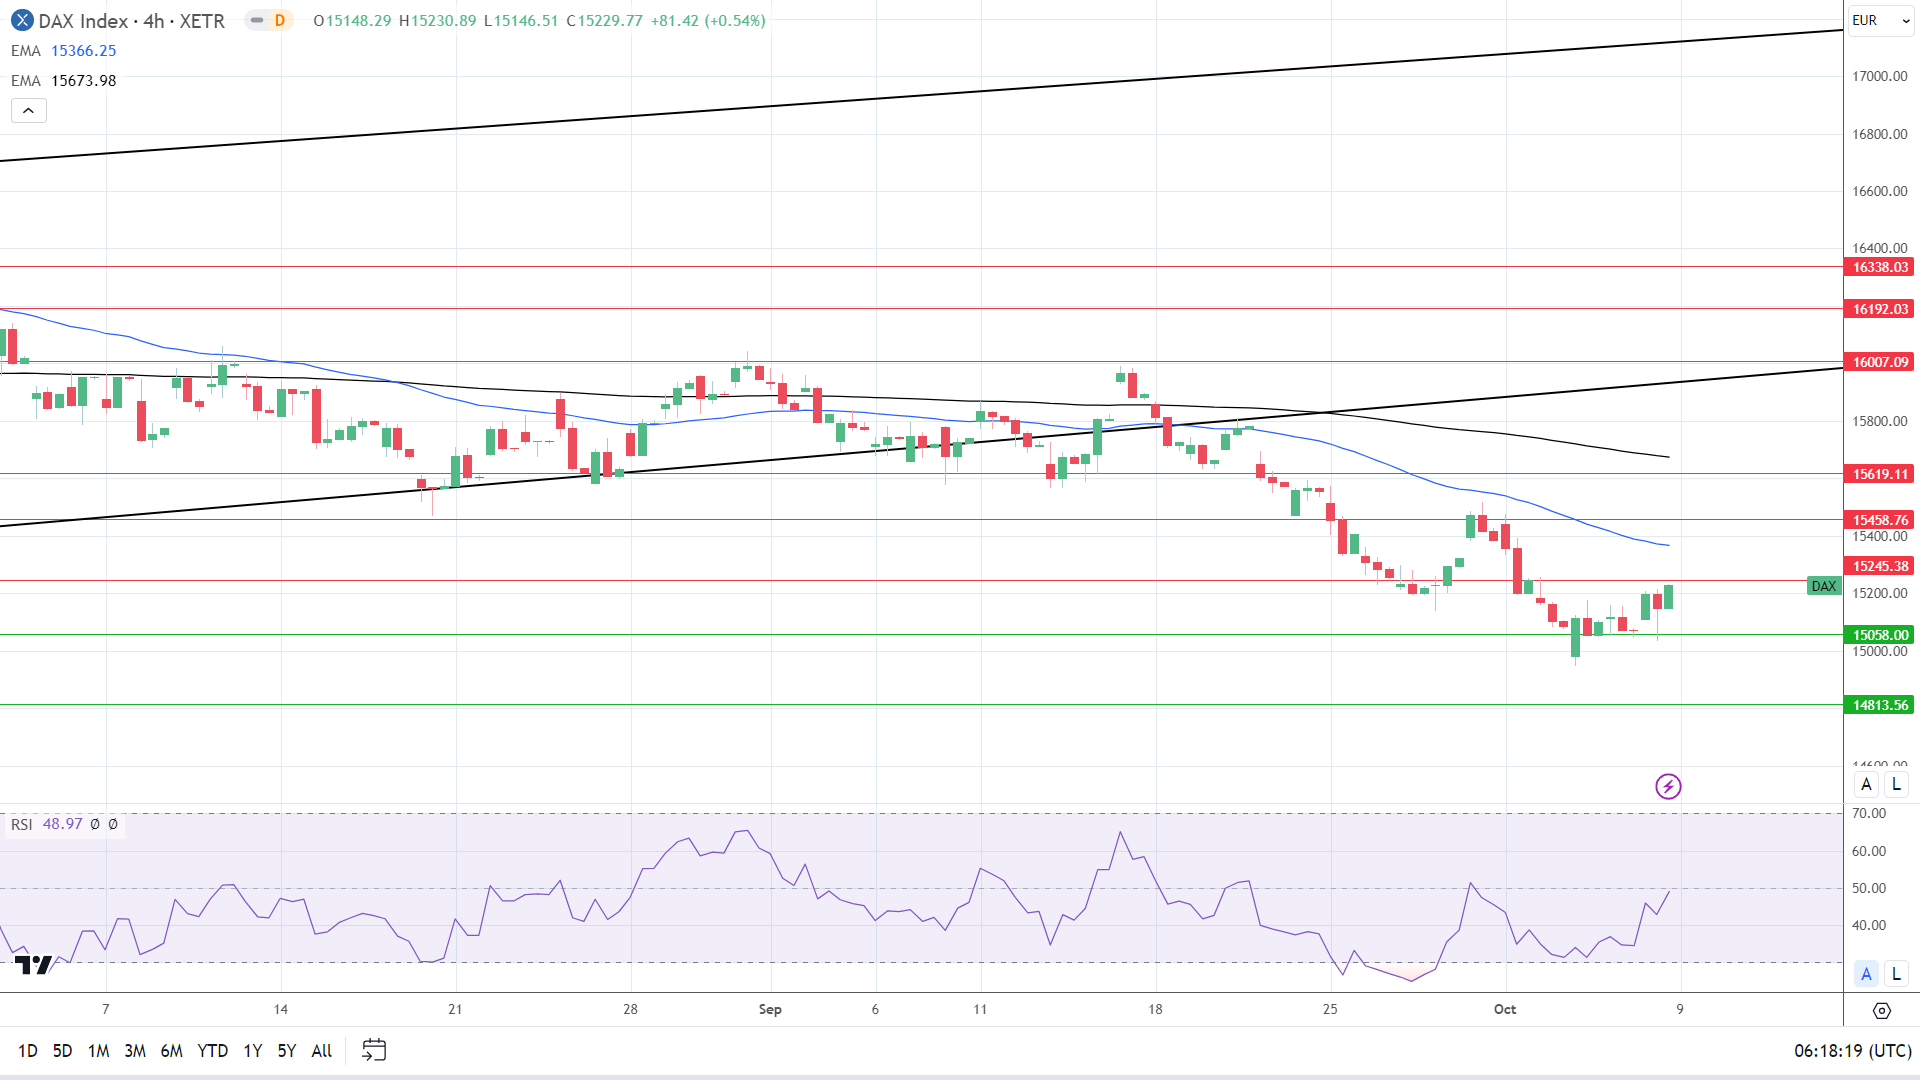
The DAX remains below the 50-day and 200-day EMAs, reaffirming the bearish price signals. A DAX break above the 15,245 resistance level would bring the 50-day EMA and 15,459 resistance level into play.

However, a fall below 15,200 would give the bears a run at the 15,058 support level.

The 48.97 RSI reading indicates a DAX fall to the 15,058 support level before entering the oversold territory.

4-Hourly Chart affirms bearish price signals.
DAX 091023 4-Hourly Chart
EUR/USD Forecast: US Dollar Rises Amid Middle East Concerns; German Production Eyed

EUR/USD Forecast: US Dollar Rises Amid Middle East Concerns; German Production Eyed

Friday Overview

On Friday, the EUR/USD gained 0.36%. Following a 0.41% rise on Thursday, the EUR/USD ended the day at $1.05844. The EUR/USD fell to a low of $1.04821 before reaching a high of $1.06000.

The Middle East Conflict and German Industrial Production in the Spotlight

This morning, the fear of an escalation in the Middle East conflict drove demand for the US dollar. A flight to safety may continue if the Middle East region destabilizes.

Trading Derivatives carries a high level of risk to your capital and you should only trade with money you can afford to lose. Trading Derivatives may not be suitable for all investors, so please ensure that you fully understand the risks involved, and seek independent advice if necessary. A Product Disclosure Statement (PDS) can be obtained either from this website or on request from our offices and should be considered before entering into a transaction with us. Raw Spread accounts offer spreads from 0.0 pips with a commission charge of USD $3.50 per 100k traded. Standard account offer spreads from 1 pips with no additional commission charges. Spreads on CFD indices start at 0.4 points. The information on this site is not directed at residents in any country or jurisdiction where such distribution or use would be contrary to local law or regulation.

Following better-than-expected factory orders, German industrial production will also be in focus on Monday. Economists forecast industrial production to fall by 0.1% in August. Industrial production declined by 0.8% in July.

German industrial production figures are unlikely to influence the higher-for-longer ECB interest rate path. The German manufacturing sector accounts for less than 20% of the German economy. Nonetheless, an improving macroeconomic environment would ease jitters of a prolonged economic recession and support demand for the EUR.

The ECB remains focused on wage growth and the services sector. On Tuesday, ECB Chief Economist Philip Lane said the ECB would monitor services inflation for a prolonged period.

With the German economy in the spotlight, ECB commentary also needs consideration. ECB Executive Board members Andrea Enria and Luis de Guindos are on the ECB calendar to speak on Monday.

Fed Speeches to Influence Fed Rate Path Bets

Later today, FOMC member commentary may provide investors with an early assessment of the US Jobs Report.

FOMC voting members Michael Barr, Lorie Logan, and Philip Jefferson are on the economic calendar to speak today. The EUR/USD will likely respond to views on wage growth, the Middle East conflict, and interest rates.

Considering the US Jobs Report, wage growth softened in August. Softer wage growth may impact consumer spending, easing demand-driven inflationary pressures. A softer inflation outlook will likely ease pressure on the FED to pursue a hawkish rate path to tame inflation.

Short-Term Forecast:

Monetary policy divergence remains tilted in favor of the US dollar. Risk aversion will also fuel demand for the US dollar. However, FOMC members could narrow the divergence in speeches ahead of US inflation figures on Wednesday and Thursday.

EUR/USD Price Action

Daily Chart

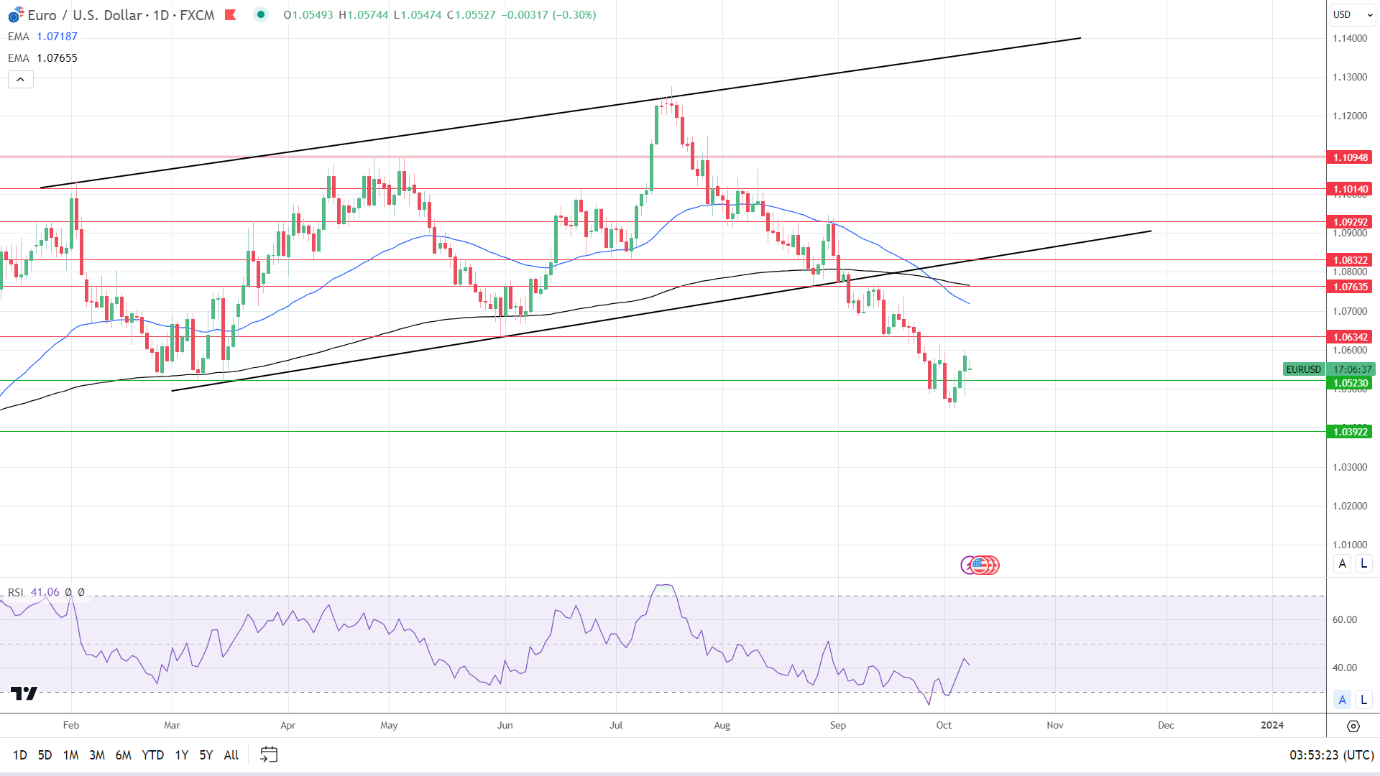
The EUR/USD sat below the 50-day and 200-day EMAs, signalling bearish price trends.

A EUR/USD break above the $1.06342 resistance level would support a move toward the 50-day EMA. Better-than-expected German industrial production numbers and easing geopolitical tensions would bring $1.07 into view.

Hawkish Fed comments and rising bets on a Fed rate hike would pressure the EUR/USD. However, updates from the Middle East will likely be pivotal. The threat of an escalation would overshadow economic calendar influences.

A drop below $1.0550 would give the bears a run at the $1.05230 support level and the Friday low of $1.04821.

The 14-period Daily RSI at 41.06 supports a EUR/USD fall through the $1.05230 support level before entering oversold territory.

EUR/USD Daily Chart sends bearish price signals.
EURUSD 091023 Daily Chart

4-Hour Chart

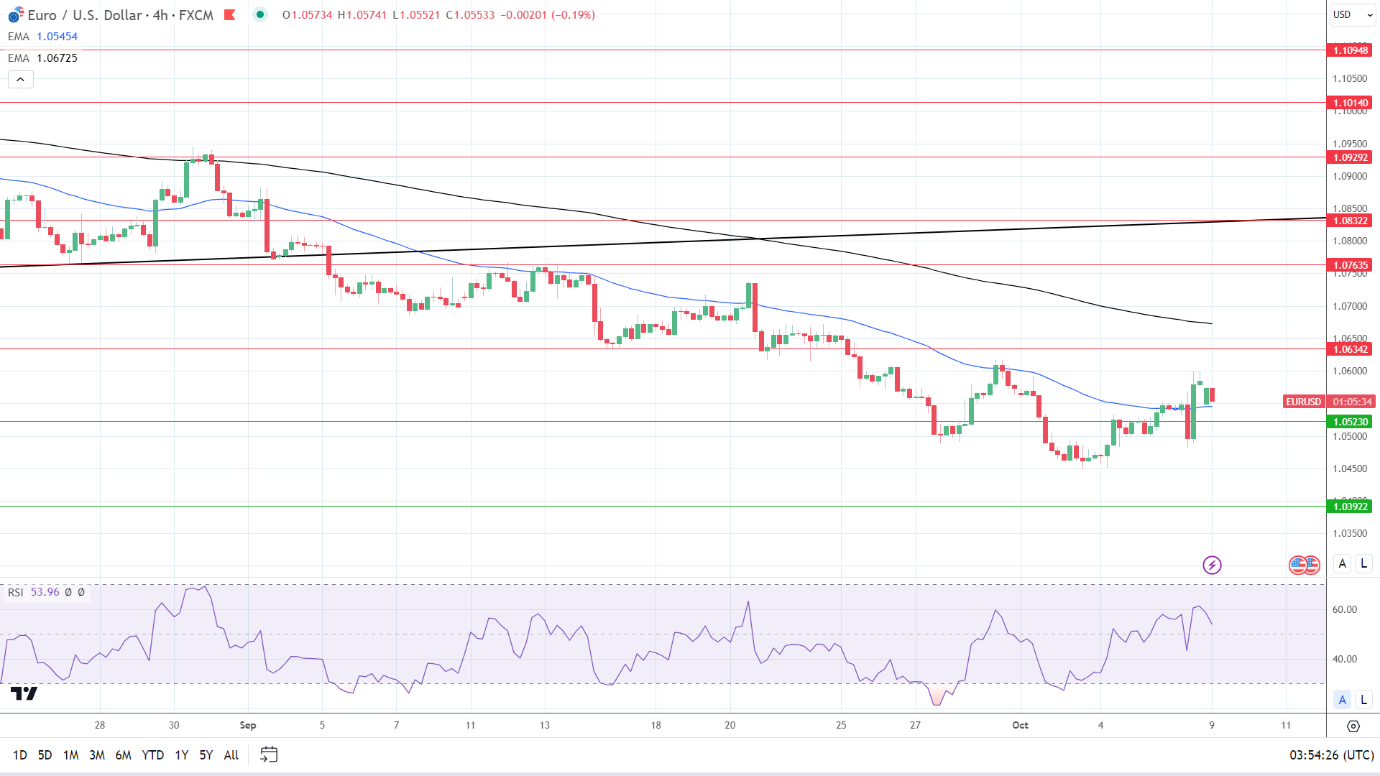
The EUR/USD is positioned above the 50-day EMA but remains below the 200-day EMA, indicating bullish short-term but bearish longer-term price trends. A EUR/USD break below the 50-day EMA would bring the $1.05230 support level into play.

However, a return to $1.06 would give the bulls a run at the $1.06342 resistance level.

The 14-period 4-Hourly RSI at 53.96 suggests a EUR/USD move to the $1.06342 resistance level before entering overbought territory.

4-Hourly Chart sends mixed price signals.
EURUSD 091023 4 Hourly Chart