Silver Prices Forecast: Traders Navigate Geopolitical Unrest, Economic Strength

Silver Prices Forecast: Traders Navigate Geopolitical Unrest, Economic Strength

Silver’s Intricate Path Amid Geopolitical Turmoil and Economic Strength

Silver prices find themselves at a crossroads, influenced by a web of geopolitical unrest and robust U.S. economic performance. The metal has reemerged as a sought-after safe haven, especially following heightened tensions between Israeli forces and Hamas. As concerns over a more extensive Middle East conflict escalate, investors are flocking to silver and other secure assets. However, the story doesn’t end there.

At 06:26 GMT, Silver (XAG/USD) is trading $21.85, up $0.26 or +1.17%. December Comex Silver futures are at $21.95, up $0.22 or +1.02%.

Trading Derivatives carries a high level of risk to your capital and you should only trade with money you can afford to lose. Trading Derivatives may not be suitable for all investors, so please ensure that you fully understand the risks involved, and seek independent advice if necessary. A Product Disclosure Statement (PDS) can be obtained either from this website or on request from our offices and should be considered before entering into a transaction with us. Raw Spread accounts offer spreads from 0.0 pips with a commission charge of USD $3.50 per 100k traded. Standard account offer spreads from 1 pips with no additional commission charges. Spreads on CFD indices start at 0.4 points. The information on this site is not directed at residents in any country or jurisdiction where such distribution or use would be contrary to local law or regulation.

Countervailing Forces in the U.S. Economy

Even as geopolitical tensions draw traders toward silver, strong U.S. economic indicators are exerting an opposing pull. A remarkable jobs report for September, showing a growth of 336,000 jobs, has fortified the Federal Reserve’s stance on its monetary tightening cycle. Rising Treasury yields—a direct outcome of this bullish economic environment—are limiting silver’s appeal as a non-yielding asset. Further adding to this mixed sentiment, the CME FedWatch tool currently shows a 29% probability of another rate hike by year-end.

Precious Metals Sector on Alert

Holdings in the SPDR Gold Trust, the world’s largest gold-backed ETF, have dipped slightly, an indicator that investors in precious metals are treading carefully. This cautious sentiment among gold investors could be a harbinger for the silver market, especially considering the upcoming festival season in Asia, traditionally a period of increased demand for precious metals.

Market Equilibrium and Short-Covering

Despite strong U.S. job numbers that would typically push investors away from non-yielding assets like silver, the metal’s price experienced a rally on Friday. This suggests that the market could be moving toward a short-covering phase, indicating that selling pressure is easing and opening the door for potential gains.

Short-Term Outlook: Cautiously Optimistic

In summary, the silver market is delicately poised between geopolitical uncertainties and strong U.S. economic signals. In the short term, traders should prepare for moderate volatility.

While a bullish outlook is hampered by the strong U.S. economic data, geopolitical tensions ensure a floor for silver prices. Hence, the market sentiment leans toward cautious optimism, urging traders to stay alert to both global conflict hotspots and forthcoming U.S. economic indicators.

Technical Analysis
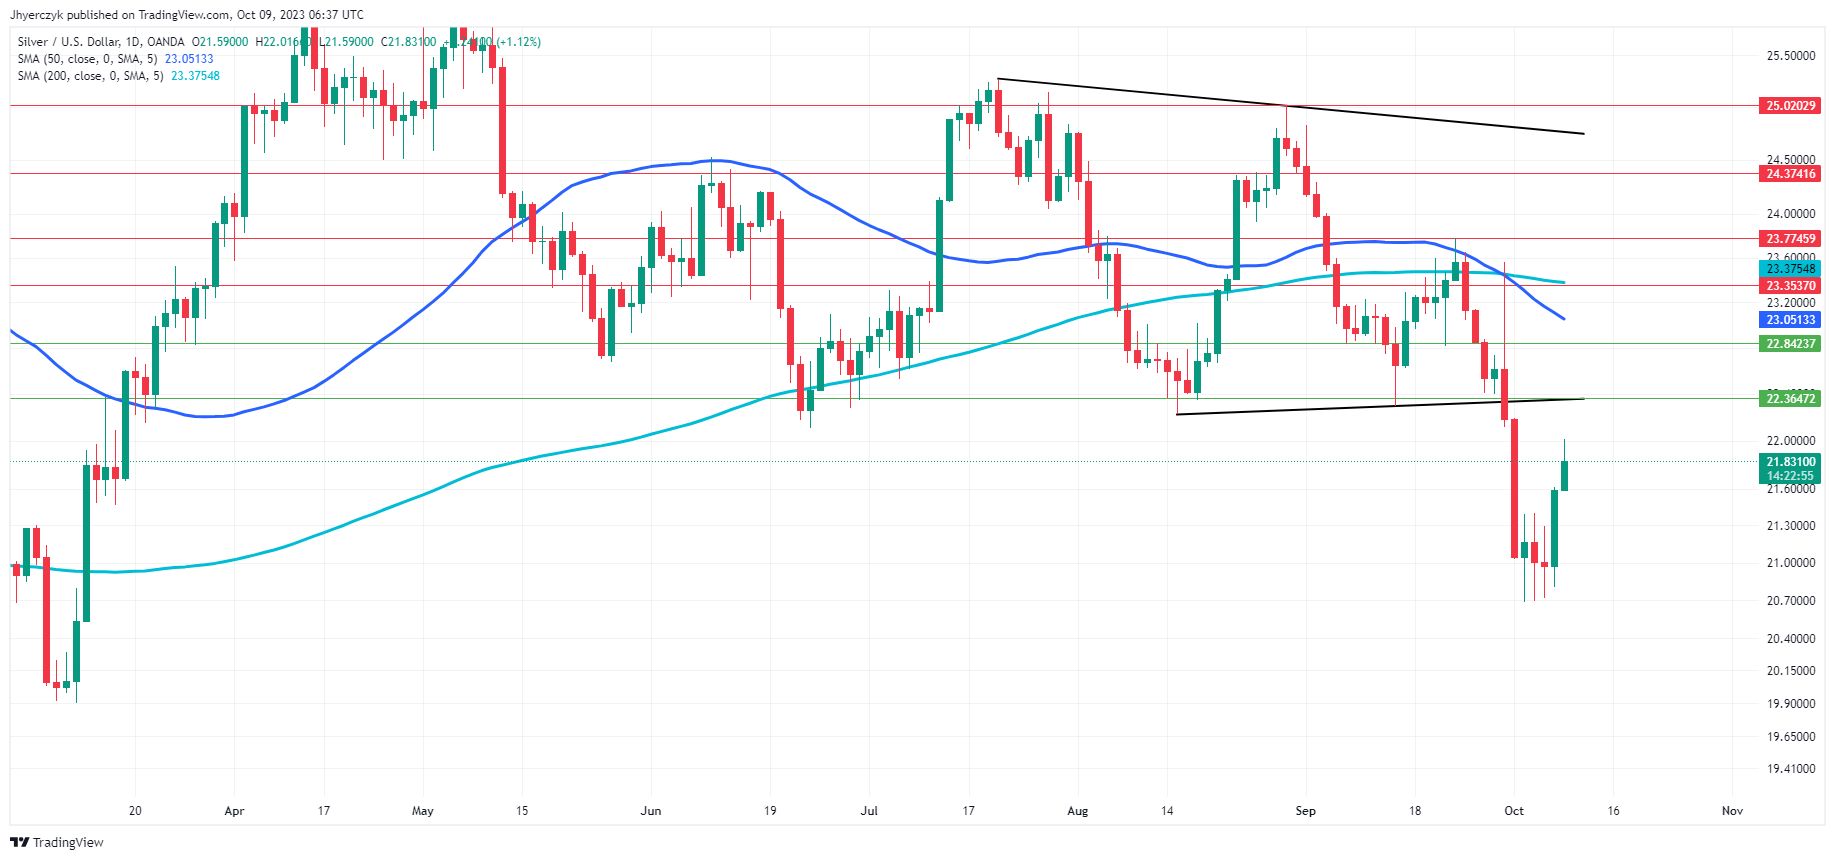
Daily Silver (XAG/USD)The daily price of Silver (XAG/USD) currently stands at $21.83, slightly higher than the previous day’s close at $21.59.

In terms of moving averages, the commodity trades below both the 200-Day Moving Average, which is at $23.37, and the 50-Day Moving Average, standing at $23.05.

Regarding support and resistance levels, Silver is under the trend line support at $22.35, signaling weakness. The minor support is at $22.84, with the main support at $22.36, while the minor resistance is at $23.35, and the main resistance sits at $23.77.

Considering these factors, the market sentiment leans toward bearish, with Silver currently facing several technical challenges that may impact its price negatively.

Gold Prices Forecast: Balancing Middle East Unrest with U.S. Rate Hike Odds

Gold Prices Forecast: Balancing Middle East Unrest with U.S. Rate Hike Odds

Gold Traders Navigate Geopolitical Landscape

Amid escalating violence between Israeli forces and Hamas, gold prices surged by more than 1%, reinstating its status as a go-to safe haven. The confrontations fueled concerns of a wider conflict in the Middle East, elevating the demand for secure assets such as gold. However, the rally faces a cap due to strong U.S. economic indicators.

At 05:36 GMT, Gold (XAU/USD) is trading $1849.78, up $1.77 or +0.10%. December Comex Gold futures are at $1864.10, up $18.90 or +1.02%.

Trading Derivatives carries a high level of risk to your capital and you should only trade with money you can afford to lose. Trading Derivatives may not be suitable for all investors, so please ensure that you fully understand the risks involved, and seek independent advice if necessary. A Product Disclosure Statement (PDS) can be obtained either from this website or on request from our offices and should be considered before entering into a transaction with us. Raw Spread accounts offer spreads from 0.0 pips with a commission charge of USD $3.50 per 100k traded. Standard account offer spreads from 1 pips with no additional commission charges. Spreads on CFD indices start at 0.4 points. The information on this site is not directed at residents in any country or jurisdiction where such distribution or use would be contrary to local law or regulation.

Economic Tailwinds and Headwinds

While the precious metal benefits from geopolitical unrest, its upside is being checked by bullish U.S. economic data. A robust jobs report, showing a 336,000 job growth in September, outpaced market expectations and fortified the Federal Reserve’s stance on maintaining its monetary tightening cycle. This scenario, bolstered by increasing Treasury yields, dampens gold’s allure.

Market Indicators

The robust jobs data indicates a potential rate hike, thereby increasing the opportunity cost of holding gold. This notion is corroborated by a 29% likelihood of another Federal Reserve rate hike this year, according to CME FedWatch. Concurrently, holdings in SPDR Gold Trust, the largest gold-backed ETF, dipped slightly, signaling caution among investors.

Short-Term Forecast

Considering the tug-of-war between geopolitical risks and solid economic metrics, the short-term outlook for gold is cautiously optimistic. Despite headwinds from the strong U.S. economy, geopolitical tensions are injecting enough uncertainty to offer a floor for gold prices.

By balancing the impact of escalating Middle East conflicts against strong U.S. economic data, traders should brace for measured volatility in the gold market in the near term.

Technical Analysis

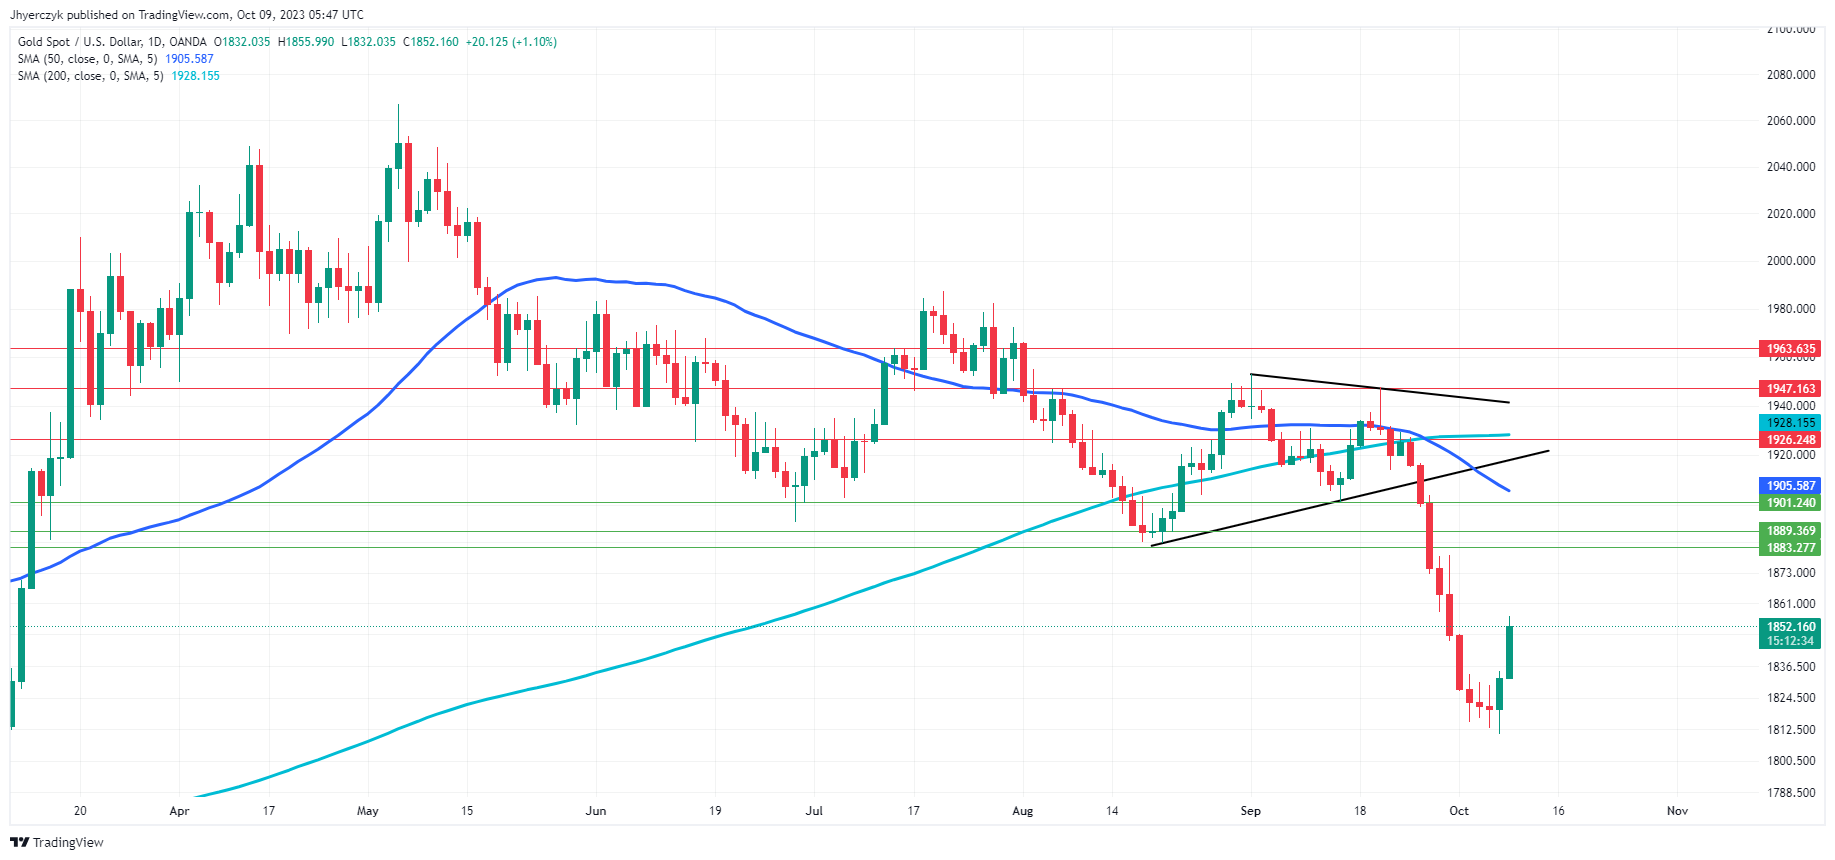
Daily Gold (XAU/USD)The current daily price of Gold (XAU/USD) at 1851.94 is below both the 200-Day and 50-Day moving averages, indicating bearish sentiment.

The price is also below the minor and main support levels, suggesting a weak position.

Despite a recent uptick from the previous daily price of 1832.04, the commodity faces resistance at 1917.97, further capped by the 50-Day moving average of 1905.58.

The market is struggling to gain momentum and must breach the minor resistance at 1926.25 and the 200-Day moving average at 1928.15 for any bullish reversal. Given these indicators, the market sentiment leans bearish.

Oil Prices Forecast: Middle East Tensions, OPEC’s Stance Fuel Bullish Tone

Oil Prices Forecast: Middle East Tensions, OPEC’s Stance Fuel Bullish Tone

Current Oil Market Dynamics Amid Middle East Tensions

Global benchmark Brent crude futures experienced a 4.1% surge in early Asian trade on Monday, touching a high of $88.15 per barrel, rebounding from last week’s close of $84.58. Despite this sharp rise, Brent remains below its recent one-year high of $97.69, recorded on September 28.

Meanwhile, at 05:01 GMT, November WTI crude oil is trading $85.86, up $3.07 or +3.71%. This is down from an intraday high of $87.24.

Trading Derivatives carries a high level of risk to your capital and you should only trade with money you can afford to lose. Trading Derivatives may not be suitable for all investors, so please ensure that you fully understand the risks involved, and seek independent advice if necessary. A Product Disclosure Statement (PDS) can be obtained either from this website or on request from our offices and should be considered before entering into a transaction with us. Raw Spread accounts offer spreads from 0.0 pips with a commission charge of USD $3.50 per 100k traded. Standard account offer spreads from 1 pips with no additional commission charges. Spreads on CFD indices start at 0.4 points. The information on this site is not directed at residents in any country or jurisdiction where such distribution or use would be contrary to local law or regulation.

The current upswing in prices comes in the wake of a massive attack launched by Hamas on Israel over the weekend.

Immediate Market Reaction and Underlying Factors

Initially, traders seemed to react to the increased geopolitical tensions, as Hamas militants from their Gaza stronghold targeted southern Israel. However, the price hike is moderate compared to the gravity of the situation. This suggests that market participants currently view the conflict as holding limited potential to disrupt global oil supplies in the short term.

Statements from OPEC and Middle East Producers

Adding another layer of complexity, oil ministers from Bahrain, Iraq, Kuwait, Oman, Saudi Arabia, and the United Arab Emirates met on the sidelines of the U.N. MENA climate week event in Riyadh. They reaffirmed their commitment to “collective and individual voluntary adjustments” in oil production. OPEC+ made no changes to its output policy and will keep existing supply cuts in place until 2024.

Economic Indicators and Their Impact

For the broader economic context, U.S. job growth surged by 336,000 in September, vastly outpacing economists’ expectations. While a strong U.S. economy may support near-term oil demand, the robust job numbers also strengthen the U.S. dollar and fuel speculation of another Federal Reserve rate hike in 2023, potentially dampening global demand for oil.

Short-Term Market Forecast

Considering these multifaceted influences, crude’s current pricing suggests that the market is carefully balancing geopolitical risks with economic fundamentals. Should the situation in the Middle East escalate further, with a particular focus on any involvement from Iran, we could see substantial volatility in oil prices. For now, heightened risks and market uncertainty appear to be bullish for oil in the near term.

Broader Geopolitical Implications

The recent attacks threaten to upend the delicate balance of power in the Middle East, potentially impacting everything from U.S.-brokered defense deals to Iranian oil exports. Any continuation of the conflict will also likely pause ongoing efforts to normalize relations across Middle Eastern countries. Given the current geopolitical landscape, an extended conflict could trigger wider implications, adding further upward pressure on oil prices.

By encapsulating the complex dynamics of the current oil market, traders and investors alike should be prepared for increased volatility in the short to medium term.

Technical Analysis

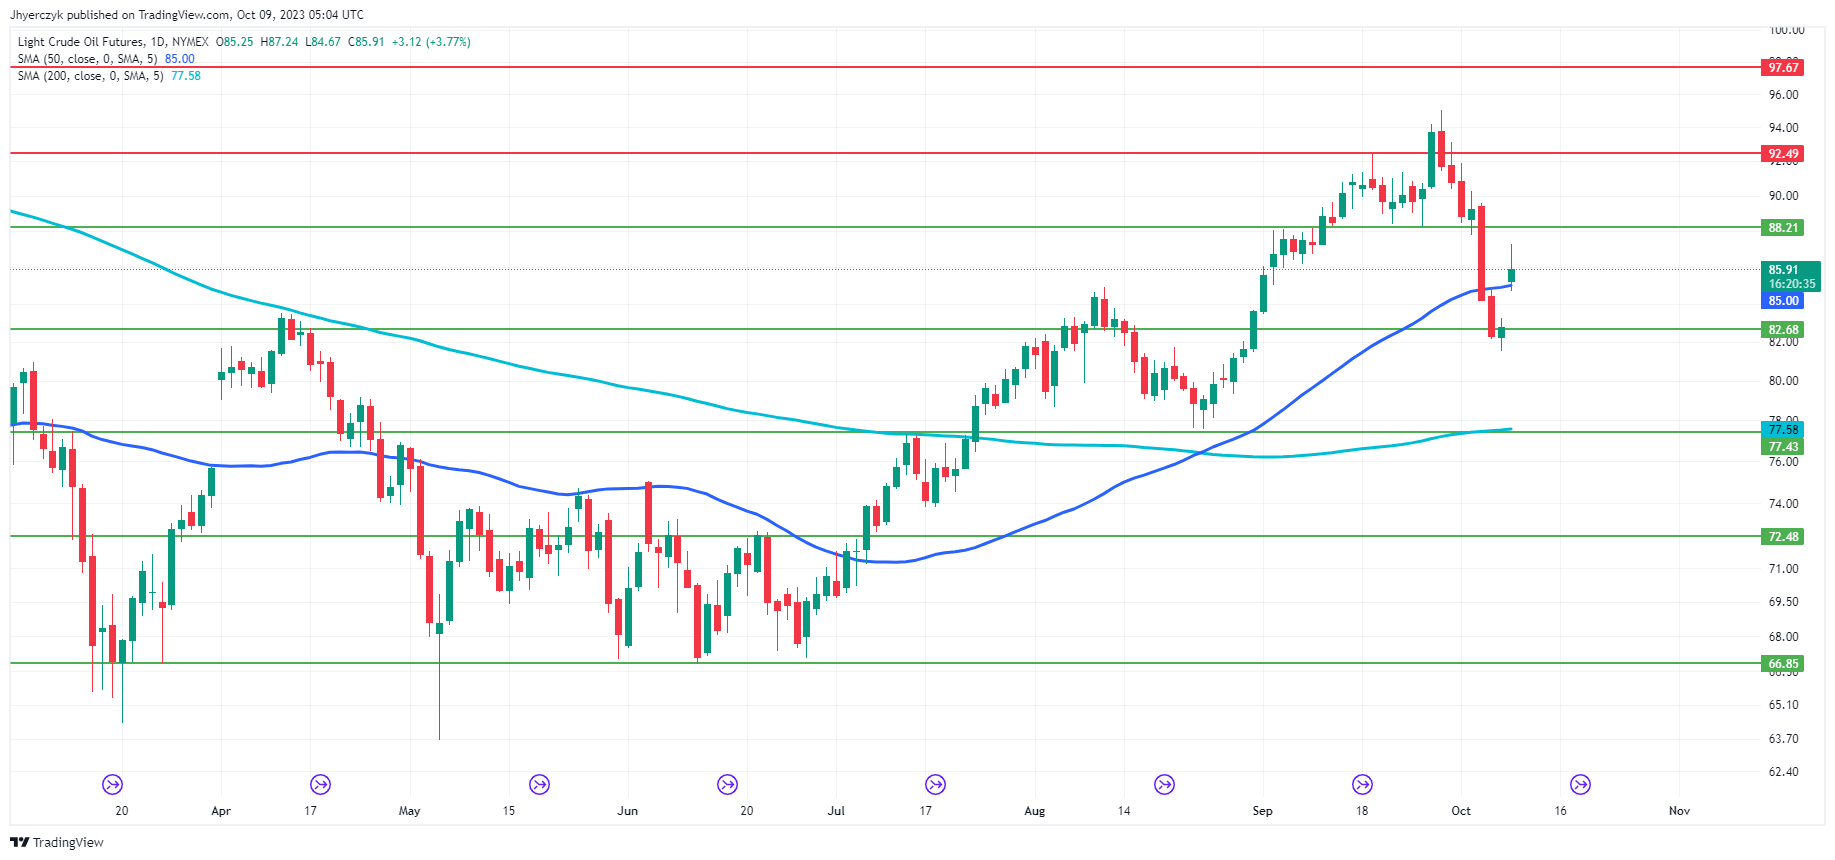
Daily Light Crude Oil FuturesThe current price of the daily Light Crude Oil futures contract is $85.92, which is above both the 50-Day and 200-Day moving averages, set at $85.00 and $77.58 respectively. This suggests that both short-term and long-term momentum are bullish.

The commodity is trading above its main support at $82.68, but still below the minor resistance at $92.49, making it a critical juncture for traders watching for a breakout or a pullback.

Based on these indicators and given the commodity’s position relative to the moving averages and key support and resistance levels, the market sentiment appears to be bullish.

Australian Dollar Dips as US Dollar Rallies After Israel Attack. Lower AUD/USD?

Australian Dollar Dips as US Dollar Rallies After Israel Attack. Lower AUD/USD?

The Australian Dollar sunk on Monday morning after weekend news of an all-out assault by the terrorist group Hamas on Israel, opening up another theatre of war.

The US Dollar is broadly stronger to start the week but especially so against the growth and risk sensitive currencies such as the Aussie and Kiwi. The Japanese Yen and Swiss Franc have fared better on their perceived haven status.

Futures markets are pointing toward lower prices for equities across Asia, Europe and North America later today. It is a holiday in Japan, Taiwan and the US which may contribute to slipperier market conditions than would otherwise be the case on potentially less liquidity.

The US Dollar had already been underpinned by Treasury yields continuing their march north after a solid jobs report on Friday that saw 336k jobs added in September.

The benchmark 10-year note eclipsed 4.88% on Friday, the highest return for the low-risk asset since 2007. It has since settled near 4.80%.

By comparison, the yield on the 10-year Australian Commonwealth Government Bond (ACGB) has slipped under 4.50% today after nudging 4.70% last week.

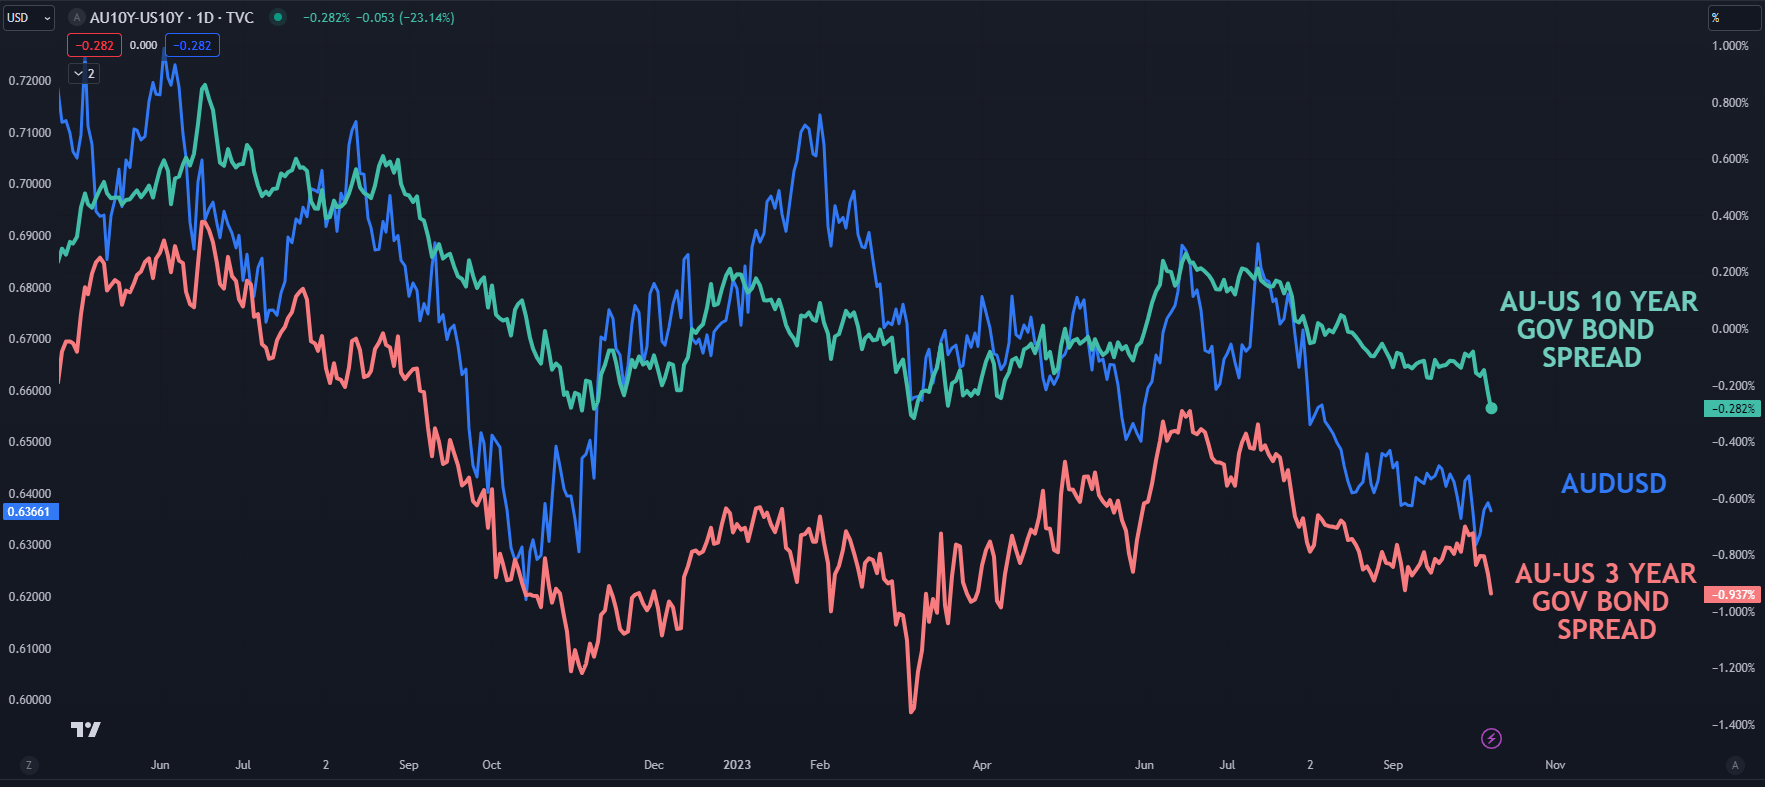
Government bond spreads have historically seen fluctuating correlation to AUD/USD but the moves to start this week have moved aggressively in favour of the US Dollar.

AUD/USD, 3- AND 10-YEAR AU-US BOND SPREADS

image1.png

Gold, silver and crude oil futures prices have opened higher on a combination of haven buying for the precious metals and possible supply constraints and increased demand for energy.

At the time of going to print, most other commodity futures are yet to open and if risk aversion is a theme for the trading session ahead, excessive volatility may unfold.

AUD/USD TECHNICAL ANALYSIS

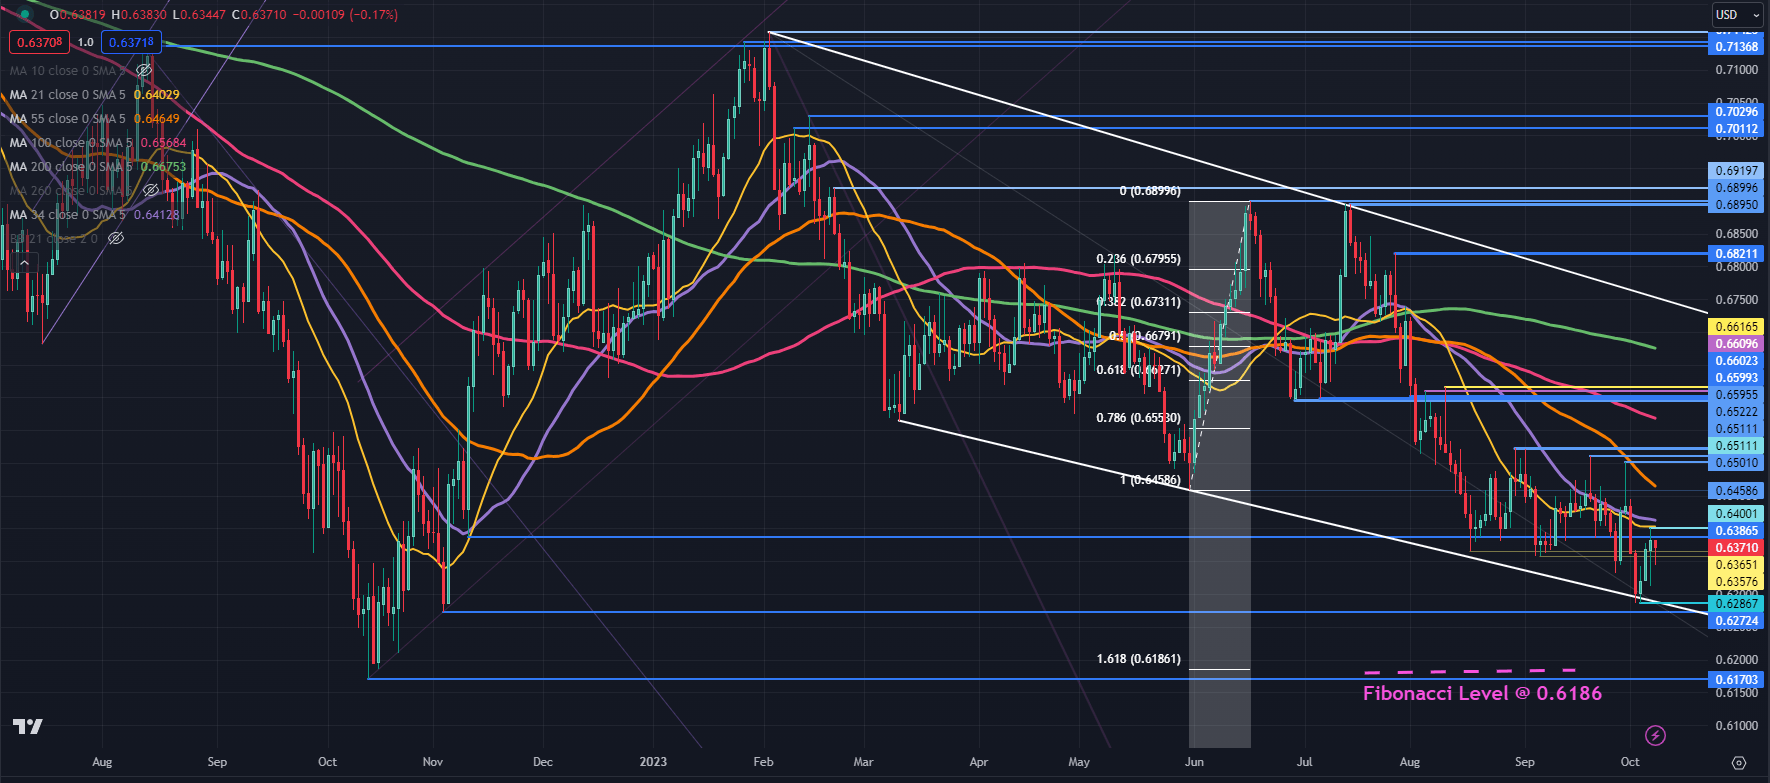
AUD/USD rejected a move below a descending trendline last week but overall remains in a descending trend channel.

It briefly traded above a historical breakpoint of 0.6387 on Friday but was unable to sustain the move and it may continue to offer resistance.

That peak of 0.6400 coincides with the 21-day Simple Moving Average (SMA) and that level may offer resistance ahead of the 34-day SMA, currently near 0.6412.

The inability of the Aussie to move above these SMAs could suggest that bearish momentum is intact for now. A move above the 21- and 34-day SMAs might indicate more sideways price action.

The 0.6500 – 0.6520 area contains a series of prior peaks and might be a notable resistance zone. Further up, the 0.6600 – 0.6620 area might be another resistance zone with several breakpoints and previous highs there.

On the downside, support may lie near the previous lows of 0.6285, 0.6270 and 0.6170.

The latter might also be supported at 161.8% Fibonacci Extension level at 0.6186. To learn more about Fibonacci techniques, click on the banner below.

image2.png

Q4 Trade Opportunity: HK/China Equities Could be Due for a Rebound

Q4 Trade Opportunity: HK/China Equities Could be Due for a Rebound

Tentative signs of stabilization in the Chinese economy, thanks to a spate of policy measures, coupled with oversold conditions, attractive valuations, and elevated pessimism suggest Hong Kong/China equities could be due for a rebound.

Recent China’s macro data have been less-worse than expected, as indicated by the Economic Surprise Index. The ESI is now close to neutral territory from near mid-2020 lows in July. Manufacturing activity appears to be stabilizing after NBS manufacturing PMI rose slightly last month.

Credit growth, industrial production, and retail sales came in better than expected in August, just as deflationary pressures are easing, raising the odds that growth may have troughed in Q3-2023, thanks to the momentum in support/stimulus measures. The finer details within the data sets also suggest bright spots could be emerging in the economy.

The pace of relief measures has gathered momentum in recent months, including cuts in key policy rates/lending rates, cuts in reserve requirement ratio, measures toward the property sector, and infrastructure spending. Early signs of a turnaround in macro data have motivated a few analysts to upgrade their economic growth forecasts for the current year. However, continued FX outflows and declining home prices suggest more fiscal and monetary measures could be needed to revive the property sector.

Hang Seng Index Monthly Chart

image1.png

Meanwhile, the risk barometer on Hong Kong/China equities based on some market estimates is at elevated levels. Similar levels in the past have been associated with positive returns in equities over a multi-week period. However, timing the rebound can be tricky – indeed, there is no sign of a reversal of the downtrend on technical charts.

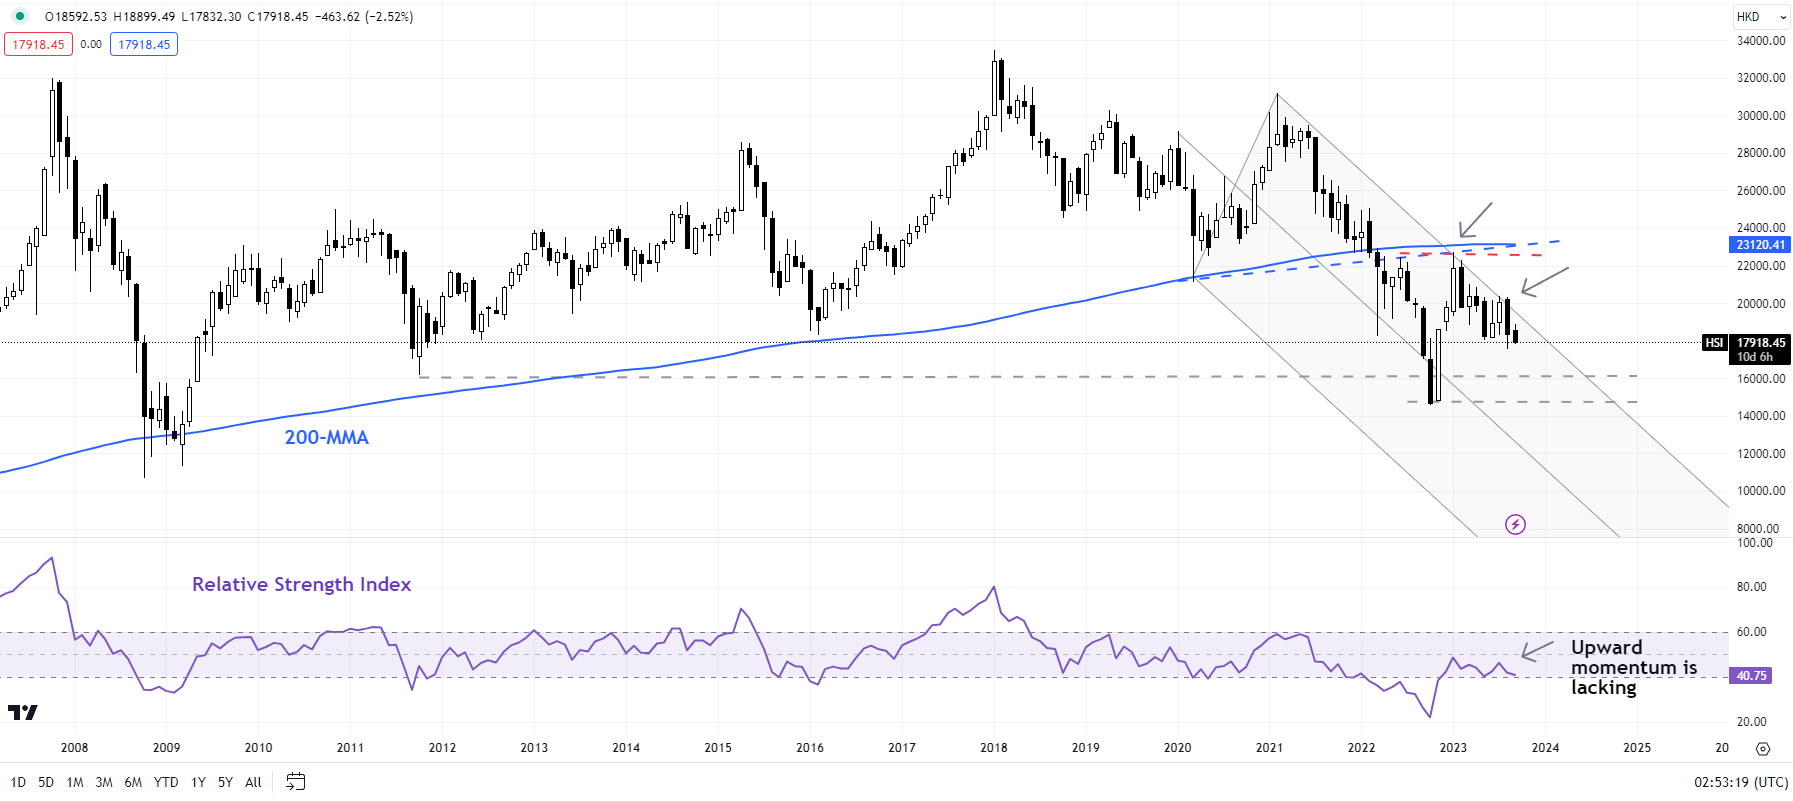
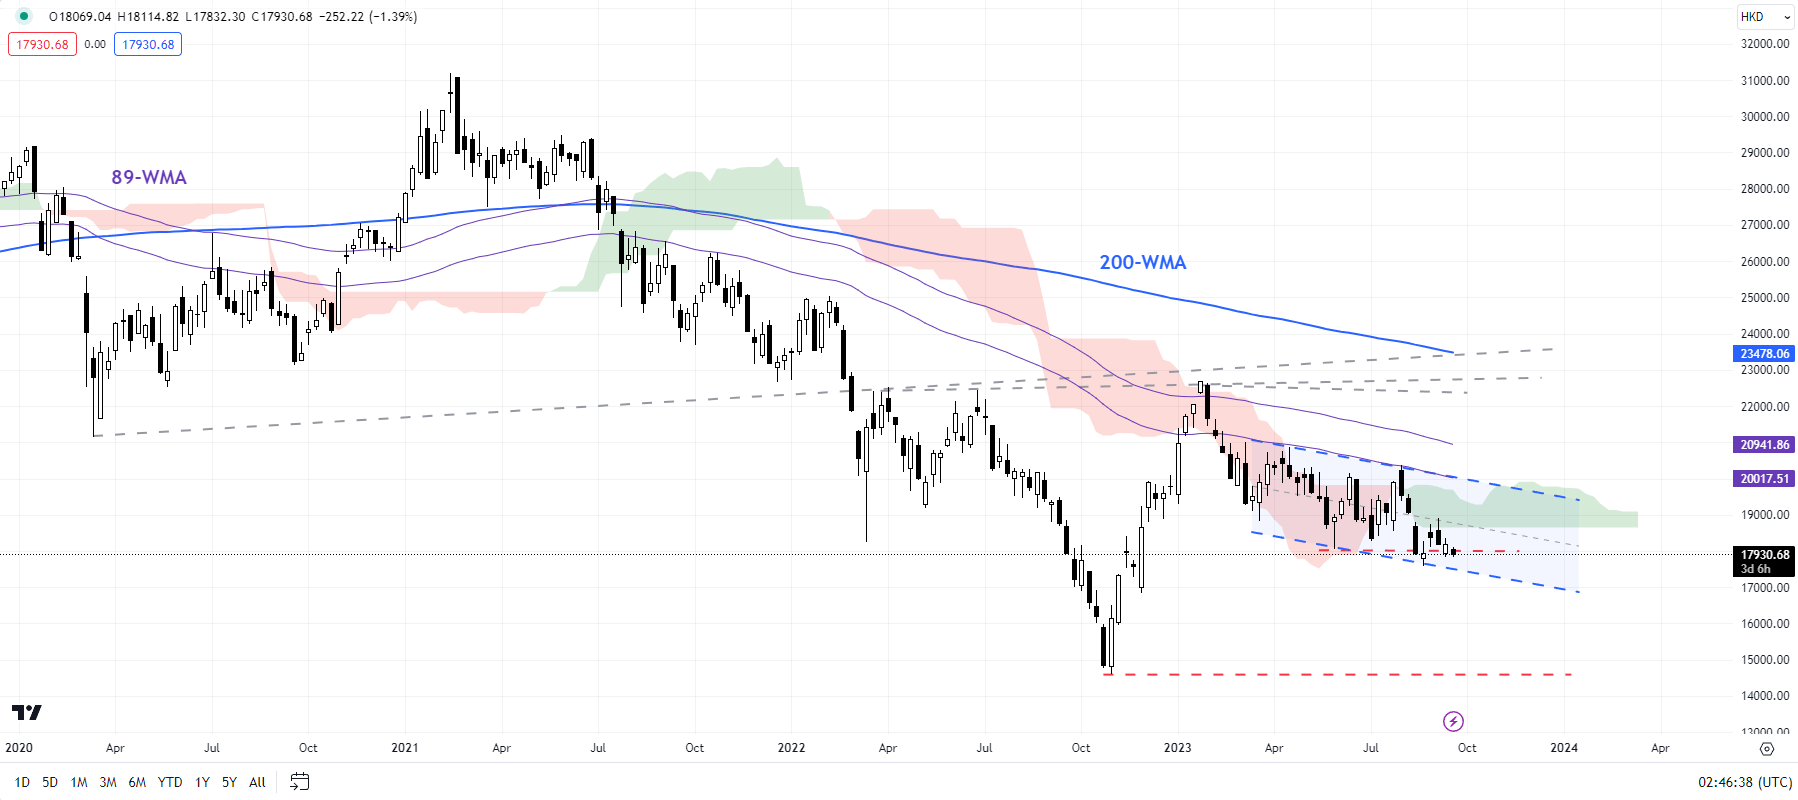
Looking at the big picture, on the monthly charts, the index has been nicely guided lower by a declining pitchfork channel since 2020. Despite the sharp rebound in Q1-2023, the 14-month Relative Strength Index failed to cross above the 50-mark, suggesting the early 2023 rebound was corrective.

Hang Seng Index Weekly Chart

image2.png

On the weekly charts, the index is at a crucial cushion area, including the May low of about 18000 and the lower edge of a declining channel since early 2023 (at about 17400). Below that, the next support is at the 2022 low of 14600. So far, the index has lacked any meaningful upward momentum. In this regard, the Hong Kong benchmark index would need to, at minimum, cross above the early-August high of 20300 for the immediate downside risks to fade. Until then, the balance of risks remains tilted toward the downside.

How Cognitive Biases Can Affect Your Trading Performance

How Cognitive Biases Can Affect Your Trading Performance

Cognitive Bias Definition

Cognitive biases, according to Wikipedia, is a ‘systematic pattern of deviation from norm or rationality in judgement … (where) an individual’s construction of reality, not the objective input, may dictate their behavior in the world’. Or in other words, sometimes the brain tries to simplify information to make it easier, and quicker, to make a decision. And it is this simplification, or reliance on a distilled version of reality, that can cause traders problems interpreting information in an objective fashion.

There is a wide range of biases that affect us in our daily life that can cause us to see patterns that are not necessarily there. Below is a list of six cognitive biases that traders should be aware of and know how to handle these pre-conceived thoughts.

What are the Cognitive Biases?

  1. Confirmation bias.
  2. Anchoring bias.
  3. Self-serving bias.
  4. Optimism/pessimism bias.
  5. Availability bias.
  6. Risk aversion.

Investor Bias May Impact Your P&L

Each bias is explained below with some pointers on how to avoid falling into one of the six categories.

1. Confirmation Bias

This is a type of bias where people look for information that confirms their original beliefs, and ‘bury their head in the sand’ when they are presented with information that does not agree with their view. For example, a trader believes that EUR/USD is going lower and will only take on board information and discussions that give credence to this view. Analysis and information that makes an objective argument that EUR/USD is going higher is dismissed, however informed it may be. Traders need to recognize when this is happening and keep an open mind to all views before making their mind up. Making a trading decision based only on one-side of a view that you want to hear, is dangerous and potentially costly.

2. Anchoring Bias

People sometimes adopt a long-term view of a situation based on the first piece of information they read on the subject, the ‘anchor’. For a trader, this can be very dangerous. If a trader reads a bullish article on gold or cryptocurrencies for example and anchors their views to this article, then they will always look at these asset classes through rose-tinted glasses, whatever the prevailing market is telling them. Traders should always remain open-minded and willing to change their view, however much discomfort it may cause them.

How to Create a Trading Plan in 7 Steps

3. Self-Serving Bias

In short, this is taking credit for when things go well but blaming other factors when things go wrong. This leads traders to look at themselves in an overly favorable fashion, as they believe all profits are due to their skills but all losses are due to the fault of others. Traders must be confident in their ability but they must also recognize when they have made a mistake, and work out why it happened and how to make sure it doesn’t happen again. Don’t let your ego have a negative impact on your P&L.

A picture containing diagram  Description automatically generated

4. Optimism/Pessimism Bias

Two sides of the same coin – you’re either overly optimistic about your trade or your trading ability or you’re overly pessimistic. Traders who have an optimism bias tend to believe that they, or their trade, will do better than it does, while a negative optimism will likely mean that a trader misses a trade as the expected outcome is not up to their expectation. Trades should be looked at with a clear mind and no preconceived ideas, otherwise traders will not act rationally or with the correct level of risk management.

5. Availability Bias

This bias is commonly described as the tendency to use information that comes readily to hand when making a decision. This can lead to bad decision-making as traders may base their view on easily available information instead of conducting thorough due diligence and fact-checking before entering a trade. In essence, individuals exhibiting an availability bias enter into trades on information that is often incomplete or even inaccurate. Careful consideration of fundamentals, technicals and risk management should be implemented in the decision making process.

image3.PNG

6. Risk Aversion

This may not seem to be relevant to traders who, by nature of what they do, can understand and handle risk, but some traders may prefer to take on lower-risk/reward set-ups. Higher risk for higher reward – and vice-versa – is an important part of risk management and understanding but if a trader veers too far towards risk aversion, then trading can become low-risk/reward investing. Be comfortable with your own level of risk. DailyFX research has revealed that a prudent risk/reward approach factored highly among the traits if successful traders.

Bullish Natural Gas: Base May Have Been Built

Bullish Natural Gas: Base May Have Been Built

Natural gas could be set for a material rebound: it rose to an eight-month high last week on higher heating demand, smaller-than-expected inventory build, and rising exports.

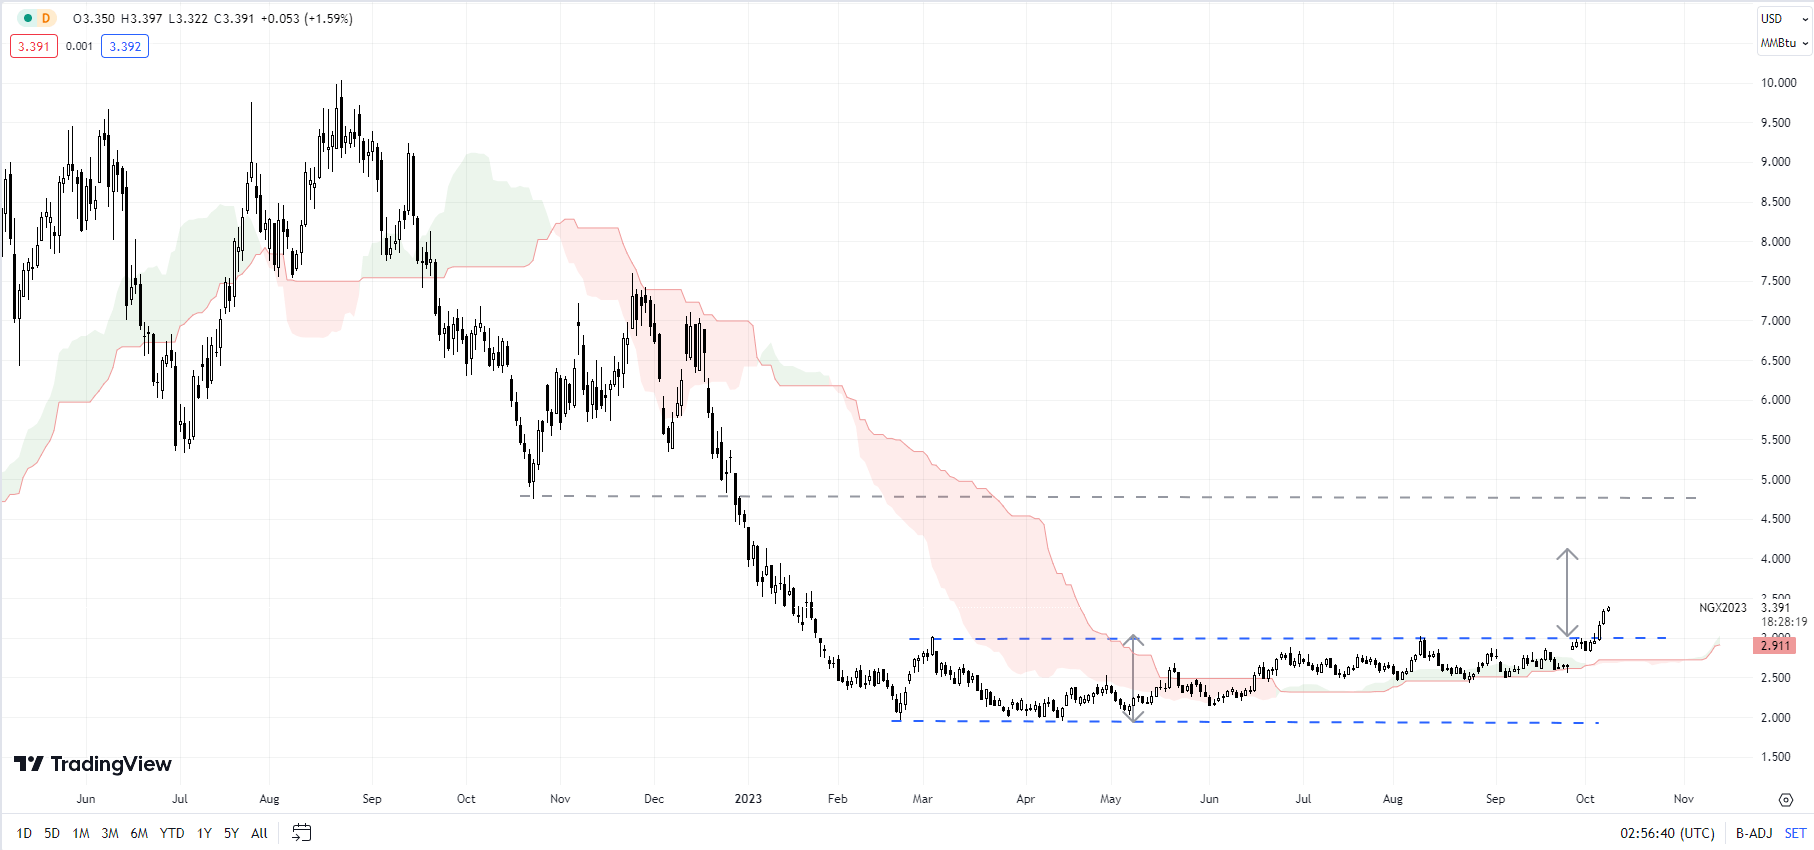
Natural gas rose 14% last week, the biggest weekly percentage increase since mid-June. LSEG forecast US gas demand, including exports, would rise in the coming two weeks. On technical charts, natural gas’ break above crucial resistance at the March & August highs of 3.03 has triggered a significant break out from an eight-month-long sideway range.

Natural Gas Daily Chart

image1.png

The price objective of the pattern points to a rise to around 4.00-4.10 in the coming weeks. Last week’s jump was also associated with a rise above the 200-day moving average and a decisive break above the 89-day moving average for the first time this year. Natural gas pulled back in August-September but held fairly strong support on the lower edge of the Ichimoku cloud on the daily charts.

Natural Gas Monthly Chart

image2.png

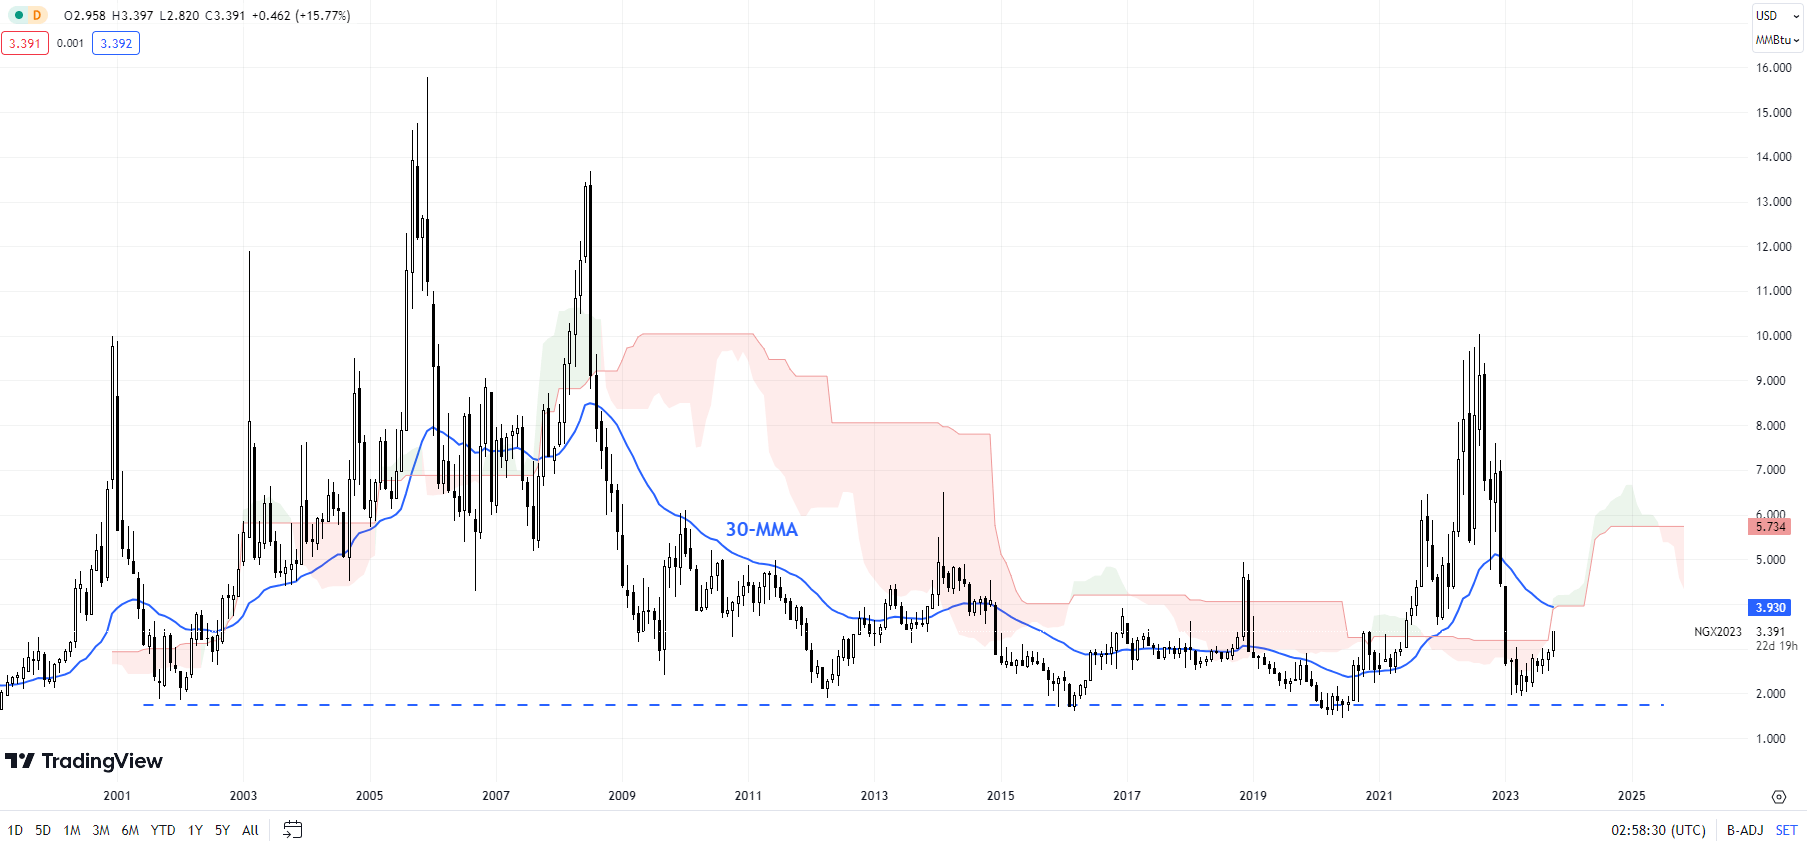
Importantly for the first time in 2023, natural gas staged a higher low. Last week’s rise has sealed the higher-high-higher-low sequence in the interim. 30-month moving average, coinciding with the 200-month moving average, around the psychological 4.00 mark. Subsequent resistance is at 4.20 (the 38.2% retracement of the November 2022-February 2023 fall, followed by the October 2022 low of 4.75. On the downside, a fall below the August low of 2.40 would negate the bullish view. Immediate support is at 3.03.

Crude Oil Reverses Recent Losses as Markets Recalibrate after Israeli Invasion

Crude Oil Reverses Recent Losses as Markets Recalibrate after Israeli Invasion

Crude oil prices jumped higher today as markets take stock of the tragedy unfolding in the Middle East.

Hopes for peace in the region have diminished in the aftermath of the military offensive of Hamas into Israel.

The WTI futures contract is near US$ 86 bbl while the Brent contract is around US$ 87.50 bbl.

For markets, stereotypical haven status assets such as gold and the US Dollar have benefitted in somewhat of a befuddled day for markets.

Japan, South Korea and Taiwan are on holiday, while Hong Kong has seen limited trading hours due to a typhoon and the US will be away due to Columbus Day.

Spot gold is back above US$ 1,850 an ounce while the DXY (USD) index up around 0.20%.

Growth and risk-sensitive assets are on the backfoot with the Aussie and Kiwi seeing the largest losses leading into the start of the week.

USD/JPY is steady above 149.00 while GBP/USD is holding ground above 1.2200 at the time of going to print.

Supporting the US Dollar, Treasury yields continued to higher levels after a robust jobs report on Friday that saw 336k jobs added in September.

The benchmark 10-year note eclipsed 4.88% in the aftermath, the highest return for the low-risk asset since 2007. It has since settled near 4.80%.

Looking forward, it appears that the markets are perplexed on how to interpret the events of the last few days and with some holidays and a lack of significant economic data release, volatility could evolve.

WTI CRUDE OIL TECHNICAL SNAPSHOT

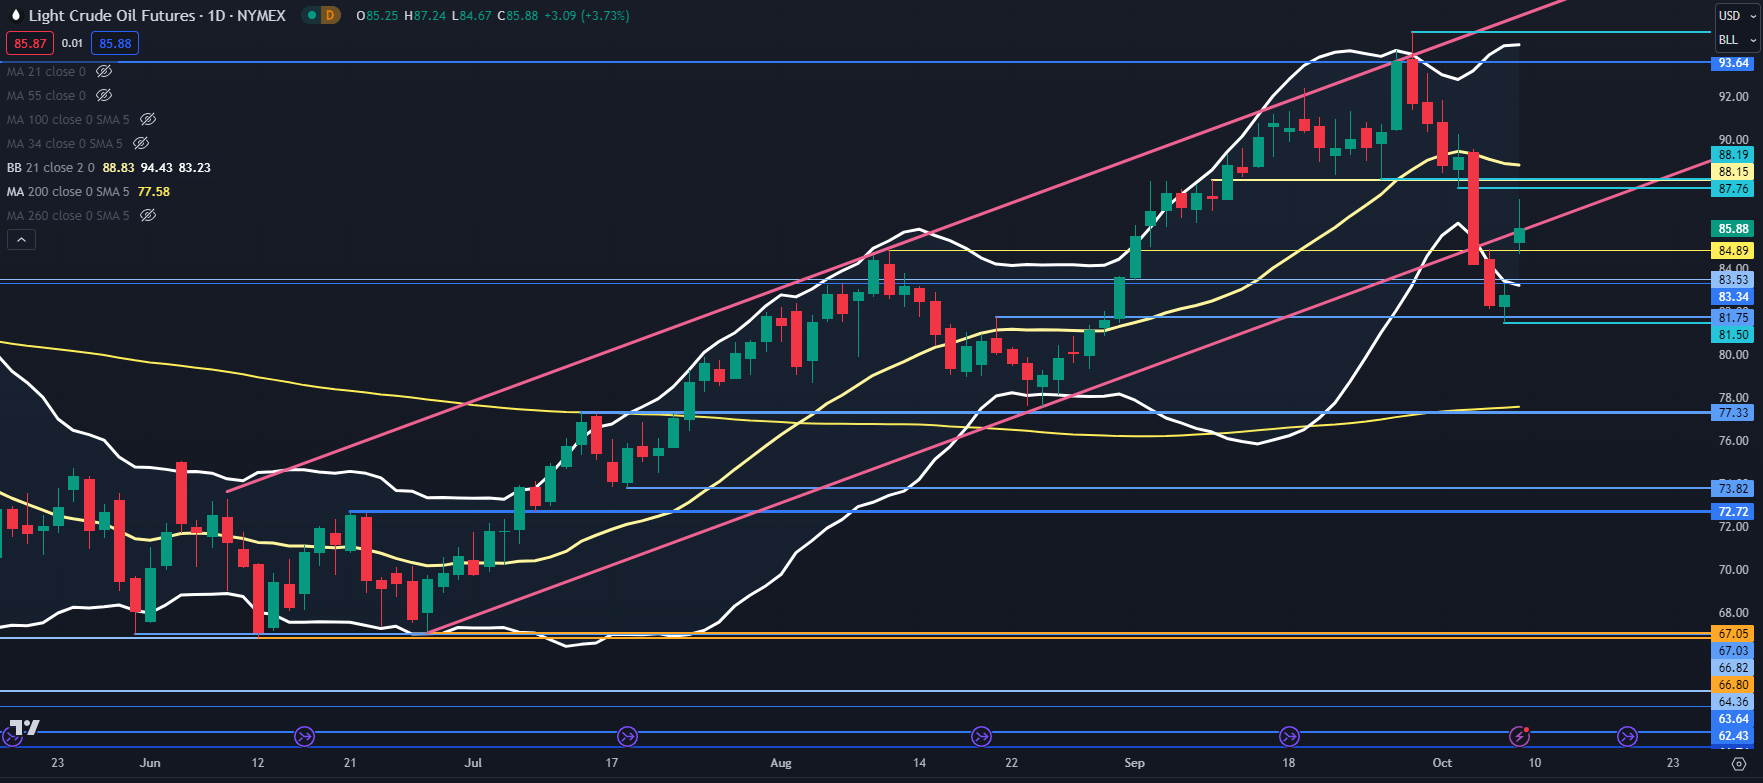
Last week’s sell-off in the WTI futures contract broke below the lower band of the 21-day simple moving average (SMA) based Bollinger Band.

Today it has emphatically traded back within the band and if it closes inside the band at the close today, it may signal a pause in the bearish move or a potential reversal.

Nearby resistance could be at the breakpoints of 87.76, 88.15 and 88.19. On the downside, support may lie near the breakpoints of 84.89, 83.53,83.34 or the prior low at 81.50.

WTI CHART

image1.png


GBP/USD Price Forecast: Souring Risk Sentiment Shackles Pound

GBP/USD Price Forecast: Souring Risk Sentiment Shackles Pound

GBPUSD FUNDAMENTAL BACKDROP

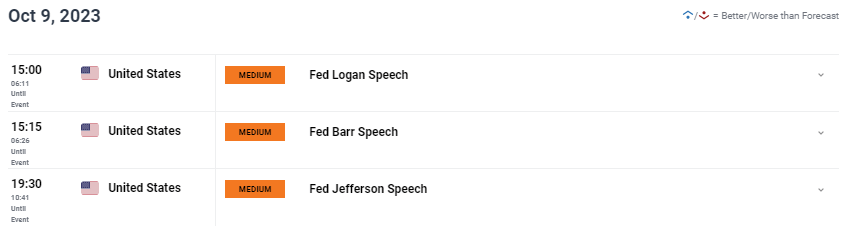
The British pound opened lower this Monday morning as conflict in the Middle East saw global markets adopt a risk off approach. Naturally, the US dollar received support being a safe haven currency in addition to Friday’s Non-Farm Payroll (NFP) report which beat forecasts highlighting a very robust labor market within the US. That being said, money market expectations for a November interest rate hike from the Fed was little changed and with US CPI scheduled later this week, only a significant upside surprise may shift the needle.

China has returned to market activity after their Golden Week holiday but spending during this period underwhelmed, reinforcing the need for additional stimulus by the Chinese government. This weaker outlook weighs negatively on the pound and will be closely monitored moving forward.

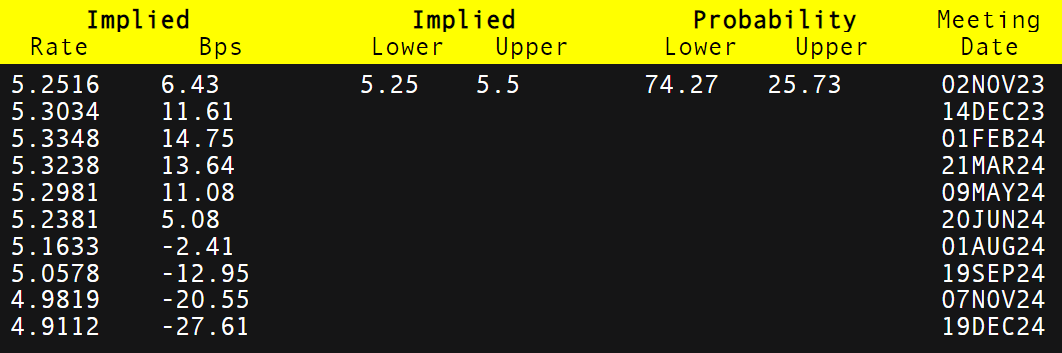
Bank of England (BoE) prospects (refer to table below) remain in favor of a rate pause in November but the upcoming UK GDP (Thursday) could may add to hawkish bets as forecasts reveal a healthy growth report.

BANK OF ENGLAND INTEREST RATE PROBABILITIES

image1.png

GBP/USD ECONOMIC CALENDAR (GMT +02:00)

image2.png

TECHNICAL ANALYSIS

GBP/USD WEEKLY CHART

image3.png

The longer-term weekly chart above shows last week’s long lower wick close (blue) and could hint at subsequent upside to come despite risk aversion today.

GBP/USD DAILY CHART

image4.png

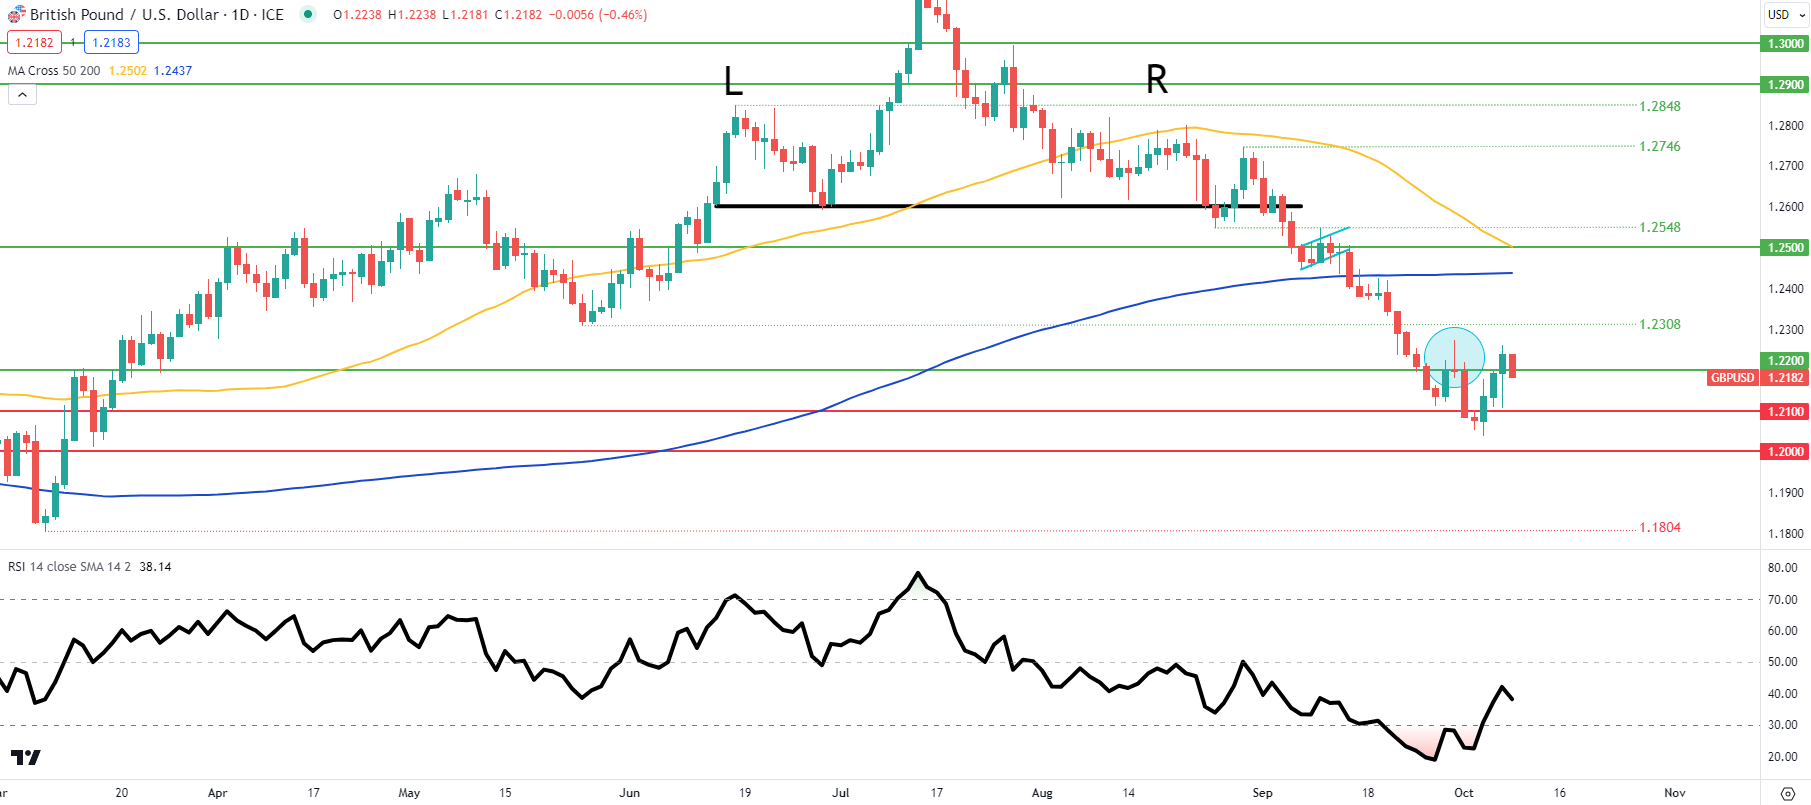
Price action on the daily cable chart sees the pair peering out of the oversold zone on the Relative Strength Index (RSI) after the bullish/positive divergence mentioned in my prior analysis unfolded. Moving forward this week, US and UK GDP data will be key in terms of short-term directional guidance as well as the developments in the Middle East.

Oil Prices Forecast: Inventory Focus Shifts Amid Rollercoaster Week for Futures

Oil Prices Forecast: Inventory Focus Shifts Amid Rollercoaster Week for Futures

Market Volatility

Last week’s optimism in the oil market swiftly turned into this week’s anxiety, as both Brent and WTI benchmarks took a nosedive, recording their worst weekly performances since March. Brent slipped 11.6%, while WTI fell around 9%. The freefall was largely triggered by a sell-off in the U.S. bond market, raising red flags about a potential global economic slowdown and a subsequent decline in fuel (gasoline) demand.

Macro Factors and Supply-Demand Equation

Bond investors are increasingly alarmed by the U.S. government’s burgeoning budget deficit, which is pushing Treasury prices to 17-year lows. This ripples through to the oil market, given the U.S. status as the world’s leading oil consumer. Meanwhile, JPMorgan expects a modest but slower growth in oil demand for Q4 2023. On the flip side, the National Australia Bank views the recent price dip as temporary and forecasts a supply deficit this quarter.

Trading Derivatives carries a high level of risk to your capital and you should only trade with money you can afford to lose. Trading Derivatives may not be suitable for all investors, so please ensure that you fully understand the risks involved, and seek independent advice if necessary. A Product Disclosure Statement (PDS) can be obtained either from this website or on request from our offices and should be considered before entering into a transaction with us. Raw Spread accounts offer spreads from 0.0 pips with a commission charge of USD $3.50 per 100k traded. Standard account offer spreads from 1 pips with no additional commission charges. Spreads on CFD indices start at 0.4 points. The information on this site is not directed at residents in any country or jurisdiction where such distribution or use would be contrary to local law or regulation.

A Glimpse of Recovery

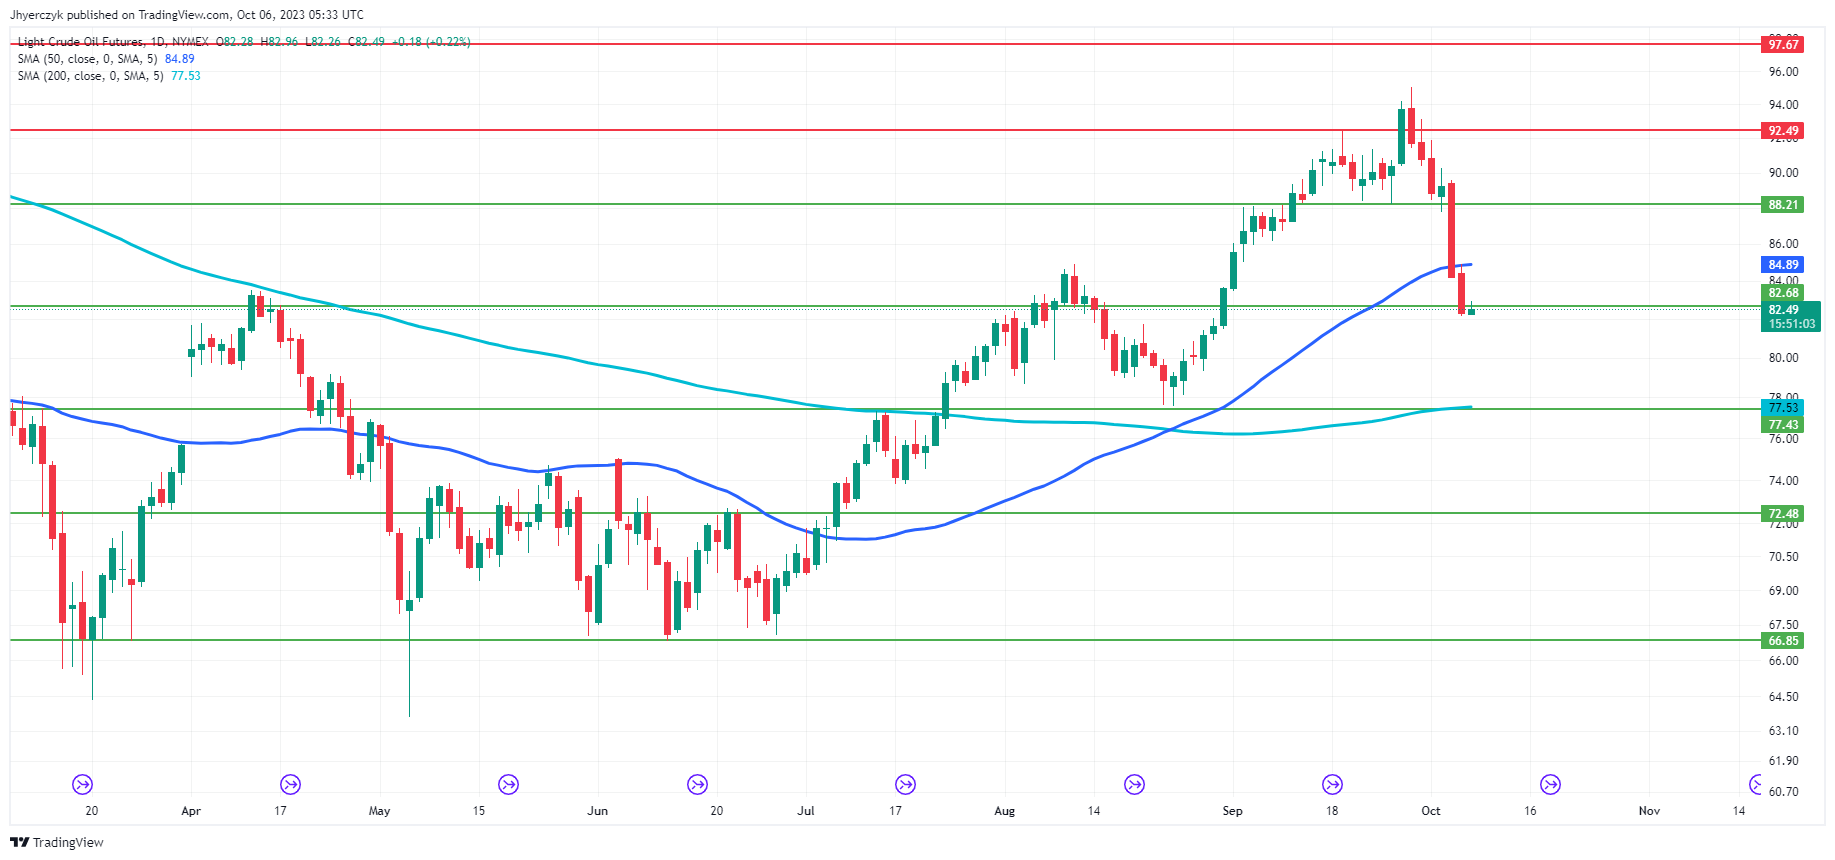
Despite the week’s turmoil, oil prices showed modest recovery on Friday. December Brent futures rose 0.17% to settle at $84.21, while November U.S. West Texas Intermediate crude futures increased 0.22% to $82.49.

Economic Indicators to Watch

Today, all eyes will be on the U.S. monthly jobs report, while next week’s data—ranging from Friday’s non-farm payroll to U.S. CPI and China’s economic numbers—will be pivotal in shaping the market’s direction. Recent reports have indicated a slowdown in the U.S. services sector and a probable contraction in the eurozone economy, both of which have capped the oil market’s rally.

Short-Term Outlook

Despite the recent volatility and sell-off, the short-term outlook for the oil market appears cautiously bullish. Market participants are likely to focus on dwindling global oil stockpiles, with expectations that Brent could rebound to levels above $90 per barrel once attention shifts back to supply constraints.

Technical Analysis

Daily Light Crude Oil FuturesDaily Light Crude Oil futures currently trade at 82.45, precariously positioned below the 50-Day moving average of 84.89 but comfortably above the 200-Day average of 77.53. This sets a complex stage: short-term bearish signals counterbalanced by a more extended bullish backdrop.

With the current price closely flirting with the minor support level at 82.68, there’s a critical point to watch. Moreover, there’s a decent upside runway before hitting minor and main resistance levels at 92.49 and 97.67, respectively.

Weighing these factors, the prevailing market sentiment leans cautiously bullish. This condition is likely to remain intact unless the 200-Day moving average is violated.