How to Trade Forex News: An Introduction

How to Trade Forex News: An Introduction

Major economic data has the potential to drastically move the forex market. It is this very movement, or volatility, that most newer traders seek when learning how to trade forex news. This article covers the major news releases, when they occur, and presents the various ways traders can trade the news.

Why Trade the News on Forex?

Traders are drawn to forex news trading for different reasons but the biggest reason is volatility. Simply put, forex traders are drawn to news releases for their ability to move forex markets. ‘News’ refers to economic data releases such as GDP and inflation, and forex traders tend to monitor such releases considered to be of ‘high importance’.

The largest moves tend to follow a ‘surprise’ in the data – where the actual data contrasts what was expected by the market – the good news here is that you don’t have to hold a PhD in Economics because our economic calendar already provides economist expectations.

Furthermore, news releases are set at pre-determined dates and times allowing traders enough time to prepare a solid strategy.

Traders that can effectively manage the risks of volatility, at the predetermined time of the news release, are well on their way to becoming consistent traders.

The Impact of Major News Releases on the Forex market

Just before a major news release, it is common to witness lower trading volumes, lower liquidity and higher spreads, often resulting in big jumps in price. This is because large liquidity providers, much like retail traders, do not know the outcome of news events prior to their release and look to offset some of this risk by widening spreads.

While large price movements can make trading major news releases exciting, it can also be risky. Due to the lack of liquidity, traders could experience erratic pricing. Such erratic pricing has the potential to cause a huge spike in price that shoots through a stop loss in the blink of an eye, resulting in slippage.

Additionally, the wider spread could place traders on margin call if there isn’t enough free margin to accommodate this. These realities surrounding major news releases could result in a short trading career if not managed properly through prudent money management such as incorporating stop losses or guaranteed stop losses (where available).

In general, major currency pairs will have lower spreads than the less traded emerging market currencies and minor currency pairs. Therefore, traders may look to trade the majors EUR/USD, USD/JPY, GBP/USD, AUD/USD and USD/CAD to mention a few.
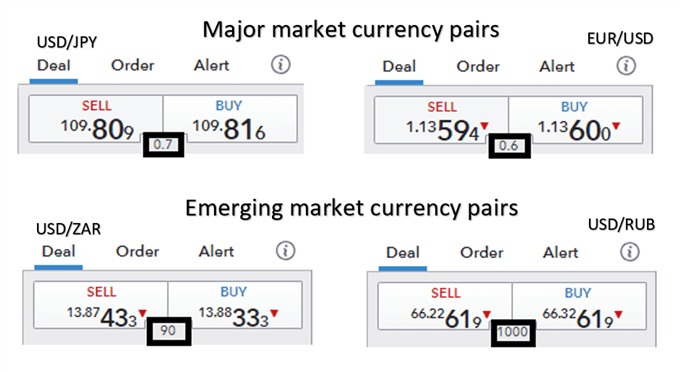
General forex spreads between majors and emerging markets

Traders need to be well prepared ahead of time – with a clear idea of what events they want to trade and when they occur. It’s also important to have a solid trading plan in place.

“Don’t think about what the market’s going to do; you have absolutely no control over that. Think about what you’re going to do if it gets there. In particular, you should spend no time at all thinking about those rosy scenarios in which the market goes your way, since in those situations, there’s nothing more for you to do. Focus instead on those things you want least to happen and on what your response will be.” – William Eckhardt

Which Major Forex News Releases to Trade?

When learning how to trade news, traders must be aware of the major news events that affect the forex market, that can be monitored closely using an economic calendar.

US economic data is so influential within global currency markets that it is generally seen as the most important news. It is important to note that not all news releases lead to increased volatility. Rather, there are a limited number of major news releases that have previously produced the greatest potential to move the market.

The table below summarizes the major US economic releases alongside some of the most important non-US data releases from around the world.

Major news releases (US and rest of world):

Economic data release Time (EST) Description
Non-farm payrolls (NFP) 8:30am – monthly release (first Friday after the month ends) Represents the net changes in employment jobs
US Gross domestic product (GDP) 8:30am – quarterly release Gauges the monetary value of all goods and services produced within the US over a specified period
US Federal Reserve Bank Federal funds rate 1:00pm – scheduled 8 times a year Interest rate at which depository institutions lend and borrow to other institutions, overnight
Australian cash rate 10:30pm (First Tuesday of the month except January) Interest rate charged on overnight loans between financial intermediaries
Australian employment change 7:30pm – monthly release (about 15 days after month ends) Change in number of employed people during the previous month
European Central Bank refinancing rate 7:45am – 8 times a year Interest rate on the main refinancing operations offering liquidity to the financial system
Bank of England official bank rate 7:00am – monthly release Interest rate that the BOE lends to financial institutions (overnight)
Bank of Canada overnight rate 10:00am – 8 times a year Overnight rate that major financial institutions borrow and lend between themselves
Canadian employment change 8:30am – monthly (about 8 days after month ends) Measures the change in the number of employed people in the previous month
Reserve Bank of New Zealand official cash rate 9.00pm – scheduled 7 times a year Interest rate at which banks borrow and lend to other banks, overnight

Key Tools & Resources to Trade Forex News

DailyFX provides a one-stop-shop for all your forex related data and news releases:

  • Economic calendar: Know when major data like the US Non-Farm-Payroll, GDP, ISM, PPI and CPI figures are due to be released.
  • Central Bank Calendar: Central Bank interest rate decisions can have profound effect on the financial markets. Get to know when they are scheduled.
  • Real time news feed: Stay up to date with breaking news, as it happens, with updates from our top analysts. Similarly, get all the major stories of the day plus analysis by following our market news.

Managing risk when trading news and events

The importance of prudent risk management cannot be overstated during volatile periods that follow a news release.

The use of stops is highly recommended but in this case, traders may want to consider using guaranteed stops (where available) over normal stops. Guaranteed stops do come with a fee so be sure to check this with your broker; however, this fee can oftentimes end up being insignificant in relation to the amount of slippage that can occur in such volatile periods.

Additionally, traders should also look to reduce their normal trade size. Volatile markets can be a trader’s best friend but also have the potential to reduce account equity significantly if left unmanaged. Therefore, in addition to placing guaranteed stops, traders can look to reduce their trade sizes to manage the emotions of trading.

3 Approaches to forex news trading

There are a number of approaches traders can adopt when developing a forex news trading strategy which depend on the timing of the trade relative to the news release.

Many traders like to trade in the moment and make decisions as and when an announcement happens – using an economic calendar to plan ahead. Others prefer to enter the market in less volatile conditions ahead of a release or announcement. To summarize, forex news trading fits into one of the categories below:

  1. Trading before the news release
  2. Trading on the news release
  3. Trading after the news release

1. Trading before the news release  

Trading forex news before the release is beneficial for traders looking to enter the market under less volatile conditions. In general, traders who are more risk averse gravitate towards this approach looking to capitalize on the quieter periods before the news release by trading ranges or simply trading with the trend. Discover strategies on how to trade before the news release.

2. Trading during a release

These forex news trading strategies are not for the faint hearted as it involves entering a trade as the news breaks or in the moments that immediately follow. This is at a time when the market is at its most volatile which underscores the importance of having a clear strategy and well-defined risk management. Equip yourself with strategies to navigate the volatility associated with forex news trading at the release.

3. Trading after the news release

Trading post-release involves entering the trade after the market has had some time to digest the news. Often the market, through price action, provides clues on its future direction – presenting traders with great opportunity. Learn how to trade the news when the market is in transition with our article on trading after the news release.

Oil Prices Forecast: Inventory Builds and OPEC Decision Fuel Market Uncertainty

Oil Prices Forecast: Inventory Builds and OPEC Decision Fuel Market Uncertainty

Oil Prices Rebound Slightly Amid OPEC+ Decision to Hold Supply Cuts

Oil prices edged higher on Thursday, mitigating some of Wednesday’s steep declines. The rebound came after an OPEC+ ministerial panel decided to maintain existing output cuts, ensuring a tight supply. Brent crude was up 63 cents at $86.44 a barrel, while U.S. West Texas Intermediate (WTI) increased by 49 cents to $84.71.

Supply and Demand Tensions Keep Market on Edge

Wednesday saw oil prices plunge by over $5, rattled by an uncertain macroeconomic landscape and diminishing fuel demand. Despite the wobble, OPEC+—comprising OPEC countries and Russia-led allies—held its nerve, making no alterations to the group’s output policy. Saudi Arabia will continue its voluntary cut of 1 million barrels per day (bpd) through 2023, and Russia will maintain a 300,000 bpd export curb until year’s end.

Trading Derivatives carries a high level of risk to your capital and you should only trade with money you can afford to lose. Trading Derivatives may not be suitable for all investors, so please ensure that you fully understand the risks involved, and seek independent advice if necessary. A Product Disclosure Statement (PDS) can be obtained either from this website or on request from our offices and should be considered before entering into a transaction with us. Raw Spread accounts offer spreads from 0.0 pips with a commission charge of USD $3.50 per 100k traded. Standard account offer spreads from 1 pips with no additional commission charges. Spreads on CFD indices start at 0.4 points. The information on this site is not directed at residents in any country or jurisdiction where such distribution or use would be contrary to local law or regulation.

Demand Uncertainties Add to Market Jitters

Negative signals are coming from the demand side as well. A survey suggested that the euro zone economy likely contracted last quarter, with consumer demand in September falling at its fastest pace in nearly three years. In the U.S., the Energy Information Administration reported a sharp week-over-week decline in gasoline demand, plummeting to an 8-million bpd low for the year.

Mixed Signals for Oil Bulls

The recent three-month rally in oil prices had been fueled by tight supply and a resilient global economy. However, bulls are now facing some turbulence as previously favorable conditions appear less robust. This sentiment is exacerbated by Wednesday’s weaker U.S. economic data and a significant build in gasoline inventories.

Short-Term Forecast: Bearish

Given the increasing demand uncertainties and unaltered OPEC+ supply policies, the short-term outlook for oil prices leans bearish. While supply constraints are unlikely to ease, demand-side indicators point toward weaker consumption, putting downward pressure on prices.

Technical Analysis

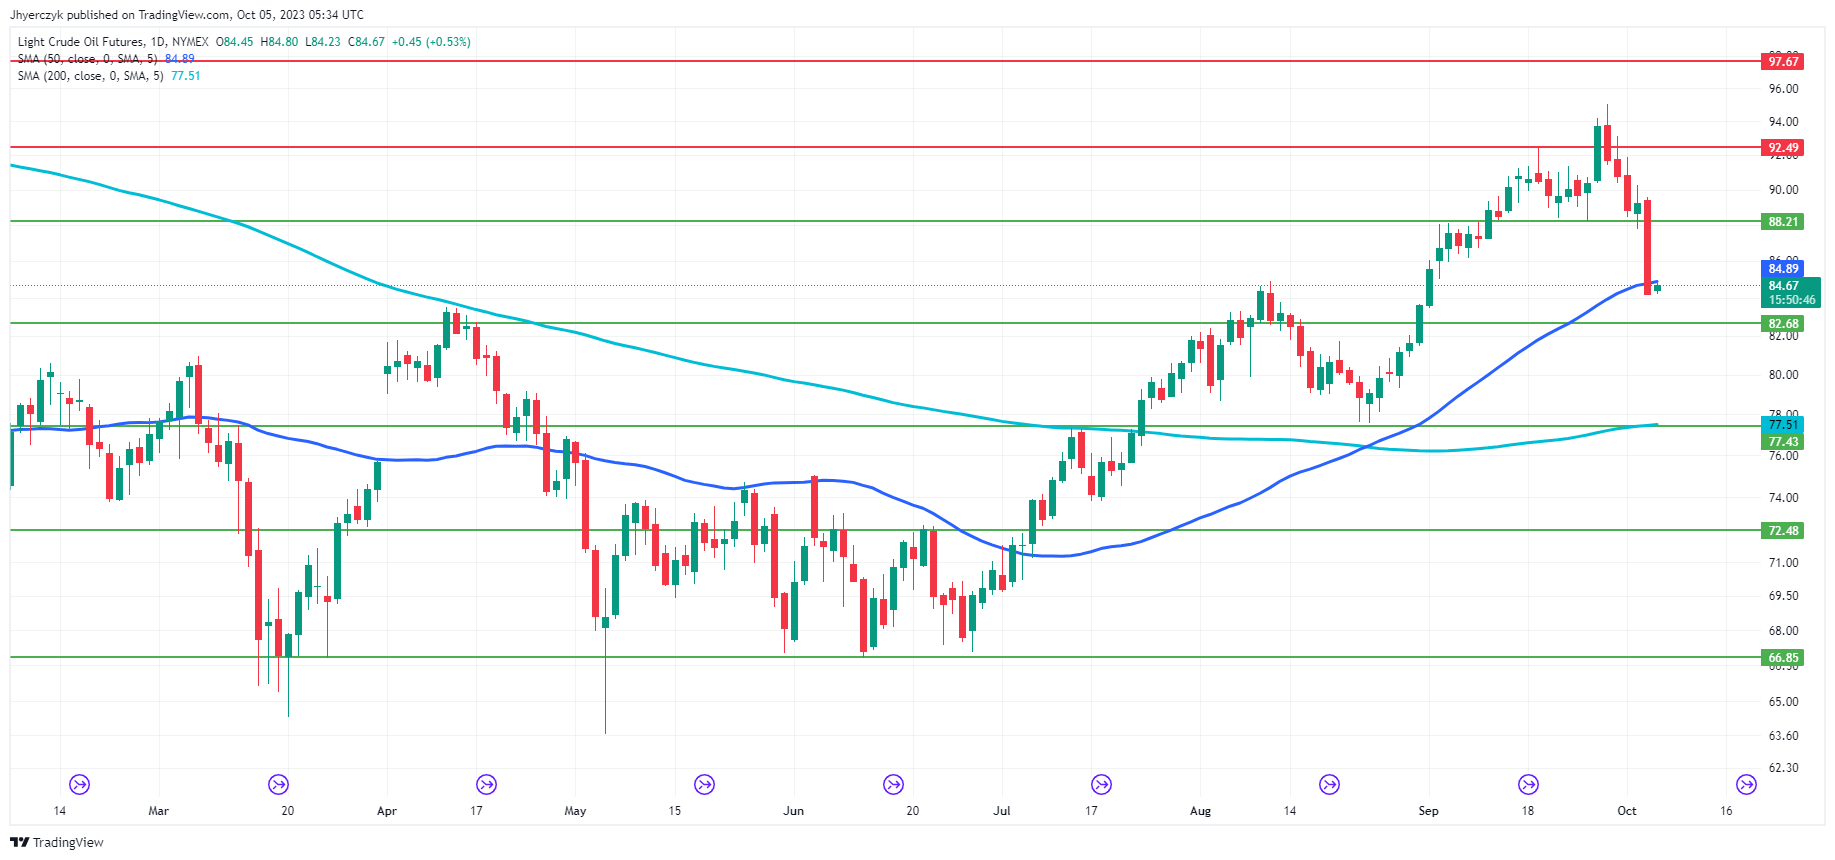
Daily Light Crude Oil FuturesThe current daily price of Light Crude Oil Futures at $84.70 hovers just below the 50-Day moving average of $84.89, suggesting a potential struggle to break higher in the near term. Meanwhile, it stands well above the 200-Day moving average of $77.51, reinforcing a generally bullish trend over a longer time frame.

On the support and resistance spectrum, the commodity trades closer to the main support level of $82.68 than to the minor resistance of $92.49. Given that the current price is nestled between these crucial points, it portrays a market in a state of equilibrium, lacking strong directional bias.

Therefore, based on this data, the current market sentiment could be described as cautiously bullish with traders probing for support and value. However, looking at the situation from a momentum standpoint, trader reaction to the 50-Day moving average is likely to set the near-term tone. If it fails as support then look for the start of another acceleration to the downside with the 200-Day moving average the next crucial target.

Dax Index: From ECB Stance to German Trade, Navigating the Financial Landscape

Dax Index: From ECB Stance to German Trade, Navigating the Financial Landscape

DAX Wednesday Overview

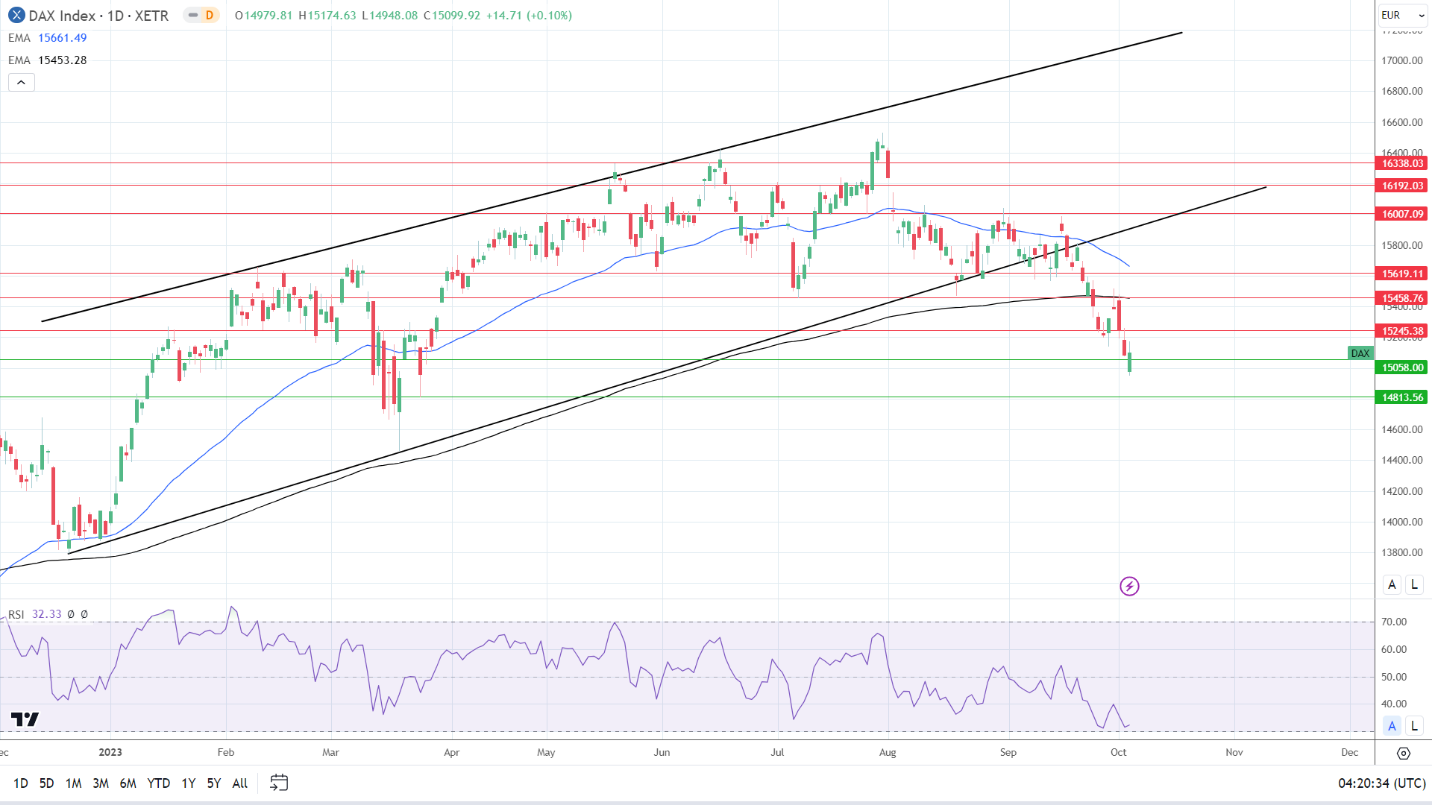
On Wednesday, the DAX gained by 0.10%. Following a 1.06% loss on Tuesday, the DAX ended the day at 15,100.

Service Sector PMIs and Government Bond Yields Offer Relief

Euro area service sector PMI numbers for September provided relief on Wednesday. The German services sector expanded, with the services PMI rising from 47.3 to 50.3 (Prelim: 49.8).

Trading Derivatives carries a high level of risk to your capital and you should only trade with money you can afford to lose. Trading Derivatives may not be suitable for all investors, so please ensure that you fully understand the risks involved, and seek independent advice if necessary. A Product Disclosure Statement (PDS) can be obtained either from this website or on request from our offices and should be considered before entering into a transaction with us. Raw Spread accounts offer spreads from 0.0 pips with a commission charge of USD $3.50 per 100k traded. Standard account offer spreads from 1 pips with no additional commission charges. Spreads on CFD indices start at 0.4 points. The information on this site is not directed at residents in any country or jurisdiction where such distribution or use would be contrary to local law or regulation.

ECB commentary also provided support for riskier assets. ECB President Christine Lagarde reiterated that monetary policy is “Sufficiently Restrictive,” easing fears of further ECB rate hikes.

Late in the European session, US ADP nonfarm and ISM Non-Manufacturing PMI numbers eased bets on a more aggressive Fed rate path. Weaker-than-expected ADP numbers and slower service sector activity contributed to a pullback in US Treasury yields.

The US equity markets found support from the fall in US Treasury yields. On Wednesday, the NASDAQ Composite Index gained 1.35%, with the S&P 500 and Dow rising by 0.81% and 0.39%.

The Wednesday Market Movers

Falling government bond yields drove demand for rate-sensitive DAX tech stocks. Infineon Technologies led the way, rallying 3.95%.

However, the auto sector had a mixed session. Volkswagen gained 0.43%, with Mercedes-Benz Group ending the session flat. Porsche and Continental saw losses of 0.02% and 0.73%.

Bank stocks continued to decline. Deutsche Bank and Commerzbank ended the day down 0.12% and 0.83%.

German Trade Data and the ECB in Focus

On Thursday, German trade data for August will draw investor interest. Economists forecast the German trade surplus to narrow from €15.9 billion to €15.0 billion. A marked decline in exports will likely test buyer appetite for DAX-listed stocks. Economists predict exports to fall by 0.4% (July: -0.9%).

While the numbers will influence investor sentiment, ECB commentary also needs consideration. The markets are easing bets on more rate hikes. However, the higher-for-longer rate path theme remains a headwind.

ECB Chief Economist Philip Lane is on the calendar to speak today. On Tuesday, Lane discussed the impact of wage growth and the services sector on inflation. Notably, Lane stated it could take time to curb the effects of wage growth and the services sector on inflation.

US Initial Jobless Claims and the Fed in the Spotlight

Later today, US jobless claims will garner investor interest. An unexpected spike in jobless claims may ease fears of a hawkish Fed rate path. Economists forecast initial jobless claims to increase from 204k to 210k.

Investors may show more sensitivity to the Jobless Report after the weaker-than-expected ADP numbers.

Beyond the economic indicators, FOMC member speeches also need consideration. FOMC members Loretta Mester, Mary Daly, Michael Barr, and Thomas Barkin are on the calendar to speak today. A hawkish interest rate outlook will likely test buyer appetite for riskier assets.

The DAX and NASDAQ mini were up 66 and 11 points this morning. 10-year US Treasury yields fell to a morning low of 4.710% before steadying.

Short-Term Forecast

The futures market and US Treasury yields signal a positive start to the European session. However, FOMC member commentary and US jobless claims will provide direction before the US Jobs Report. Hawkish Fed comments and steady jobless claims will likely pressure the DAX later in the European session.

DAX Technical Indicators

Daily Chart

The DAX remained below the 50-day and 200-day EMAs, reaffirming bearish price signals. A return to 15,200 would support a DAX move to the 15,245 resistance level. Better-than-expected German trade data and a spike in US jobless claims would likely deliver a positive session.

However, hawkish Fed comments and steady jobless claims would weigh on buyer appetite. A break below the 15,058 support level would give the bears a run at the 14,814 support level.

The 14-day RSI reading of 32.33 supports a DAX break below the 15,058 support level before entering oversold territory.

DAX Daily Chart sends bearish price signals.
DAX 051023 Daily Chart

4-Hourly Chart

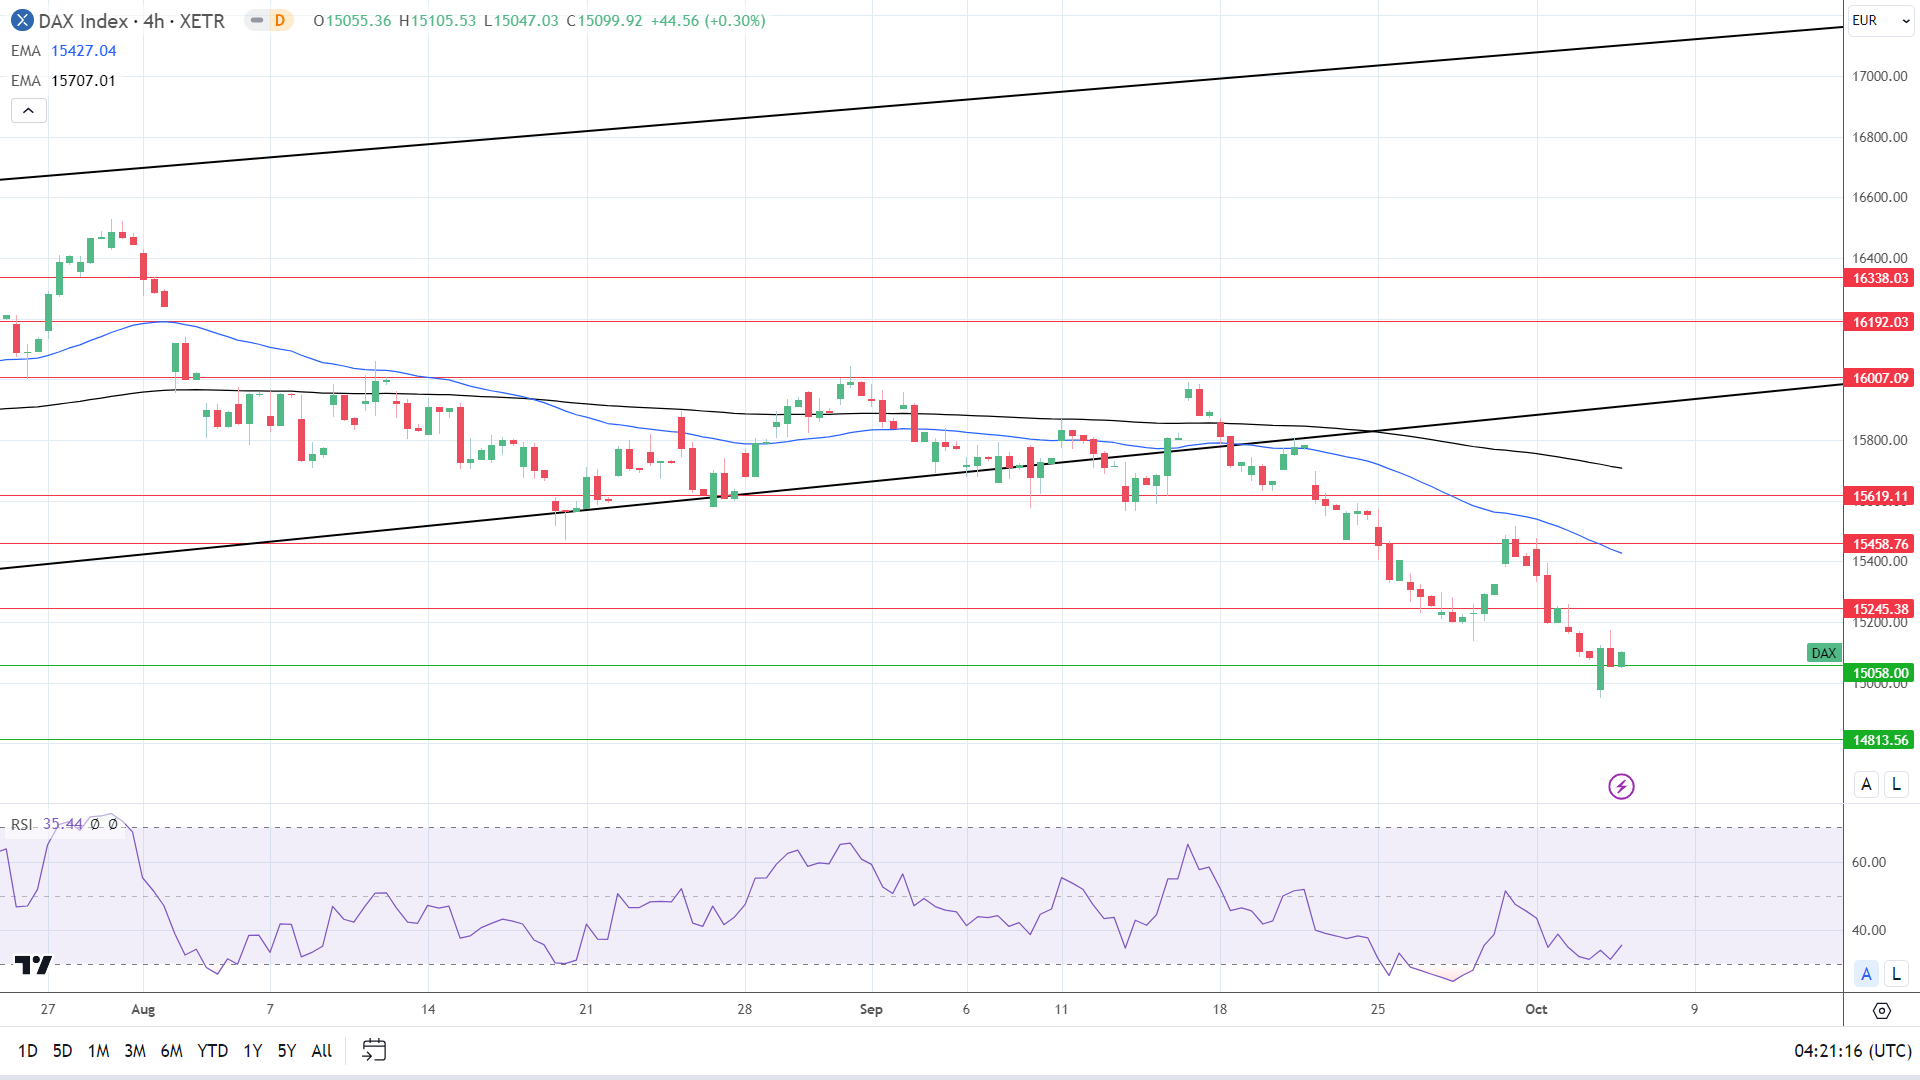
The DAX, remaining below the 50-day and 200-day EMAs, reaffirms bearish price signals. A DAX break above 15,200 would support a move toward the 15,245 resistance level.

However, a fall below the 15,058 support level would give the bears a run at the 14,814 support level.

The 35.44 RSI reading suggests a DAX drop below the 15,058 support level before entering the oversold territory.

4-Hourly Chart reaffirms bearish price signals.
DAX 051023 4-Hourly Chart
EUR/USD Forecast: Analyzing German Trade Data Amid Recession Fears

EUR/USD Forecast: Analyzing German Trade Data Amid Recession Fears

Wednesday Overview

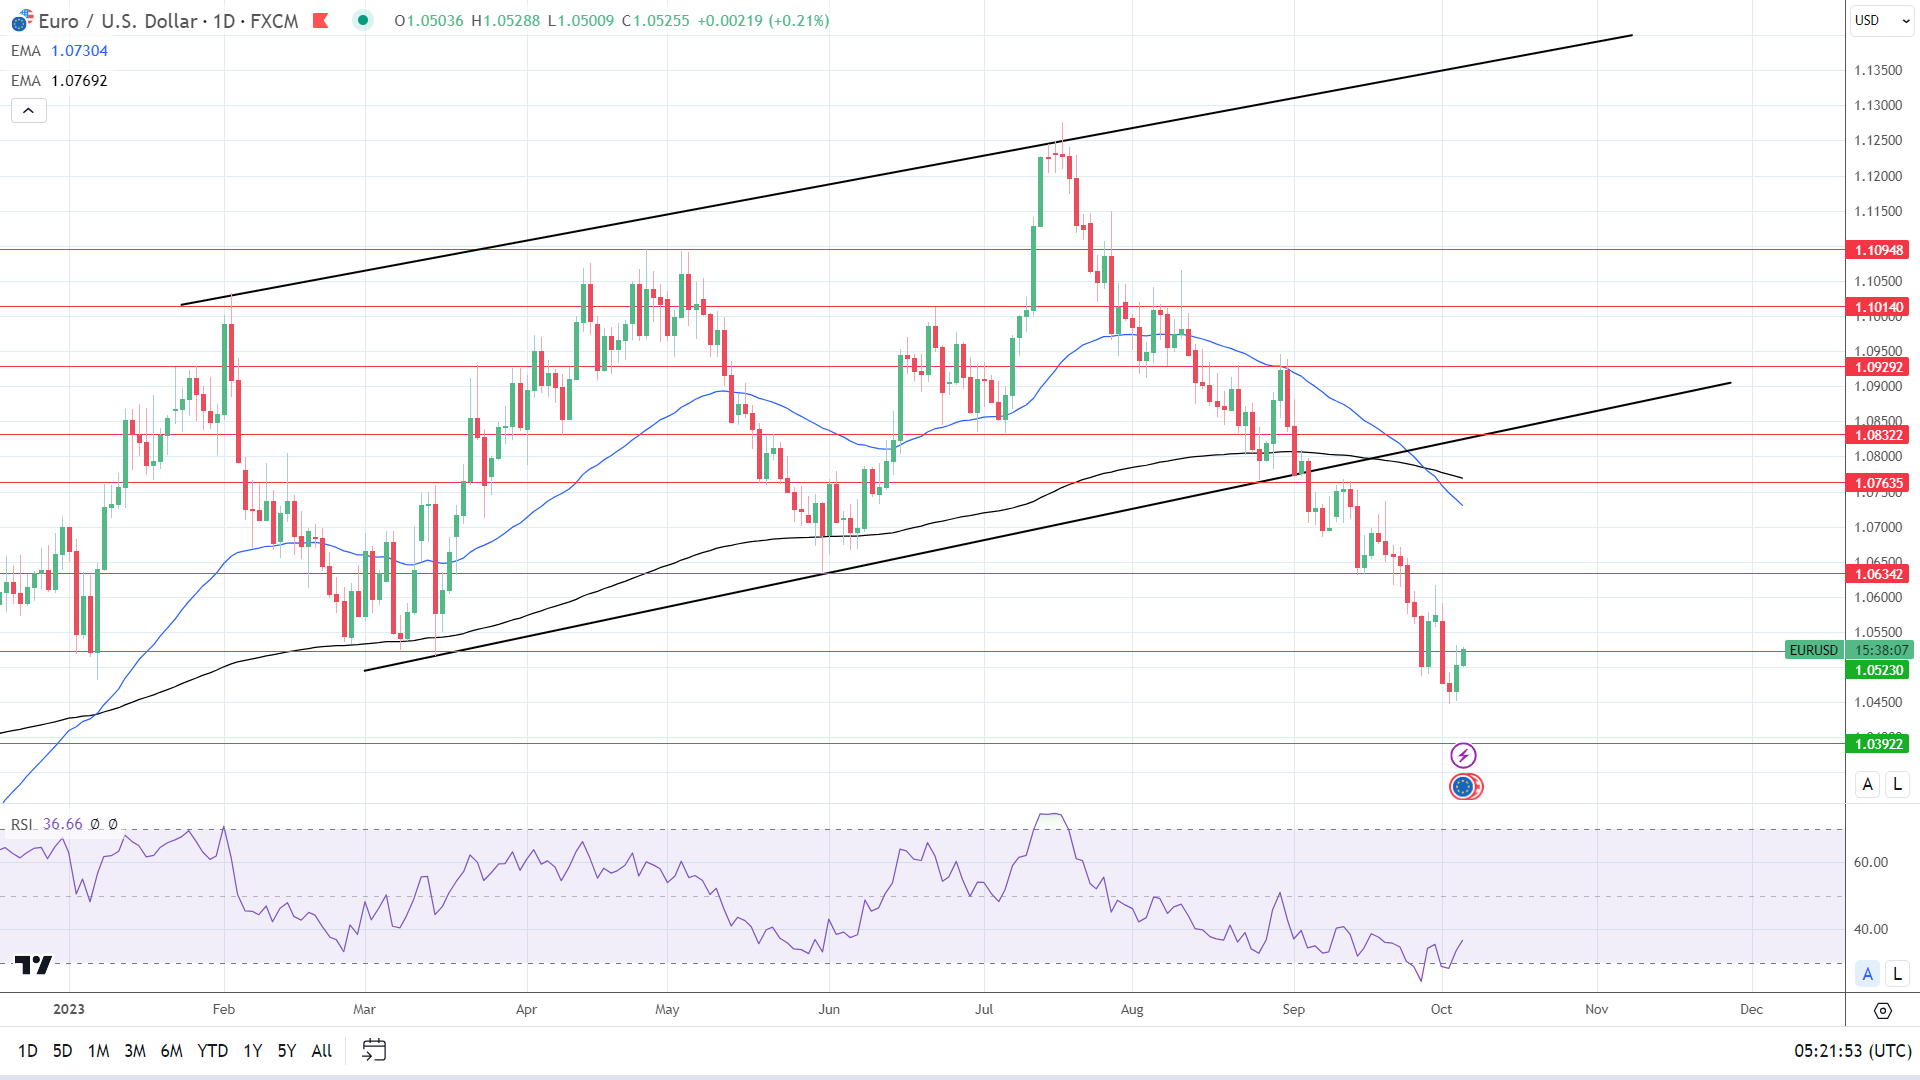
On Wednesday, the EUR/USD gained 0.38%. Reversing a 0.10% loss from Tuesday, the EUR/USD ended the day at $1.05036. The EUR/USD fell to a low of $1.04513 before reaching a high of $1.05085.

German Economy and ECB Commentary to Move the Dial

The German economy will be in the spotlight again on Thursday. German trade data will garner investor interest amidst concerns of a prolonged economic recession. Economists forecast the trade surplus to narrow from €15.9 billion to €15.0 billion in August.

Trading Derivatives carries a high level of risk to your capital and you should only trade with money you can afford to lose. Trading Derivatives may not be suitable for all investors, so please ensure that you fully understand the risks involved, and seek independent advice if necessary. A Product Disclosure Statement (PDS) can be obtained either from this website or on request from our offices and should be considered before entering into a transaction with us. Raw Spread accounts offer spreads from 0.0 pips with a commission charge of USD $3.50 per 100k traded. Standard account offer spreads from 1 pips with no additional commission charges. Spreads on CFD indices start at 0.4 points. The information on this site is not directed at residents in any country or jurisdiction where such distribution or use would be contrary to local law or regulation.

A more marked decline in exports than forecasts will likely weigh on the EUR/USD. Economists predict German exports to decline by 0.4% (July: -0.9%). The German trade-to-GDP ratio sat above 90% in June 2023. A narrowing in the trade surplus would align with the expectations of a German recession.

Beyond the economic indicators, ECB Chief Economist Philip Lane is on the calendar to speak on Thursday. On Tuesday, Lane discussed wage growth and service sector influences on inflation. Lane highlighted the need for more progress on curbing wage growth to tame inflation, which could take time.

Clues on monetary policy goals will influence buyer appetite for the EUR.

US Initial Jobless Claims and Fed Speeches in Focus

The US labor market will be under scrutiny again on Thursday. After the weaker-than-expected ADP Nonfarm Report, initial jobless claims will garner investor interest. An unexpected spike in claims may ease bets on a hawkish Fed rate path and raise fears of a weak US Jobs Report. Economists forecast initial jobless claims to increase from 204k to 210k.

Deteriorating labor market conditions could dampen wage growth and consumer spending. A pullback in consumer spending would ease demand-driven inflationary pressures and the need for a hawkish Fed rate path.

Beyond the numbers, FOMC members Thomas Barkin, Michael Barr, Mary Daly, and Loretta Mester are on the calendar to speak today. FOMC voting member Michael Barr may impact Fed policy bets more.

Short-Term Forecast:

US monetary policy divergence remains tilted in favor of the US dollar despite the recent US ADP and ISM figures. However, a disappointing US jobs report could narrow bets on a hawkish Fed rate path and offer EUR/USD price support.

EUR/USD Price Action

Daily Chart

The EUR/USD sat below the 50-day and 200-day EMAs, affirming bearish price signals.

A EUR/USD breakout from the $1.05230 support level would support a run at the Monday high of $1.05918. A widening German trade surplus, stemming from rising exports and a spike in US jobless claims data, will likely drive demand for the EUR.

However, a modest increase in US jobless claims and hawkish Fed comments would pressure the EUR/USD. A break below the 1.05230 support level would bring the $1.03922 support level into play.

The 14-period Daily RSI at 36.66 supports a EUR/USD fall below $1.05230 support level before entering oversold territory.

EUR/USD Daily Chart sends bearish price signals.
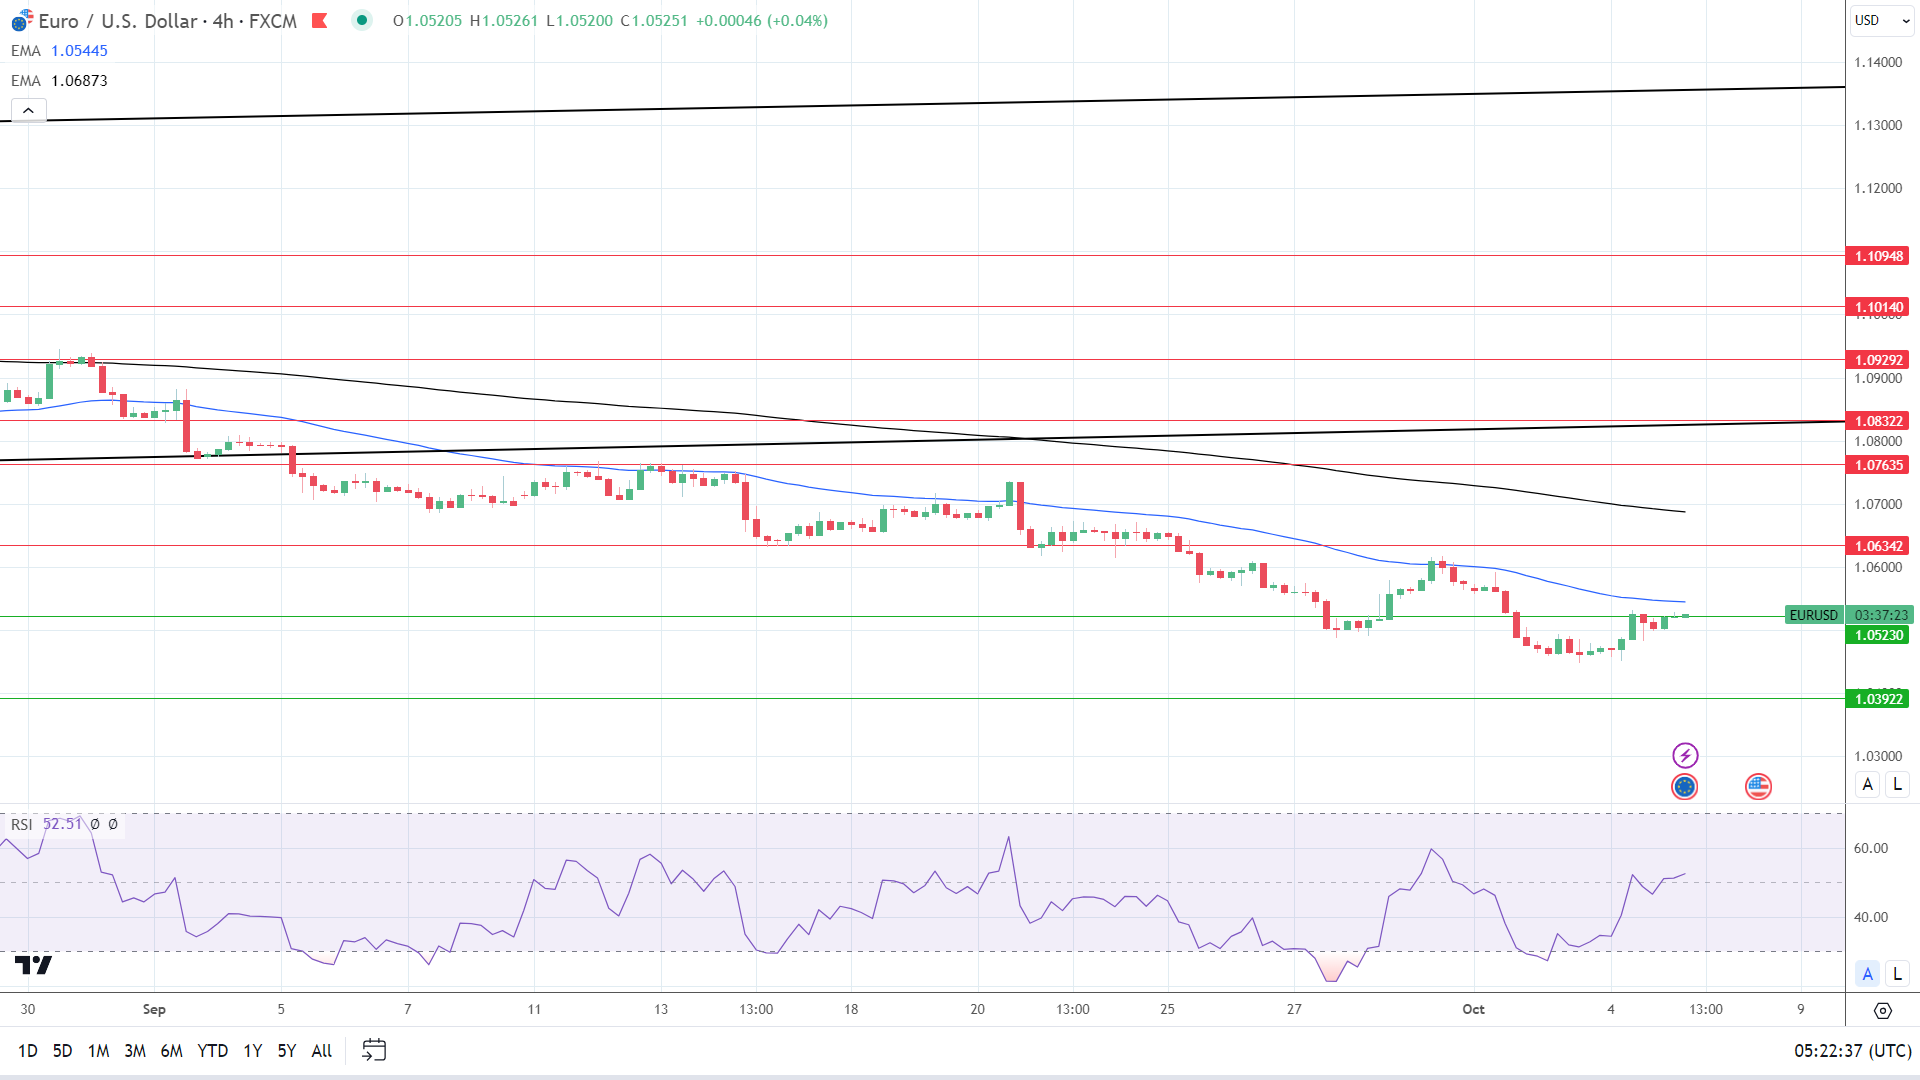
4-Hour ChartThe EUR/USD remains below the 50-day and 200-day EMAs, reaffirming the bearish price signals. A EUR/USD break above the 50-day EMA would give the bulls a run at the Monday high of $1.05918.

However, a drop below the $1.05230 support level would support a move toward the 1.03922 support level.

The 14-period 4-Hourly RSI at 52.51 supports a EUR/USD break above the 50-day EMA and a return to $1.06 before entering overbought territory.

4-Hourly Chart reaffirms bearish price signals.
EURUSD 051023 4 Hourly Chart
Silver Prices Forecast: XAG/USD Traders Battle Yields, Dollar, Upcoming Data

Silver Prices Forecast: XAG/USD Traders Battle Yields, Dollar, Upcoming Data

Silver Faces Market Headwinds Amid Economic Uncertainty

The silver (XAG/USD0 market is currently locked in a state of hesitancy, teetering between gains and losses as traders await key economic data releases. Silver nudged up 0.97% on Thursday to $21.21 per ounce, suggesting a feeble recovery after a series of declines, in stark contrast to gold’s worst losing streak since 2016.

Economic data is the driving force behind the current price action in the silver market. All eyes are on the imminent non-farm payrolls report, a bellwether for the Federal Reserve’s monetary policy. According to current market expectations, as gauged by the CME FedWatch tool, there’s a 24% likelihood of another 25-basis point rate hike this year. Additionally, U.S. CPI data expected next week will serve as another decisive catalyst for silver’s trajectory.

Trading Derivatives carries a high level of risk to your capital and you should only trade with money you can afford to lose. Trading Derivatives may not be suitable for all investors, so please ensure that you fully understand the risks involved, and seek independent advice if necessary. A Product Disclosure Statement (PDS) can be obtained either from this website or on request from our offices and should be considered before entering into a transaction with us. Raw Spread accounts offer spreads from 0.0 pips with a commission charge of USD $3.50 per 100k traded. Standard account offer spreads from 1 pips with no additional commission charges. Spreads on CFD indices start at 0.4 points. The information on this site is not directed at residents in any country or jurisdiction where such distribution or use would be contrary to local law or regulation.

Interest Rate Conundrum

Silver’s tepid performance is tethered to Federal Reserve actions and the dynamics of Treasury yields. With the Fed unwavering in its interest rate hikes since March 2022, the allure of non-yielding assets like silver diminishes. The recent retreat in the U.S. 10-year bond yields and a softer dollar have taken some heat off the metal but haven’t swung the market sentiment firmly in favor of bulls.

Labor Market Impact

Expectations for September’s non-farm payrolls stand at a 170,000 increase, down from 187,000 in August. The preceding ADP report painted a lackluster picture of job growth, primarily in service sectors. Such subdued labor metrics could signal the Federal Reserve to slow its pace of rate hikes, potentially influencing silver prices.

Short-Term Outlook: Tentatively Bearish

In the short term, the silver market retains a bearish undertone, constrained by the ongoing Treasury yield fluctuations and the Federal Reserve’s monetary stance. However, if incoming economic reports underperform market expectations, silver could rally. Simply stated, XAG/USD’s next move is likely to be data-driven.

Technical Analysis

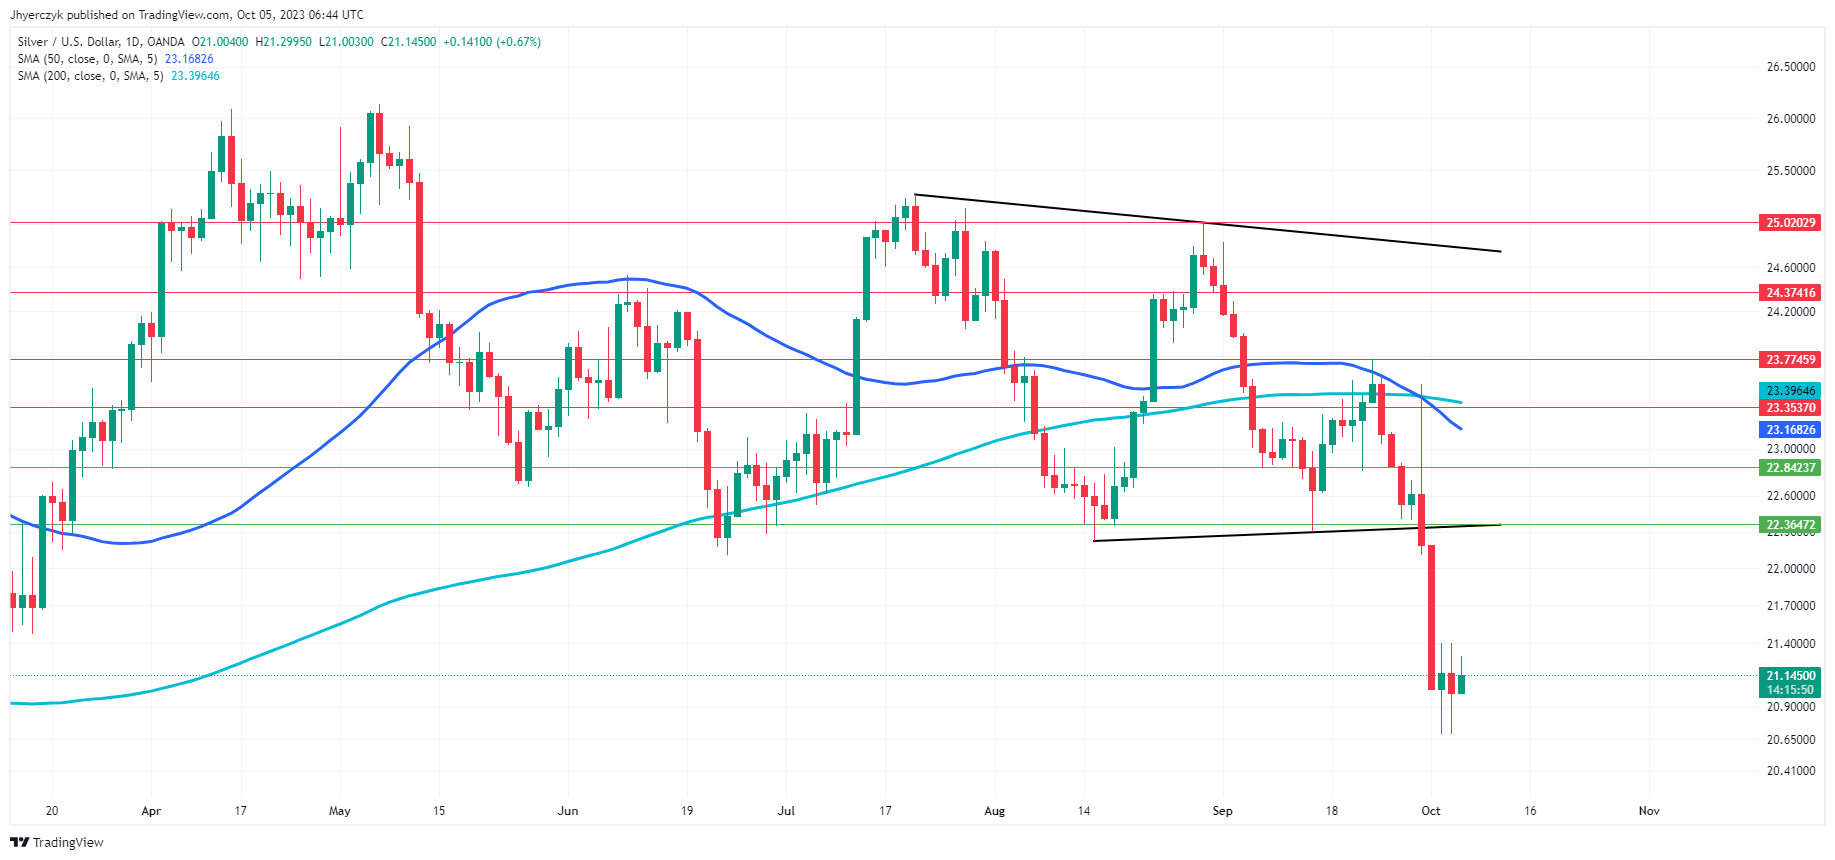
Daily Silver (XAG/USD)The daily price of Spot Silver (XAG/USD) at 21.14 currently sits well below both the 200-Day and 50-Day moving averages, at 23.40 and 23.17, respectively, indicating a bearish trend in the commodity.

Moreover, this price level is well below the main and minor support levels of 22.36 and 22.84. With the trend line support at 22.36 not far off, the recent breach further accelerated to the downside.

In summary, based on these indicators, the current market sentiment for Spot Silver can be classified as bearish. However, with a support base possibly forming, the market remains vulnerable to a short-covering rally.

Gold Prices Forecast: XAU/USD Stable with Eyes on Non-Farm Payrolls, Rate Hikes

Gold Prices Forecast: XAU/USD Stable with Eyes on Non-Farm Payrolls, Rate Hikes

Gold Shows Signs of Life Amid Economic Indicators

Gold (XAU/USD) futures are shaking off recent lows, indicating the market’s wavering sentiment ahead of critical economic indicators. On Thursday, spot gold inched up 0.3% to $1,826.74 per ounce, while U.S. gold futures showed similar gains, settling at $1,840.90. The precious metal is attempting a rebound after a consistent losing streak, its longest since 2016.

The Weight of Economic Indicators

Economic data is currently acting as the puppet master of the gold market. The focus is sharply on Friday’s non-farm payrolls report, a critical metric for the Federal Reserve’s rate-hike decisions. According to the CME FedWatch tool, markets are factoring in a 24% chance of another 25-basis point rate hike this year. Adding to the list of decisive factors is next week’s U.S. CPI data. Both sets of data could either provide gold the much-needed ammunition to rally or push it further into the bearish territory.

Trading Derivatives carries a high level of risk to your capital and you should only trade with money you can afford to lose. Trading Derivatives may not be suitable for all investors, so please ensure that you fully understand the risks involved, and seek independent advice if necessary. A Product Disclosure Statement (PDS) can be obtained either from this website or on request from our offices and should be considered before entering into a transaction with us. Raw Spread accounts offer spreads from 0.0 pips with a commission charge of USD $3.50 per 100k traded. Standard account offer spreads from 1 pips with no additional commission charges. Spreads on CFD indices start at 0.4 points. The information on this site is not directed at residents in any country or jurisdiction where such distribution or use would be contrary to local law or regulation.

Interest Rates and Treasury Yields

Gold’s performance has been largely influenced by Federal Reserve policies and Treasury yields. The Fed began raising interest rates in March 2022 and shows no signs of easing off, thereby making gold—an asset that provides no yield—less attractive. The recent decrease in 10-year bond yields and a softer dollar has somewhat relieved pressure on gold, but not enough to signal a bullish market.

Labor Market Signals

Economists are projecting a 170,000 increase in September’s non-farm payrolls, down from a 187,000 uptick in August. The ADP report released on Wednesday showed service sectors accounting for most job gains, but overall job growth was slower than expected. This tepid data could indicate a potential slowdown in interest rate hikes by the Fed.

Short-Term Forecast: Cautiously Bearish

In the immediate term, the gold market is cautiously bearish, restrained largely by elevated Treasury yields and Fed policies. However, the metal could see a rally if the upcoming economic reports underperform expectations. For now, it would be wise for those long on gold to hold their positions because it looks as if the worst of the selling is over, although the outlook remains dicey.

Technical Analysis

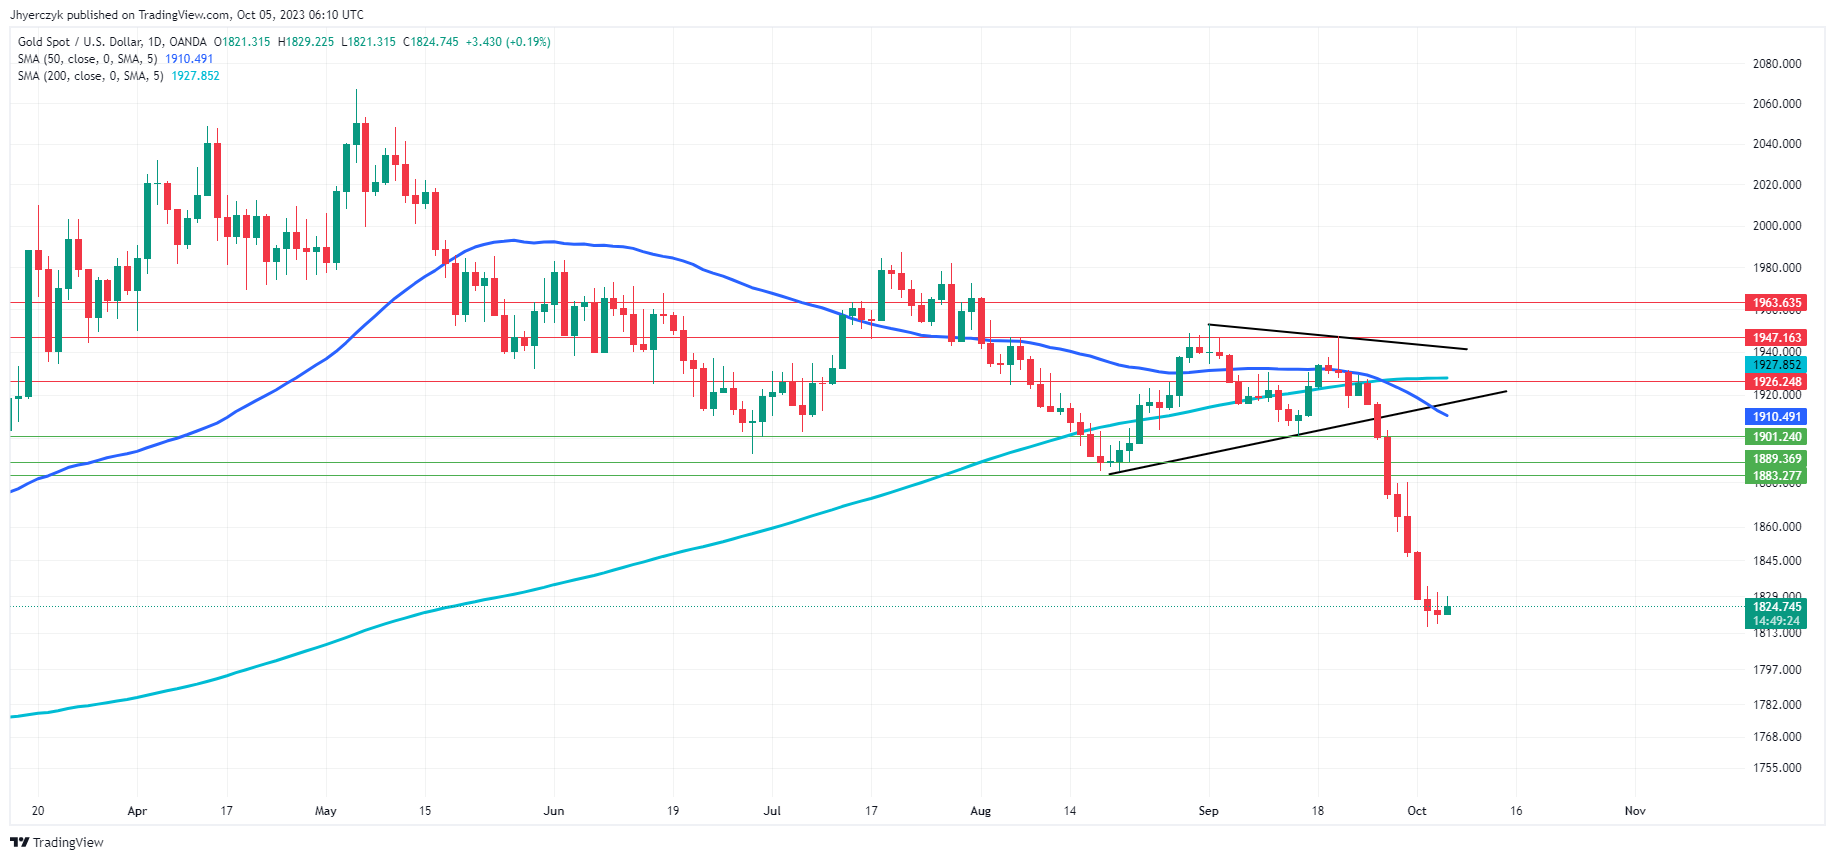
Daily Gold (XAU/USD)Spot Gold (XAU/USD) is currently trading below both key indicators with a current Daily price of 1824.57. The 200-Day moving average stands at 1927.85, and the 50-Day at 1910.48, signaling a bearish trend in the market. The Daily price is also below the minor and main support levels, reinforcing the bearish sentiment.

However, it’s worth noting that the current Daily price did see a slight uptick from the previous close of 1821.32, suggesting minor bullish activity in an otherwise bearish landscape. Overall, the current market sentiment for Spot Gold leans bearish.

German Trade Surplus Widens to €16.6 billion but Exports Slide by 1.2% in August

German Trade Surplus Widens to €16.6 billion but Exports Slide by 1.2% in August

German Trade Surplus

The German trade surplus unexpectedly widened from €15.9 billion to €16.6 billion in August. Economists forecast the trade surplus to narrow from €15.9 billion to €15.0 billion.

However, exports declined by 1.2% compared with July. Economists forecast a more modest 0.4% decline.

According to Destatis,

  • Exports were down 5.8% compared with August 2022.
  • Imports fell by 0.4% in August while rising 16.8% compared with August 2022.

Trade with EU Countries

  • German exports to EU member states declined by 1.5%, while imports rose by 1.9%
  • Exports to euro area countries fell by 2.6% vs. a 3.2% jump in imports.

Trade with Non-EU Countries

  • German exports to non-EU countries were down 0.9% compared with July 2023, while imports slid by 3.0%.
  • Exports to the US declined by 1.3%, while exports to China increased by 1.2%.
  • Imports from China and the US fell by 2.0% and 3.1%, respectively.

The larger-than-expected slide in exports and fall in imports aligned with expectations of a German recession. Germany’s trade-to-GDP ratio exceeded 90% in June 2023.

EUR/USD Reaction to German Trade Data

Ahead of the German Trade Report, the EUR/USD fell to a low of $1.05009 before rising to a pre-stat high of $1.05288.

However, in response to the German trade figures, the EUR/USD rose to a post-stat high of $1.05210 before falling to a low of $1.05125.

This morning, the EUR/USD was up 0.10% to $1.05139.

EUR/USD responds to the larger-than-expected fall in exports.
051023 EURUSD 3 Minute Chart

Next Up

ECB Chief Economist Philip Lane will participate in a policy panel at the ECB Conference on Monetary Policy: Bridging Science and Practice. Further comments on tackling inflation and the outlook for interest rates will draw interest.

Following the ADP Nonfarm Report, US initial jobless claims will be in focus later today. Economists forecast initial jobless claims to increase from 204k to 210k. An unexpected spike in jobless claims may fuel bets on a deterioration in US labor market conditions.

Weaker labor market conditions would likely ease pressure on the Fed to pursue a hawkish interest rate path.

However, investors must monitor FOMC member commentary throughout the day. FOMC members Loretta Mester, Mary Daly, Michael Barr, and Thomas Barkin are on the calendar to speak today. FOMC voting member Michael Barr may impact Fed rate hike expectations more.

AUD Price Forecast: Signs of Weaker US Jobs Market Aid Aussie Dollar

AUD Price Forecast: Signs of Weaker US Jobs Market Aid Aussie Dollar

AUSTRALIAN DOLLAR FUNDAMENTAL BACKDROP

The Australian dollar is attempting to claw back losses against the US dollar after US ISM services PMI’s softened alongside services employment figures (a positive for doves as NFP’s loom). ADP employment change supplemented this trend by missing forecasts. That being said, ADP figures have not been reliable indicators for NFP numbers of recent and with JOLTs job openings ticking higher, the door is wide open for the NFP to move in either direction.

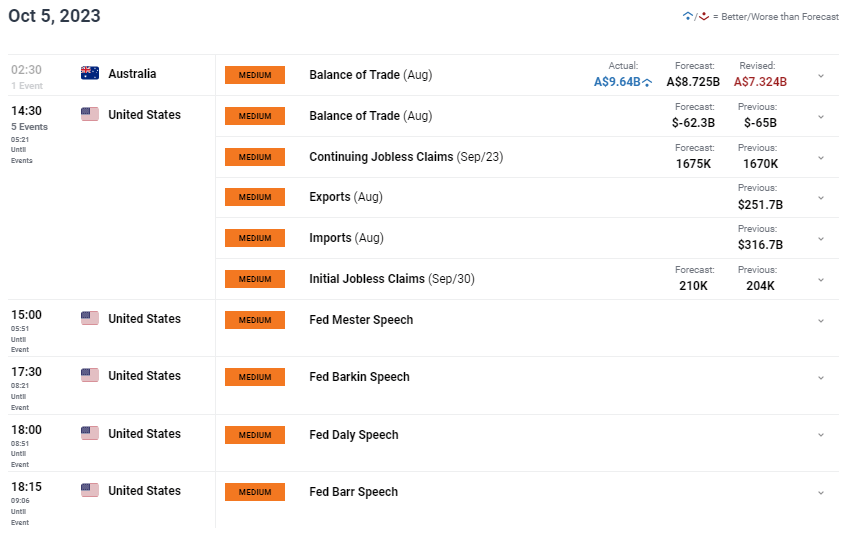
Australia’s balance of trade earlier this morning surprised to the upside but still below the recent average; overall a net positive for the AUD. The day ahead remains focused on US specific factors including more jobs data via jobless claims that are expected to follow the ADP print. Should this occur, US Treasury yields may fall further and benefit the pro-growth Aussie dollar. Later in the session, Fed speakers will be scheduled to speak and it will be interesting to see how their outlooks may have changed after recent economic data.

In summary, the day ahead may not be as market moving due to traders being cautious ahead of tomorrow’s NFP’s where volatility should pick up once more.

AUD/USD ECONOMIC CALENDAR (GMT +02:00)

image1.png

TECHNICAL ANALYSIS

AUD/USD DAILY CHART

image2.png

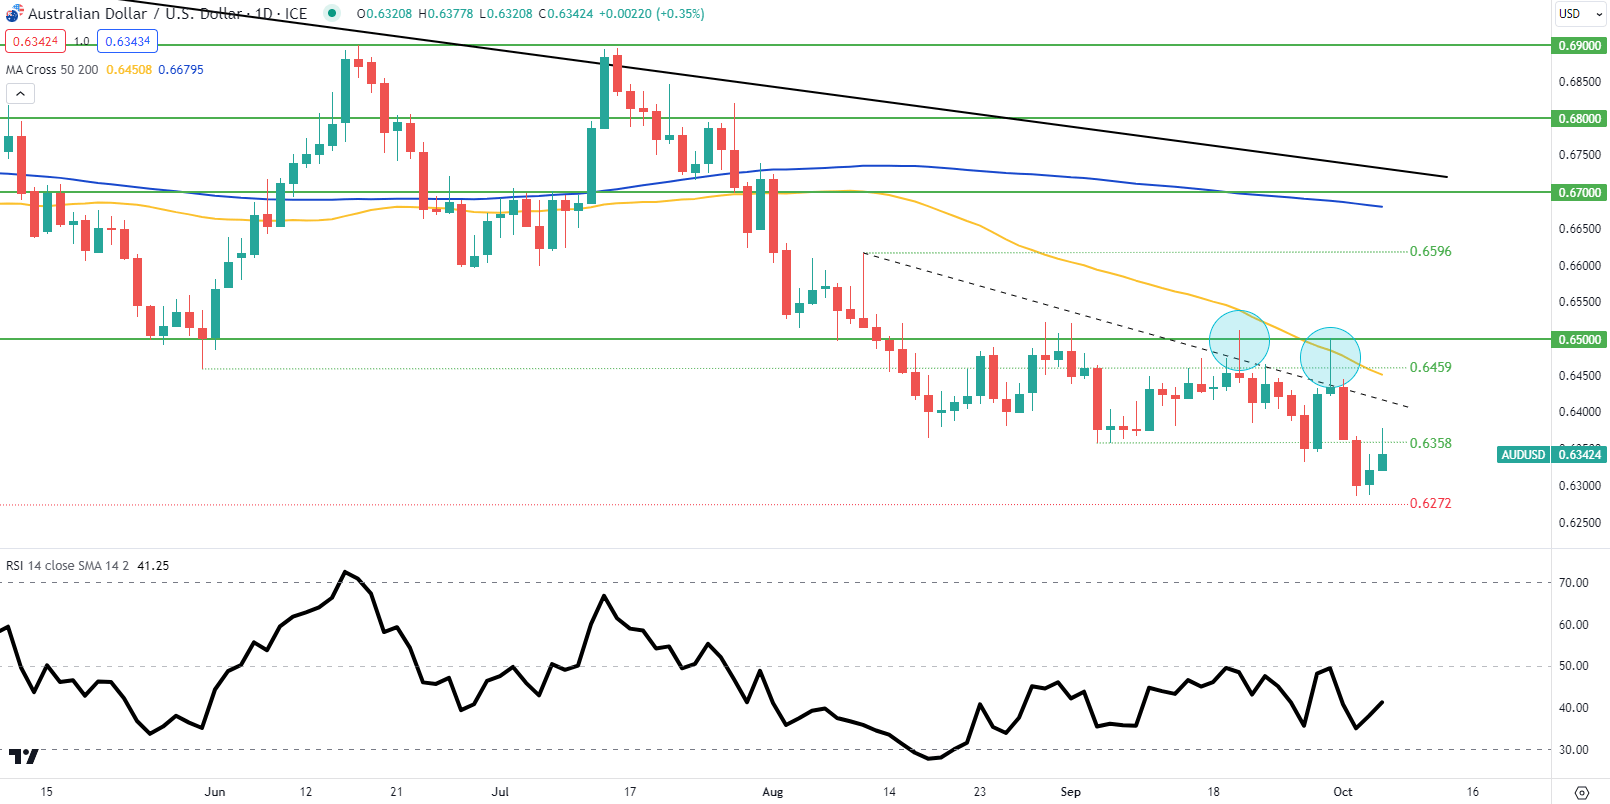
Daily AUD/USD price action has not quite reached November 2022 swing lows at 0.6272 but is showing a push higher. The Relative Strength Index (RSI) seeing higher lows relative to prices exhibit positive/bullish divergence and could be suggestive of further upside to come. The next key resistance zone will once again come from the medium-term trendline (dashed black line) but this bullish move is highly dependent on tomorrow NFP’s.

Crude Oil Eyeing 7 Percent Drop this Week So Far as Retail Bets Becoming More Bullish

Crude Oil Eyeing 7 Percent Drop this Week So Far as Retail Bets Becoming More Bullish

Crude oil prices are on course to sink nearly 7 percent this week so far. If confirmed, this could end up being the worst 5-day period for WTI since the middle of March. Retail traders are now increasingly boosting upside exposure. This can be seen by taking a look at IG Client Sentiment (IGCS), which could have a key influence on where the commodity goes from here.

Crude Oil Sentiment Outlook – Bearish

According to IGCS, about 57% of retail traders are net-long crude oil. Since most of them remain net-long, this hints that prices may continue falling down the road. This is as upside bets increased by 33.08% and 67.76% compared to yesterday and last week, respectively. With that in mind, the combination of overall exposure and recent changes offers a stronger bearish contrarian trading bias.

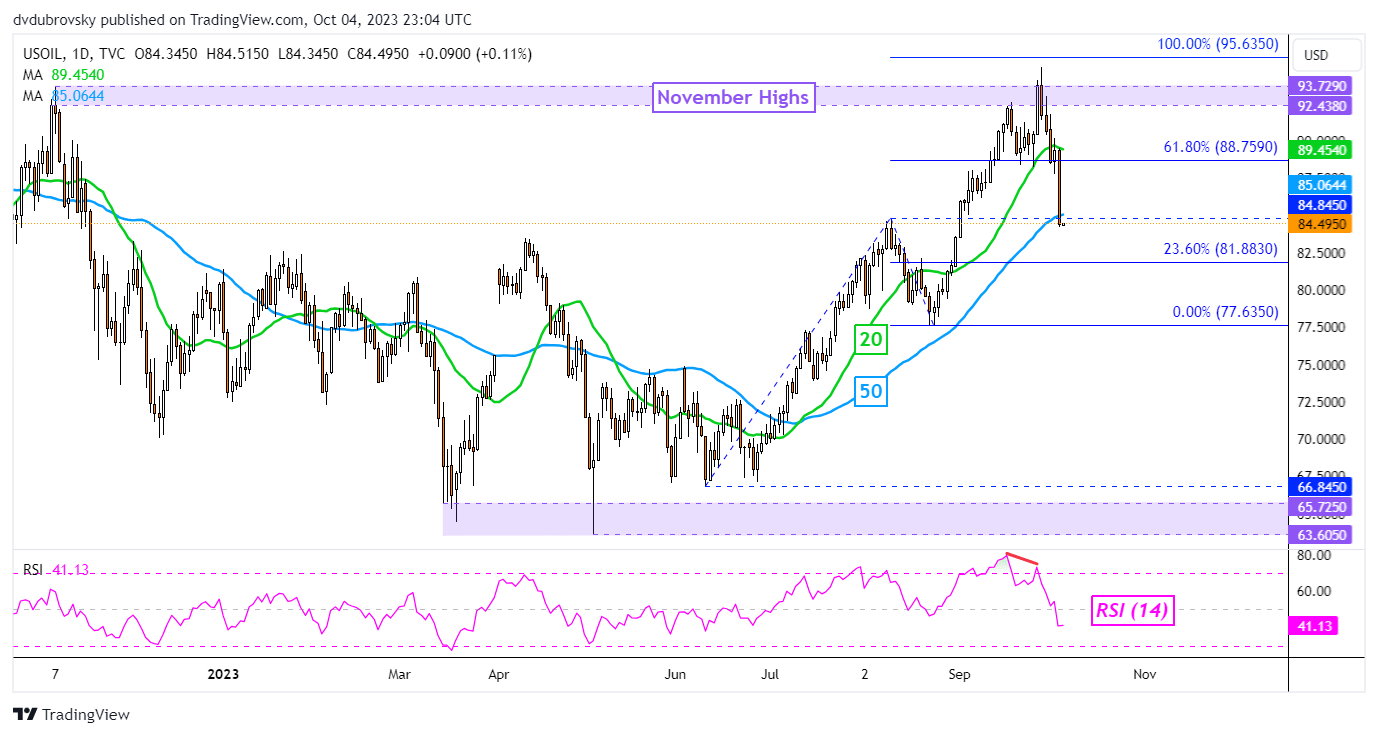
On the daily chart below, WTI has confirmed a breakout under the 20-day moving average and recently closed under the 50-day moving average. However, confirmation of a breakout under the latter has yet to be achieved. That said, recent losses followed negative RSI divergence, which showed that upside momentum was fading.

From here, recent losses have exposed the 23.6% Fibonacci extension level of 81.88, which is immediate support. Further losses beyond that place the focus on the August low of 77.63. Otherwise, in the event of a turn higher, keep a close eye on the 84.84 inflection point from the August peak.

Crude Oil Daily Chart

Crude Oil Daily Chart

Asia Day Ahead: STI at Key Support, Natural Gas Touches Eight-Month High

Asia Day Ahead: STI at Key Support, Natural Gas Touches Eight-Month High

Market Recap

Slowing growth in the US services sector and a significantly lower-than-expected US private payroll data paved the way for some cooling in the US Treasury yields rally, which offered room for relief in Wall Street overnight.

The US Automatic Data Processing (ADP) payroll data totalled just 89,000 in September versus the 153,000 forecast, and while it may not necessarily go hand-in-hand with the official non-farm payroll data released Friday, rate expectations were quick to pare back on some hawkish bets. This also comes as the US services purchasing managers index (PMI) data softened to 53.6 from previous 54.5, while new orders registered its lowest level since December (51.8 vs 57.5 forecast).

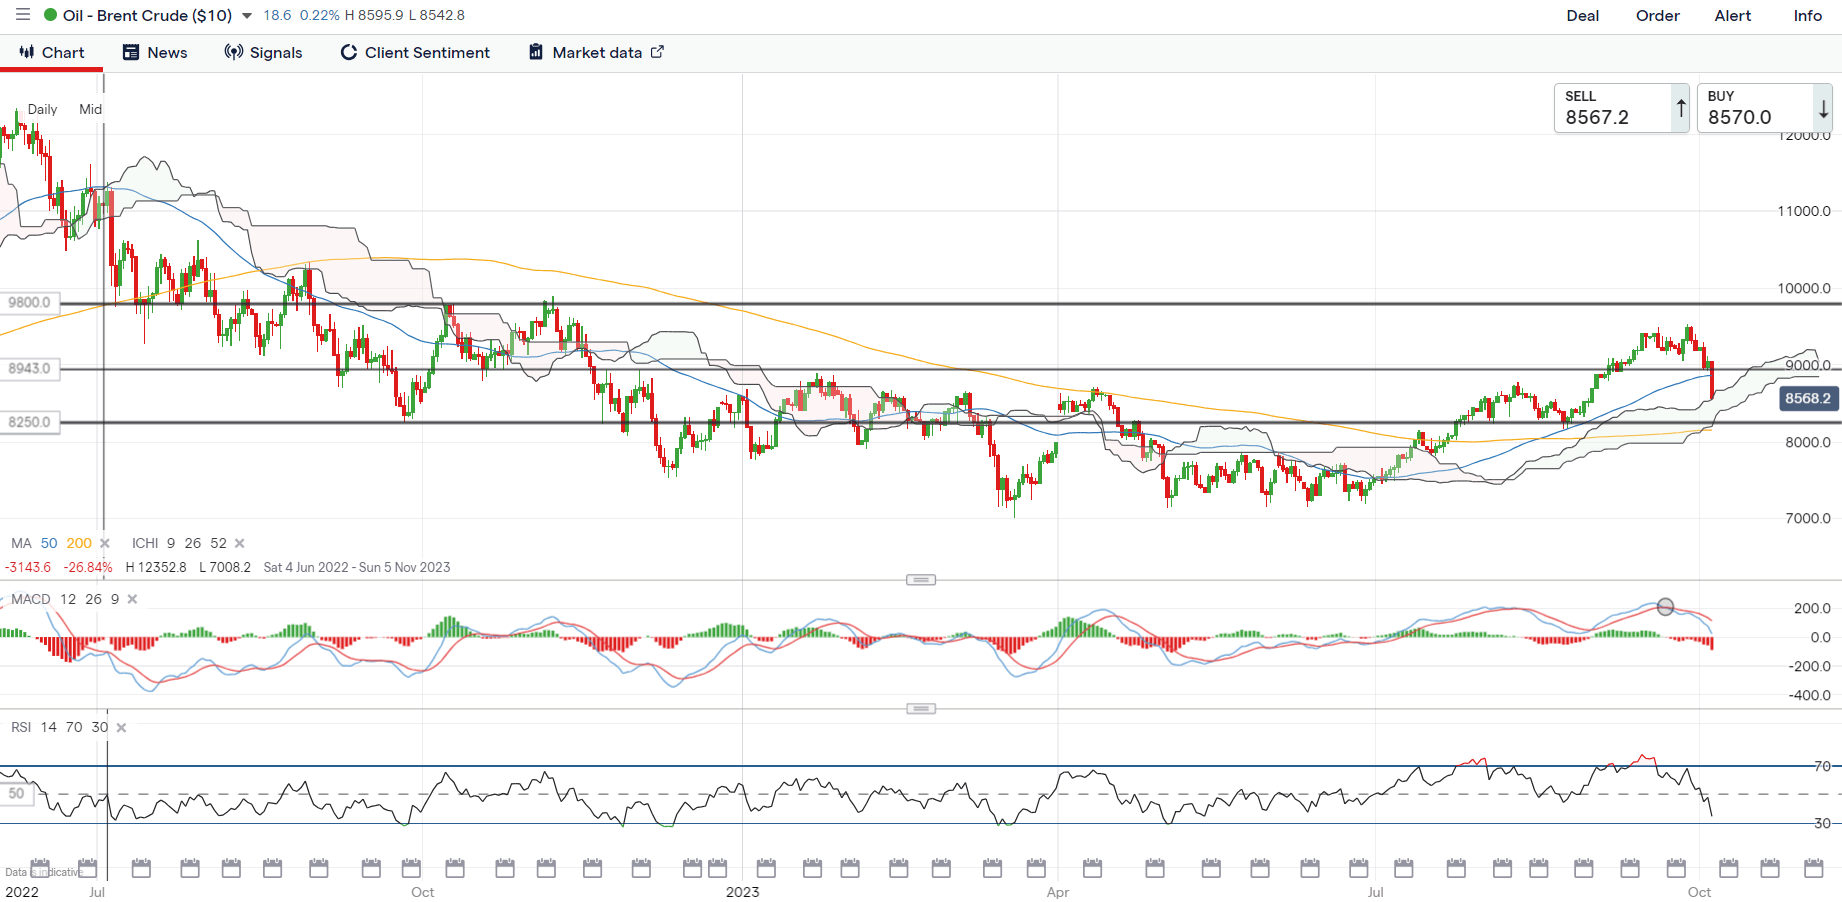
The S&P 500 VIX has retraced off the 20 level for now, which marked a key level of resistance from its May 2023 high, although overall risk mood may likely stay cautious in the lead-up to the US non-farm payroll data to end the week. Much attention is on oil prices, with Brent crude seeing a 5.4% plunge overnight. Despite another week of higher-than-expected drawdown in US crude inventories, traders have their focus on the significant build in gasoline inventories (+6.5 million vs +0.2 million expected).

A decisive break below its 50-day moving average (MA) for Brent crude prices could leave sellers in control for now, while its daily Relative Strength Index (RSI) heads to its lowest level since May this year. The US$82.50 level may serve as a key level for buyers to defend next, where the lower edge of its Ichimoku cloud on the daily chart rests alongside its key 200-day MA. Having reclaimed its 200-day MA back in July this year for the first time in 11 months, the MA-line may be a key level of support to retain the broader upward trend.

image1.png

Asia Open

Asian stocks look set for a positive open, with Nikkei +0.66%, ASX +0.09% and KOSPI +0.28% at the time of writing. Lower Treasury yields, a weaker US dollar and falling oil prices may allow risk sentiments in the region to stabilise from its recent sell-off, although there is still some caution around risk-taking being presented.

China markets remain closed for the rest of the week, while the Hang Seng Index touched a new low since November 2022 in yesterday’s session. Economic data this morning saw a higher-than-expected inflation read from South Korea (3.7% versus 3.4% forecast), with the second straight month of increase likely to keep the Bank of Korea on its hawkish pause at its 19 October meeting, leaving room for additional tightening but still on further wait-and-see for now.

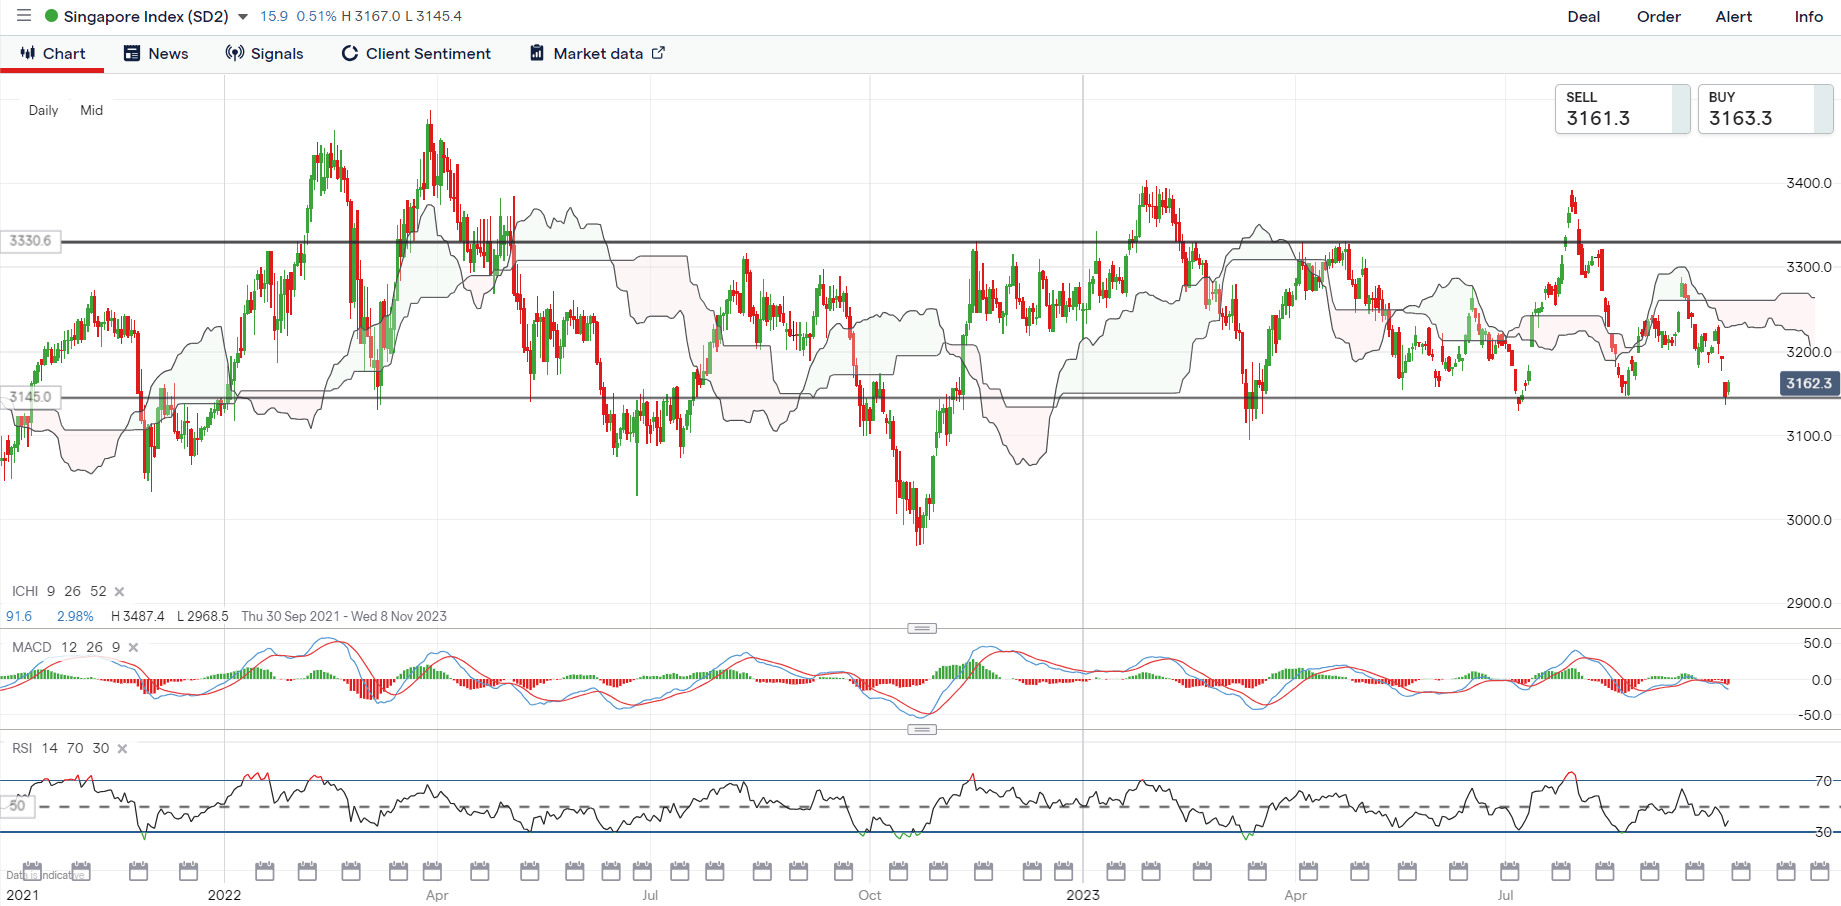
Aside, the Straits Times Index may be on the radar, with the index back at the lower base of its long-ranging pattern, which may prompt some defending from buyers ahead at the 3,145 level. Greater conviction may still be needed from a move in the daily moving average convergence/divergence (MACD) back above the zero mark, alongside the daily RSI above the 50 level. A successful defend of the 3,145 level may leave the 3,230 level on watch next.

image2.png

On the watchlist: Natural gas prices touch eight-month high

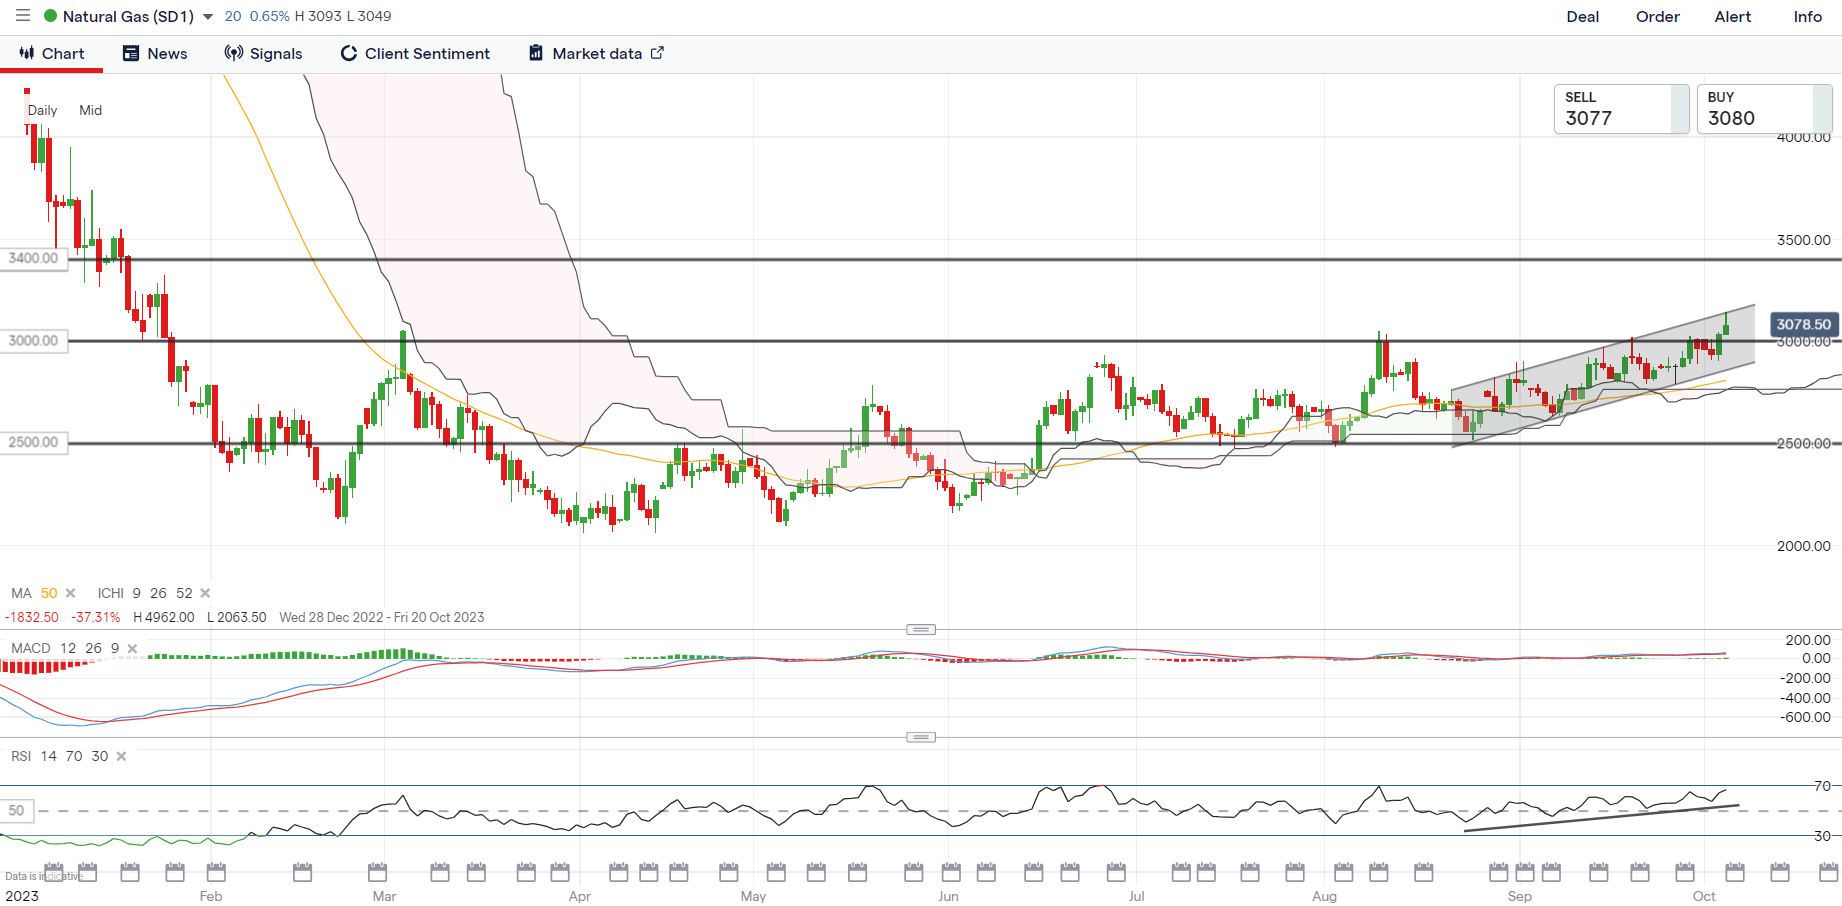
Natural gas prices have been largely stuck in its base-building phase since February this year, but are starting to see some signs of life lately, as a near-term ascending channel pattern led prices to touch a new eight-month high overnight. Thus far, prices have managed to stay above its Ichimoku cloud zone on the daily chart after reclaiming it back in June 2023, with the cloud providing intermittent support on at least three previous occasions.

For now, its weekly RSI is also attempting to cross above the key 50 level for the first time since September 2022, with further positive follow-through reflecting buyers taking greater control. On the downside, the $3.000 level will serve as near-term support to hold while further upside may leave sight on the $3.400 level next.

image3.png