EUR/USD Forecast: US ADP and ISM PMIs Shape Dollar’s Strength

EUR/USD Forecast: US ADP and ISM PMIs Shape Dollar’s Strength

Tuesday Overview

On Tuesday, the EUR/USD declined by 0.10%. Following a 0.92% slide on Monday, the EUR/USD ended the day at $1.04663. The EUR/USD rose to a high of $1.04935 before sliding to a low of $1.04482.

Euro Area Services PMIs in Focus

On Tuesday, ECB Chief Economist Philip Lane discussed the influence of the services sector on euro area inflation. Significantly, Lane said the ECB would look at services inflation data for an extended period.

Trading Derivatives carries a high level of risk to your capital and you should only trade with money you can afford to lose. Trading Derivatives may not be suitable for all investors, so please ensure that you fully understand the risks involved, and seek independent advice if necessary. A Product Disclosure Statement (PDS) can be obtained either from this website or on request from our offices and should be considered before entering into a transaction with us. Raw Spread accounts offer spreads from 0.0 pips with a commission charge of USD $3.50 per 100k traded. Standard account offer spreads from 1 pips with no additional commission charges. Spreads on CFD indices start at 0.4 points. The information on this site is not directed at residents in any country or jurisdiction where such distribution or use would be contrary to local law or regulation.

September services PMIs for Italy and Spain and finalized PMIs for France, Germany, and the Eurozone will garner investor interest.

An upward revision to the Eurozone PMI will likely provide EUR/USD price support. However, investors must consider the sub-components, including prices and employment.

The euro area services sector contributes over 60% to the Eurozone economy. Upward revisions to the PMI and a pickup in the prices subcomponent would support a higher-for-longer ECB rate path.

According to prelim figures, the Eurozone Services PMI increased from 47.9 to 48.4 in September.

Beyond the economic indicators, ECB President Christine Lagarde is also on the calendar to speak. Barring a deviation from the higher-for-longer script, the PMIs will likely impact the EUR/USD more.

US ADP Nonfarm and ISM Non-Manufacturing PMI in the Spotlight

Later today, US ADP nonfarm employment change figures will influence Fed rate hike bets. A higher-than-expected increase will likely support wage growth and consumption. A pickup in consumption may fuel demand-driven inflationary pressures. A hawkish Fed rate path would impact wage growth and consumption.

Economists forecast the ADP to report a 160k increase in employment in September vs. 177k in August.

However, US ISM Non-Manufacturing PMI numbers for September also need consideration. An unexpected increase in the PMI would support a more hawkish Fed interest rate trajectory. The US services sector contributes more than 75% to the US economy. A positive outlook may support wage growth and consumption, and fuel demand-driven inflationary pressures.

Economists forecast the ISM Non-Manufacturing PMI to decline from 54.5 to 53.6. Investors should also consider the sub-components, including employment and prices.

Short-Term Forecast:

Monetary policy divergence remains firmly tilted in favor of the US dollar. However, the US economic indicators must support the need for a hawkish Fed rate path to pressure the EUR/USD.

EUR/USD Price Action

Daily Chart

The EUR/USD remained below the 50-day and 200-day EMAs, affirming bearish price signals.

A EUR/USD return to $1.05 would support a break above the $1.05230 resistance level. Hawkish comments from ECB President Lagarde and an upward revision to the Eurozone services could deliver a breakout.

However, better-than-forecasted US economic indicators would bring the $1.03922 support level into play.

The 14-period Daily RSI at 28.19 shows the EUR/USD sitting in oversold territory.

EUR/USD Daily Chart sends bearish price signals.
EURUSD 041023 Daily Chart

4-Hour Chart

The EUR/USD sits below the 50-day and 200-day EMAs, reaffirming the bearish price signals. A break above the $1.05230 resistance level would bring the 50-day EMA into play.

However, a failure to return to $1.05 would support a EUR/USD break below the $1.03922 support level.

The 14-period 4-Hourly RSI at 33.23 supports a EUR/USD break below the $1.03922 support level before entering oversold territory.

4-Hourly Chart affirms bearish price signals.
EURUSD 041023 4 Hourly Chart
Silver Prices Forecast: XAG/USD Tumbles as Dollar Strengthens Amid Fed Uncertainty

Silver Prices Forecast: XAG/USD Tumbles as Dollar Strengthens Amid Fed Uncertainty

Silver Navigates Stormy Seas: Rate Hike Speculations and Dollar Muscle Weigh In

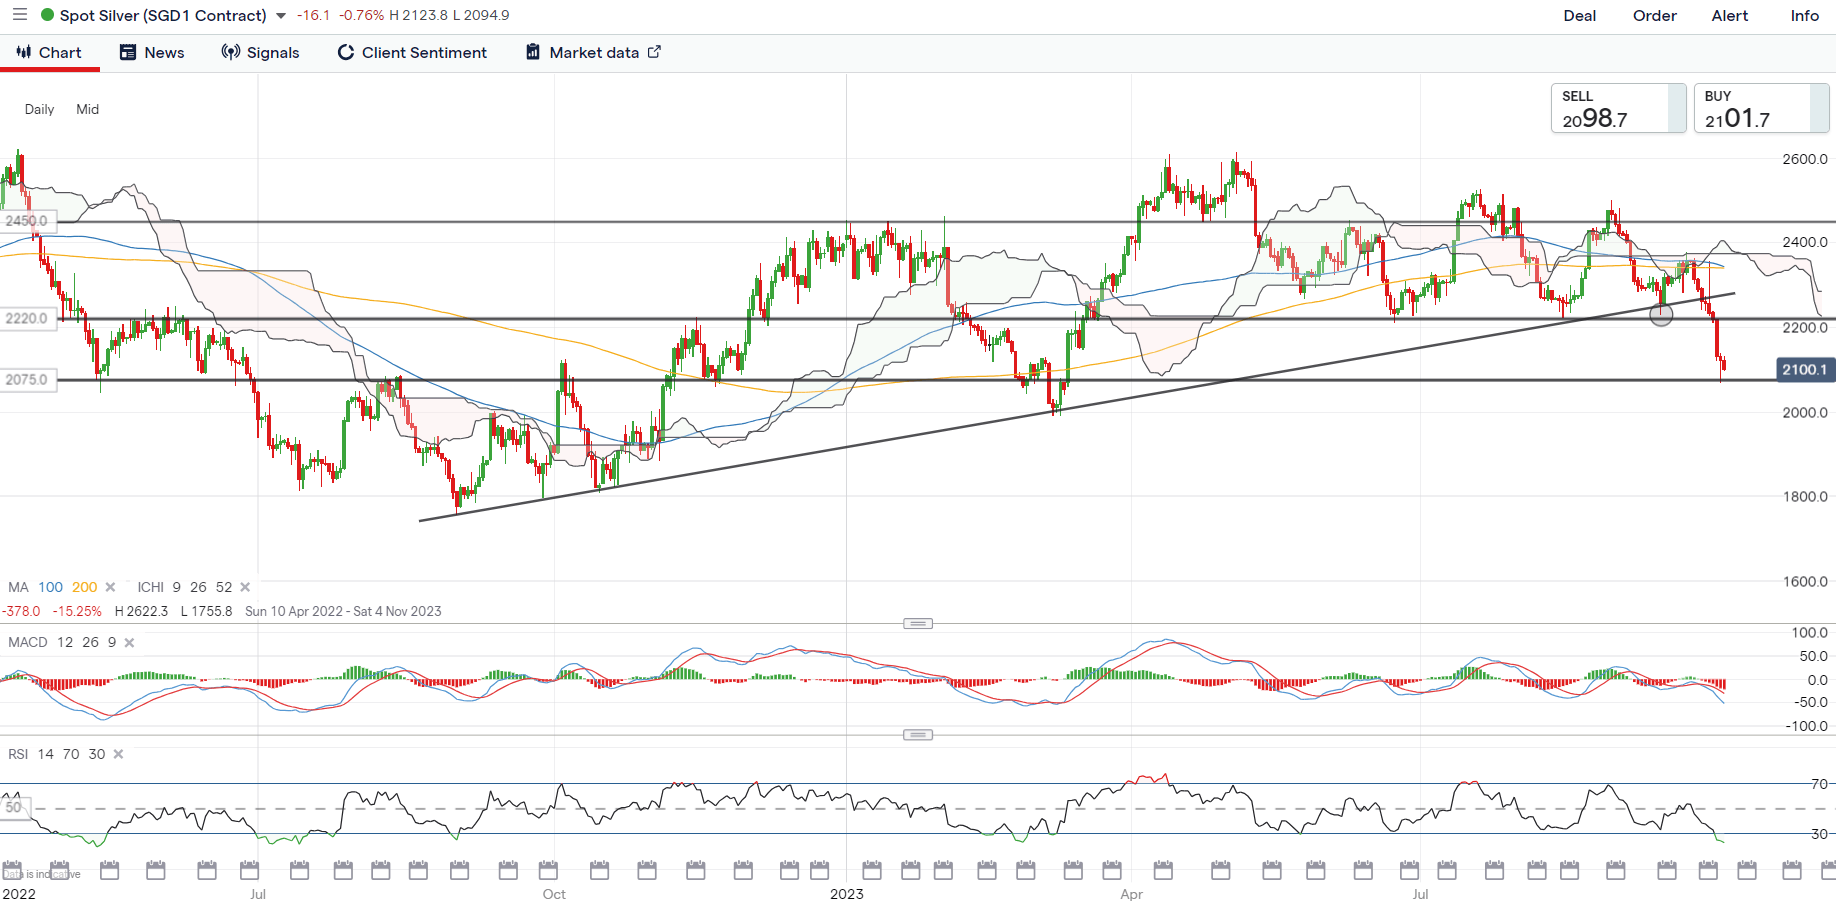
Silver (XAG/USD) is facing headwinds, languishing near a seven-month trough at $21.07 per ounce. Traders are contending with a buffet of influences, most notably a resurgent U.S. dollar and fluctuating Federal Reserve sentiments. Key levels to watch are resistance at $22.20 and support at $20.61, failure of which could send the metal tumbling to $19.80.

Jobs and Bonds Turn the Tide

The robust U.S. labor market, as evidenced by the surprising job openings in August, has further emboldened the dollar, putting downward pressure on the precious metal. Adding to silver’s woes are the 16-year highs in U.S. 10-year bond yields, diminishing the allure of non-yielding assets like silver.

Trading Derivatives carries a high level of risk to your capital and you should only trade with money you can afford to lose. Trading Derivatives may not be suitable for all investors, so please ensure that you fully understand the risks involved, and seek independent advice if necessary. A Product Disclosure Statement (PDS) can be obtained either from this website or on request from our offices and should be considered before entering into a transaction with us. Raw Spread accounts offer spreads from 0.0 pips with a commission charge of USD $3.50 per 100k traded. Standard account offer spreads from 1 pips with no additional commission charges. Spreads on CFD indices start at 0.4 points. The information on this site is not directed at residents in any country or jurisdiction where such distribution or use would be contrary to local law or regulation.

Analysts Exercise Caution

Despite the bearish tones, some market watchers argue that most of the downward pressure has been baked into the current prices. Yet, caution remains the watchword, especially as the Fed’s rate-hiking cycle approaches its tail-end—a phase notorious for triggering “final liquidation breaks” in dollar-sensitive assets like silver.

Divided House at the Fed

The Federal Open Market Committee (FOMC) remains split on future rate hikes, although there’s a consensus for sustained elevated rates. Two key policy meetings loom on the horizon, with futures markets indicating a 25.7% likelihood of a November 1 rate hike and a 45% chance in December, adding another layer of complexity to silver’s outlook.

Short-Term Outlook: Bearish

With the labor market in focus and key economic data slated for release, the immediate future for silver appears bearish. Rising bond yields and a fortified dollar, coupled with uncertainties surrounding Federal Reserve policy, make the short-term path for silver a slippery slope.

Technical Analysis

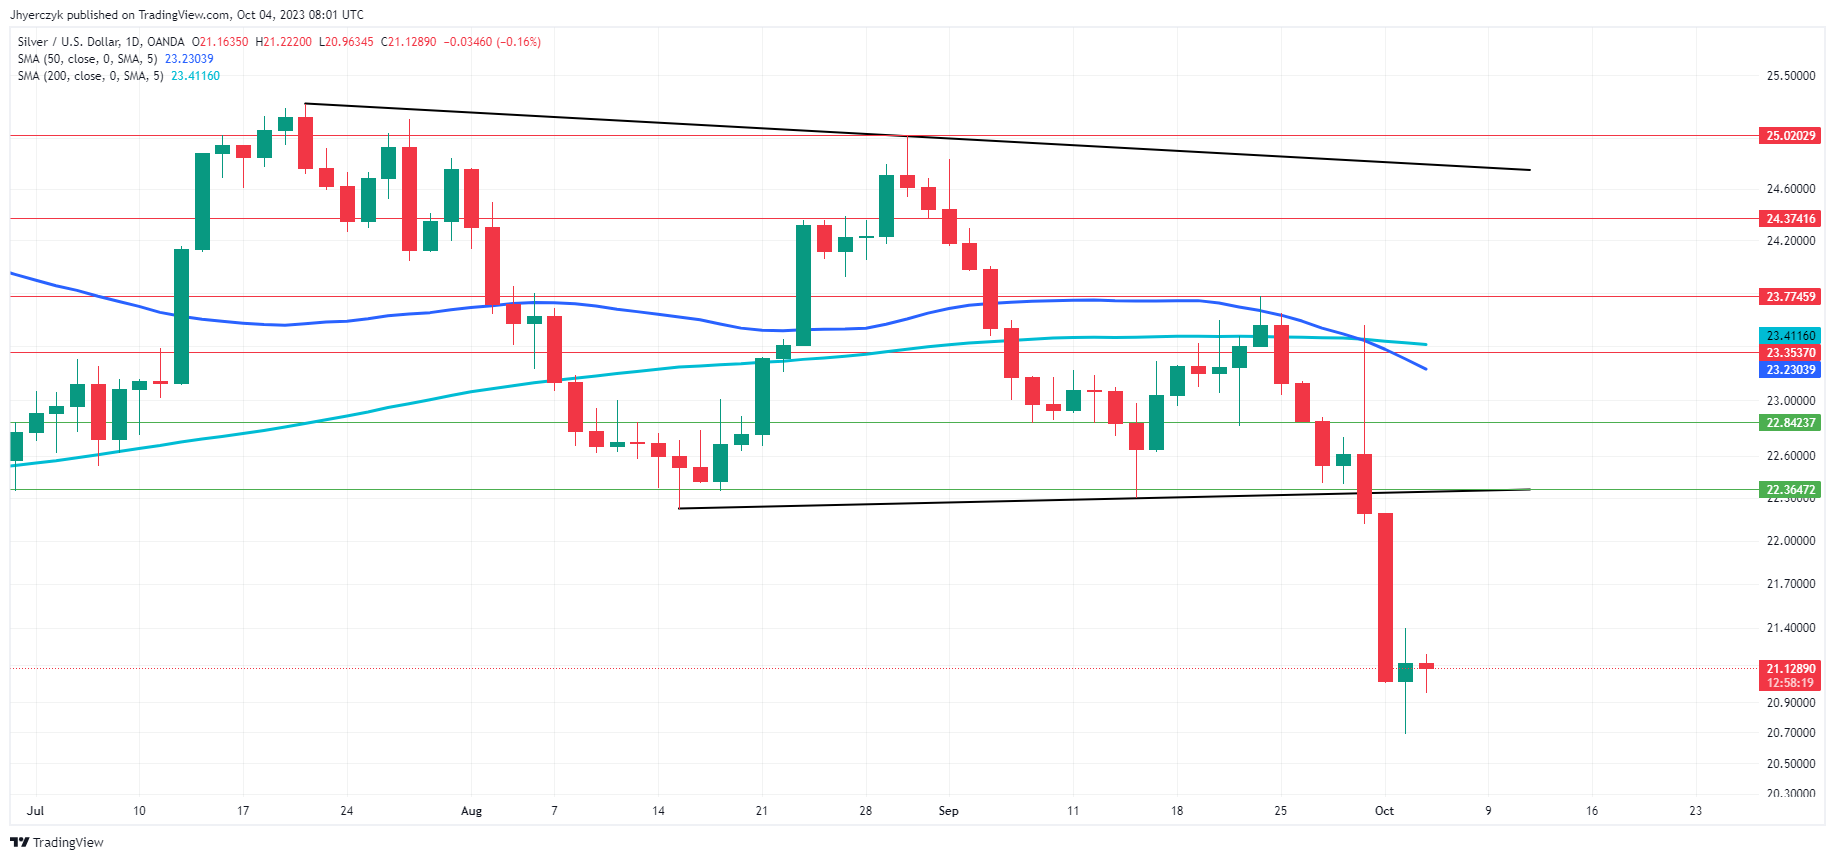
Daily Silver (XAG/USD)The current Daily price of Silver (XAG/USD) at $21.11 is significantly below both the 200-Day moving average of $23.41 and the 50-Day moving average of $23.23, indicating a bearish trend.

The price is also below the main and minor support levels at $22.36 and $22.84, respectively.

While the current price has breached trend line support at $22.34, triggering an acceleration to the downside, it’s important to note that it’s considerably distanced from the trend line resistance at $24.77.

Given that the price is underperforming relative to these key technical levels, the market sentiment for silver appears to be decidedly bearish in the short term.

Gold Prices Forecast: XAU/USD Dips as Fed and Dollar Stir the Pot

Gold Prices Forecast: XAU/USD Dips as Fed and Dollar Stir the Pot

Dollar Strength and Rate Hike Speculations Dent Gold Prices

Gold is hovering near a seven-month low, as traders juggle multiple factors, from a strengthening U.S. dollar to potential shifts in Federal Reserve policy. As of Wednesday, Spot Gold (XAU/USD) is trading at $1818.77, marking a 0.25% dip, while December Comex Gold futures stand at $1833.60, down by 0.43%.

Strong U.S. Jobs Data and Rising Bond Yields

The U.S. jobs market is robust, with unexpected increases in job openings reported in August. This strong data has supported the greenback and contributed to gold’s decline. Concurrently, benchmark U.S. 10-year bond yields have hit 16-year highs, affecting demand for the non-interest-paying bullion.

Trading Derivatives carries a high level of risk to your capital and you should only trade with money you can afford to lose. Trading Derivatives may not be suitable for all investors, so please ensure that you fully understand the risks involved, and seek independent advice if necessary. A Product Disclosure Statement (PDS) can be obtained either from this website or on request from our offices and should be considered before entering into a transaction with us. Raw Spread accounts offer spreads from 0.0 pips with a commission charge of USD $3.50 per 100k traded. Standard account offer spreads from 1 pips with no additional commission charges. Spreads on CFD indices start at 0.4 points. The information on this site is not directed at residents in any country or jurisdiction where such distribution or use would be contrary to local law or regulation.

Analyst Views on Gold’s Near-term Outlook

Some market analysts suggest that the downtrend in gold prices may not persist, as most heavy selling pressure has been already priced in. However, there’s caution against premature optimism as the Fed’s rate hike cycle nears its end, traditionally a painful period known for “final liquidation breaks” in interest rate-sensitive and dollar-denominated assets like gold.

Fed’s Position on Future Rate Hikes

Meanwhile, Federal Reserve officials are divided over the need for another rate hike this year but agree that rates need to remain elevated for an extended period. This is adding to the current volatility. Two more Fed policy meetings are scheduled this year, with market pricing pointing to a 25.7% chance of a rate hike on Nov 1 and a nearly 45% probability in December.

Short-term Forecast: Bearish

Given the strong U.S. dollar, rising bond yields, and looming Fed decisions, the short-term outlook for gold remains bearish. Market participants are keenly awaiting upcoming economic data and Fed meetings to gain more clarity on gold’s future trajectory.

Technical Analysis

Daily Gold (XAU/USD)Gold (XAU/USD)’s daily price of 1820.49 sits significantly below both the 200-Day and 50-Day moving averages, at 1927.79 and 1912.87 respectively, suggesting a bearish outlook. Moreover, the current daily price falls beneath the trend line support of 1915.43, pointing to a potential acceleration to the downside.

On the level front, the asset is currently trading closer to the main and minor support levels (1889.37 and 1883.28) than the resistance levels, further supporting a bearish view.

Given these observations, the prevailing market sentiment for Gold appears to be bearish.

NASDAQ Index, SP500, Dow Jones Forecasts – NASDAQ Dives 2.1% Amid Concerns Over Treasury Yields

NASDAQ Index, SP500, Dow Jones Forecasts – NASDAQ Dives 2.1% Amid Concerns Over Treasury Yields

SP500

SP500

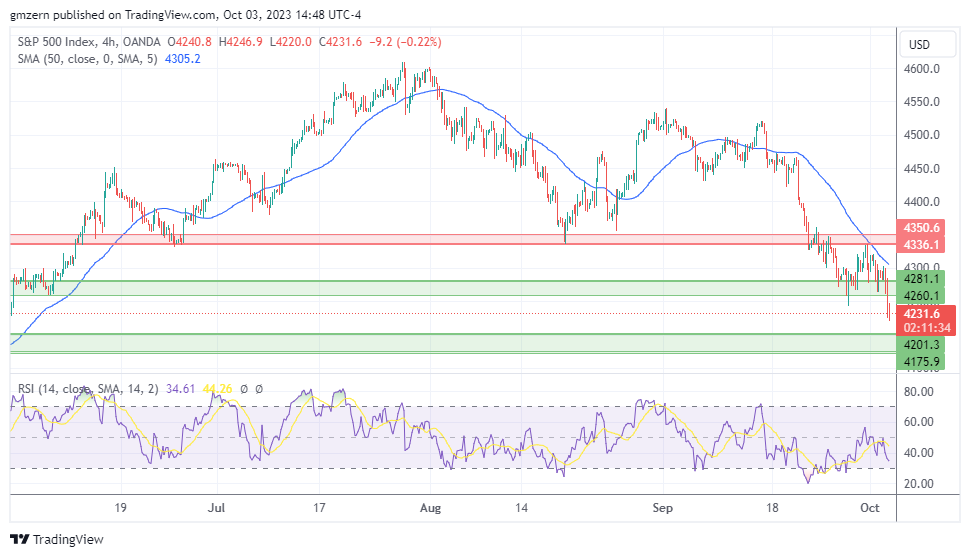
SP500 031023 4h ChartSP500 pulled back below the support at 4260 amid rate hike worries. JOLTs Job Openings increased to 9.6 million in August, compared to analyst consensus of 8.8 million. The strong jobs data pushed Treasury yields to new highs. The yield of 10-year Treasuries increased to 4.80%, while the yield of 30-year Treasuries moved towards 4.94%. These are the highest levels since 2007, so it’s not surprising to see that traders are worried about high interest rates.

In case SP500 stays below the 4260 level, it will head towards the support at 4175 – 4200. RSI remains in the moderate territory, so there is enough room to gain additional downside momentum.

Trading Derivatives carries a high level of risk to your capital and you should only trade with money you can afford to lose. Trading Derivatives may not be suitable for all investors, so please ensure that you fully understand the risks involved, and seek independent advice if necessary. A Product Disclosure Statement (PDS) can be obtained either from this website or on request from our offices and should be considered before entering into a transaction with us. Raw Spread accounts offer spreads from 0.0 pips with a commission charge of USD $3.50 per 100k traded. Standard account offer spreads from 1 pips with no additional commission charges. Spreads on CFD indices start at 0.4 points. The information on this site is not directed at residents in any country or jurisdiction where such distribution or use would be contrary to local law or regulation.


NASDAQ

NASDAQ

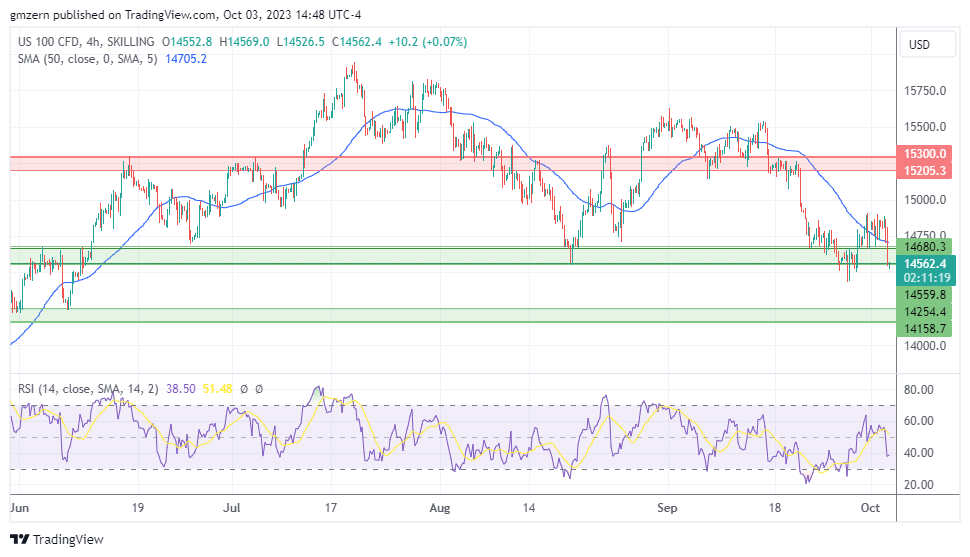
NASDAQ 031023 4h ChartNASDAQ is trying to settle below the support at 14,560 as traders focus on rising Treasury yields. Amazon, which is down by 4%, is among the biggest losers in the NASDAQ index today.

In case NASDAQ manages to settle below the 14,560 level, it will head towards the support, which is located in the 14,150 – 14,250 range. As in the case of SP500, RSI has not reached the oversold territory, so NASDAQ has a good chance to gain additional momentum in case the right catalysts emerge.

Dow Jones

Dow Jones

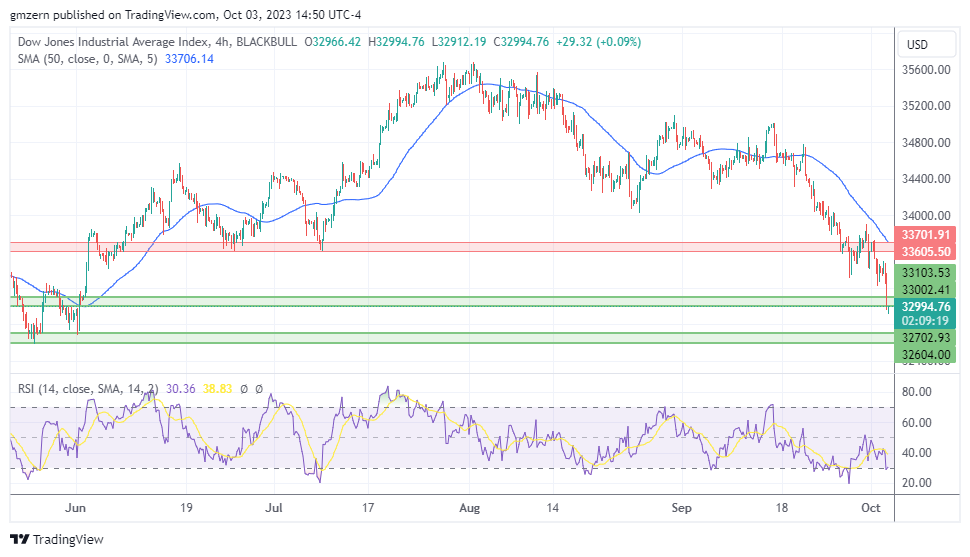
Dow Jones 031023 4h ChartDow Jones tests new lows amid a broad sell-off in the equity markets. Goldman Sachs, which is down by more than 4%, is the biggest loser in the Dow Jones index. Traders worry that rising Treasury yields will hurt the company’s profits.

If Dow Jones settles below the 33,000 level, it will head towards the next support, which is located in the 32,600 – 32,700 area.

XAU/USD Price Forecast: Gold Dulls Further on Soaring Real Yields

XAU/USD Price Forecast: Gold Dulls Further on Soaring Real Yields

XAU/USD FUNDAMENTAL BACKDROP

Gold prices are trading lower for the 8th consecutive trading day as the US dollar remains bid due to some hawkish Fed commentary as well as an upside surprise on yesterday’s US JOLTs job openings statistic. Once again US labor market strength has been reiterated through jobs reports and will surely add pressure from a hawkish perspective. Throughout the week including today (see economic calendar below), markets will be looking to jobs reports beginning with ADP employment change, jobless claims and most importantly Friday’s Non-Farm Payroll (NFP) print. If the JOLTs job openings trend continues, gold prices may breakdown further.

The Fed’s Mester has subsequently stated “I am likely to favor a hike at next meeting if current economic situation holds.” Fed officials will be speaking today as well and with the Fed’s Bowman favoring the hawkish narrative of recent, gold may be vulnerable.

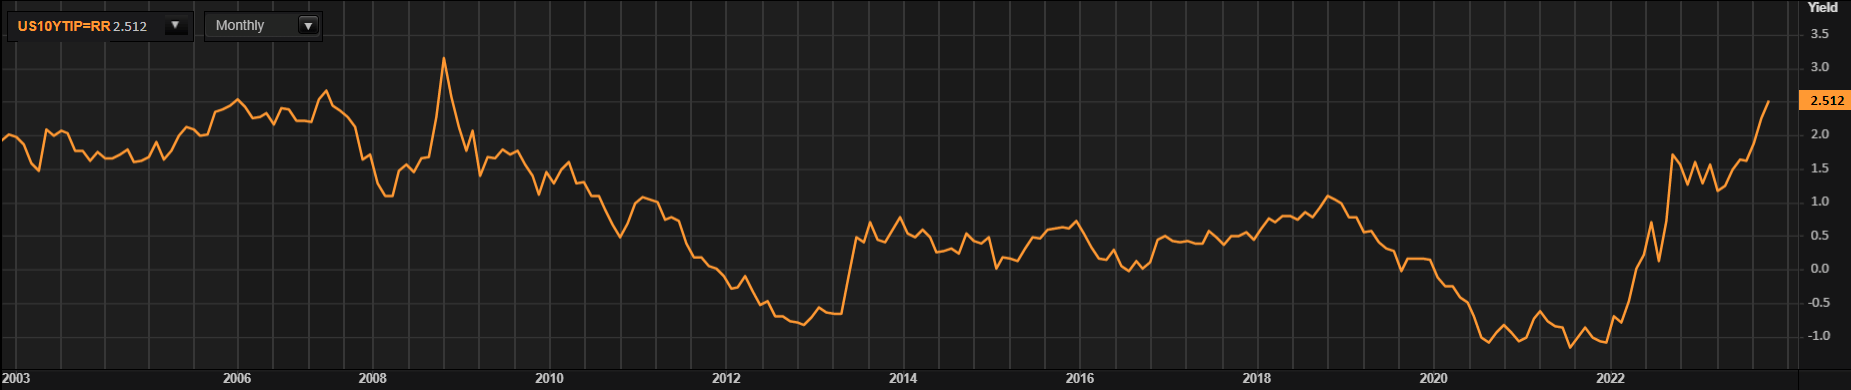
Real yields (refer to graphic below) have now jumped to levels last seen in November 2008 and is weighing negatively on the non-interest bearing metal as it becomes less attractive to investors.

US REAL YIELDS (10-YEAR)

image1.png

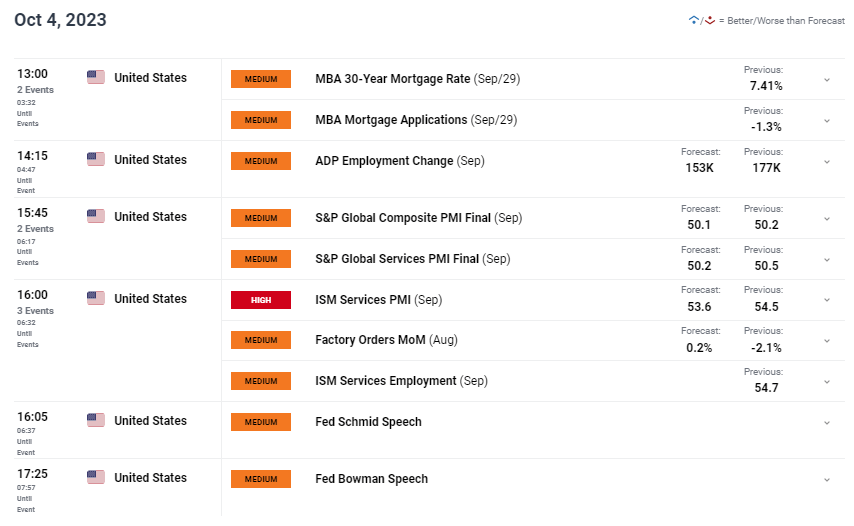
The highlight for today will come from the US ISM services PMI release due to the US being a primarily services driven economy. Expectations are for a marginal drop off which could give gold bulls some reprieve if actual data follows suit.

GOLD ECONOMIC CALENDAR

image2.png

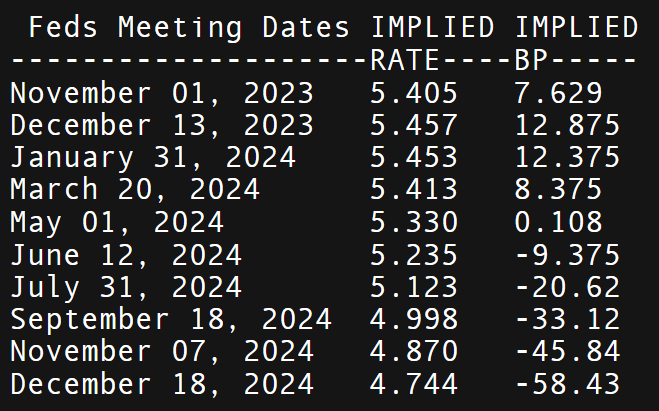
Money market pricing has been gradually showing more preference towards another interest rate hike this year alongside a declining cumulative rate cut figure that has now come down to 58bps (see table below). Upcoming services and jobs data could cement this hike forecast should they reflect an unwavering economy.

IMPLIED FED FUNDS FUTURES

image3.png

TECHNICAL ANALYSIS

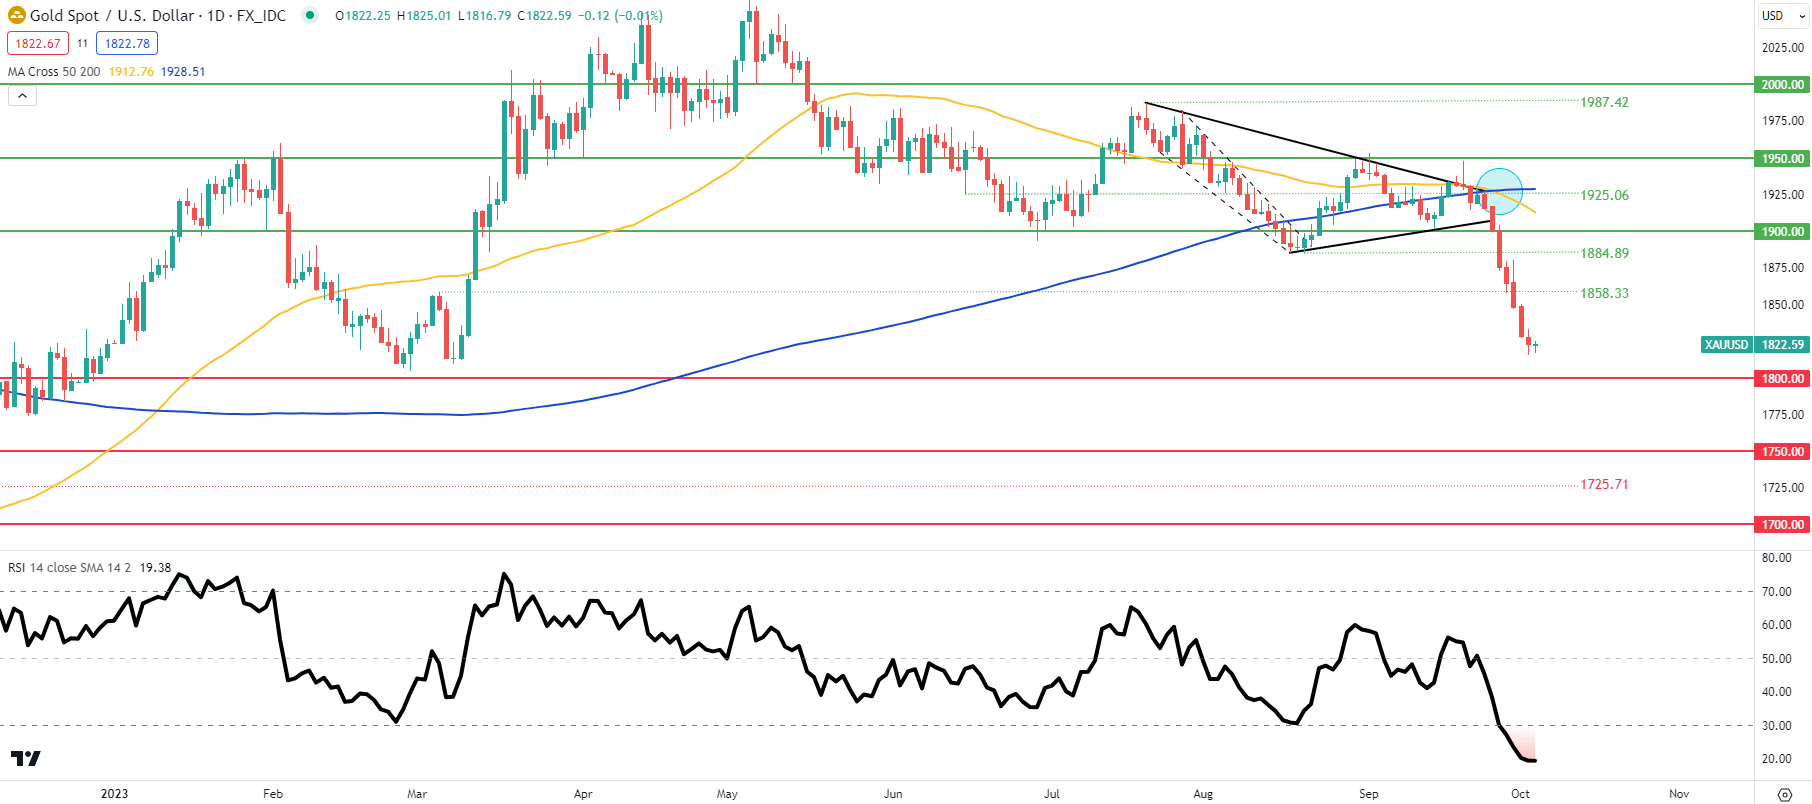
GOLD PRICE DAILY CHART

image4.png

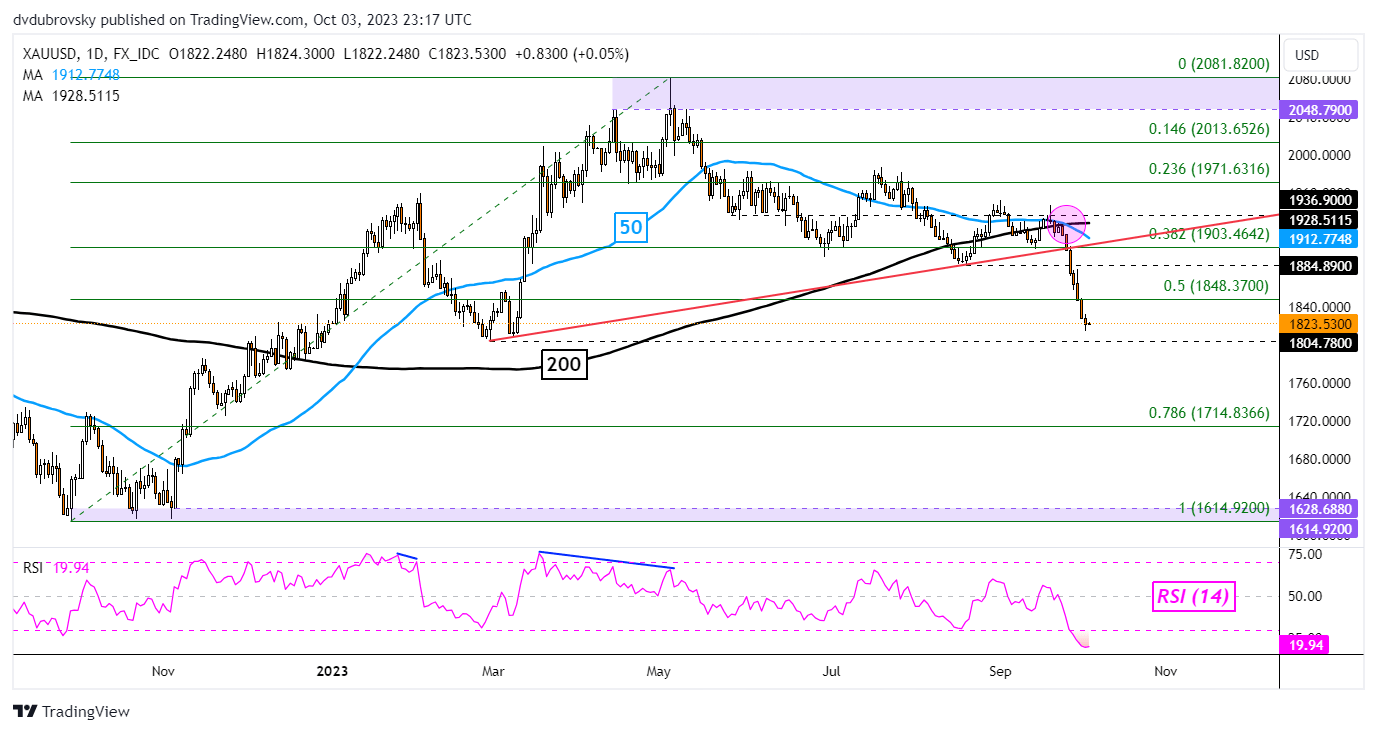
Daily XAU/USD price action above keeps the yellow metal within extreme oversold territory as measured by the Relative Strength Index (RSI). That being said, this does not imply an impending reversal as oversold markets can remain oversold for some time. Subsequently, the moving averages exhibit a death cross formation (blue), exposing the 1800.00 psychological support handle for the first time since December 2022.

The weekly chart does show something interesting in that currently price levels fall in line with the 200-week moving average so the weekly candle close will be of vital importance. Anything below could really be hurtful for gold while a defense of this support zone could result in a long lower wick that could suggest some reprieve for bullion.

Gold Price Update: XAU/USD 2-Week Performance Set for Worst Since Early July?

Gold Price Update: XAU/USD 2-Week Performance Set for Worst Since Early July?

So far, over the past 2 weeks, gold prices have sunk about -5.3 percent. This is setting the stage for the worst 10-day period for XAU/USD since early July. In response, retail traders continue to increase their bullish exposure in the yellow metal. This can be seen by taking a look at IG Client Sentiment (IGCS), which often functions as a contrarian indicator. With that in mind, will gold continue lower?

Gold Sentiment Outlook – Bearish

The IGCS gauge shows that about 75% of retail traders are net-long gold. Since most of them remain biased to the upside, this continues to hint that prices may fall down the road. This is as upside bets increased by 0.6% and 2.25% compared to yesterday and last week, respectively. With that in mind, the combination of overall positioning and recent changes produces a stronger bearish outlook.

XAU/USD Daily Chart

On the daily chart, gold has confirmed a breakout under the midpoint of the Fibonacci retracement level of 1848.37. This followed a push under near-term rising support from February and a bearish Death Cross between the 50- and 200-day moving averages. Now, immediate support appears to be the February low of 1804.78.

Breaking lower exposes the 78.6% Fibonacci retracement level of 1714.83 on the way towards the 1614 – 1628 support zone, which was established towards the end of last year. Meanwhile, if prices turn higher this places the focus back on 1848 before the 1884 inflection point comes into focus.

XAU/USD Daily Chart

US Dollar Smile Theory: How Does Economic Resilience or Recession Drive USD?

US Dollar Smile Theory: How Does Economic Resilience or Recession Drive USD?

A “floating” currency – or one that is influenced by the natural forces of the market – tends to have a positive relationship with its economy. In other words, if growth is expected to outperform and bolster inflation, causing the central bank to raise interest rates, that tends to boost the currency and vice versa. There are always exceptions, however, such as the US Dollar.

Have you ever heard of the “Dollar Smile Theory”? This is a concept that helps explain why the US Dollar tends to rise when the economy is not only strongly outperforming, but also when it is experiencing trouble, such as a recession. Everything in between these two extremes is where the currency often finds itself under pressure.

To understand why this relationship exists, you need to have a basic understanding of the US Dollar’s unique role in global financial markets. It is the global reserve currency. According to the Bank for International Settlements, in 2019 the USD was used in about 90% of global FX transactions. This means it is the world’s most liquid trading instrument.

The saying goes when the US sneezes, the world catches a cold. During times of economic stress, flight to safety means traders often need to liquidate market positions. Their go-to choice is often US Dollars, making it a haven-linked trading instrument. This influx of demand helps explain why the currency tends to rise during recessionary periods. Compared to a handful of assets, the US Dollar tends to do the best during the onset of recessions in the United States.

The chart below visualizes the “Dollar Smile Theory”. But, how can you use this information to your advantage? Well, the purpose of this article is to quantify the concept and show you how this relationship works in the real world. I will be looking at the dollar’s interaction with the following economic data: gross domestic product (GDP), the unemployment rate, ISM manufacturing PMI, and vehicle sales. By the end of the article, hopefully, you can walk away with a better understanding of USD.

US Dollar Smile Theory

US Dollar Smile Theory

Setting Some Ground Rules

Before diving into economic data, let us set some ground rules. The first is that all the data is quarterly since 1976 expressed in year-over-year terms. The second is that for each economic indicator, I have removed extreme outliers (beyond +- 3 standard deviations from the average). What is left behind is underlying data matching an underlying US Dollar.

This helps increase the statistical significance and reduce variability. Also, for the most part, each economic indicator will have outliers removed from different quarters. Finally, I will be using the Bloomberg Correlation-Weighted US Dollar Index (BCWI). This is because I want to capture the general movement in the currency as opposed to a given exchange rate.

Testing Gross Domestic Product (GDP)

Can you spot the “U-shaped” relationship between GDP (or economic growth) and the US Dollar below? That is the smile theory put into action with real economic data. The curve can be broken down into two green zones on the left and right (where USD is expected to be positive for given values of GDP), and a red zone (where the currency is anticipated to weaken). Somewhere between 1.5% – 4.0% GDP (Y/Y) is the “damage” zone for USD, or when the currency is seen falling compared to a year ago. Values of growth outside of this range show USD rising on average.

It should be noted that there is a plethora of factors that can impact how the USD performs in a quarter compared to a year ago. That is why sometimes you will see the dollar doing well around the “red zone” of GDP and poorly in the “green zone”. The purpose of this study is to focus on just the economic indicator alone, highlighting a non-linear relationship with the US Dollar.

GDP YoY Quarterly Since 1976 (Outliers Removed)

GDP YoY Quarterly Since 1976 (Outliers Removed)

Testing the Unemployment Rate

What about the unemployment rate? Like GDP, there is also a “U-shape” relationship with the US Dollar. The tricky thing here is that you need to think about unemployment in reverse terms compared to GDP. When the unemployment rate is rising, that is not good for an economy and vice versa.

In this data, it seems the “danger” zone for the US Dollar is when the unemployment rate is seen performing somewhere between -5% and +25% (Y/Y). When this economic indicator clocks in outside of this range, the US Dollar has historically tended to rise against its major counterparts.

Unemployment Rate YoY Quarterly Since 1976 (Outliers Removed)

Unemployment Rate YoY Quarterly Since 1976 (Outliers Removed)

Testing ISM Manufacturing PMI

Now let us look at ISM Manufacturing PMI to gauge the impact of activity in the industrial sector on the currency. Here too you can find a “U-shaped” relationship. It seems that the “danger” zone for the US Dollar is when this indicator performs -5% to +30% (Y/Y). Outcomes outside of this range seem to open the door for the US Dollar to outperform.

ISM Manufacturing PMI YoY Quarterly Since 1976 (Outliers Removed)

ISM Manufacturing PMI YoY Quarterly Since 1976 (Outliers Removed)

Testing Vehicle Sales

Finally, I will wrap this up with the total number of new vehicle sales, expressed in year-over-year terms. Just like GDP, the unemployment rate and ISM manufacturing PMI, you can also see a “U-shaped” relationship with the US Dollar. The “danger” zone for the currency seems to occur when vehicle sales report between -7.5% and +7.5%. Meanwhile, the US Dollar on average tends to appreciate when outcomes are outside of this zone.

Vehicle Sales YoY Quarterly Since 1976 (Outliers Removed)

Vehicle Sales YoY Quarterly Since 1976 (Outliers Removed)

Conclusion

With that in mind, hopefully, you have a better idea of what the US Dollar Smile Theory is and how it works in real life. The key takeaway is that the currency tends to appreciate handsomely when economic data greatly outperforms and significantly underperforms, such as during recessions. Somewhere in-between these extreme outcomes are where the currency tends to weaken, and I tried to quantify that for you. If you have enjoyed this special report, feel free to follow me on Twitter for ongoing updates!

Asia Day Ahead: USD/JPY Firm Despite Potential Intervention, NZD/USD at 3-Week Low

Asia Day Ahead: USD/JPY Firm Despite Potential Intervention, NZD/USD at 3-Week Low

Market Recap

The significant upside surprise in US job opening numbers for August (9.61 million vs 8.8 million expected) prompted another negative session in Wall Street overnight, with a resilient labour market deemed to be providing more room for the Federal Reserve (Fed) to keep rates high for longer. US Treasury yields continued with their ascent, with the US 10-year yields at 4.8%. Aside, the VIX is at its four-month high, hovering just below its key 20 level – a general divide between more risk-on and risk-off territory.

Ahead, the US Automatic Data Processing (ADP) private payrolls data and US services purchasing managers index (PMI) will be on watch, with market participants potentially hoping to see a softer read on both fronts to give US policymakers some breathing room in terms of tightening. Current expectations are for the ADP data to moderate to 153,000 from previous 177,000, while the US services PMI is expected to soften to 53.6 versus the previous 54.5.

Higher Treasury yields and a firm US dollar have not been well-received by silver prices lately, but there is an attempt for prices to hold up around the US$20.75 level with the formation of a bullish pin bar on the daily chart overnight. A move above yesterday’s close may provide greater conviction for some short-term relief, as technical conditions tread in oversold territory while gains in the US dollar stalled overnight. Any near-term relief may find resistance at the US$22.20 level, while failure to defend the US$20.75 may pave the way towards the US$19.80 level next.

image1.png

Asia Open

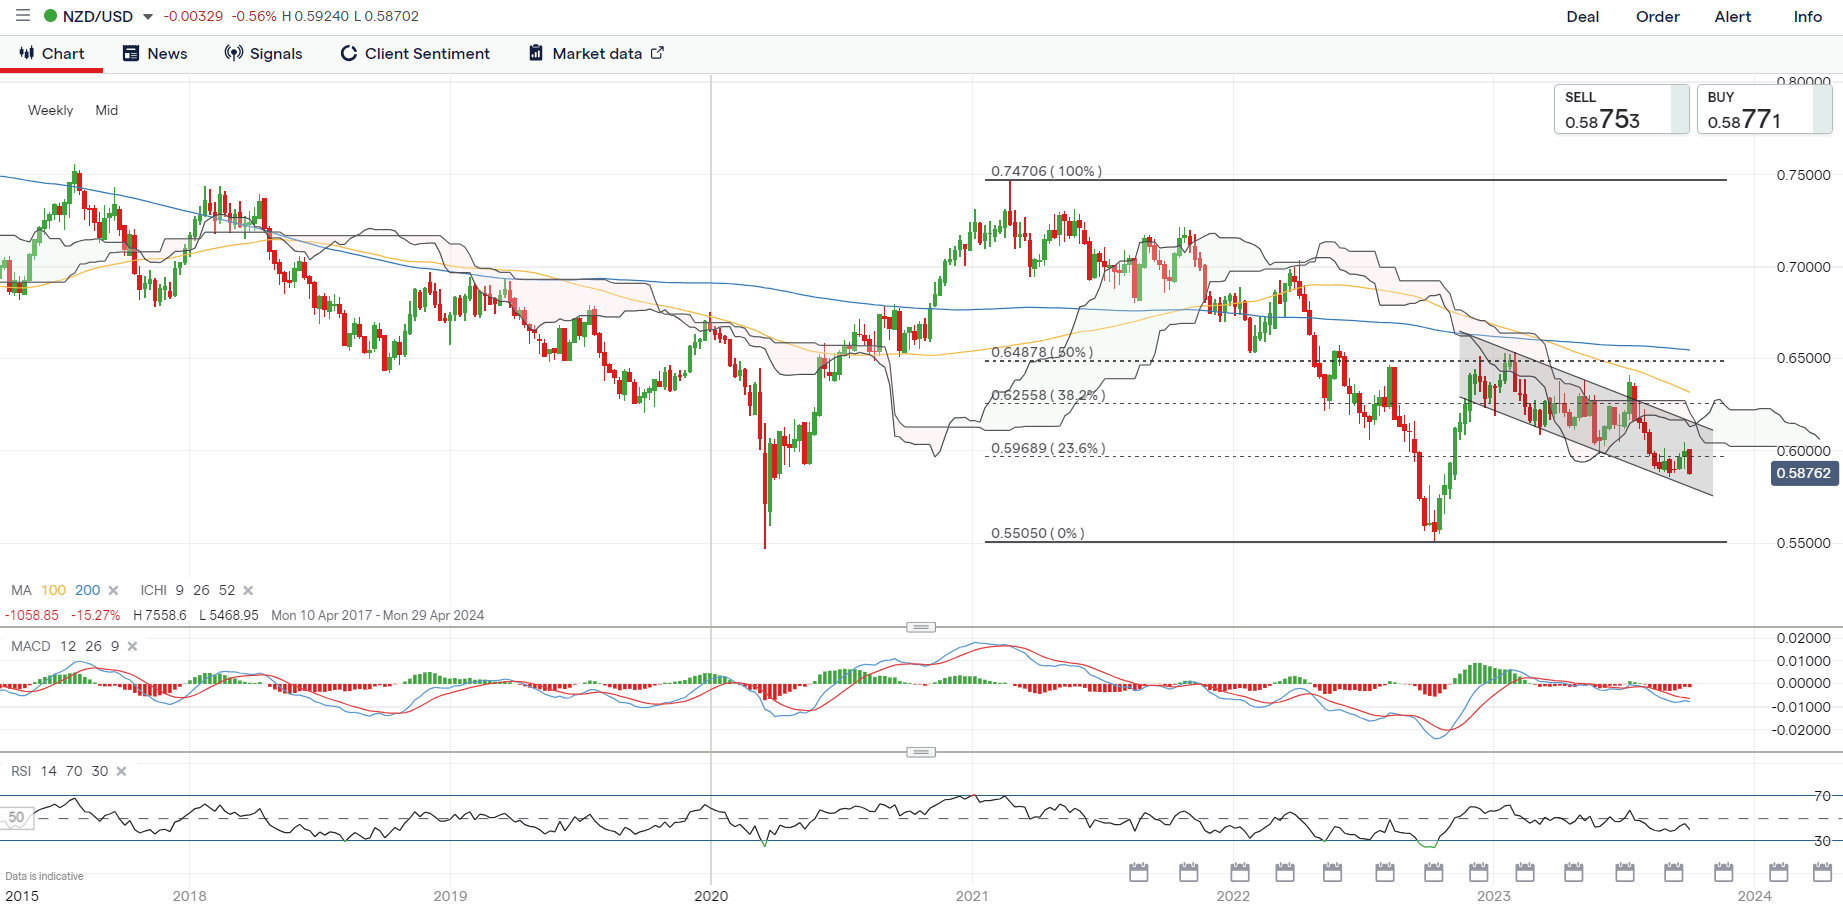
Asian stocks look set for a downbeat open, with Nikkei -1.65%, ASX -0.65% and KOSPI -2.08% at the time of writing. The Reserve Bank of New Zealand (RBNZ) has kept rates on hold at 5.5% as widely expected in today’s meeting, which prompted a dip in the NZD/USD to its three-week low – a case similar to the AUD/USD on the rate hold from the Reserve Bank of Australia (RBA) yesterday.

Guidance from the RBNZ that inflation is still expected to decline to within the target band by 2H 2024 and some emphasis on economic risks as a trade-off to restrictive monetary conditions may suggest that the central bank is leaning towards further wait-and-see, with the flexibility kept for one more rate hike towards the rest of the year.

For the week, the NZD/USD seems to be eyeing for a retest of its September low, as failure to sustain above its weekly Ichimoku cloud pattern continues to put a downward trend in place. Its weekly Relative Strength Index (RSI) is also trading below the key 50 level as a reflection of sellers in control, failing to defend recent gains on a firmer US dollar and broad risk-off sentiments. The lower channel trendline may be on watch next as potential near-term support, followed by its October 2022 low at the 0.550 level.

image2.png

On the watchlist: Suspected intervention at the 150.00 level for USD/JPY met with dip-buying

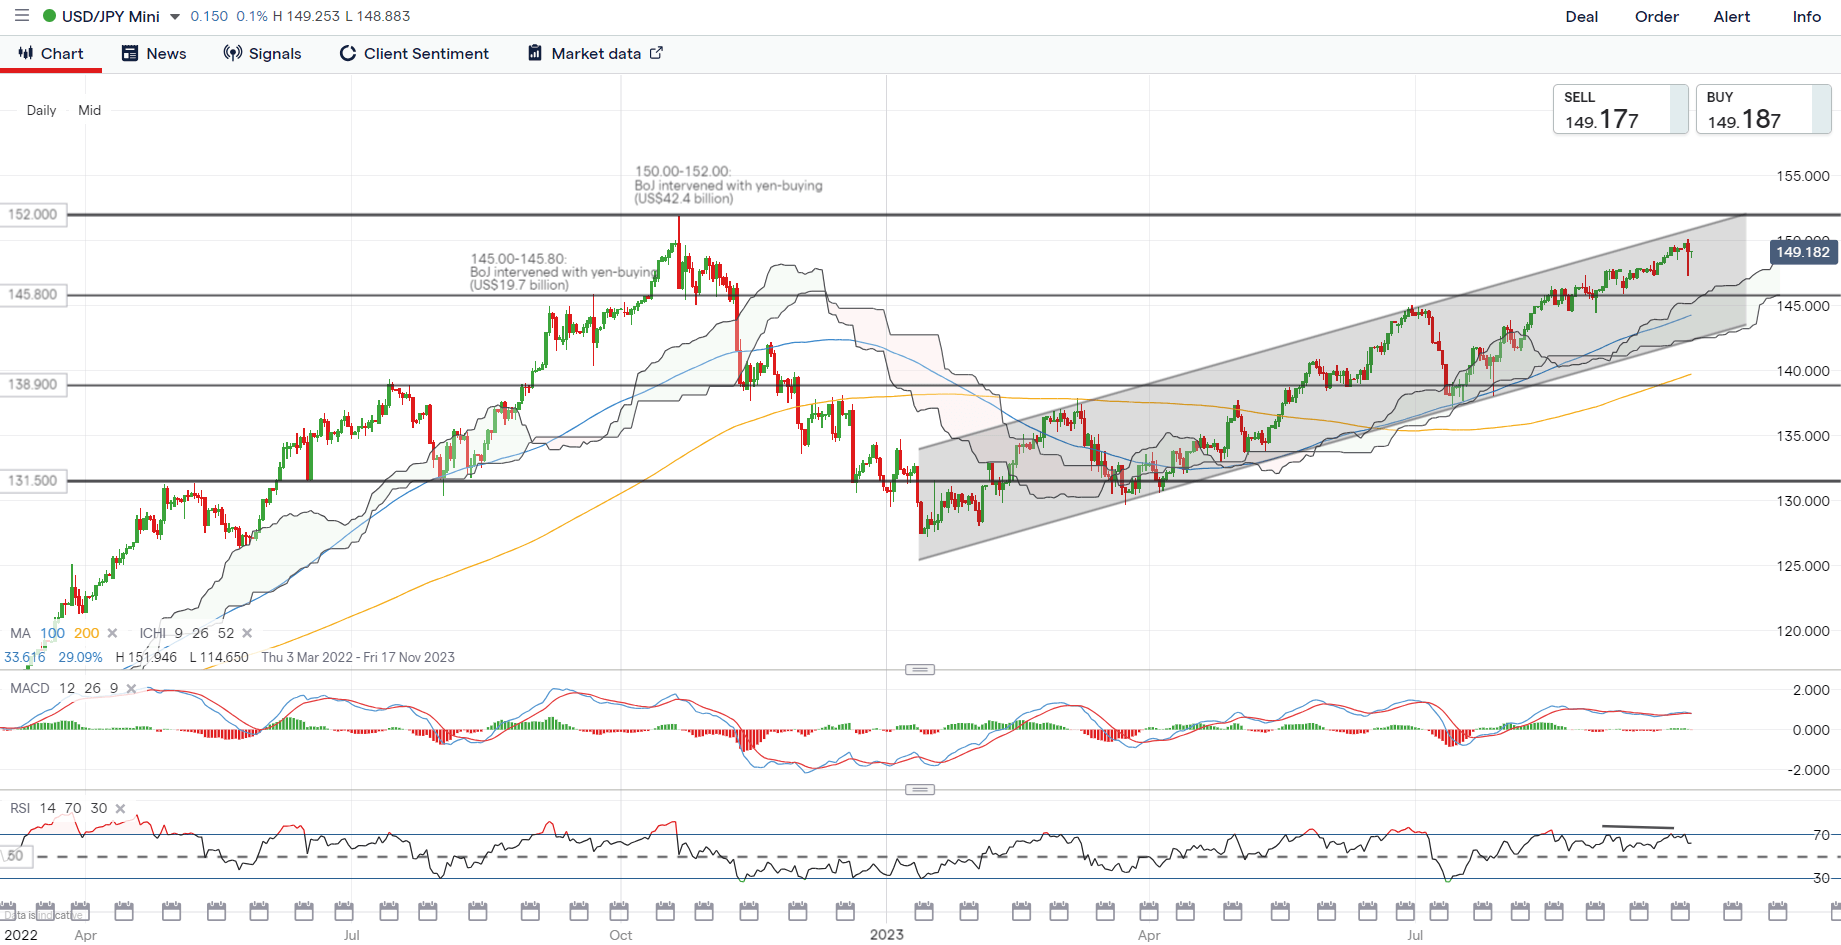
There was a suspected FX intervention by Japanese authorities for the USD/JPY at the key psychological 150.00 level overnight, but dip buyers were quick to halt the weakness, which continued to see the pair hold around its 11-month high. The case seems similar to September 2022, where the first round of intervention by authorities failed to support the Japanese yen amid the policy divergence between the Fed and the Bank of Japan (BoJ).

Buyers may attempt to retest the key 150.00 level once more, with any failure for authorities to provide a more aggressive signal likely to challenge their credibility and could pave the way for the pair towards the 152.00 level next (October 2022 top formed on second round of intervention). On the downside, yesterday’s dip-buying at the 147.30 level will serve as immediate support to hold.

On the watchlist: Suspected intervention at the 150.00 level for USD/JPY met with dip-buying


Australian Dollar Outlook: AUD/USD May Fall After Support Breakout, Retail Bullish Bets

Australian Dollar Outlook: AUD/USD May Fall After Support Breakout, Retail Bullish Bets

The Australian Dollar is on course to drop about -2.2% this week at this stage. If confirmed, that would be the worst 5-day drop since the middle of June. Retail traders continue to become increasingly bullish and this can be seen by looking at IG Client Sentiment (IGCS), which often functions as a contrarian indicator. With that in mind, is the Aussie on course to extend its losing streak?

AUD/USD Sentiment Outlook – Bearish

The IGCS gauge shows that about 85% of retail traders are net-long AUD/USD. Since the vast majority are biased to the upside, this continues to hint that prices may continue lower from here down the road. This is as upside bets increased by 14.21% and 5.76% compared to yesterday and last week, respectively. With that in mind, the combination of overall positioning and recent changes offers a stronger bearish contrarian trading bias.

Australian Dollar Daily Chart

Focusing on the daily chart, AUD/USD has confirmed a breakout under the 78.6% Fibonacci retracement level of 0.6382. While there have been closes under this level before in recent weeks, this is the first meaningful consecutive daily drop under it. This has exposed the November 2022 low of 0.6272 as immediate support.

Positive RSI divergence is present showing that downside momentum is fading. That can at times precede a turn higher. Such an outcome would place the focus on the 20- and 50-day moving averages as immediate resistance. These may maintain the broader bearish technical perspective, placing the focus on a potential revisit of the 2022 low of 0.6170.

image2.png


How to Trade After a News Release

How to Trade After a News Release

Post-release trading strategies

1. Trend following strategy

This strategy involves the use of multiple time frames, as well as, well-defined levels of support and resistance that come into play after a news release.

Traders can adopt this strategy when the current market price is approaching a well-defined level of support or resistance but isn’t quite there yet. The volatility after the news release has the potential to push the market toward the trendline. If price respects the trendline, traders can look to trade in the direction of the trend and trade the potential bounce.

The following 4 points are of assistance for this type of trade:

  1. Determine trend direction on a daily chart
  2. Draw support and resistance lines
  3. Select a forex time frame anywhere from 1 – 4 hours
  4. Buy near support in uptrend and sell near resistance in downtrend

Keep in mind that news releases have the potential to break through longstanding levels of support and resistance which underscores the importance of using tight stops when pursuing this strategy.

Post-release trend following strategy

2. Dual spike breakout strategy

This strategy involves waiting for market volatility to reveal a range before trading a break of that range and makes use of a five-minute chart. For illustrative purposes this section incorporates the US Non-Farm Payroll (NFP) release as this often has the greatest potential to move the market.

After the NFP release, wait 15-minutes for three five-minute candles to close. Take note of the highest price and the lowest price of the three closed candles. Next, place an entry order to go long at the highest price and an entry to go short at the lowest price. Once an order is triggered, targets can be set at twice the distance of the high/low channel while stops can be set above resistance for short trades and below support for long trades.

The disadvantage of this strategy is that volatility can push price above or below the short-term range, triggering an entry order, and then immediately reversing to hit a stop loss.

This strategy can be applied in the following way:

  1. Customize the chart settings to show 5- minute charts
  2. Take note of the highs and lows of the first three candles
  3. Set entry orders when price breaks above or below the range
  4. Set stops and limits
  5. Delete the unfilled order

Dual spike forex news trading strategy<alt image desc> Dual spike forex news trading strategy

3. News Reversal Strategy

The market can trade in one direction immediately after a major news release only to reverse and trade in the opposite direction.

The news reversal strategy looks to trade the news after the release and focuses on a sudden, sustained reversal in direction after a strong initial move in price.

The reversal could be the result of algorithms or, the market as a whole, feeling that there was an overreaction in price – prompting trades in the opposite direction.

The downside of this strategy is that no reversal takes place and the price continues trading in the direction on the initial spike.

How to implement the news reversal strategy:

  1. Initial spike in price: News with great market moving potential generally lead to a spike in price as the news is released.
  2. Look out for a reversal: Traders can wait 10-15 minutes for the reversal to bring price back to where it was before the release.
  3. Entry: Enter as price breaks above/below pre-release levels.
  4. Set multiple target levels: Traders should consider setting multiple target levels. As one is triggered, traders can take profit on half of the position and adjusting the stop on the remaining position to breakeven.

News reversal trading strategy

Trading forex after the release: Conclusion

Trading the news after the release can be a more conservative way to approach news trading. This is due to the emotions from the news release subsiding allowing a trader time to plan a technical set up for their trade. Regardless of your trading approach to news trading, risk management and utilizing small amounts or no leverage is critical to maintaining capital in your account to make the next trade.

Boost your forex trading knowledge

  • Download our free currency forecasts to stay abreast with the DailyFX expert view on forex market movements.
  • If you’re just starting out on your forex trading journey, download our free New to Forex trading guide to get to grips with the basics.

Trading after the news FAQ section

What type of news is most likely to move the market?

US economic data is so influential within global currency maekets that it is generally seen as the most important news. Additionally, it is important to note that not all news releases lead to increased volatility. Rather, there are a limited number of major news releases that have previously produced the greatest potential to move the market and some of these include:

  • US non-farm payrolls
  • US GDP
  • Us Federal Funds Rate announcement
  • ECB refinancing rate
  • Australian employment change