Australian Dollar Bumps Up but US Dollar Moves Might be Key. Will AUD/USD Rally?

Australian Dollar Bumps Up but US Dollar Moves Might be Key. Will AUD/USD Rally?

The Australian Dollar has steadied going into the new week after testing recent lows last Friday.

The weakness in AUD/USD is mostly a result of the US Dollar regaining the ascendency with Treasury yields continuing to remain buoyant.

The benchmark 10-year bond finished last week oscillating above 4.60%, not far from the 16-year peak of 4.88% seen earlier this month.

In a similar vein, the 2-year note, which is more sensitive to the Fed funds target rate, continues to trade above 5%. The 5.20% seen last month was the highest since 2006.

In comparison, the 2- and 10-year Australian Commonwealth Government bonds (ACGB) are yielding around 4.05% and 4.45% respectively.

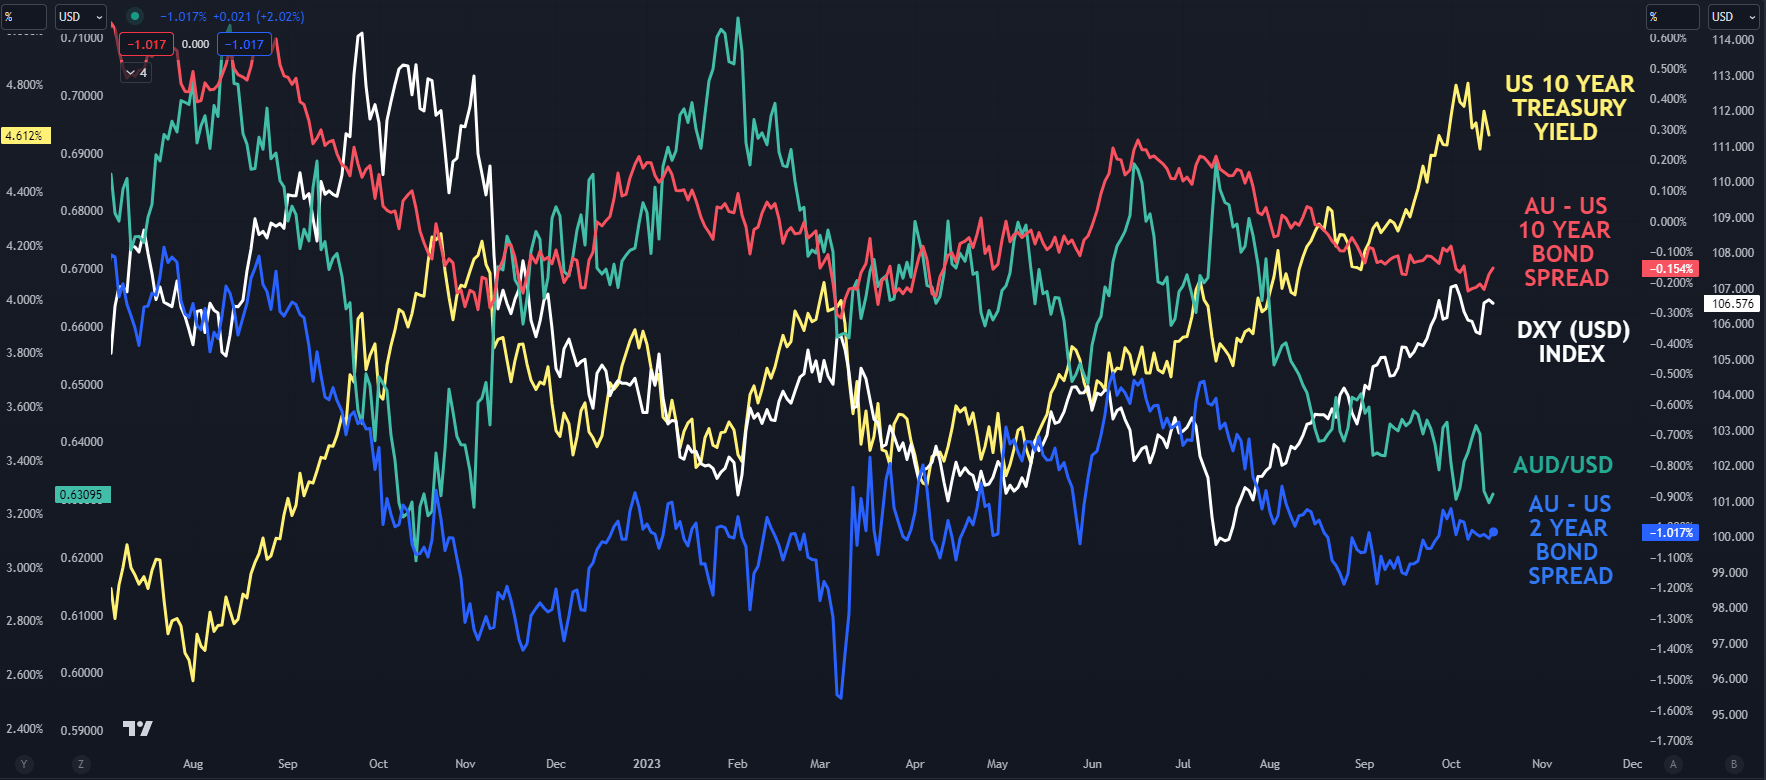
However, recent movements in the spread between Australian and US government bonds highlight that it is the strengthening of the US Dollar rather than the interest rate differential that appears to have more influence over AUD/USD.

Then by extension, nominal Treasury yields appear to have more sway than the spread for the Aussie Dollar.

AUD/USD AND DXY (USD) INDEX AGAINST AU AND US BONDS

image1.png

Elsewhere, risk assets are under the microscope with geopolitical events in the Middle East creating some uncertainty for markets.

Crude oil and other energy commodities have found some support as well as perceived haven currencies such as the Swiss Franc.

Spot gold has also traded back above US$ 1,920 an ounce but industrial metals are languishing somewhat.

The US Dollar has opened slightly softer across the board to start the week in the Asian session, and it is possible that markets could be in for a volatile week ahead.

This Thursday will see Australian unemployment data and it is forecast to remain near multi-generational lows at around 3.7% for the September read.

AUD/USD TECHNICAL ANALYSIS

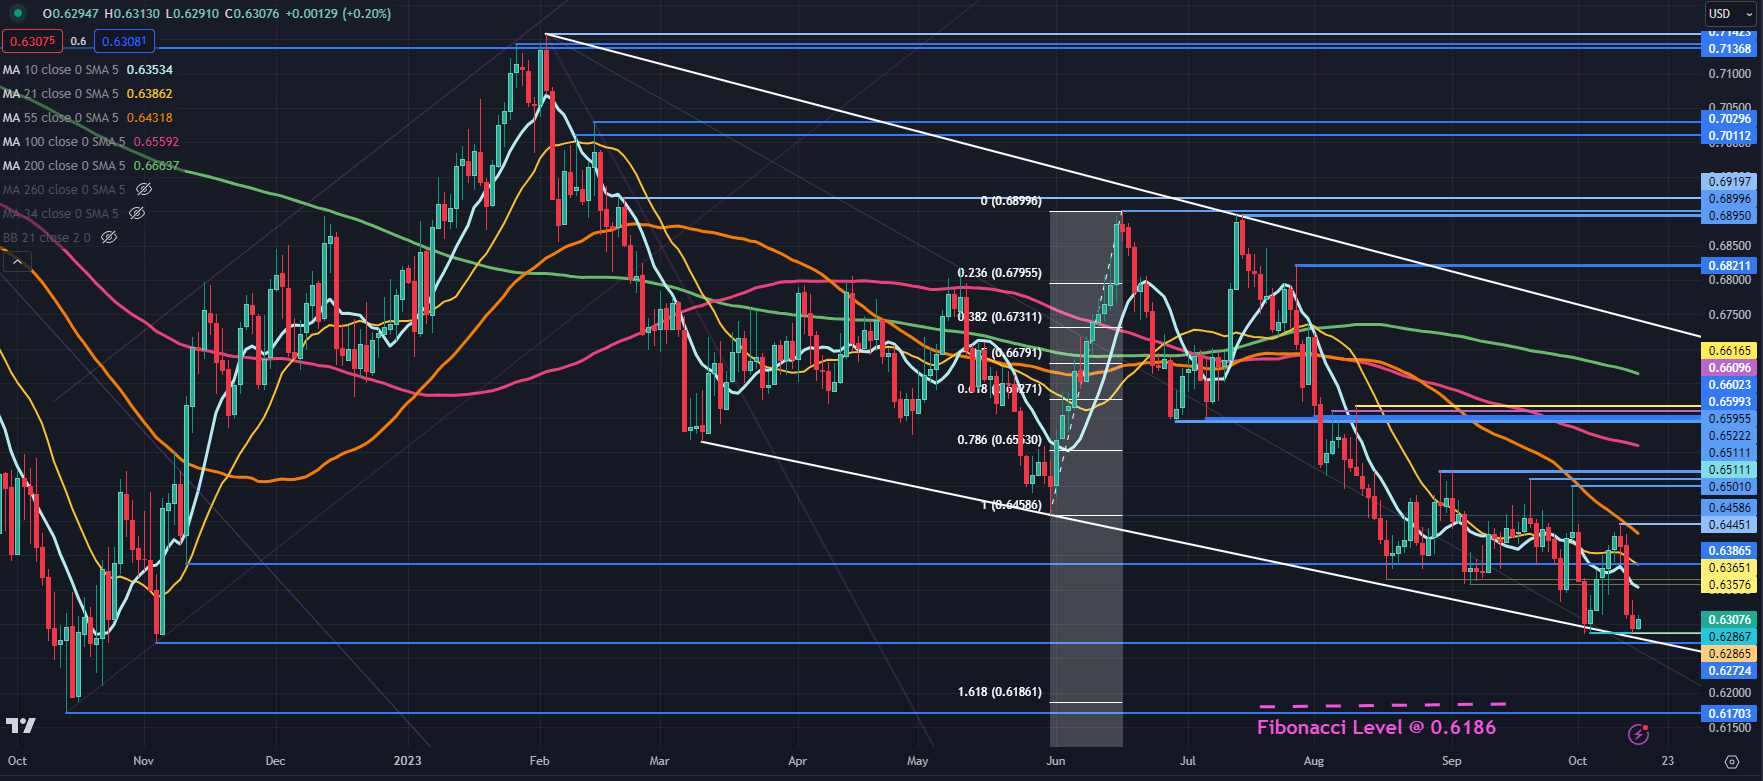
AUD/USD bounced off the low of 0.6286 to start the week and if the price fails to move below that level, a Double Bottom might be in place.

Overall, it remains in a descending trend channel and bearish momentum might be intact for now.

A bearish triple moving average (TMA) formation requires the price to be below the short-term Simple Moving Average (SMA), the latter to be below the medium-term SMA and the medium-term SMA to be below the long-term SMA. All SMAs also need to have a negative gradient.

When looking at any combination of the 10-, 21-, 55- 100- and 200-day SMAs, the criteria for a bearish TMA have been met and might suggest that bearish momentum is evolving. To learn more about trend trading, click on the banner below.

Last Wednesday’s high of 0.6447 coincided with the 55-day Simple Moving Average (SMA) and that level may offer resistance ahead of a cluster of prior peaks in the 0.6500 – 0.6510 area.

Further up, the 0.6600 – 0.6620 area might be another resistance zone with several breakpoints and previous highs there.

On the downside, support may lie near the previous lows of 0.6286, 0.6272 and 0.6170.

The latter might also be supported at 161.8% Fibonacci Extension level at 0.6186.

AUD/USD DAILY CHART

image2.png

HK/China Equities Search for Upward Momentum: Hang Seng, CSI 300 Setups

HK/China Equities Search for Upward Momentum: Hang Seng, CSI 300 Setups

The Hang Seng Index’s rebound early last week ran out of steam toward the end of the week, suggesting that a meaningful upward momentum is lacking in Hong Kong/China equities despite the support/stimulus measures in recent months.

Economic data in recent weeks have raised hopes that economic growth in China could be bottoming – the Economic Surprise Index has shown steady improvement since July. However, those hopes were dented after data last weeks showed persistent anemic domestic demand and deflation. Consensus economic growth for the current year is yet to turn around after being downgraded since Q2-2023. For more discussion see, “Q4 Trade Opportunity: HK/China Equities Could be Due for a Rebound,” published October 9.

Chinese policymakers have responded with a string of support/stimulus measures in recent months in an attempt to revive the faltering post-Covid recovery and a weak property sector. Most recently, media reports suggest China is considering creating a state-backed stabilization fund to shore up confidence in equity markets. Moreover, the world’s second-largest economy is considering raising its budget deficit for 2023 as the government prepares a fresh round of stimulus to boost the economy.

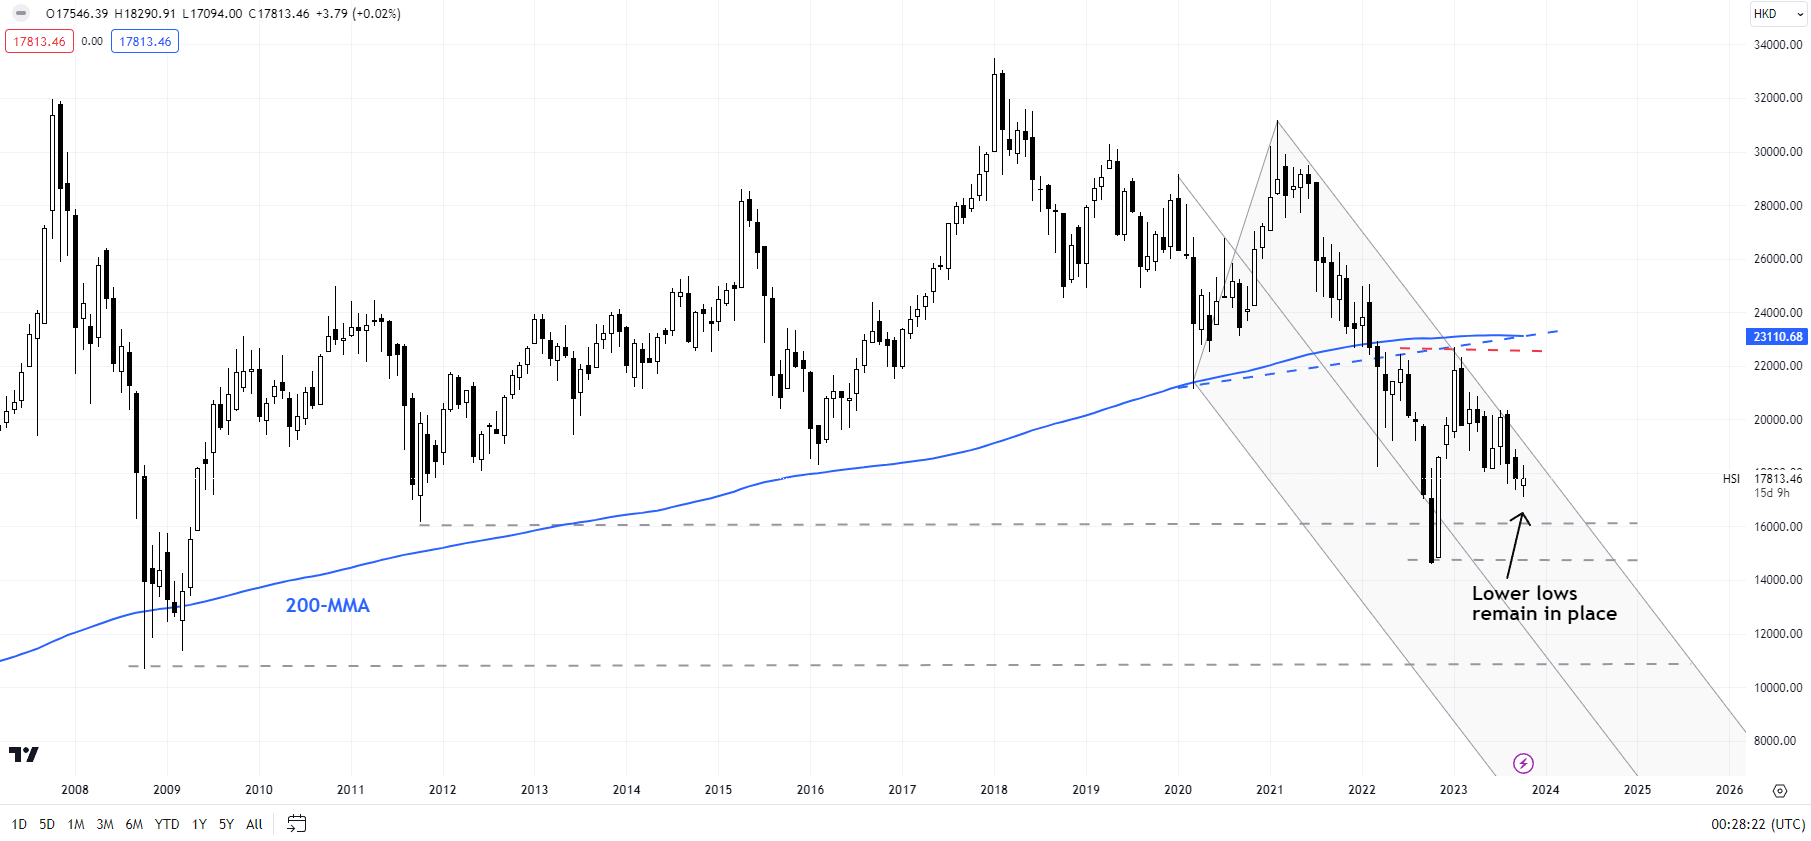
Hang Seng Index Monthly Chart

image1.png

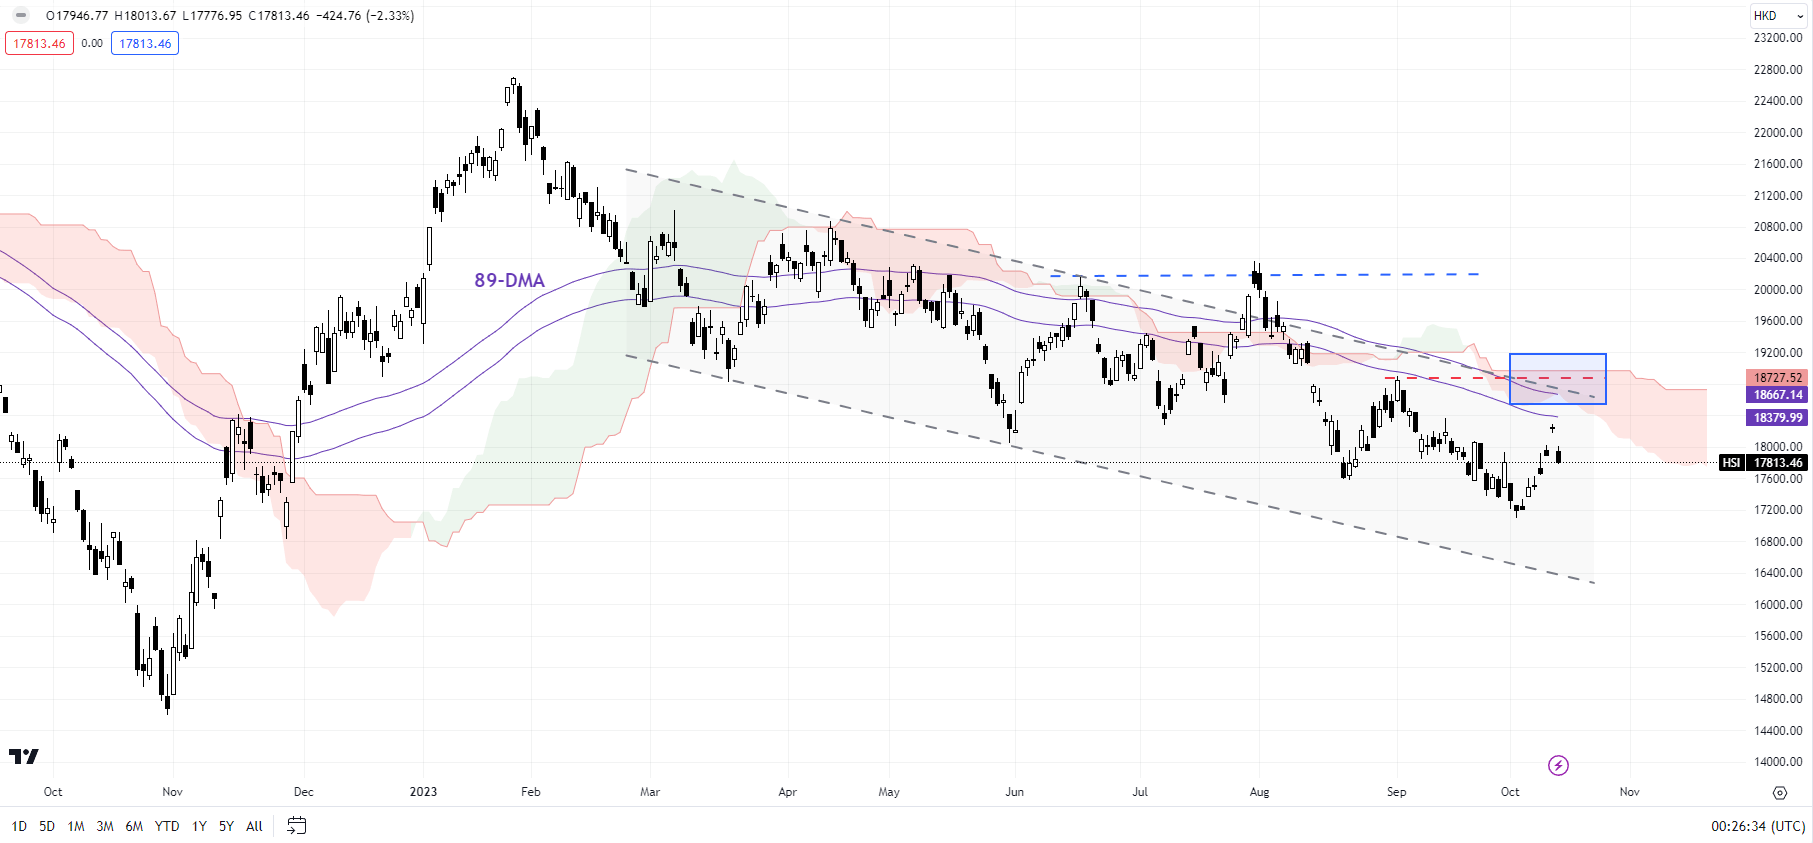
On technical charts, the Hang Seng Index has rebounded in recent sessions, but it is too early to say if this time is different compared to the rebounds since Q2-2023. At a minimum, the index needs to cross through a vital ceiling at the September high of 18900, coinciding with the 89-day moving average and the upper edge of the Ichimoku cloud on the daily charts.

Hang Seng Index Daily Chart

image2.png

Such a break would reduce the immediate downside risks, and clear the way toward the June-July highs of around 20300. For a reversal of the broader downtrend, it is important for the index to stop making new lows and break above 20300. Until then, risks remain toward the downside, initially toward the early-October low of 17000, followed by the lower edge of a declining channel since early 20300.

CSI 300 Index Weekly Chart

image3.png

CSI 300: Approaching strong support

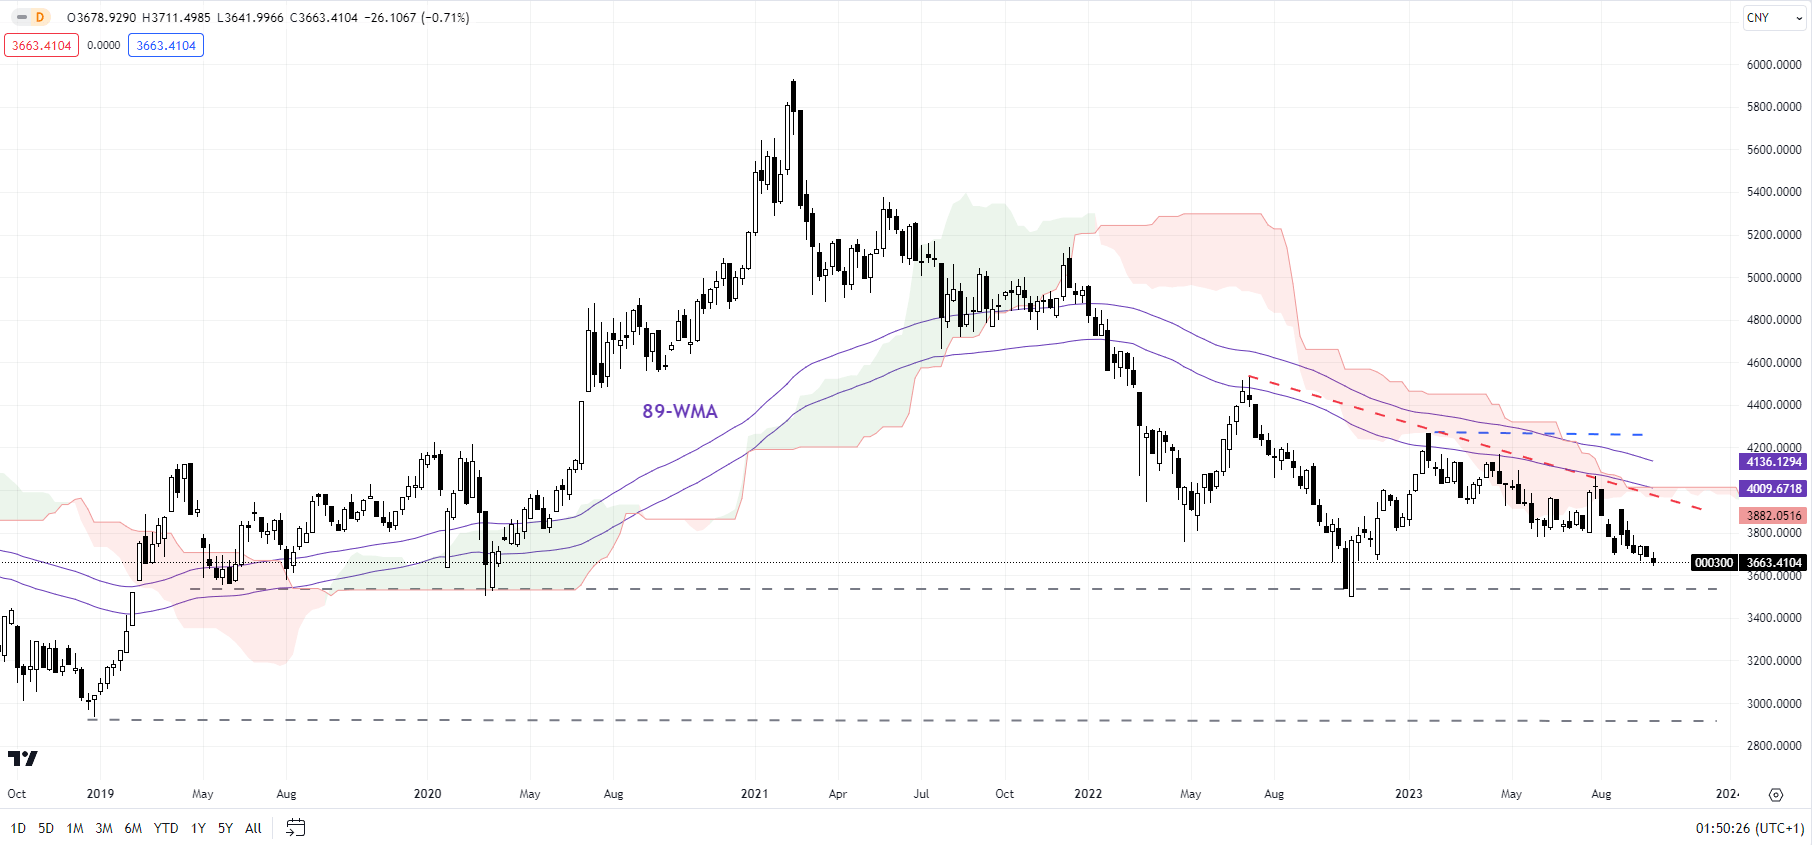
From a broader trend perspective, the CSI 300 index continues to be weighed by stiff converged resistance, including the 89-week moving average, coinciding with the upper edge of the Ichimoku cloud on the weekly charts. There is a distinct shift in the trend compared with 2019-2022, where the index was holding above the cloud and the moving average.

For the immediate downward pressure to fade, the index needs to break above 4000-4270, including the February high of 4270, the cloud, and the moving average, the bias remains weak. Any break below strong support on a horizontal trendline since 2019 (at about 3500) could clear the path toward the 2019 low of 2935.

Crude Oil Steadies After Leaping Higher on Middle East Conflict. Higher WTI?

Crude Oil Steadies After Leaping Higher on Middle East Conflict. Higher WTI?

Crude oil has held onto Friday’s gains as traders continue to watch the developments in the Middle East.

As reports roll in of various pockets of fighting, the market remains cautious and concerned about the potential disruption to the global oil supply. The military build-up in the region is adding to scrutiny of the potential squeeze on available supply.

US Treasury Secretary Janet Yellen made comments on Friday that the US cannot rule out further sanctions against Iran, adding to concerns around the availability of the energy product.

The WTI futures contract is near US$ 87.70 bbl while the Brent contract is around US$ 90.90 bbl at the time of going to print.

Perceived haven assets have had a mixed start to the week with gold easing slightly after a stellar rally on Friday, dipping under US$ 1,920 an ounce.

The Swiss Franc has mostly maintained the strength seen last week, trading near 0.9000 against the US Dollar and close to a 13-month peak against the Euro around 0.9480.

The US Dollar is softer so far in the Asian session with the Aussie and Kiwi Dollars recovering some of the heavy losses seen at the end of last week.

The results of the New Zealand election over the weekend are not clear-cut at this stage, but there has been a shift away from the incumbent administration toward the conservative side of politics.

In any case, a coalition of some sort will need to be hashed out over the coming weeks. The S&P NZX 20 index finished down around a third of a per cent.

APAC equities are all under pressure with Japan’s Nikkei 225 index down over 1.50%. Futures are indicating a steady start to European and US equity indices to start the day.

Looking ahead, sentiment data from manufacturers in Canada and the US will be watched closely as well as commentary from the BoE, ECB and Fed speakers.

The full economic calendar can be viewed here.

WTI CRUDE OIL TECHNICAL SNAPSHOT

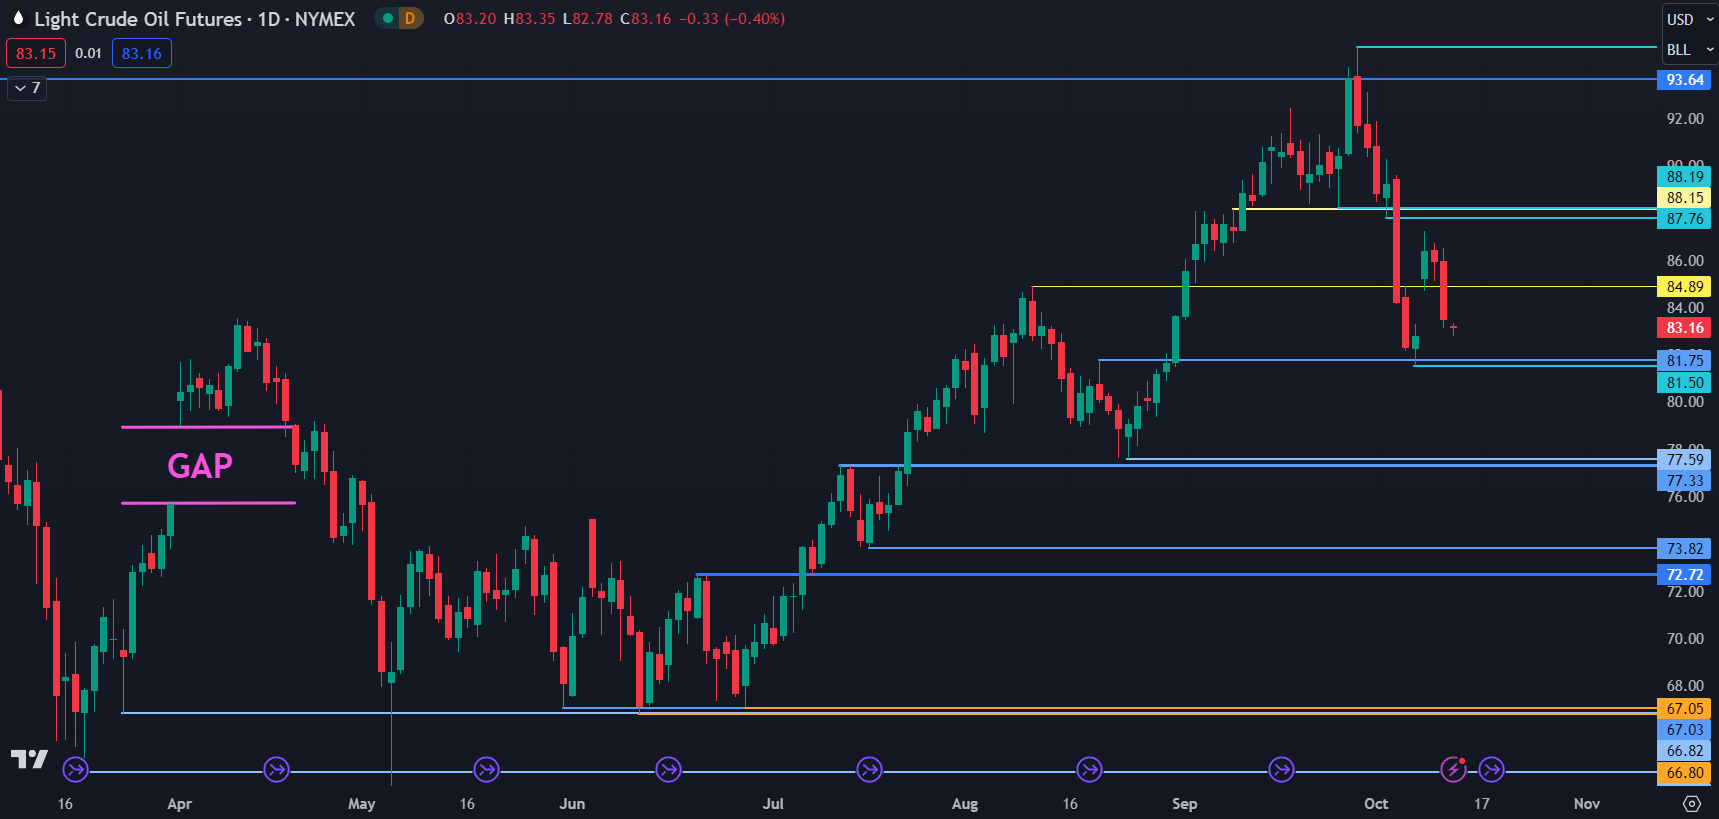
The WTI futures contract raced up to test resistance at the breakpoints between 87.76 and 88.19 but has so far been unable to overcome them. They may continue to offer resistance.

Further up, resistance might be at the breakpoint and previous peak at 93.64 and 95.03 respectively.

Support may lie near the breakpoints in the 84.70 – 84.90 area before the prior lows at 82.31 and 81.50.

WTI CHART

image1.png

How to Trade the Impact of Politics on Global Financial Markets

How to Trade the Impact of Politics on Global Financial Markets

ANALYZING GEOPOLITICAL RISKS

Against the backdrop of eroding fundamentals, markets become increasingly sensitive to political risks as their capacity for inducing market-wide volatility is amplified. When liberal-oriented ideologies – that is, those favoring free trade and integrated capital markets – are being assaulted on a global scale by nationalist and populist movements, uncertainty-driven volatility is the frequent result.

What makes political risk so dangerous and elusive is the limited ability investors have for pricing it in. Traders may therefore find themselves hot under the collar as the global political landscape continues to develop unpredictably. Furthermore, much like the spread of the coronavirus in 2020, political pathogens can have a similar contagion effect.

Generally speaking, markets do not really care about political categorizations but are more concerned with the economic policies embedded in the agenda of whoever holds the reigns of the sovereign. Policies that stimulate economic growth typically act as a magnet for investors looking to park capital where it will garner the highest yield.

These include the implementation of fiscal stimulus plans, fortifying property rights, allowing for goods and capital to flow freely and dissolving growth-sapping regulations. If these policies create adequate inflationary pressure, the central bank may raise interest rates in response. That boosts the underlying return on local assets, reeling in investors and lifting the currency.

Conversely, a government whose underlying ideological predilections go against the gradient of globalization may cause capital flight. Regimes that seek to rip out the threads that have sown economic and political integration usually create a moat of uncertainty that investors do not want to traverse. Themes of ultra-nationalism, protectionism and populism have been frequently shown to have market-disrupting effects.

If a state undergoes an ideological realignment,traders will assess the situation to see if it radically alters their risk-reward set up. If so, they may then reallocate their capital and re-formulate their trading strategies to tilt the balance of risk to reward in their favor. Volatility is stoked in doing so however as reformulated trading strategies are reflected in the market-wide redistribution of capital across various assets.

EUROPE: EUROSCEPTIC POPULISM IN ITALY

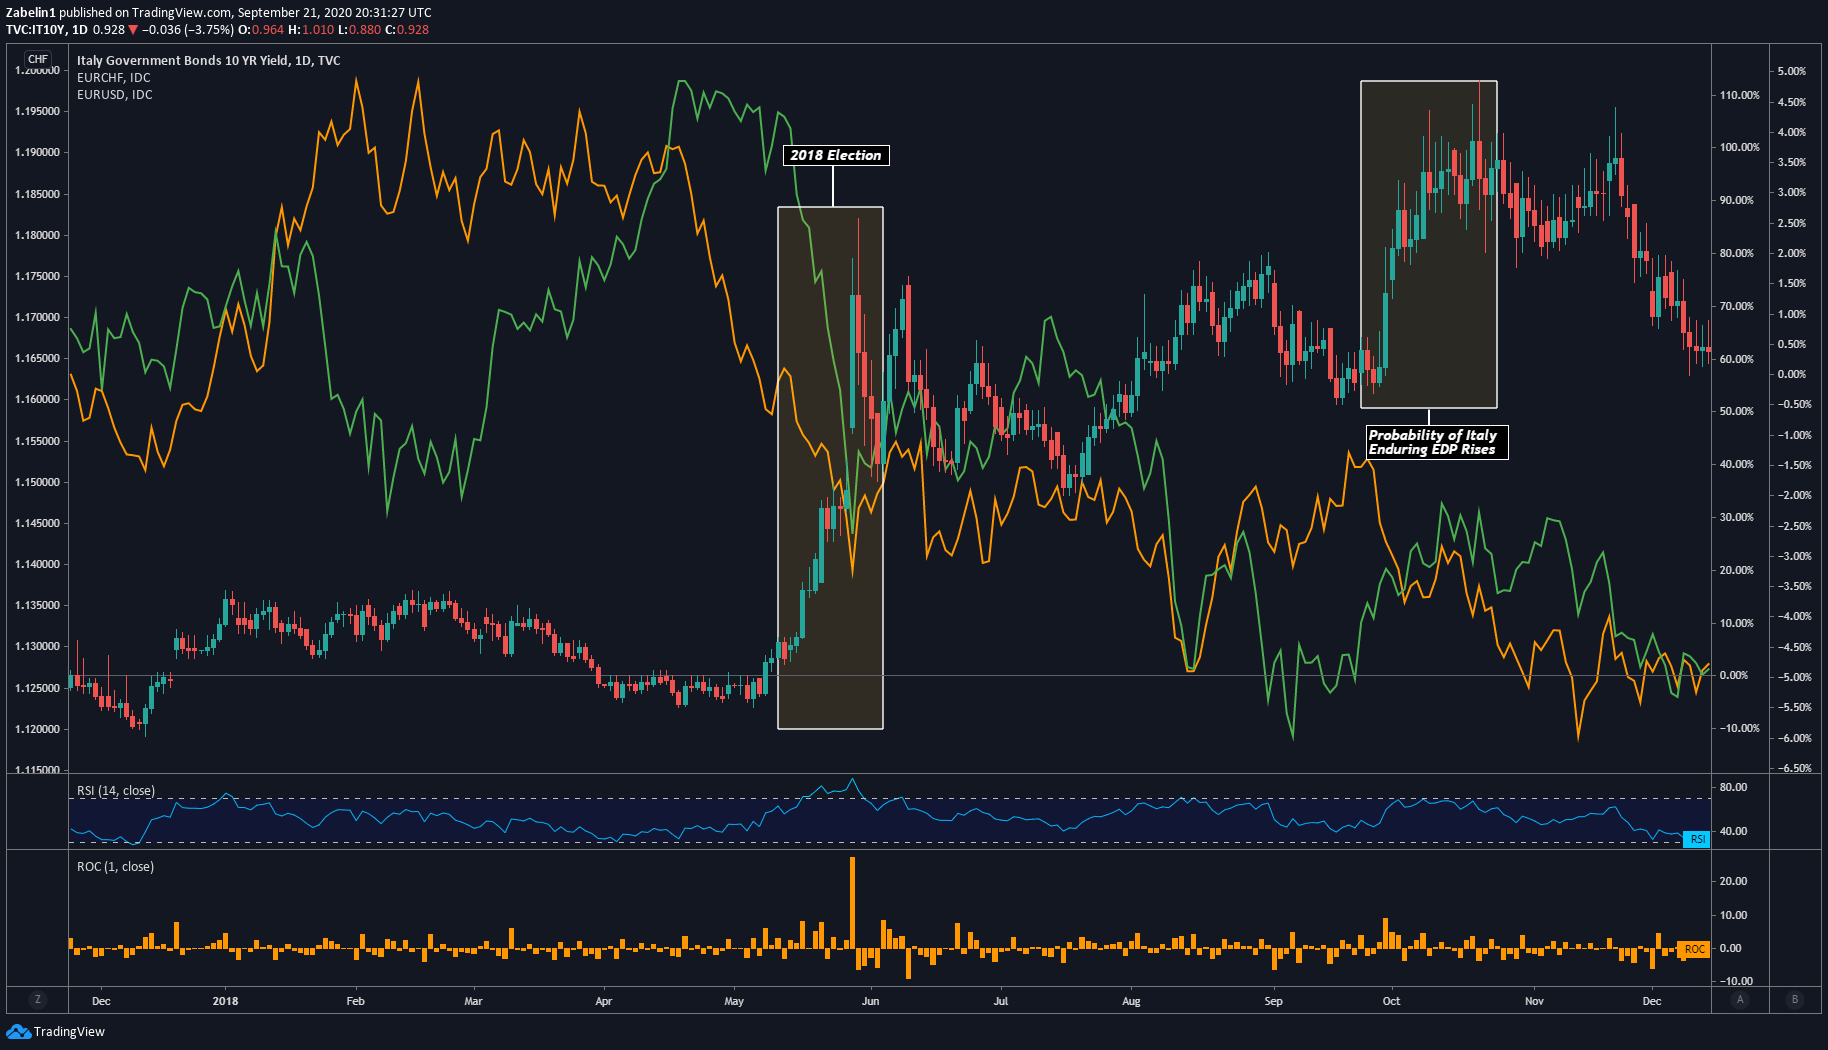
In Italy, the 2018 election roiled regional markets and eventually rippled through virtually the entire financial system. The ascendancy of the anti-establishment right-wing Lega Nord and ideologically-ambivalent 5 Star Movement was founded on a campaign of populism with a built-in rejection of the status quo. The uncertainty accompanying this new regime was then promptly priced in and resulted in significantly volatility.

The risk premium for holding Italy’s assets rose and was reflected in an over-100 percent spike in Italian 10-year bond yields. That showed investors demanding a higher return for tolerating what they perceived to be a higher level of risk. This was also reflected in the dramatic widening of the spread on credit default swaps on Italian sovereign debt amid increased fears that Italy could be the epicenter of another EU debt crisis.

EUR/USD, EUR/CHF Plummeted as Mediterranean Sovereign Bond Yields Spiked Amid Fears of Another Eurozone Debt Crisis
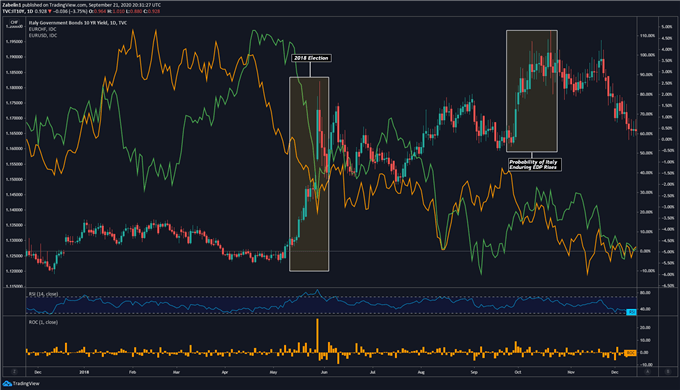
Chart showing EUR/USD, EUR/CHF

The US Dollar, Japanese Yen and Swiss Franc all gained at the expense of the Euro as investors redirected their capital to anti-risk assets. The Euro’s suffering was prolonged by a dispute between Rome and Brussels over the former’s budgetary ambitions. The government’s fiscal exceptionalism was a feature of their anti-establishment nature that in turn introduced greater uncertainty and was then reflected in a weaker Euro.

LATIN AMERICA: Nationalist-Populism in Brazil

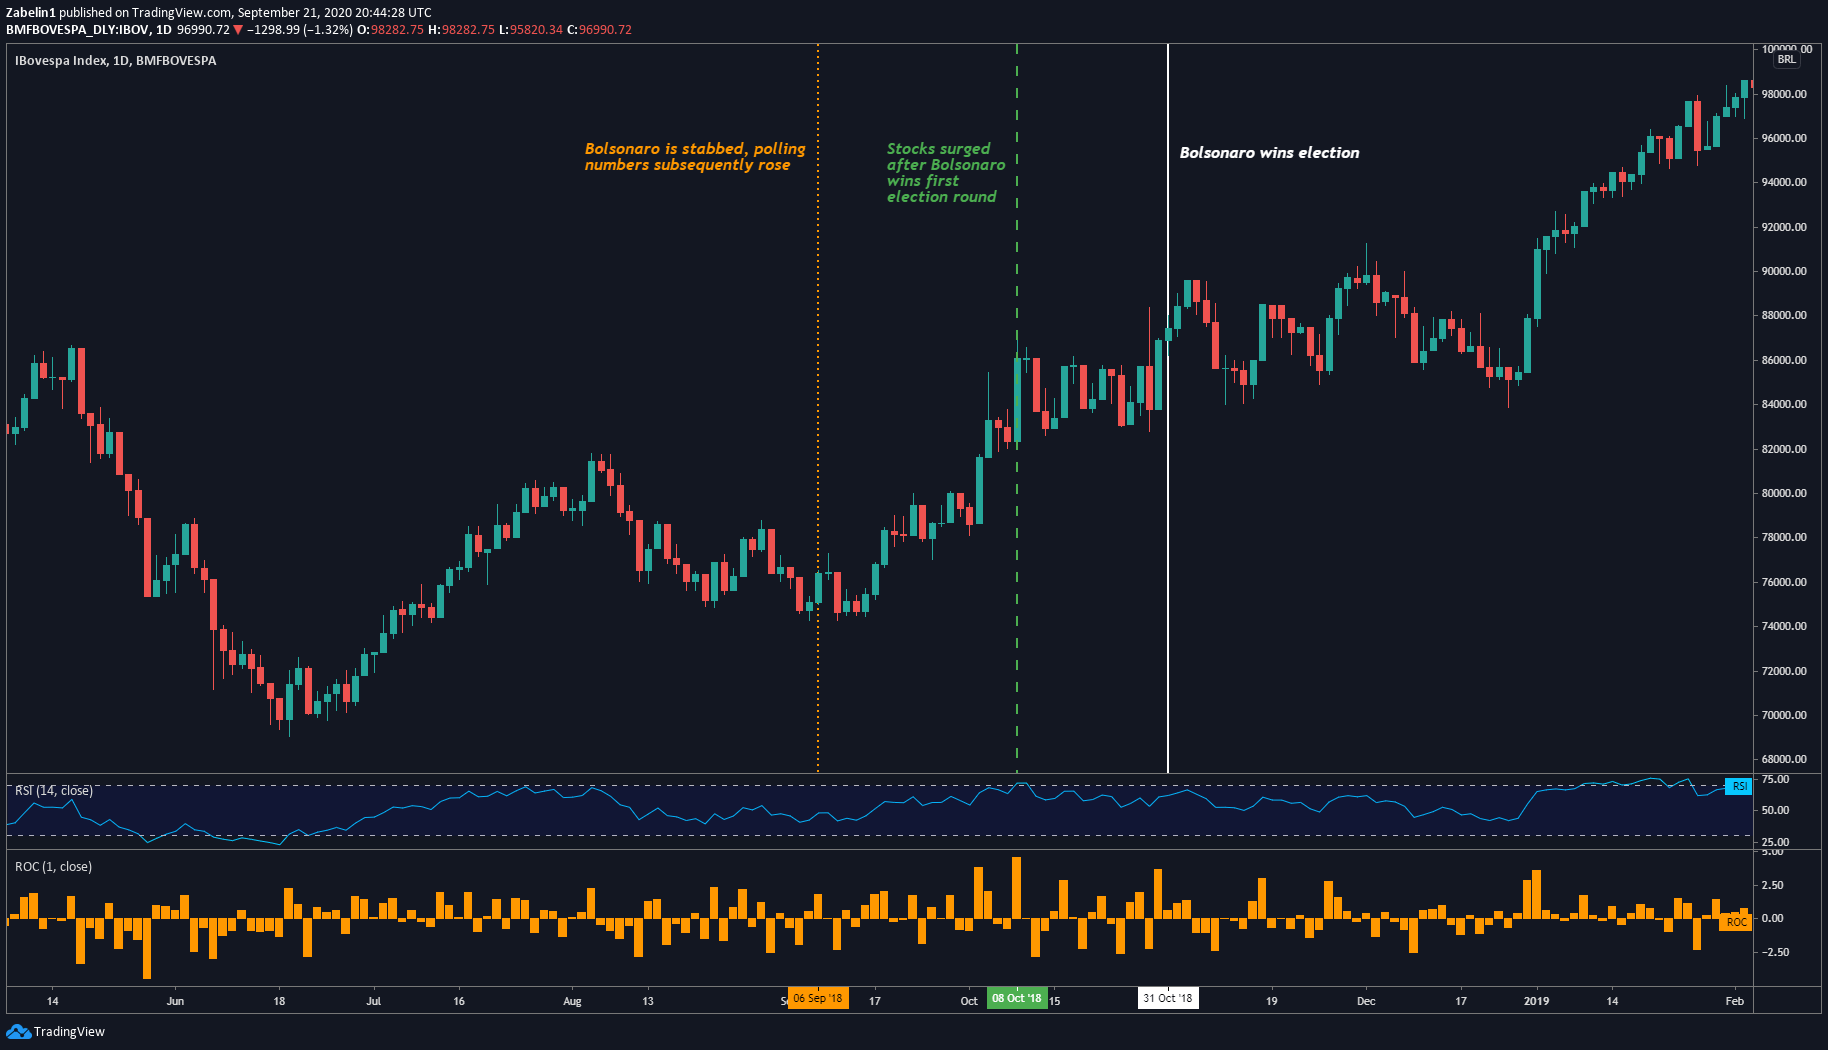
While President Jair Bolsonaro is generally characterized as a fire-brand nationalist with populist underpinnings, the market reaction to his ascendency was met with open arms by investors. His appointment of Paulo Guedes – a University of Chicago-trained economist with a penchant for privatization and regulatory restructuring – boosted sentiment and investors’ confidence in Brazilian assets.

Ibovespa Index – Daily Chart
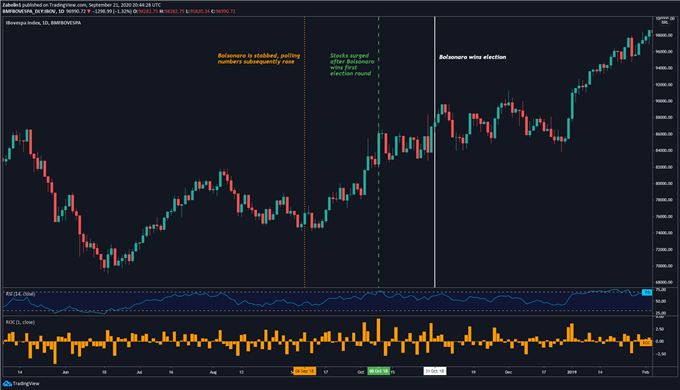
Chart showing Ibovespa Index

from June 2018 to the Covid-19 global markets rout in early 2020, the benchmark Ibovespa equity index rose over 58 percent compared with a little over 17 percent in the S&P 500 over the same time period. During the election in October, the Brazilian index rose over 12 percent in just one month as polls revealed that Bolsonaro was going to triumph over his left-wing opponent Fernando Haddad.

Since Bolsonaro’s ascent to the presidency, the ups and downs in Brazilian markets have reflected the level of progress on his market-disrupting pension reforms. Investors speculated that these structural adjustments will be strong enough to pull Brazil’s economy away from the precipice of a recession and toward a strong growth trajectory, unburdened by unsustainable public spending.

ASIA: Hindu Nationalism in India

The re-election of Prime Minister Narendra Modi was broadly welcome by markets, though lingering concerns were raised about the effect of Hindu nationalism on regional stability. However, Modi has a reputation for being a business-friendly politician. His election lured investors into allocating a significant amount of capital to Indian assets.

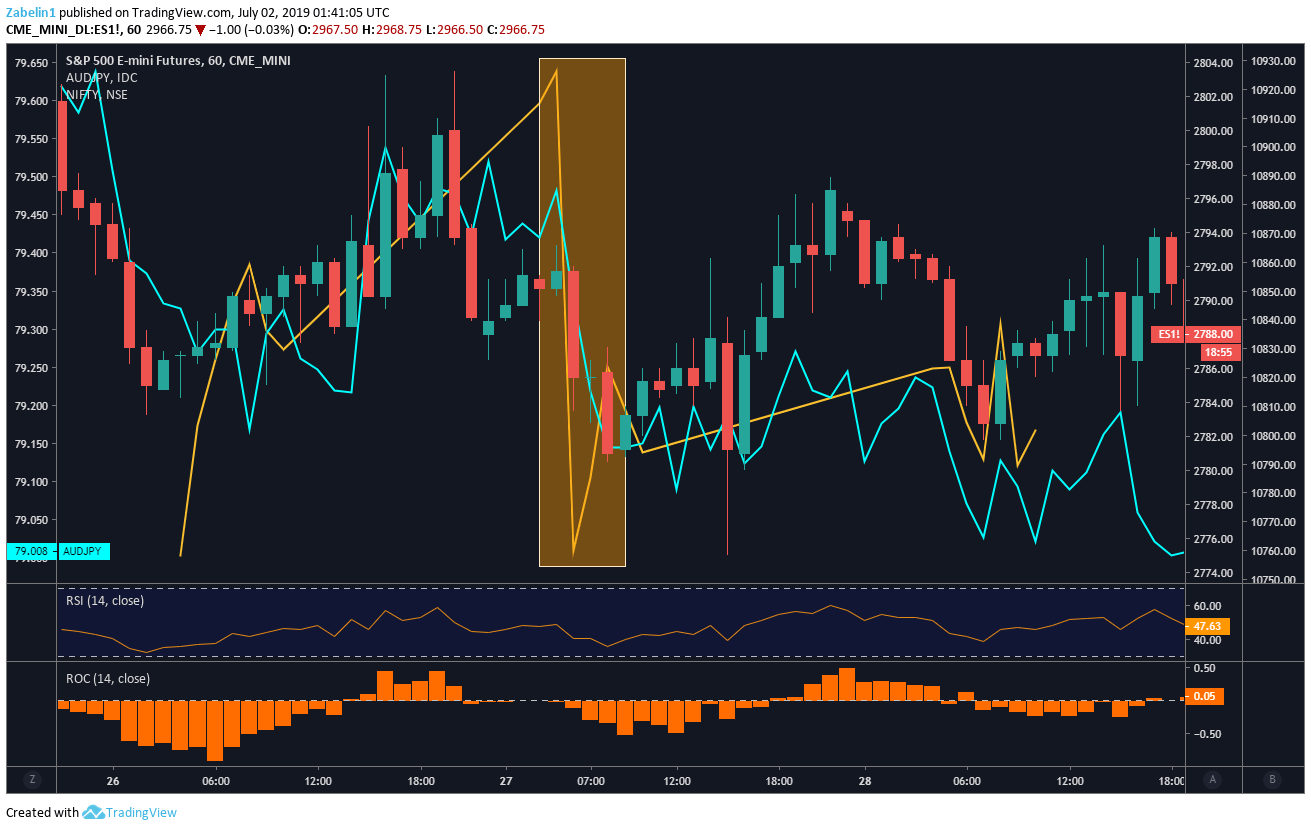
However, investors’ optimistic outlook is periodically undermined by periodic clashes between India and its neighbors over territorial disputes. In the first breaths of 2019, India-Pakistan relations soured drastically amid a skirmish over the disputed Kashmir region. Since the 1947 partition, the hostility between the two nuclear powers has been an ever-present regional risk.

India Nifty 50 Index, S&P 500 Futures, AUD/JPY Fall After News Broke of India-Pakistan Skirmish
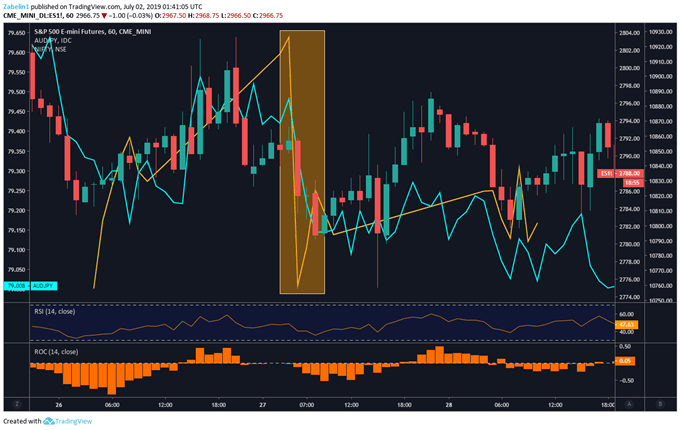
Chart showing S&P 500 Futures, AUD/JPY

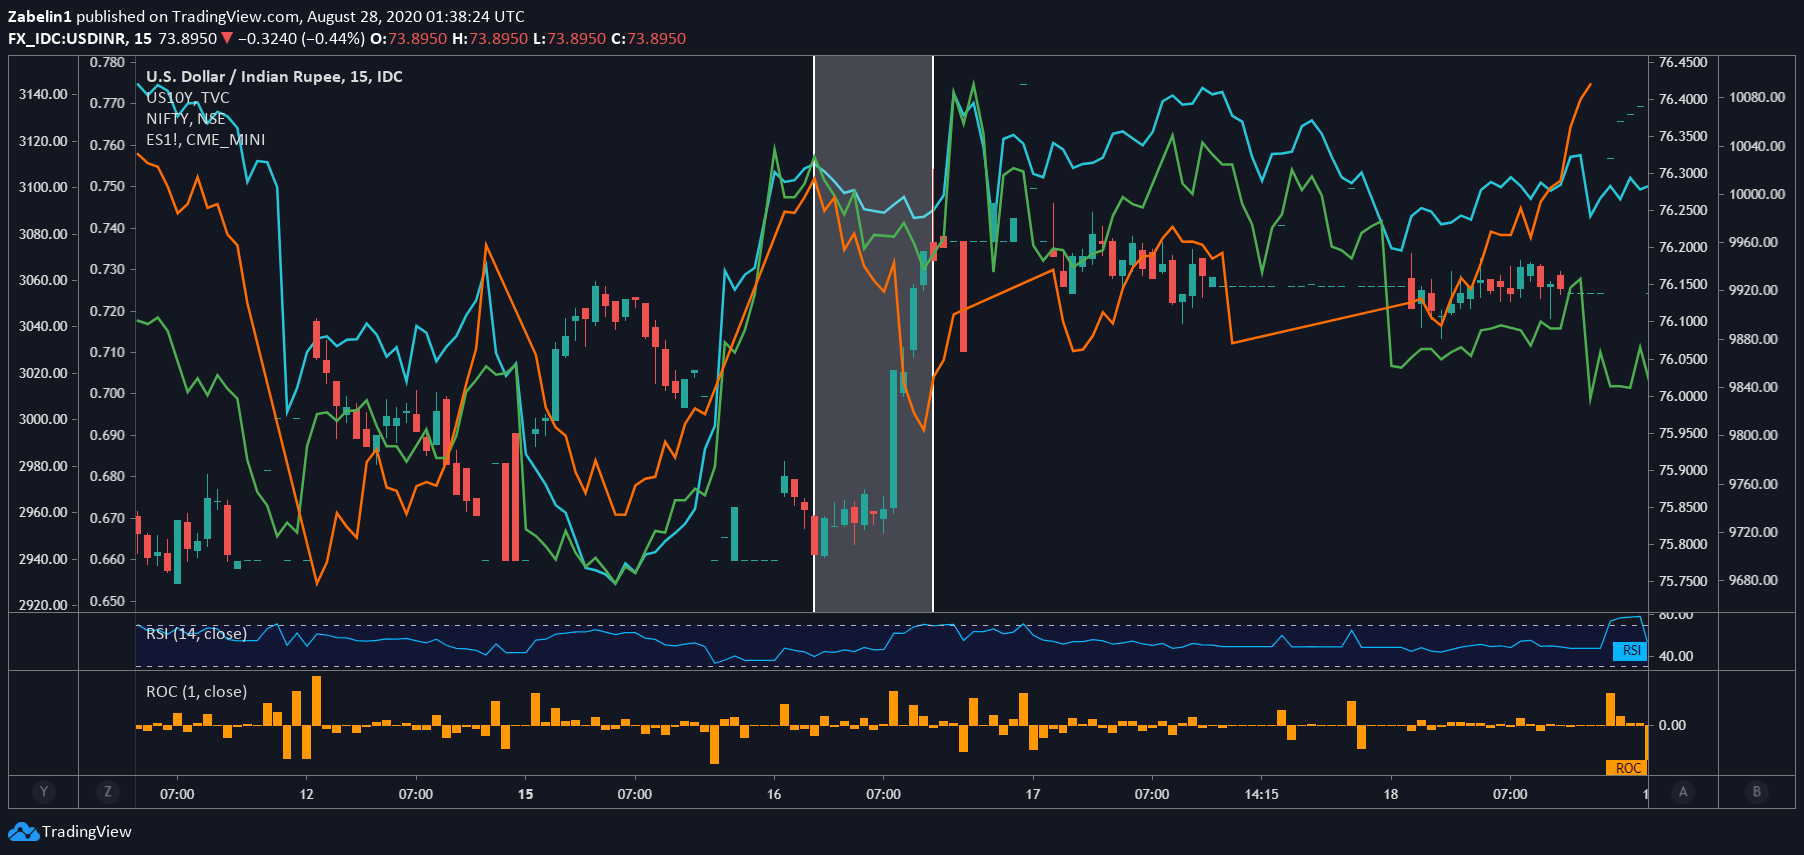
Tension between India and China, particularly over the disputed border known as the Line of Actual Control (LAC) in the Himalayan Mountains also rattled Asian financial markets. In June 2020, news of a skirmish between Chinese and Indian troops resulting in over 20 deaths raised concerns about what further escalation could mean for regional security and financial stability. Read the full report here.

India Nifty 50 Index, S&P 500 Futures, US 10-Year Treasury Yield, USD/INR After News Broke of India-China Skirmish
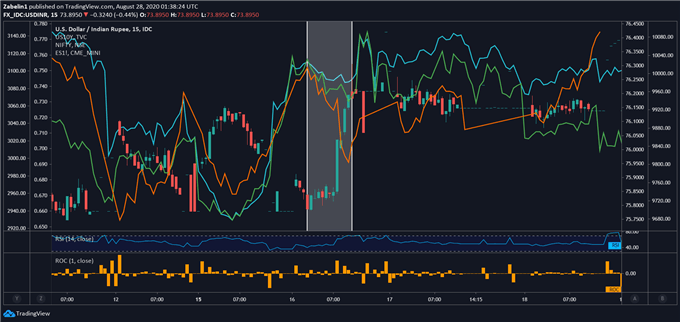
Chart showing S&P 500 futures, USD/INR

Nationalist campaigns and governments are embedded with political risk because the very nature of such a regime relies on displaying strength and frequently equates compromise with capitulation. In times of political volatility and economic fragility, the financial impact of a diplomatic breakdown is amplified by the fact that a resolution to a dispute will likely be prolonged due to the inherently stubborn nature of nationalist regimes.

US President Donald Trump and Modi employed a similar brand of strong rhetoric both on the campaign trail and within their respective administrations. In a rather ironic way, their ideological similarity may in fact be a force that causes a rift in diplomatic relations. Tensions between the two have escalated in 2019, with markets worrying that Washington may start another trade war in Asia, opening a second front in India having already engaged China.

HOW FX REACTS AS GOVERNMENTS, CENTRAL BANKS RESPOND TO GEOPOLITICAL & ECONOMIC STRESS

For economies with a high degree of capital mobility, there are essentially four different sets of policy-mix alternatives that can provoke a reaction in FX markets following an economic or geopolitical shock:

  • Scenario 1: Fiscal policy is already expansionary + monetary policy becomes more restrictive (“tightening”) = Bullish for the local currency
  • Scenario 2: Fiscal policy is already restrictive + monetary policy becomes more expansionary (“loosening”) = Bearish for the local currency
  • Scenario 3: Monetary policy already expansionary (“loosening”) + fiscal policy becomes more restrictive = Bearish for the local currency
  • Scenario 4: Monetary policy is already restrictive (“tightening”) + fiscal policy becomes more expansionary = Bullish for the local currency

It is important to note that for an economy like the United States and a currency like the US Dollar, whenever fiscal policy and monetary policy start trending in the same direction, there is often an ambiguous impact on the currency. Below we will examine how various fiscal and monetary policy remedies for geopolitical and economic shocks impact currency markets.

Scenario 1 – FISCAL POLICY LOOSE; MONETARY POLICY BECOMES TIGHTER

On May 2, 2019 – following the FOMC decision to hold rates in the 2.25-2.50 percent range – Fed Chair Jerome Powell said that relatively soft inflationary pressure noted at the time was “transitory”. The implication here was that while price growth was below what central bank officials were hoping for, it would soon accelerate. The US-China trade war played a role in slowing economic activity and muting inflation.

The implicit message was then a reduced probability of a rate cut in the near term, given that the fundamental outlook was judged to be solid and the overall trajectory of US economic activity seen to be on a healthy path. The neutral tone struck by the Fed was comparatively less dovish than what markets had anticipated. This might then explain why the priced-in probability of a Fed rate cut by the end of the year (as seen in overnight index swaps) fell from 67.2 percent to 50.9 percent after Powell’s comments.

Meanwhile, the Congressional Budget Office (CBO) forecasted an increase in the fiscal deficit over a three-year time horizon, overlapping the central bank’s would-be tightening cycle. What’s more, this came against the backdrop of speculation about a bipartisan fiscal stimulus plan. In late April, key policymakers announced plans for a US$2 trillion infrastructure building program.

EUR/USD Forecast – Euro Gives Up Early Attempt at a Rally

EUR/USD Forecast – Euro Gives Up Early Attempt at a Rally

Euro vs US Dollar Technical Analysis

The euro has initially tried to rally during the trading session on Friday, as the market tries to recover some of the massive losses from the Thursday session. That being said, the market looked as it was getting ready to break down the potential bearish flag. The 1.05 level underneath it does offer a psychologically important level, but if we were to break down below there, then it’s likely that we will test the recent swing low. I also believe that could kick off further selling, perhaps sending the Euro down to the 1.0250 level, and then maybe even as low as parity.

Trading Derivatives carries a high level of risk to your capital and you should only trade with money you can afford to lose. Trading Derivatives may not be suitable for all investors, so please ensure that you fully understand the risks involved, and seek independent advice if necessary. A Product Disclosure Statement (PDS) can be obtained either from this website or on request from our offices and should be considered before entering into a transaction with us. Raw Spread accounts offer spreads from 0.0 pips with a commission charge of USD $3.50 per 100k traded. Standard account offer spreads from 1 pips with no additional commission charges. Spreads on CFD indices start at 0.4 points. The information on this site is not directed at residents in any country or jurisdiction where such distribution or use would be contrary to local law or regulation.

Any short-term rally will be looked at with suspicion, as interest rates in the United States are much harder to break down than people were hoping, and of course recent inflation numbers in the United States add more credence to a strong dollar, so it all ties together for a potential bigger move.

If we were to rally from here, the 1.0650 level offers a significant short-term ceiling, and breaking above there then brings into light the 50-Day EMA which of course is also important as well. This is a market that continues to see a lot of negativity, and even though we had a nice grinding rally earlier in the week, it looks like all of that positivity has just about left the market now.

Keep in mind that Europe is getting ready to head into a fairly significant recession, so that’s something to be cognizant of as well. Although the market is likely to continue seeing a lot of different narratives throwing things around, the reality is that the geopolitical situation also favors the US dollar, as it is used as a safety asset. Ultimately, the downward pressure should win the day, and we should go much lower over the longer term. I look at any rally as an opportunity to start buying “cheap US dollars” along the way. With this, a little bit of patience probably goes a long way as well, as it looks like we continue to see yields in America outperform Germany and the rest of the European Union, and of course fears continue to be stoked around the world as well.

Nasdaq Index, Dow Jones, S&P 500 News: Wall Street Eyes Strong Bank Earnings Amid Market Volatility

Nasdaq Index, Dow Jones, S&P 500 News: Wall Street Eyes Strong Bank Earnings Amid Market Volatility

Market Overview

U.S. stock futures signaled a strong finish for the week, riding the wave of robust bank earnings and a dip in Treasury yields. Dow Jones futures were up 128 points, trading at 33,924, while the S&P 500 and tech-centric Nasdaq futures also posted gains ahead of the cash market opening.

Bank Earnings Lead the Way

The financial sector was a strong performer, thanks to optimistic Q3 results from major players. JPMorgan Chase reported higher-than-expected earnings, propelling its shares up by 1.8%. Wells Fargo followed suit with a 3.3% rise in pre-market trading after beating revenue forecasts. Citigroup wasn’t far behind, registering a 3% increase in share price after beating revenue expectations, with a reported $20.14 billion in revenue against the projected $19.31 billion.

Trading Derivatives carries a high level of risk to your capital and you should only trade with money you can afford to lose. Trading Derivatives may not be suitable for all investors, so please ensure that you fully understand the risks involved, and seek independent advice if necessary. A Product Disclosure Statement (PDS) can be obtained either from this website or on request from our offices and should be considered before entering into a transaction with us. Raw Spread accounts offer spreads from 0.0 pips with a commission charge of USD $3.50 per 100k traded. Standard account offer spreads from 1 pips with no additional commission charges. Spreads on CFD indices start at 0.4 points. The information on this site is not directed at residents in any country or jurisdiction where such distribution or use would be contrary to local law or regulation.

Treasury Yields Retreat

As banks surged, Treasury yields took a step back. The 10-year Treasury yield saw an 11 basis point decline to 4.598%, while the 2-year yield dropped nearly 5 basis points to 5.02%. This inverse relationship between yields and prices was accentuated by comments from Philadelphia Federal Reserve President Patrick Harker, who suggested that the Fed could maintain the current interest rate levels for the near future.

External Factors and Sentiment

Investor sentiment remains cautiously optimistic despite ongoing geopolitical tensions, such as the Israel-Hamas conflict potentially impacting global oil supply. However, market analysts believe that the fears might be overblown. Moreover, there’s a prevailing sentiment that companies are likely to exceed earning expectations, particularly in the technology and industrials sectors.

Short-Term Outlook

The short-term market outlook appears bullish. All major indices are set to post weekly gains, despite ending Thursday in the red. The Dow is set to break a three-week losing streak, the S&P 500 aims for its second straight positive week, and the Nasdaq is on track for its third consecutive week of gains. As we head into the weekend, traders should keep an eye on the release of preliminary consumer sentiment data for October, which could serve as a market mover.

Technical Analysis

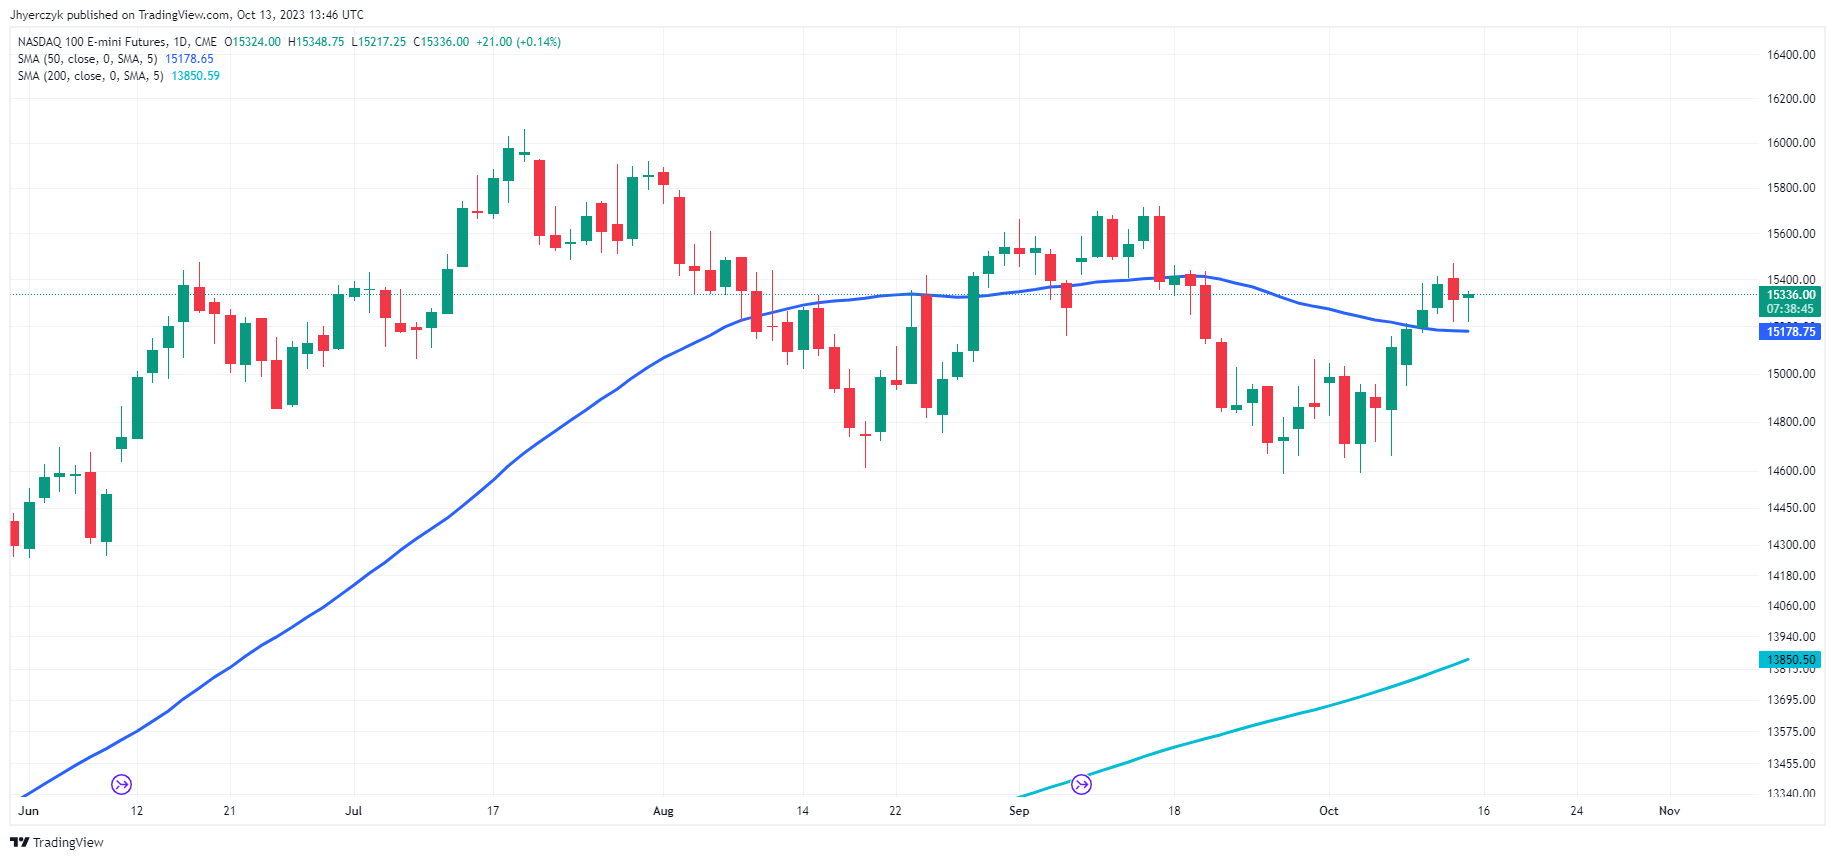
Daily Nasdaq 100 E-miniThe Nasdaq 100 E-mini is currently trading at 15,339.50, above both its 200-day and 50-day moving averages of 13,850.58 and 15,178.61, respectively. This suggests a bullish sentiment in the short and long term. The fact that the index is above these key moving averages indicates strong upward momentum.

It should be noted that the current daily price is also slightly higher than the previous close of 15,315.00, which may signify bullish continuation. Therefore, market sentiment for Nasdaq 100 E-mini appears to be bullish at this time.

US Dollar Index News: DXY Retreats as Inflation Data Spurs Uncertainty

US Dollar Index News: DXY Retreats as Inflation Data Spurs Uncertainty

Dollar Loses Edge Despite Hot CPI Data

After its most significant one-day surge since March, the U.S. dollar retracted last Friday, even as consumer prices climbed higher than anticipated. The September Consumer Price Index (CPI) rose 0.4%, keeping the annual rate at 3.7%. This revelation has reignited discussions that the Federal Reserve may need to implement further rate hikes to maintain inflation close to its 2% target.

A Close Eye on the Fed

Market participants are closely scrutinizing the Federal Reserve’s potential next moves, especially as economists had forecasted a 0.3% monthly CPI gain and a 3.6% annual rate. Although the base case scenario foresees a rate-hold until 2024, any additional upside surprises in upcoming CPI and employment reports could swing the pendulum towards a rate hike as soon as December.

Trading Derivatives carries a high level of risk to your capital and you should only trade with money you can afford to lose. Trading Derivatives may not be suitable for all investors, so please ensure that you fully understand the risks involved, and seek independent advice if necessary. A Product Disclosure Statement (PDS) can be obtained either from this website or on request from our offices and should be considered before entering into a transaction with us. Raw Spread accounts offer spreads from 0.0 pips with a commission charge of USD $3.50 per 100k traded. Standard account offer spreads from 1 pips with no additional commission charges. Spreads on CFD indices start at 0.4 points. The information on this site is not directed at residents in any country or jurisdiction where such distribution or use would be contrary to local law or regulation.

Treasury Yields and Market Speculation

On the other side of the market, U.S. Treasury yields softened last Friday. Despite declining yields, uncertainty looms large regarding the Fed’s monetary stance. While some officials believe rates have been sufficiently increased to cool off the economy and tame inflation, others are taking a more cautious approach, awaiting further data on inflationary trends.

Global Currencies and Trade Data

Currency movements also captured attention, with the Japanese Yen trading at 149.58 per dollar, sparking speculation of potential market intervention by authorities. The Euro and Sterling moved marginally, while Sweden’s crown gained on stronger-than-expected consumer price data. Recent trade and pricing data out of China have further muddied global economic waters, adding another layer of complexity to Fed decision-making.

Short-term Forecast

Given the hot CPI data and diverging opinions among Fed policymakers, market sentiment appears increasingly sensitive to near-term inflation and employment reports. With two central bank meetings left this year, the market seems to be preparing for a potentially volatile Q4. Overall, the sentiment is cautiously bearish for the dollar in the short term.

Technical Analysis

Daily US Dollar (DXY)

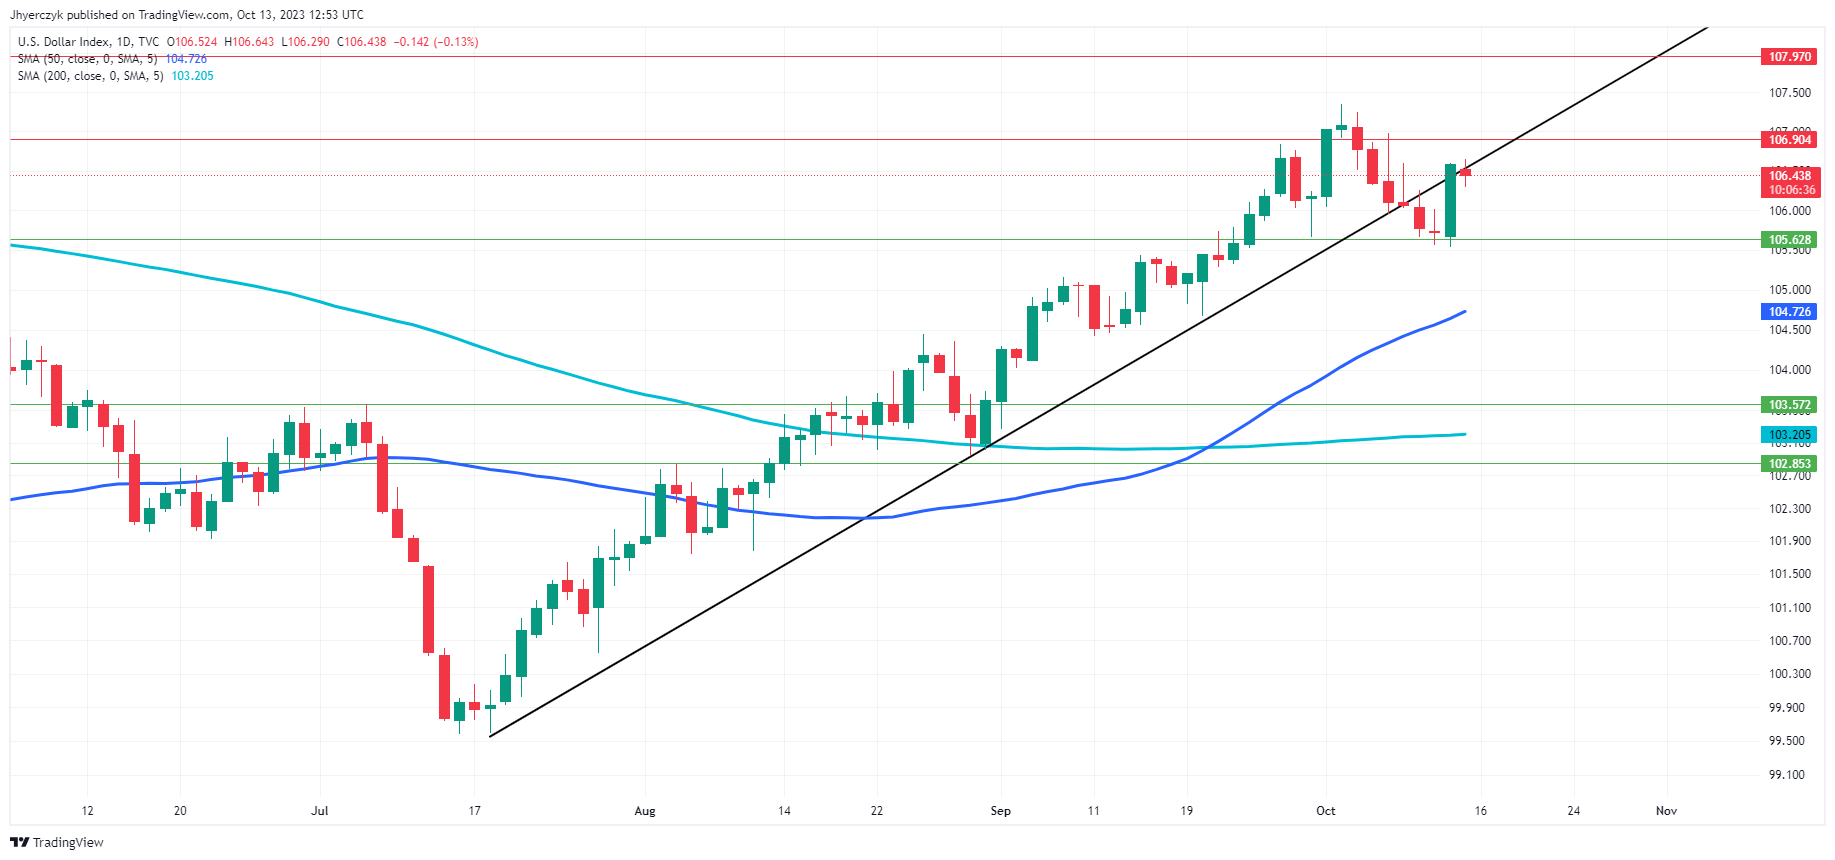
The US Dollar Index (DXY) is presently trading at 106.403, notably above both its 200-day and 50-day moving averages, which stand at 103.205 and 104.726 respectively. This positioning suggests a generally bullish market sentiment in both short-term and long-term perspectives.

The index is also testing its trend line support at 106.558, a critical juncture that traders are closely watching. How the market reacts to this uptrend line could very well set the tone for its future direction, indicating whether the bullish momentum will continue or reverse.

October Consumer Sentiment Plunges Amid Rising Inflation Fears

October Consumer Sentiment Plunges Amid Rising Inflation Fears

Consumer Sentiment Takes a Hit, Inflation Fears Loom Large

Consumer sentiment has taken a nosedive this October, tumbling 7% as inflation fears grip the psyche of American consumers. The decline is noteworthy given the prior stability of sentiment for two consecutive months. Adding to the gloom, assessments of personal finances have retreated by a whopping 15%, primarily fueled by growing concerns about inflation. As if that wasn’t unsettling enough, expectations for business conditions over the next year have plummeted 19%.

Inflation Concerns Reach New Heights

Year-ahead inflation expectations have surged from 3.2% to 3.8%, marking the highest level since May 2023. This figure far outstrips the 2.3-3.0% range that was the norm before the pandemic hit. The upward trend signals that inflation remains a critical variable shaking consumer and market confidence.

Long-Run Inflation Expectations Stable Yet Elevated

In contrast, long-term inflation expectations have edged up marginally from 2.8% to 3.0%. Although a smaller increase, this rate has been in the 2.9-3.1% band for most of the past 27 months, which still sits higher than the 2.2-2.6% range observed in the pre-pandemic period.

Demographic Groups Reflect Universal Concern

The sentiment downturn is all-encompassing, affecting nearly every demographic group. This indicates a universal worry over the economy’s current trajectory, despite long-run expectations suggesting that this downturn is likely a temporary blip rather than a long-term trend.

Short-Term Forecast: Bearish on Consumer Sentiment

Given the confluence of adverse factors such as rising inflation expectations and declining views on personal finances and short-term business conditions, the outlook for consumer sentiment in the immediate future appears bearish. While long-term business expectations remain relatively stable, the short-term concerns are likely to weigh down sentiment further, at least in the immediate quarter ahead.

Industrial production up by 0.6% in both the euro area and the EU

Industrial production up by 0.6% in both the euro area and the EU

In August 2023, the seasonally adjusted industrial production increased by 0.6% in both the euro area and the EU, compared with July 2023, according to estimates from Eurostat, the statistical office of the European Union. In July 2023, industrial production decreased by 1.3% in both the euro area and the EU. In August 2023 compared with August 2022, industrial production decreased by 5.1% in the euro area and by 4.4% in the EU. In the euro area in August 2023, compared with July 2023, production of durable consumer goods grew by 1.2%, non-durable consumer goods by 0.5% and capital goods by 0.3%, while production

Yen Hovers Just Shy of 150 Level as Intervention Threat Weighs

Yen Hovers Just Shy of 150 Level as Intervention Threat Weighs

(Bloomberg) — The yen is hovering near a key psychological level of 150 against the dollar after the yield gap with the US widened on hotter-than-expected inflation data.

The currency traded just below that rate versus the greenback on Friday afternoon in Asia amid speculation Japanese authorities will step in to support it should the yen suddenly weaken. A senior finance ministry official said that the Group of Seven reaffirmed its stance that excessive moves are problematic, during a meeting Thursday in Morocco.

“Close attention is being paid to the 150 level,” said Yuta Suzuki, vice president at MUFG Bank Ltd. in New York. “Investors probably don’t want to buy dollar-yen above 150 primarily because of concerns about intervention.”

The yen traded at 149.65 per dollar as of 2:45 p.m. in Tokyo after losing 0.9% over the past three days.

A spike in Treasury yields across the curve after US consumer prices came in higher than forecasts further increased the gap between US and Japanese yields, putting pressure on the yen. The US 10-year yield of 4.66% compares with Japan’s equivalent at 0.76%. The yen is one of the world’s worst-performing major currencies this year as higher yields elsewhere have drawn money into overseas markets.

After depreciating past 150 for the first time in almost a year on Oct. 3, the currency suddenly spiked to 147.43, sparking speculation of an intervention. Japanese officials so far have not confirmed whether or not they came into the currency market, although early estimates suggested it was not their action.

For Japanese authorities, what seems to matter is sharp fluctuations in the yen. Finance Minister Shunichi Suzuki said on Oct. 3 that he won’t judge the possibility of intervention by currency levels, but through volatility. He then said on Oct. 6 that gradual, one-directional moves could be considered excessive.

Though the dollar-yen rate is nearing an important level, the pair’s two-week implied volatility – a measure of expected swings – stayed near its lowest level since March 2022.