Trading with Bollinger Band Reversal Patterns

Trading with Bollinger Band Reversal Patterns

What are Bollinger Band® Reversal Patterns?

Bollinger Band® reversal patterns occur while using the Bollinger Band® indicator. These reversal signals can appear in all financial markets and are associated with both bullish and bearish reversals.

Identifying the reversal is simple and relates closely with the double bottom and double top candlestick patterns (also referred to as ‘W’s’ and ‘M’s’).
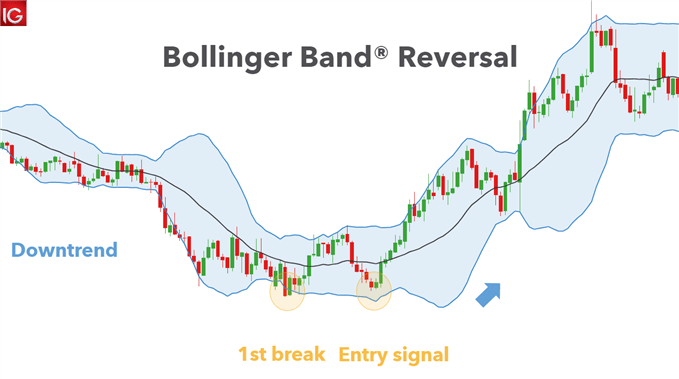
Bollinger Band reversal

How to identify a Bollinger Band® Reversal pattern

A step-by-step guide to identifying the Bollinger Band® Reversal pattern on a chart:

  1. Add a Bollinger Band® indicator (20 period, 2 standard deviation) to the chart – usually daily or hourly
  2. Identify preceding uptrend/downtrend using price action or technical indicators
  3. Isolate a double top/bottom, depending on the preceding trend
  4. Look for the first top/bottom breaking through the respective Bollinger Band®
  5. Wait for the second top/bottom to appear which DOES NOT break the Bollinger Band®
  6. Look to enter from this point or take the traditional entry point using the double top/bottom method of using the neckline as the reference point

Curious to learn how market positioning can affect asset prices? Our sentiment guide holds the insights—download it now!

Bollinger Band® Reversal Trading Strategies

Below is an example of Bollinger Band® reversal on a forex pair. The steps above are shown clearly to illustrate the simplicity of this trading technique.

NZD/USD Daily chart bearish reversal

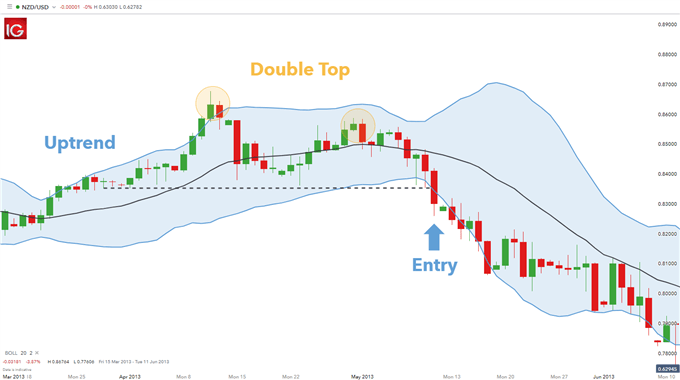
The chart below shows the Bollinger Band® reversal on an NZD/USD chart. The trend has been identified as an uptrend using simple price action movement of higher highs and higher lows.

The first peak of the double top (‘M’) is seen breaking through the upper Bollinger Band® (highlighted in yellow), after which the second peak is seen falling short of the upper Bollinger Band®. This shows a lack of momentum to the upside by bulls.
Bollinger Band double top reversal

Some traders enter into a short position from this point however, using the neckline (dashed line) of the double top is commonplace. Simply put, a break in the neckline will trigger the short entry.

This can be done by a pure break or a candle close below the neckline. This is completely at the trader’s discretion. Stops are generally taken from recent swing highs in this example, while limits (take profit) levels can be determined by price action or Fibonacci levels.

Price Action Trading

Price Action Trading

Technical analysis is comprised of numerous disciplines, but at the foundation of it lies price action. There are three key components – trend, price levels (support/resistance), and the reaction of the market which can provide actionable signals.

If you’re puzzled by trading losses, why not take a step in the right direction? Download our guide, “Traits of Successful Traders,” and gain valuable insights to steer clear of common pitfalls that can lead to costly errors.

Trend

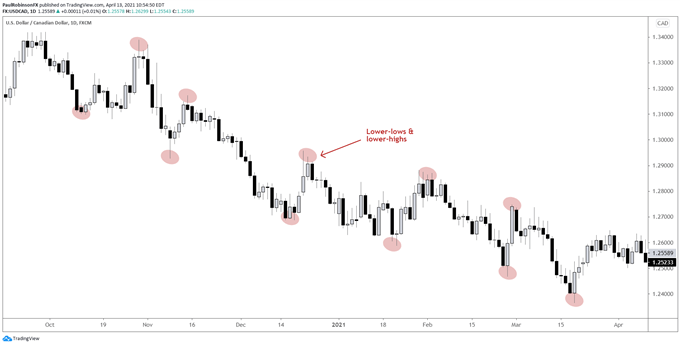
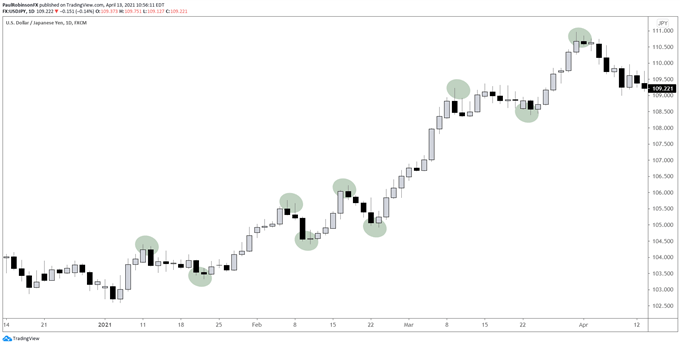
There are many indicators that can identify the trend and its strength, but what really defines a trend from a simple price standpoint is whether the market is making higher-highs and higher-lows (uptrend) or lower-lows and lower-highs (downtrend), or doing neither and thus creating a range.

Trends occur on all time-frames, but the general rule of thumb to follow is that the higher time-frame takes precedence over the shorter-term. For example, in FX using the daily and 4-hr is a solid combination for providing a comprehensive picture.

While an uptrend may be occurring on the 4-hr (short-term) there may be a downtrend unfolding on the daily chart (longer-term). In this case, more respect should be paid to the trend of the daily chart, with consideration that at some point the short-term trend may revert back in favor of the longer-term trend.

Example of an Uptrend

Created with TradingView

Example of a Downtrend

New to trading financial markets? Learn how to build confidence in trading. It’s free!

Support and Resistance

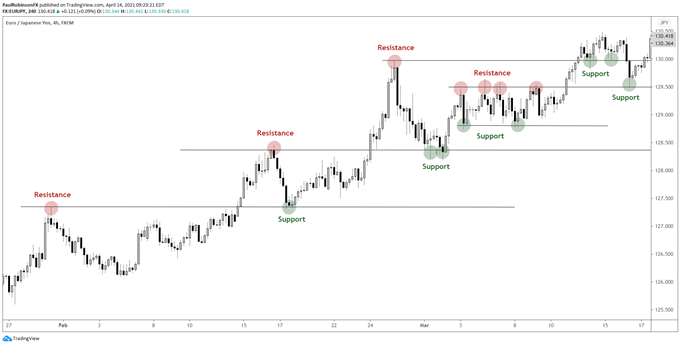
The next important aspect to price action trading are price levels – support and resistance. Support is simply a point where demand (buyers) are keeping price supported, while resistance is a form of supply (sellers), a point where the market has failed to continue moving higher. There are numerous ways to identify these levels such as Fibonacci levels and moving averages, but the focus here is primarily on actual price levels, trend-lines, and slopes.

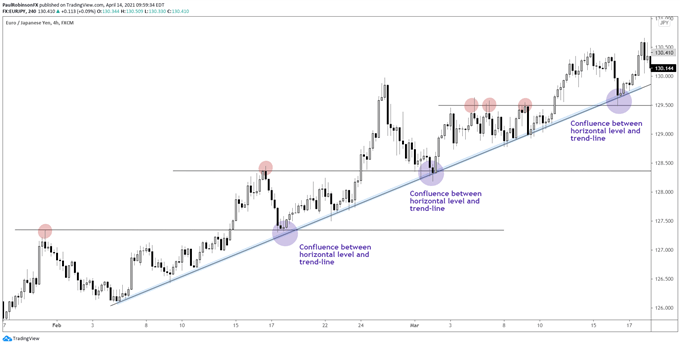
One important note – Confluence between varying angles of support and resistance makes for a stronger, more reliable level. For example, if you have a horizontal price level that intersects with a trend-line it makes for a stronger level.

Example of support and resistance

Example of confluence

Market Reaction (Validation, Invalidation)

The third aspect to price action trading to consider, is how the market reacts to price levels within the context of the trend. Is the market displaying behavior that confirms or invalidates what we are seeing on the chart? This is where the rubber meets the road and a trading decision can be made.

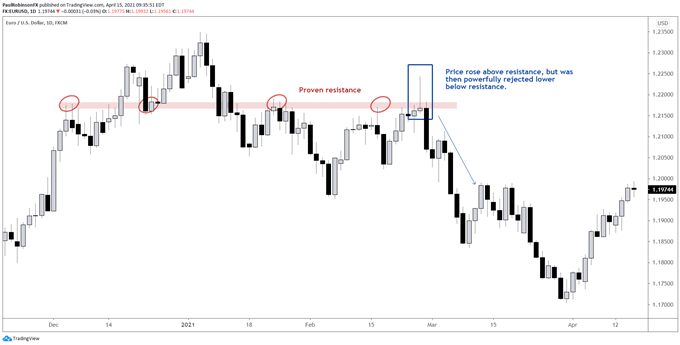
A good way to gauge price action is by using candlestick analysis. Candlestick types that demonstrate a clear reaction, or rejection, are reversal candles (aka ‘pin’ bars, ‘shooting stars’, ‘bullish hammers’) and other powerful candles such as ‘engulfing bars’.

These candlesticks show a rejection away from the support or resistance in question, a change in momentum that demonstrates the willingness by the market to participate at key levels.

Once a turn is in place from support or resistance, we can use the swing-low (for longs) and swing-high (for shorts) to determine stop placement. It’s best to place your stop beyond the level in question to avoid getting picked off by a small move above or below the identified levels. Targets should allow for ample reward relative to the risk taken (as a general rule of thumb a 1:2 risk/reward ratio or better). Targets, like stops, should also be based on your analysis and not a random figure determined by how much you wish to make.

Example of powerful reversal around resistance

Curious to learn how market positioning can affect asset prices? Our sentiment guide holds the insights—download it now!

Bitcoin Price Forecast: Can BTC’s $665 Billion Cap Propel the Next Halving Event?

Bitcoin Price Forecast: Can BTC’s $665 Billion Cap Propel the Next Halving Event?

Quick Fundamental Outlook

The global cryptocurrency market cap has slightly adjusted to stand at $1.3 trillion today, marking a decline of 1.30% within the last 24 hours. However, when zooming out to an annual perspective, the market exhibits a robust growth of 27.15%.

Furthermore, it’s worth noting the substantial market cap of Stablecoins, which stands at $124 Billion, securing a 9.52% chunk of the total cryptocurrency market cap.

Trading Derivatives carries a high level of risk to your capital and you should only trade with money you can afford to lose. Trading Derivatives may not be suitable for all investors, so please ensure that you fully understand the risks involved, and seek independent advice if necessary. A Product Disclosure Statement (PDS) can be obtained either from this website or on request from our offices and should be considered before entering into a transaction with us. Raw Spread accounts offer spreads from 0.0 pips with a commission charge of USD $3.50 per 100k traded. Standard account offer spreads from 1 pips with no additional commission charges. Spreads on CFD indices start at 0.4 points. The information on this site is not directed at residents in any country or jurisdiction where such distribution or use would be contrary to local law or regulation.


Global Cryptocurrency Market Cap Charts

Global Cryptocurrency Market Cap Charts

Bitcoin Market Cap

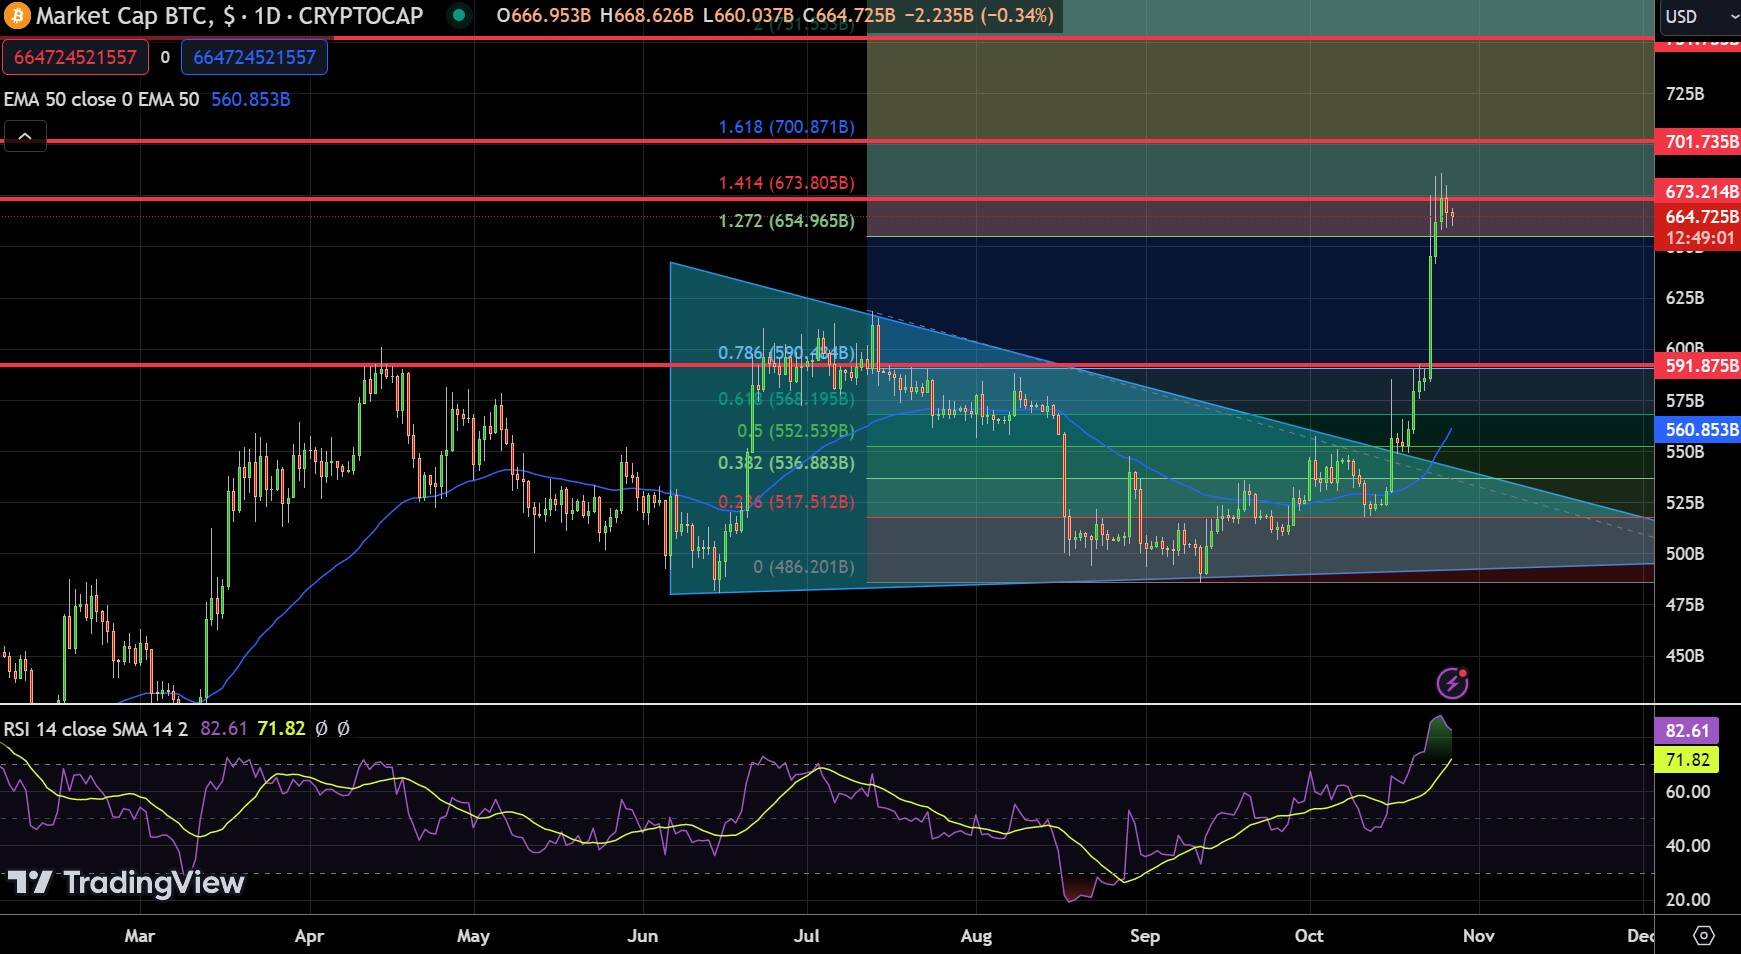
Bitcoin (BTC) currently encapsulates a market cap of $665 billion, cementing its dominance at 52.90% of the total crypto market. This dominance is a testament to Bitcoin’s continued significance and stature in the crypto realm.

This dominance is a testament to Bitcoin’s continued significance and stature in the crypto realm.

Bitcoin Market Cap

Bitcoin Market Cap Charts

This growing market capitalization, along with Bitcoin’s dominance, indicates the potential for further expansion and solidification of BTC’s position in the market, particularly if the anticipated ETF is approved.
Crypto Fear & Greed Index
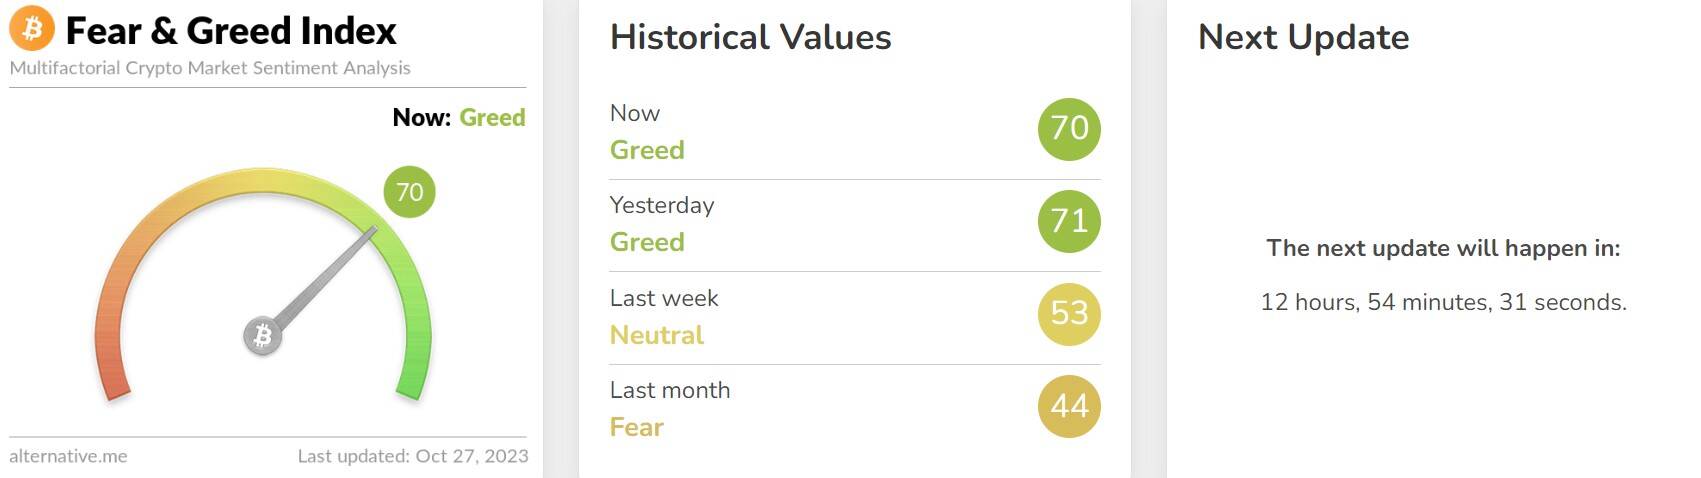
The emotional barometer of the crypto market, known as the Crypto Fear & Greed Index, currently reads a score of 70, indicating a “Greed” sentiment. This sentiment is slightly tempered by yesterday’s reading of 71. However, the market’s mood has seen fluctuations over time.
Crypto Fear & Greed Index - Source: alternative.me

Crypto Fear & Greed Index – Source: alternative.me

A week ago, the sentiment was more balanced, standing at a “Neutral” 53. Rewinding further to a month ago, the crypto environment was characterized by a cautious “Fear” sentiment with a score of 44.
Bitcoin Fundamental Outlook
In 2023, Bitcoin experienced a notable ascent, escalating over 110% from its January start at $16,677 to surpassing $35,000 within ten months. This growth is attributed to heightened market anticipation around the possible SEC endorsement of a Bitcoin ETF and the imminent halving event in April 2024.
This upcoming event will mark Bitcoin’s fourth halving, slashing the block reward from 6.25 to 3.125 BTC.
Given the asset’s historical trend, where its value has typically surged around prior halving events in 2012, 2016, and 2020, the market is optimistic about its trajectory leading up to and post the 2024 halving.

Bitcoin Price Prediction

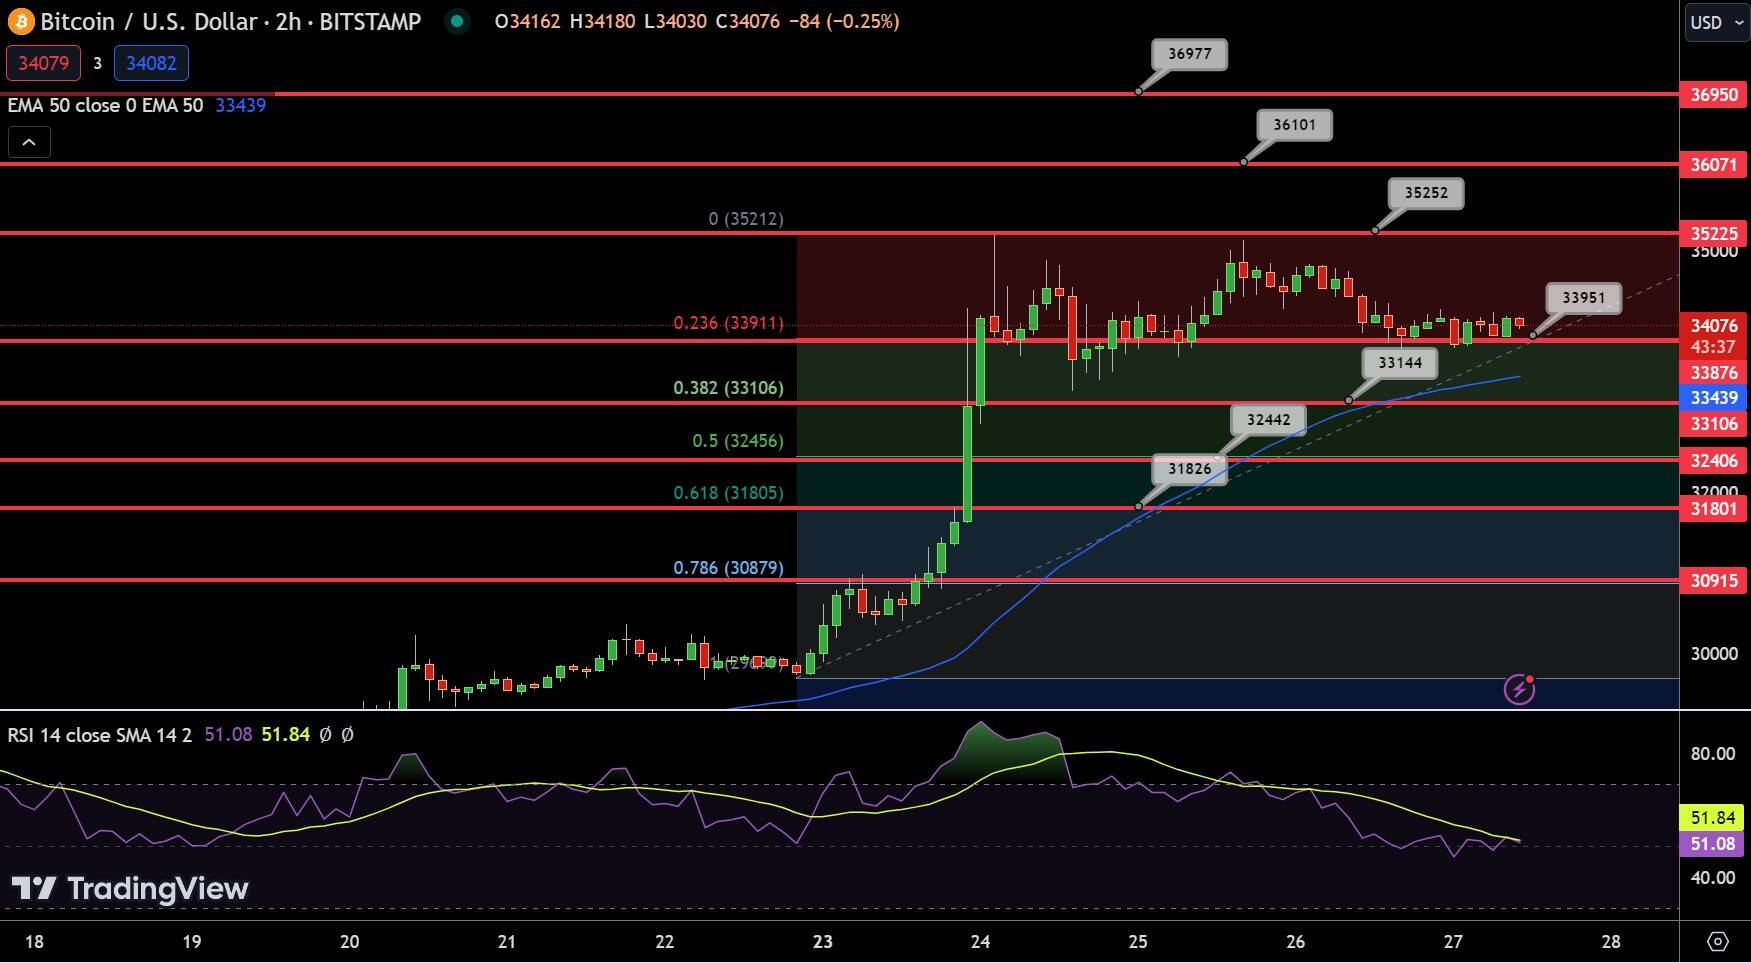
In today’s trading landscape, Bitcoin (BTC/USD) currently stands at $34,024.78, marking a 2.00% decrease over the past 24 hours. Despite this dip, it remains the leading asset on CoinMarketCap, with a robust market cap of $664.33 billion. The 4-hour chart reveals a pivotal point at $33,951, with immediate resistance anticipated at $35,225.

Should the bullish momentum continue, we could see further resistance at $36,101 and subsequently at $36,977. On the downside, support levels are earmarked at $33,144, followed by $32,442 and $31,826.

Technical indicators offer further insights. The Relative Strength Index (RSI) currently sits at 50, signalling a neutral sentiment. Meanwhile, the price slightly hovers above the 50-day Exponential Moving Average (EMA50) of $33,430, hinting at a possible short-term bullish trend.

Bitcoin Price Chart

Chart patterns, especially the series of Doji candles above the 23.6% Fibonacci retracement level, suggest indecision among traders. A deeper look suggests immediate support around the 38.2% Fibo mark of $33,100.In conclusion, the current trend for Bitcoin remains bullish as long as it trades above $33,850. Traders should remain vigilant for potential shifts in market dynamics.

US Personal Income and Spending Surge: Core PCE Holds Steady in September 2023

US Personal Income and Spending Surge: Core PCE Holds Steady in September 2023

Income and Spending Rise

In September 2023, personal income in the United States saw a healthy increase of $77.8 billion, marking a 0.3 percent monthly rise. This boost in income was mirrored by a $56.1 billion (0.3 percent) increase in disposable personal income (DPI). On the expenditure side, personal spending surged by $138.7 billion, equivalent to a 0.7 percent rise.

Price Indexes on the Move

The PCE price index showed a 0.4 percent increase in September, with goods and services experiencing varied changes. Goods prices rose by 0.2 percent, while services saw a steeper increase of 0.5 percent. Food prices were up by 0.3 percent, and energy prices exhibited a more substantial increase of 1.7 percent. Excluding food and energy, the Core PCE price index still increased by 0.3 percent.

Real PCE on the Upswing

Real DPI, which accounts for inflation, dipped by 0.1 percent in September. However, real PCE showed resilience, rising by 0.4 percent. This increase was driven by a 0.5 percent rise in spending on goods and a 0.3 percent increase in spending on services. Motor vehicles and parts, including both new and used vehicles, played a significant role in boosting goods spending. Among services, international travel expenditures saw a notable increase.

Personal Savings and Outlays

Personal outlays, including PCE, personal interest payments, and personal current transfer payments, increased by $175.1 billion in September. Meanwhile, personal saving reached $687.7 billion, with the personal saving rate—personal saving as a percentage of disposable personal income—standing at 3.4 percent.

Compared to the same month one year ago, the PCE price index for September showed a 3.4 percent increase. This was driven by a 0.9 percent rise in goods prices and a significant 4.7 percent increase in services prices. Food prices were up by 2.7 percent, while energy prices remained relatively stable. Excluding food and energy, the PCE price index increased by 3.7 percent year-on-year.

Updates and Revisions

It’s worth noting that estimates for July and August have been revised. Previous figures for personal income, DPI, and PCE have seen slight adjustments. These updates provide a clearer picture of the income and spending trends over recent months.

In summary, September 2023 brought about positive growth in personal income and spending, despite some fluctuations in price indexes. Real PCE showed strength, particularly in the goods sector. While the personal saving rate remained steady, the PCE price index displayed both monthly and yearly increases, with services contributing significantly to the rise. The revisions to July and August data underscore the importance of accurate economic assessments in understanding the nation’s financial health.

DAX Index: Corporate Earnings and US Inflation to Dictate DAX Trends on Friday

DAX Index: Corporate Earnings and US Inflation to Dictate DAX Trends on Friday

DAX Thursday Overview

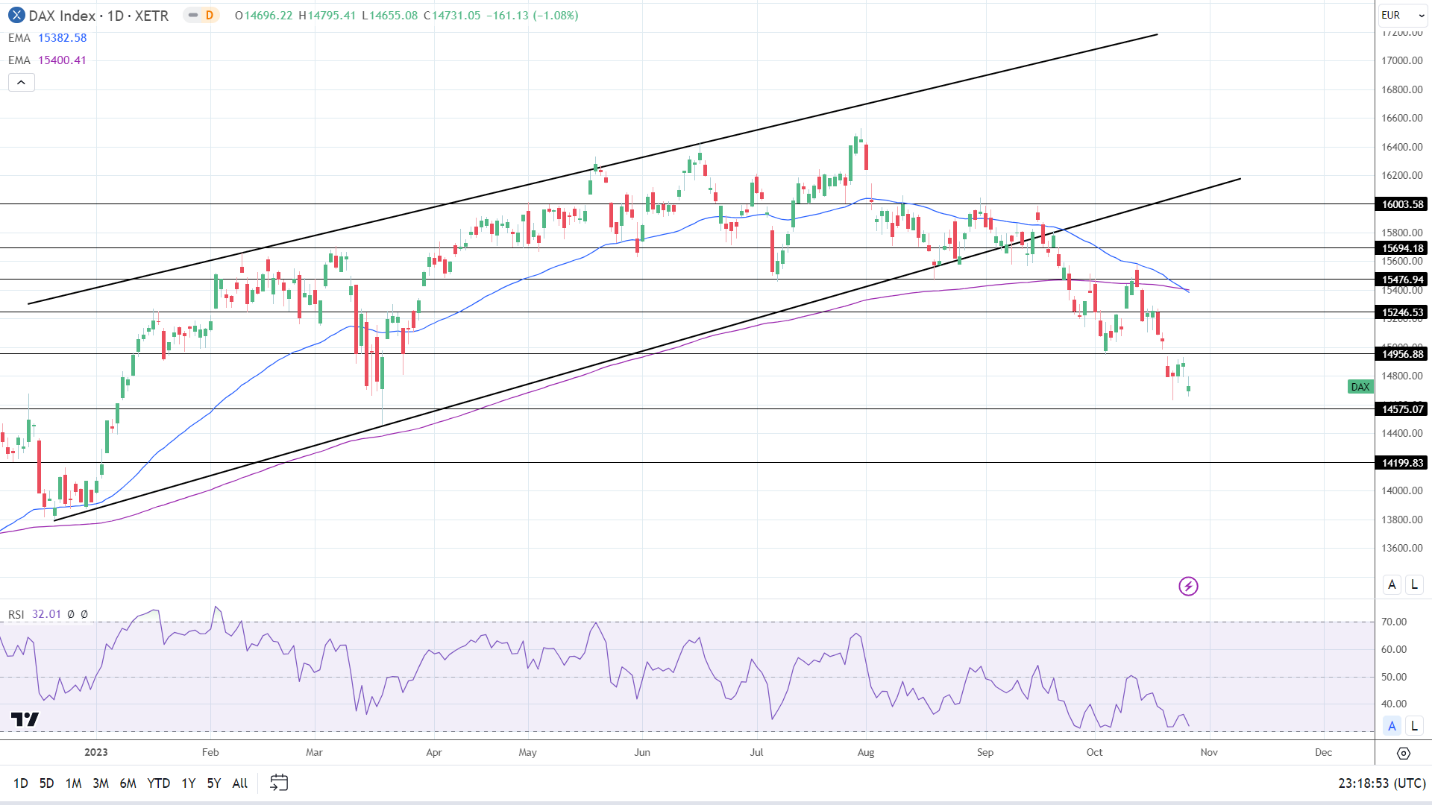
The DAX slid by 1.08% on Thursday. Reversing a 0.08% gain from Wednesday, the DAX ended the day at 14,731.

Corporate Earnings Overshadow ECB Hold

On Thursday, German corporate earnings dragged the DAX into negative territory. Mercedes Benz Group released earnings that fell short of forecasts. The luxury car manufacturing highlighted price competition in the EV space as a contributory factor. Things were no better for Volkswagen, which reported a 7% fall in year-to-date profits through September 2023.

Trading Derivatives carries a high level of risk to your capital and you should only trade with money you can afford to lose. Trading Derivatives may not be suitable for all investors, so please ensure that you fully understand the risks involved, and seek independent advice if necessary. A Product Disclosure Statement (PDS) can be obtained either from this website or on request from our offices and should be considered before entering into a transaction with us. Raw Spread accounts offer spreads from 0.0 pips with a commission charge of USD $3.50 per 100k traded. Standard account offer spreads from 1 pips with no additional commission charges. Spreads on CFD indices start at 0.4 points. The information on this site is not directed at residents in any country or jurisdiction where such distribution or use would be contrary to local law or regulation.

The earnings-induced losses were despite the ECB ending a ten-rate hike cycle by hitting the pause button. During the ECB press conference, ECB President Lagarde discussed a weak near-term outlook for growth but a strengthening economy in the medium term.

US corporate earnings also weighed on market risk sentiment. The tech sector remained under pressure after Alphabet’s (GOOGL) earnings. While Meta Platforms (META) beat earnings forecasts, a weaker outlook dragged tech stocks south.

However, US GDP numbers cushioned the blow. While the US economy had a stellar third quarter, softer inflation expectations and a downward trend in disposable income countered bets on a Fed rate hike. Treasury yields tumbled in response to bets on the Fed leaving rates unchanged. However, expectations of a higher-for-longer Fed rate path remained intact.

On Thursday, the Nasdaq Composite Index declined by 1.76%, with the S&P 500 and Dow falling by 1.18% and 0.76%.

The Thursday Market Movers

Mercedes Benz Group slid by 5.77%, sending the auto sector into negative territory. BMW and Porsche ended the session with losses of 3.01% and 1.13%, with Volkswagen down 0.82%. Continental and Daimler Truck Holding fell by 0.80% and 0.27%.

However, Siemens caused a stir, with news hitting the wires of Siemens Energy seeking state guarantees. Siemens Energy AG slumped 35.49%, with Siemens AG and Siemens Healthineers seeing losses of 4.54% and 3.60%.

Corporate Earnings Remain in the Spotlight

On Friday, industrial profit numbers from China will influence market risk sentiment. A less marked fall in industrial profits would support the improving sentiment toward the Chinese economy. Industrial profits declined by 9.0% (YTD) year-over-year in September (Aug: -11.7%). Economists forecast profits to fall by 9.0%.

Corporate earnings also need consideration. After the US closing bell, Amazon.com (AMZN) and Intel Corp. (INTC) beat profit forecasts.

The German Earnings Calendar will draw investor interest. MTU Aero will release results on Friday.

There are no economic indicators from Germany to influence market risk appetite. The lack of economic indicators will leave the US economic and earnings calendar in focus later in the session.

US Inflation in the Spotlight

On Friday, US personal spending, inflation, and personal income will draw investor interest. Hotter-than-expected US inflation and rising spending and income could fuel December Fed rate hike bets.

The US GDP report highlighted softer inflation and a downward trend in disposable income. Numbers that counter the GDP report would influence Fed rate hike expectations.

US corporate earnings also warrant consideration. Exxon Mobil Corp (XOM) and Chevron Corp. (CVX) are among the big names to release results on Friday.

The futures markets point to a positive start to the Friday session. The DAX and the Nasdaq mini were up 3 and 98 points, respectively. On Friday morning, 10-year US Treasury yields were up 0.27% to 4.860%.

Short-Term Forecast

US economic indicators will influence market sentiment toward monetary policy and the DAX on Friday. Higher-than-anticipated US inflation figures may have a greater impact than positive earnings, potentially leading to further losses for the DAX.

DAX Technical Indicators

Daily Chart

The DAX remained below the 50-day and 200-day EMAs, sending bearish price signals. Significantly, the 50-day EMA crossed through the 200-day EMA, signaling a near-term bullish-trend reversal.

A DAX break above the 14,957 resistance level would support a move to 15,000. Corporate earnings and US economic indicators will be focal points.

However, a fall through the 14,575 support level would bring the 14,200 support level into view. Hotter-than-expected US inflation numbers and weaker-than-forecasted earnings would impact risk sentiment.

The 14-day RSI reading of 32.01 shows DAX on the border of oversold territory.

DAX Daily Chart sends bearish price signals.
DAX 271023 Daily Chart

4-Hourly Chart

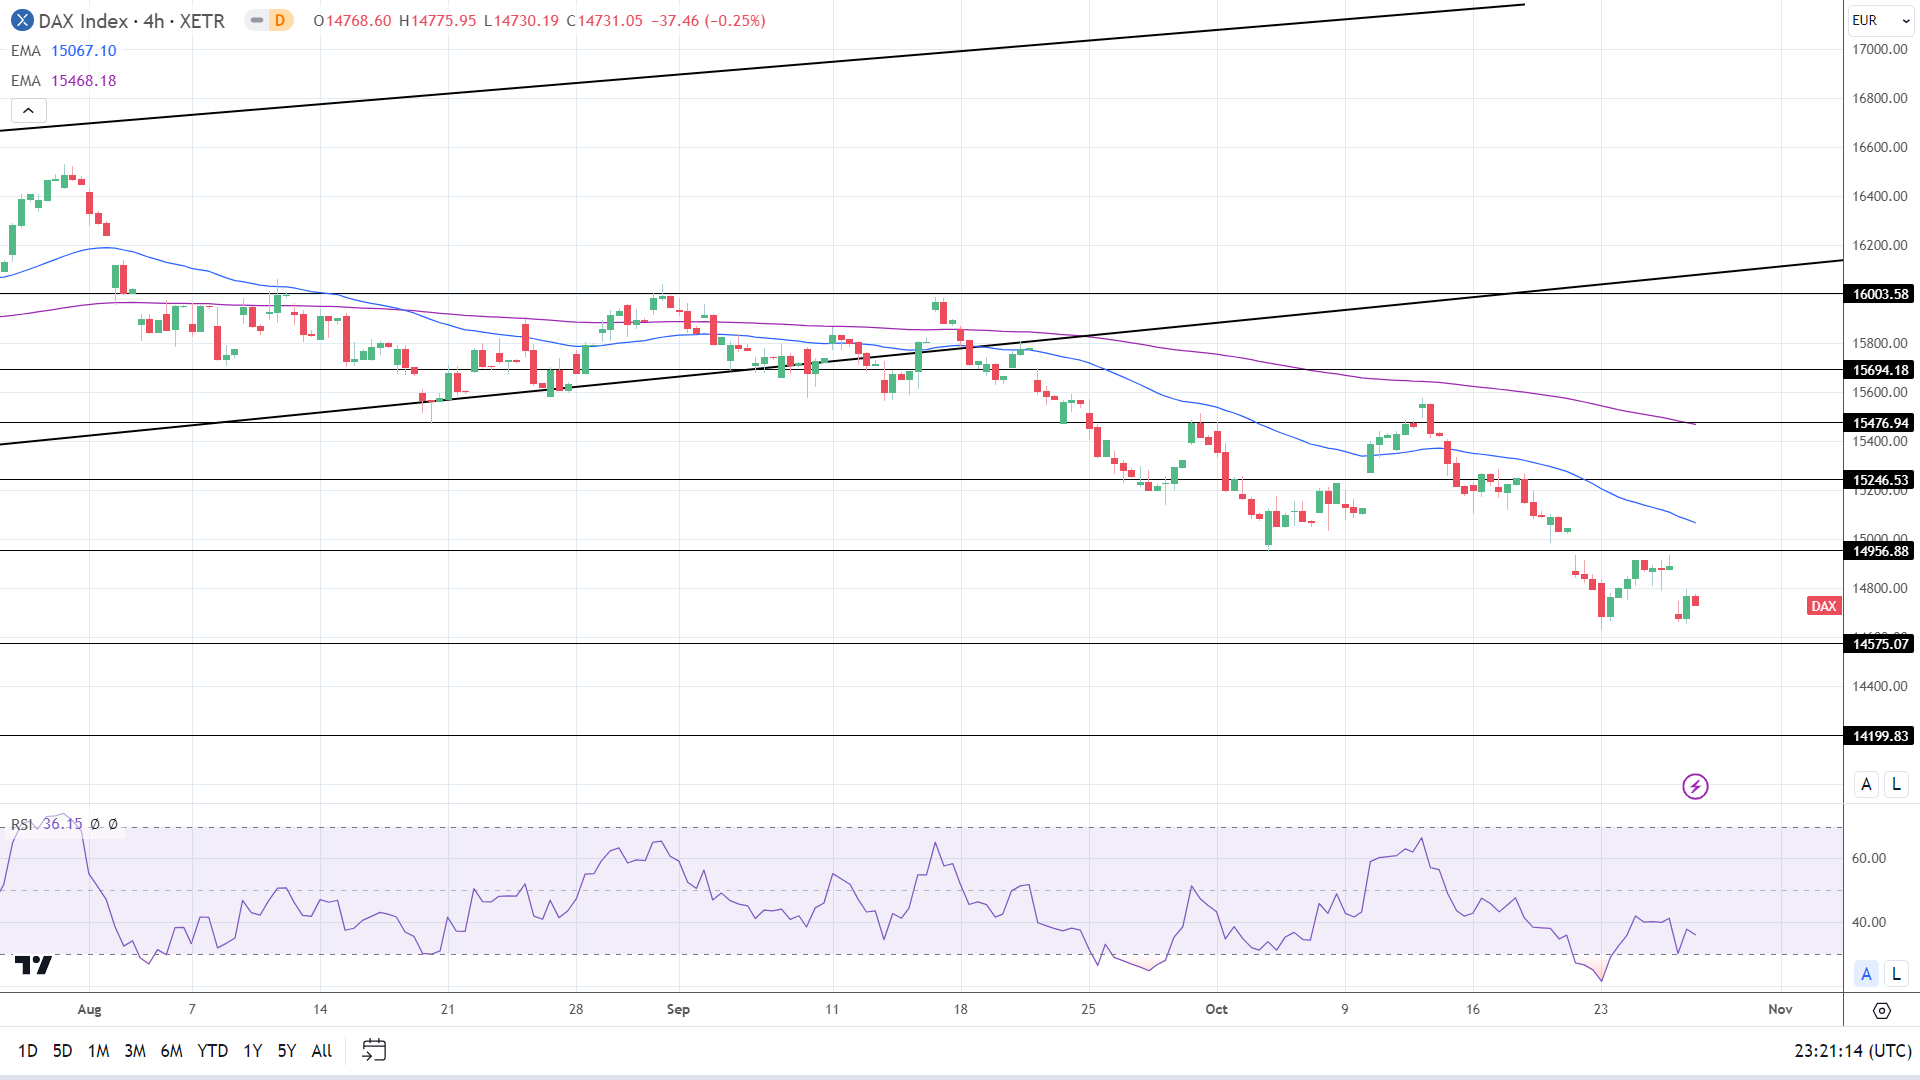
The DAX remains below the 50-day and 200-day EMAs, reaffirming bearish price signals. A DAX break above the 14,957 resistance level would bring the 50-day EMA into play.

However, a fall through the 14,575 support level would give the bears a run at the 14,200 support level.

The 36.15 14-4 hour RSI reading indicates a DAX fall to 14,500 before entering oversold territory.

4-Hourly Chart affirms bearish price signals.
DAX 271023 4-Hourly Chart
Crypto News: FLOKI Jumped 27% on New Staking Program While BTC Hit Pause

Crypto News: FLOKI Jumped 27% on New Staking Program While BTC Hit Pause

BTC-Spot ETFs Remain Tailwind Despite Thursday Pause

Following a flurry of activity in the BTC-spot ETF space, JPMorgan strategist Nicolas Panigirtzoglou discussed the likelihood of the SEC approving BTC-spot ETFs by a January 10 deadline, saying any rejection could lead to a wave of legal action against the SEC.

The comments follow the Grayscale win against the SEC on appeal and the recent slew of amendment BTC-spot ETF filings.

Trading Derivatives carries a high level of risk to your capital and you should only trade with money you can afford to lose. Trading Derivatives may not be suitable for all investors, so please ensure that you fully understand the risks involved, and seek independent advice if necessary. A Product Disclosure Statement (PDS) can be obtained either from this website or on request from our offices and should be considered before entering into a transaction with us. Raw Spread accounts offer spreads from 0.0 pips with a commission charge of USD $3.50 per 100k traded. Standard account offer spreads from 1 pips with no additional commission charges. Spreads on CFD indices start at 0.4 points. The information on this site is not directed at residents in any country or jurisdiction where such distribution or use would be contrary to local law or regulation.

Bloomberg Intelligence ETF Analyst James Seyffart responded to an SEC Chair Gary Gensler interview, saying,

“He said these exact numbers last week when interviewing with Kailey Leinz too. Someone should let him know that there are 11 filings. And if you include GBTC, that’s 12.”

On Wednesday, Gensler spoke at the Securities Enforcement Forum, targeting the crypto asset space, saying,

“As I’ve previously said, without prejudging any one asset, the vast majority of crypto assets likely meet the investment contract test, making them subject to the securities laws. Further, it follows that most crypto intermediaries—transacting in these crypto asset securities—are subject to the securities laws as well.”

While showcasing high-profile cases against individuals, including the former McDonald’s (MCD) CEO, Gensler added,

“And don’t even get me started on crypto. I won’t even name all the individuals we’ve charged in this highly noncompliant field.”

The SEC Chair spoke out despite the recent decision to drop the charges against Ripple CEO Brad Garlinghouse and co-founder Chris Larsen. Notably, the SEC is also battling a Coinbase motion to dismiss (MTD) that could raise questions about the SEC and crypto regulation.

While BTC and the broader crypto market took a breather, several cryptos enjoyed breakout Thursday sessions.

FLOKI Led the Crypto Top 100 Ahead of FLOKI Staking Launch

On Thursday, FLOKI (FLOKI) announced the launch of the FLOKI staking program, starting on October 27.

According to the announcement,

“To ensure a sustainable staking program, we will also be launching a sister token that Floki stakers will earn as rewards. This token is a utility token that targets an industry with trillion dollar potential, and the main way to earn it will be by staking FLOKI.”

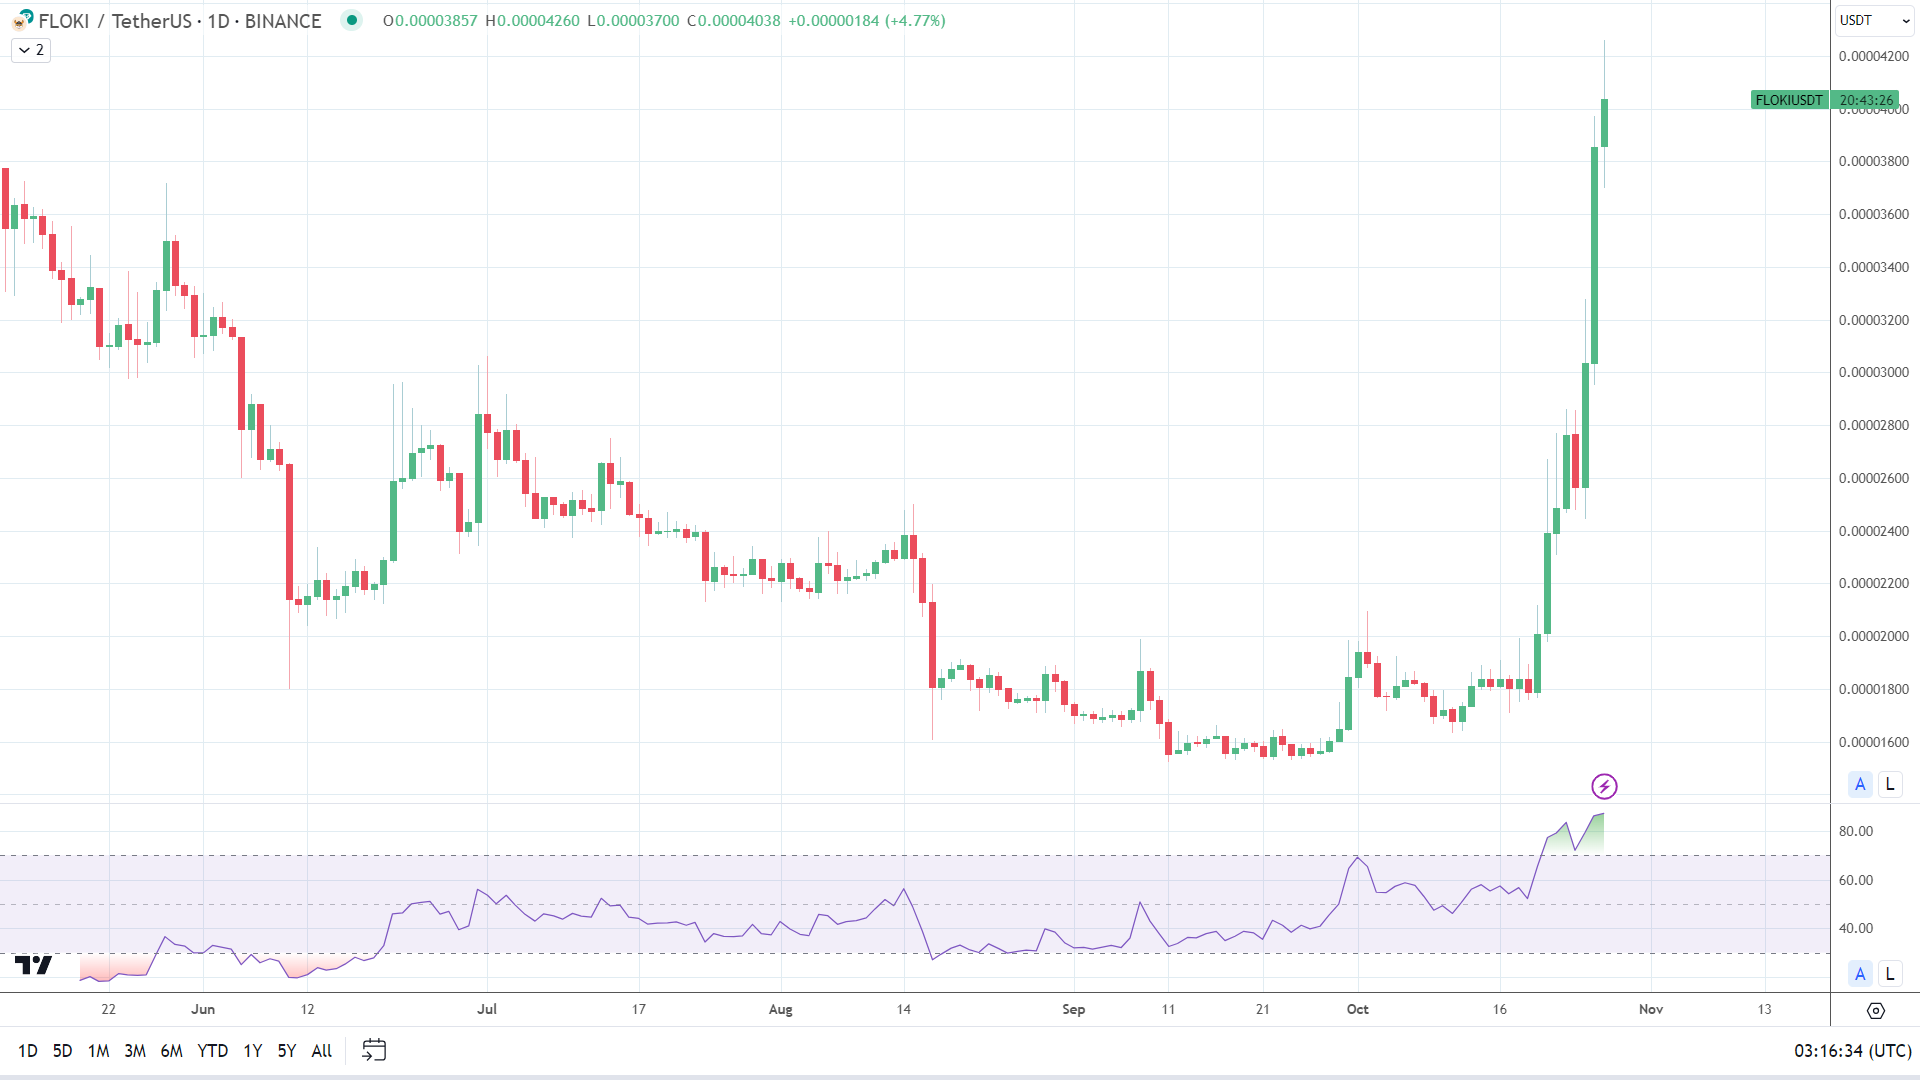
On Thursday, FLOKI surged 26.9% vs. a 1.03% loss for BTC.

FLOKIUSDT Daily Chart 271023
FLOKIUSDT 271023 Daily Chart

Technical Analysis

Bitcoin Analysis

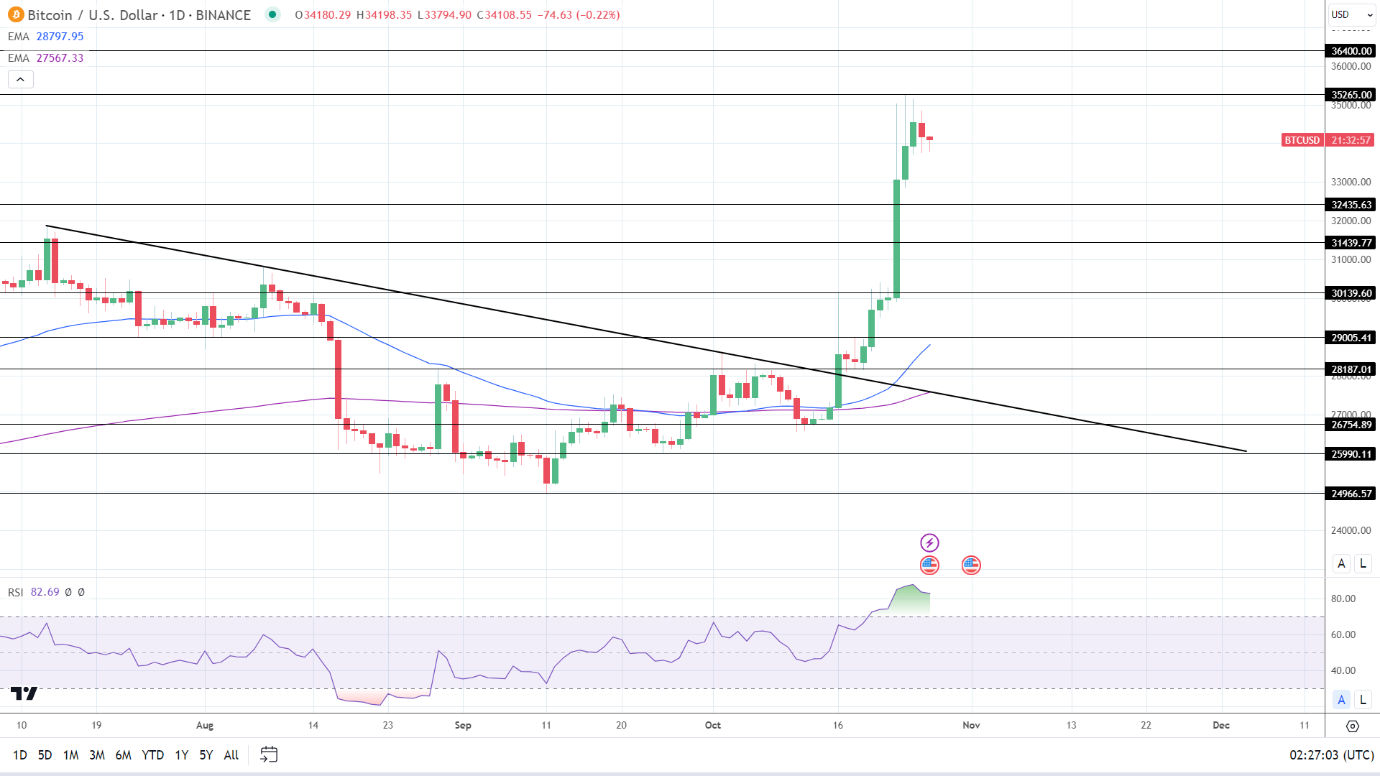
BTC remained above the 50-day and 200-day EMAs, sending bullish price signals.

A BTC break above the $35,265 resistance level would support a move to the $36,400 resistance level. Progress toward the SEC approving BTC-spot ETFs remains a tailwind. Reports of the SEC planning to reject any ETF applications would test buyer appetite.

A BTC fall through $33,500 would give the bears a run at the $32,436 support level.

The 14-Daily RSI reading of 82.89 shows BTC is in overbought territory.

BTC Daily Chart sends bullish price signals.
BTCUSD 271023 Daily Chart

Ethereum Analysis

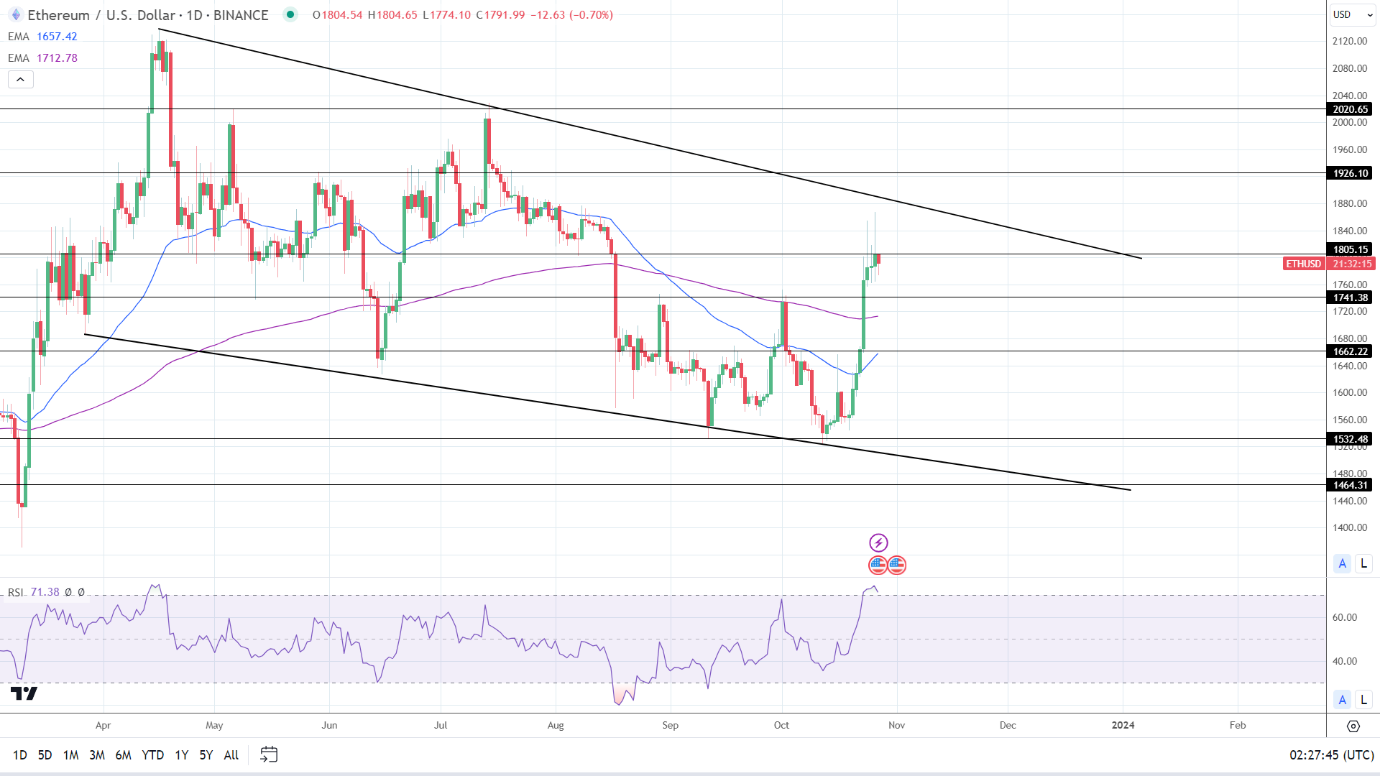
ETH held above the 50-day and 200-day EMAs, reaffirming bullish price signals. An ETH breakout from the $1,805 resistance level would support a move to the trend line.

US lawmaker scrutiny, ETH-spot ETF-related news, and ongoing SEC cases against Binance, Coinbase, and Ripple remain focal points.

However, an ETH fall through the $1,741 support level would bring the 200-day EMA into play.

ETH is in overbought territory with a 14-Daily RSI reading of 71.38.

ETH Daily Chart sends bullish price signals.
ETHUSD 271023 Daily Chart
Oil Prices Forecast: Prices Spike Following U.S. Strikes on Iranian Targets in Syria

Oil Prices Forecast: Prices Spike Following U.S. Strikes on Iranian Targets in Syria

Oil Prices Surge Amid Geopolitical Tensions in the Middle East

Oil prices witnessed a significant uptick on Friday following U.S. military action against Iranian targets in Syria. The move has exacerbated concerns about a potential escalation in the ongoing Israel-Hamas conflict, raising questions about the stability of oil supply from the Middle East.

Geopolitical Factors Affecting Supply

The U.S. strikes targeted facilities in eastern Syria used by Iran’s Islamic Revolutionary Guard Corps, in retaliation for recent attacks on U.S. troops in Iraq and Syria. While the strikes themselves didn’t directly affect oil supply, they heighten fears that the conflict between Israel and Hamas could broaden to involve major oil producers like Iran and Saudi Arabia.

Trading Derivatives carries a high level of risk to your capital and you should only trade with money you can afford to lose. Trading Derivatives may not be suitable for all investors, so please ensure that you fully understand the risks involved, and seek independent advice if necessary. A Product Disclosure Statement (PDS) can be obtained either from this website or on request from our offices and should be considered before entering into a transaction with us. Raw Spread accounts offer spreads from 0.0 pips with a commission charge of USD $3.50 per 100k traded. Standard account offer spreads from 1 pips with no additional commission charges. Spreads on CFD indices start at 0.4 points. The information on this site is not directed at residents in any country or jurisdiction where such distribution or use would be contrary to local law or regulation.

Market Reactions

Despite the geopolitical tensions, both Brent and WTI crude are set to register their first weekly decline in three weeks. The market has priced in some geopolitical risk, but so far, there has been no significant disruption to oil supply outside the immediate conflict zone.

Other Key Factors

Voluntary supply cuts from Saudi Arabia and Russia, expected to last through the end of the year, are also supporting oil prices. Goldman Sachs analysts maintain their Q1 2024 Brent crude price forecast at $95 a barrel but note that reduced Iranian exports could push baseline prices up by 5%.

Short-term Forecast

The short-term outlook for oil prices remains bullish, fueled by geopolitical tensions and voluntary supply cuts. However, the situation is fluid, and traders should exercise caution given the unpredictable nature of the geopolitical landscape. Significant disruption could occur, especially if the conflict expands to obstruct trade through the Strait of Hormuz, which handles 17% of global oil production.

Technical Analysis

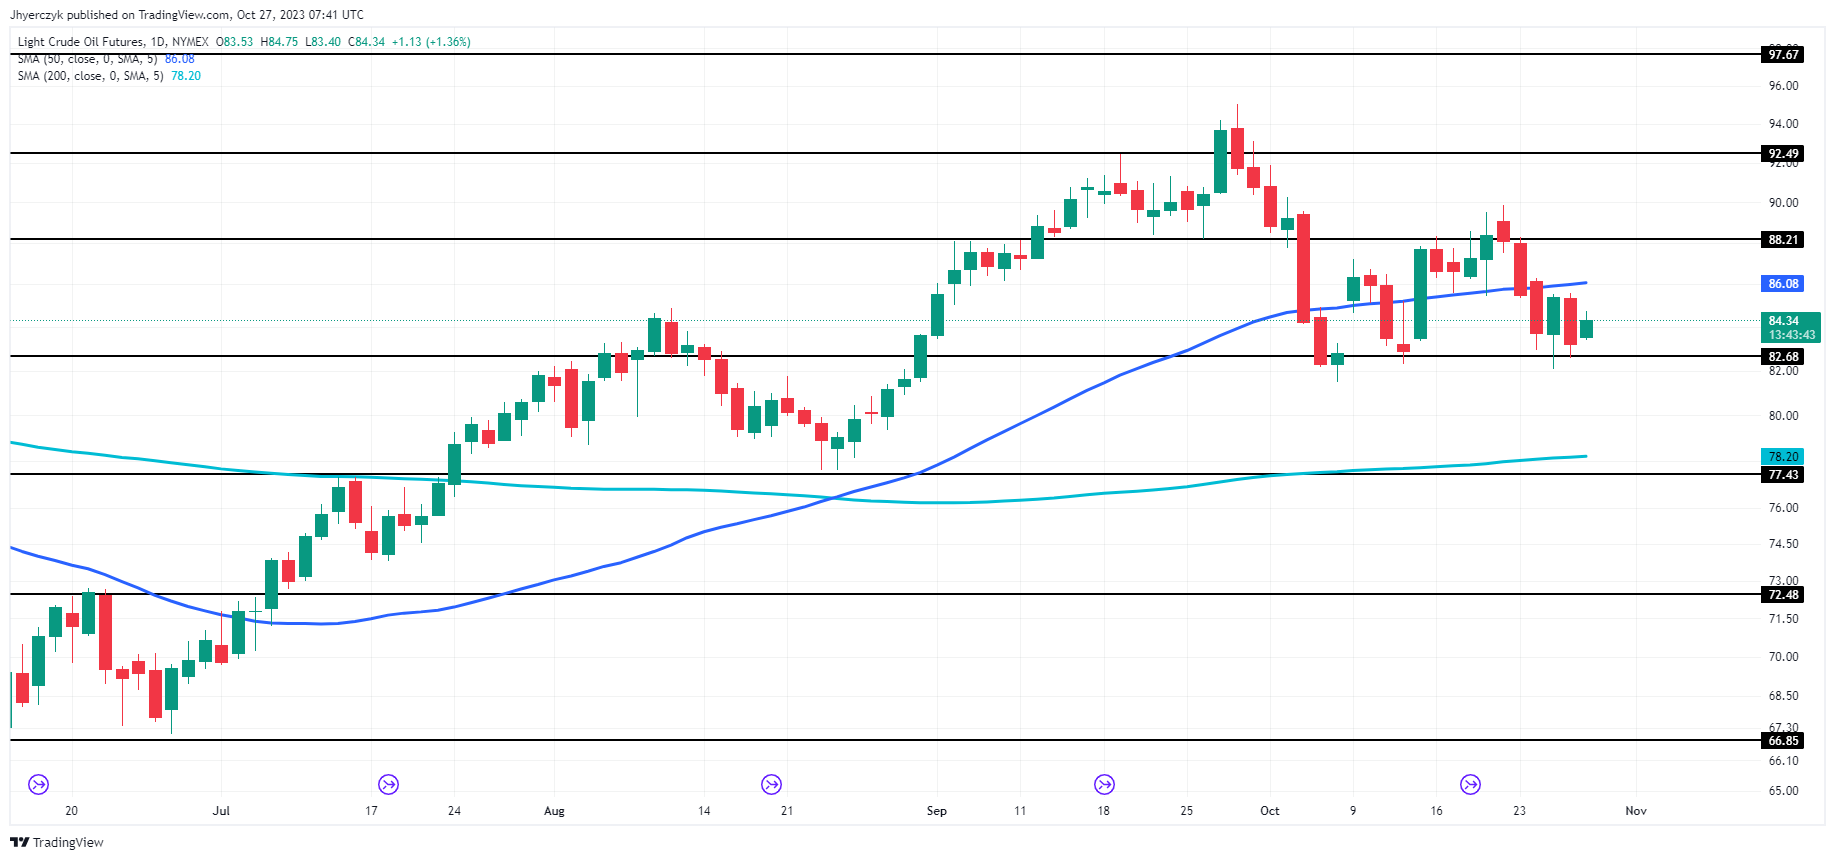
Daily Light Crude Oil FuturesThe current daily price of light crude oil futures stands at $84.27, which is above the 200-day moving average of $78.20, suggesting a bullish trend. However, it’s below the 50-day moving average of $86.08, signaling the need for caution.

The asset is trading near its minor resistance level of $86.21, while holding well above its main support at $77.43. These price dynamics position the asset in a cautiously optimistic light.

The market sentiment leans bullish, but breaking above the 50-day moving average and minor resistance could provide a more robust bullish confirmation.

Gold Prices Forecast: Steady Amid Middle East Unrest, US Economic Strength

Gold Prices Forecast: Steady Amid Middle East Unrest, US Economic Strength

Gold Prices Steady Amid Geopolitical Risks and U.S. Rate Concerns

Gold (XAU/USD) prices are navigating complex currents, balancing between geopolitical tensions in the Middle East and the U.S. monetary policy landscape. Despite prospects of higher U.S. interest rates, the yellow metal is holding steady, largely driven by geopolitical risks.

Geopolitical Factors

The ongoing conflict between Israel and Hamas has been a significant factor keeping investors tethered to gold. The asset has gained approximately 9% recently due to escalating tensions in the Middle East. However, U.S. airstrikes on facilities linked to Iranian-backed militias in Syria have had a limited impact on gold prices, underlining the metal’s resilience amid geopolitical uncertainties.

Trading Derivatives carries a high level of risk to your capital and you should only trade with money you can afford to lose. Trading Derivatives may not be suitable for all investors, so please ensure that you fully understand the risks involved, and seek independent advice if necessary. A Product Disclosure Statement (PDS) can be obtained either from this website or on request from our offices and should be considered before entering into a transaction with us. Raw Spread accounts offer spreads from 0.0 pips with a commission charge of USD $3.50 per 100k traded. Standard account offer spreads from 1 pips with no additional commission charges. Spreads on CFD indices start at 0.4 points. The information on this site is not directed at residents in any country or jurisdiction where such distribution or use would be contrary to local law or regulation.

U.S. Monetary Policy and Economic Indicators

While gold remains a preferred safe haven, it’s under pressure from the U.S. economic outlook, which shows signs of strength. The U.S. economy grew at its fastest pace in nearly two years in the third quarter, quelling recession fears and nudging the Federal Reserve toward potential rate hikes—usually a bearish indicator for gold. Additionally, upcoming data on the U.S. Personal Consumption Expenditure (PCE) price index could provide further cues on the Fed’s next moves.

Currency Dynamics

The U.S. dollar’s slight gain has made gold more expensive for overseas buyers, but this has not significantly curtailed demand. Meanwhile, in Europe, the ECB’s decision to leave interest rates unchanged has broken a streak of 10 consecutive hikes, adding another layer of complexity to gold’s price dynamics.

Short-term Forecast

In the short term, gold prices are likely to remain resilient, buoyed by geopolitical uncertainties, even as they face headwinds from a strengthening U.S. economy and a potentially hawkish Fed stance. The market sentiment leans cautiously bullish, with investors closely watching for any sudden geopolitical escalations or economic indicators that could tip the balance.

Technical Analysis

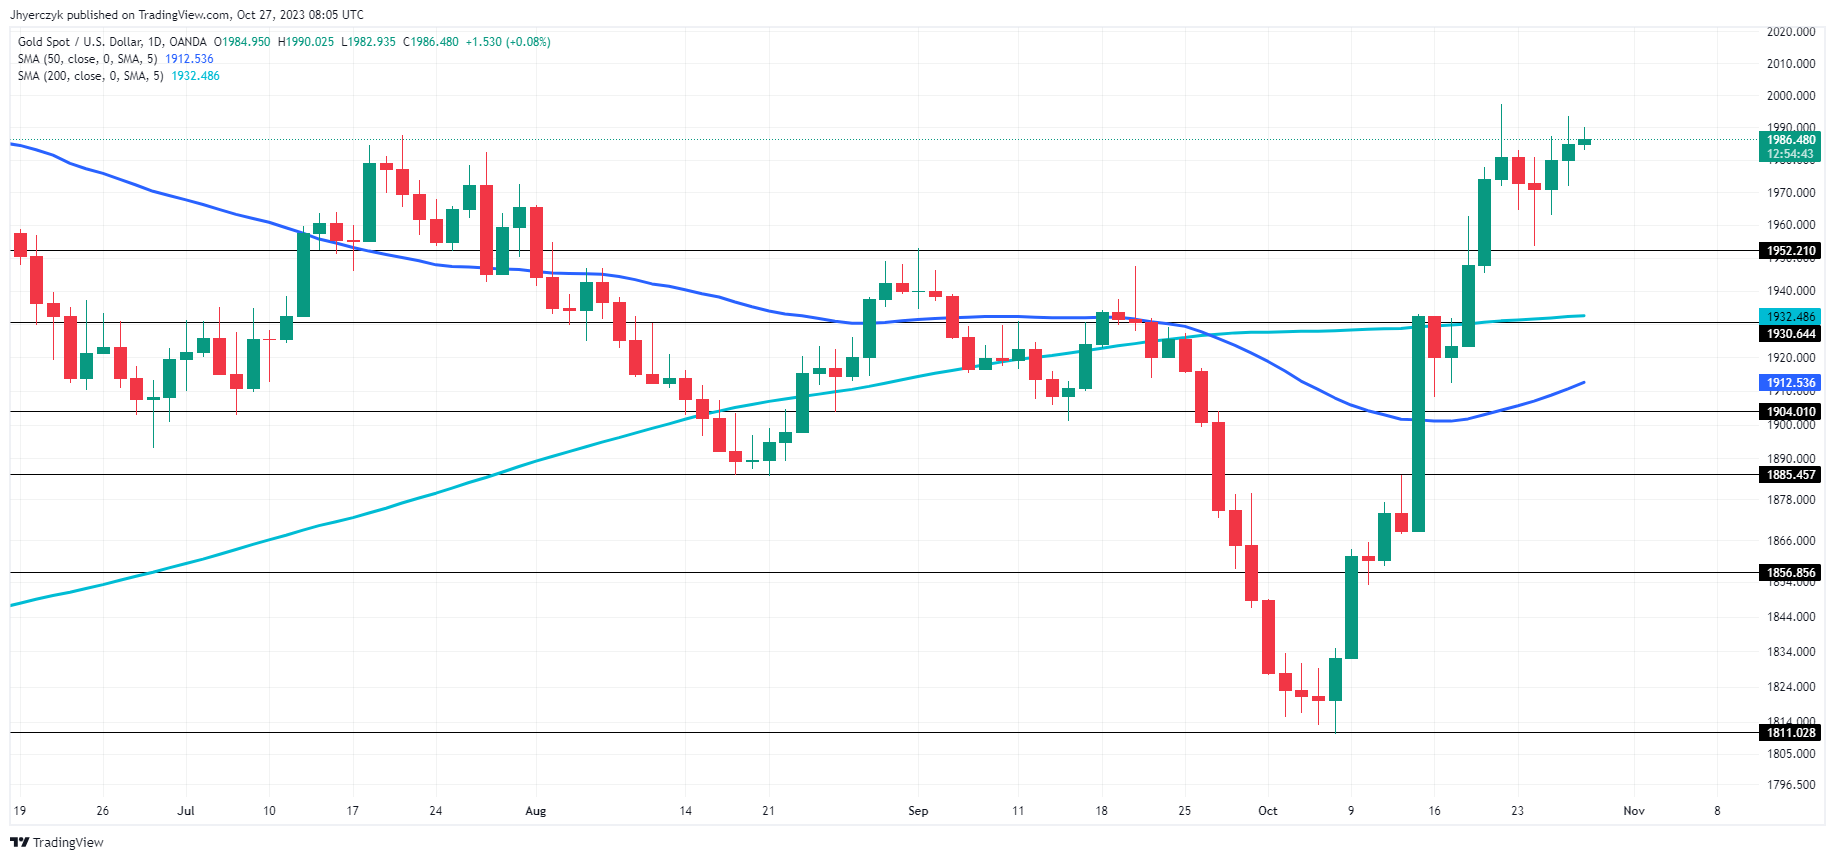
Daily Gold (XAU/USD)The current daily price of gold (XAU/USD) is $1986.72, which is above both the 200-day and 50-day moving averages, standing at $1932.487 and $1912.539 respectively. This generally suggests a bullish market sentiment.

The asset is trading well above its main support level of $1930.64 and also surpasses the minor support at $1952.21.

Silver Prices Forecast: XAG/USD Firm Amid US Rate Hike Fears, Middle East Unrest

Silver Prices Forecast: XAG/USD Firm Amid US Rate Hike Fears, Middle East Unrest

Silver Prices Defy U.S. Rate Hike Concerns Amid Middle East Tensions

Silver (XAU/USD) prices are on track for a third straight weekly gain, defying concerns over potential U.S. interest rate hikes. The metal’s resilience highlights its role as a safe haven, particularly as geopolitical tensions escalate in the Middle East.

Geopolitical Impact on Silver

Despite recent U.S. airstrikes in Syria targeting facilities linked to Iranian-backed militias, silver prices remain largely unaffected. The ongoing Israel-Hamas conflict has significantly bolstered demand for the metal. Spot silver has surged about 11%, as investors seek to hedge against geopolitical risks.

Trading Derivatives carries a high level of risk to your capital and you should only trade with money you can afford to lose. Trading Derivatives may not be suitable for all investors, so please ensure that you fully understand the risks involved, and seek independent advice if necessary. A Product Disclosure Statement (PDS) can be obtained either from this website or on request from our offices and should be considered before entering into a transaction with us. Raw Spread accounts offer spreads from 0.0 pips with a commission charge of USD $3.50 per 100k traded. Standard account offer spreads from 1 pips with no additional commission charges. Spreads on CFD indices start at 0.4 points. The information on this site is not directed at residents in any country or jurisdiction where such distribution or use would be contrary to local law or regulation.

U.S. Economic Indicators and Monetary Policy

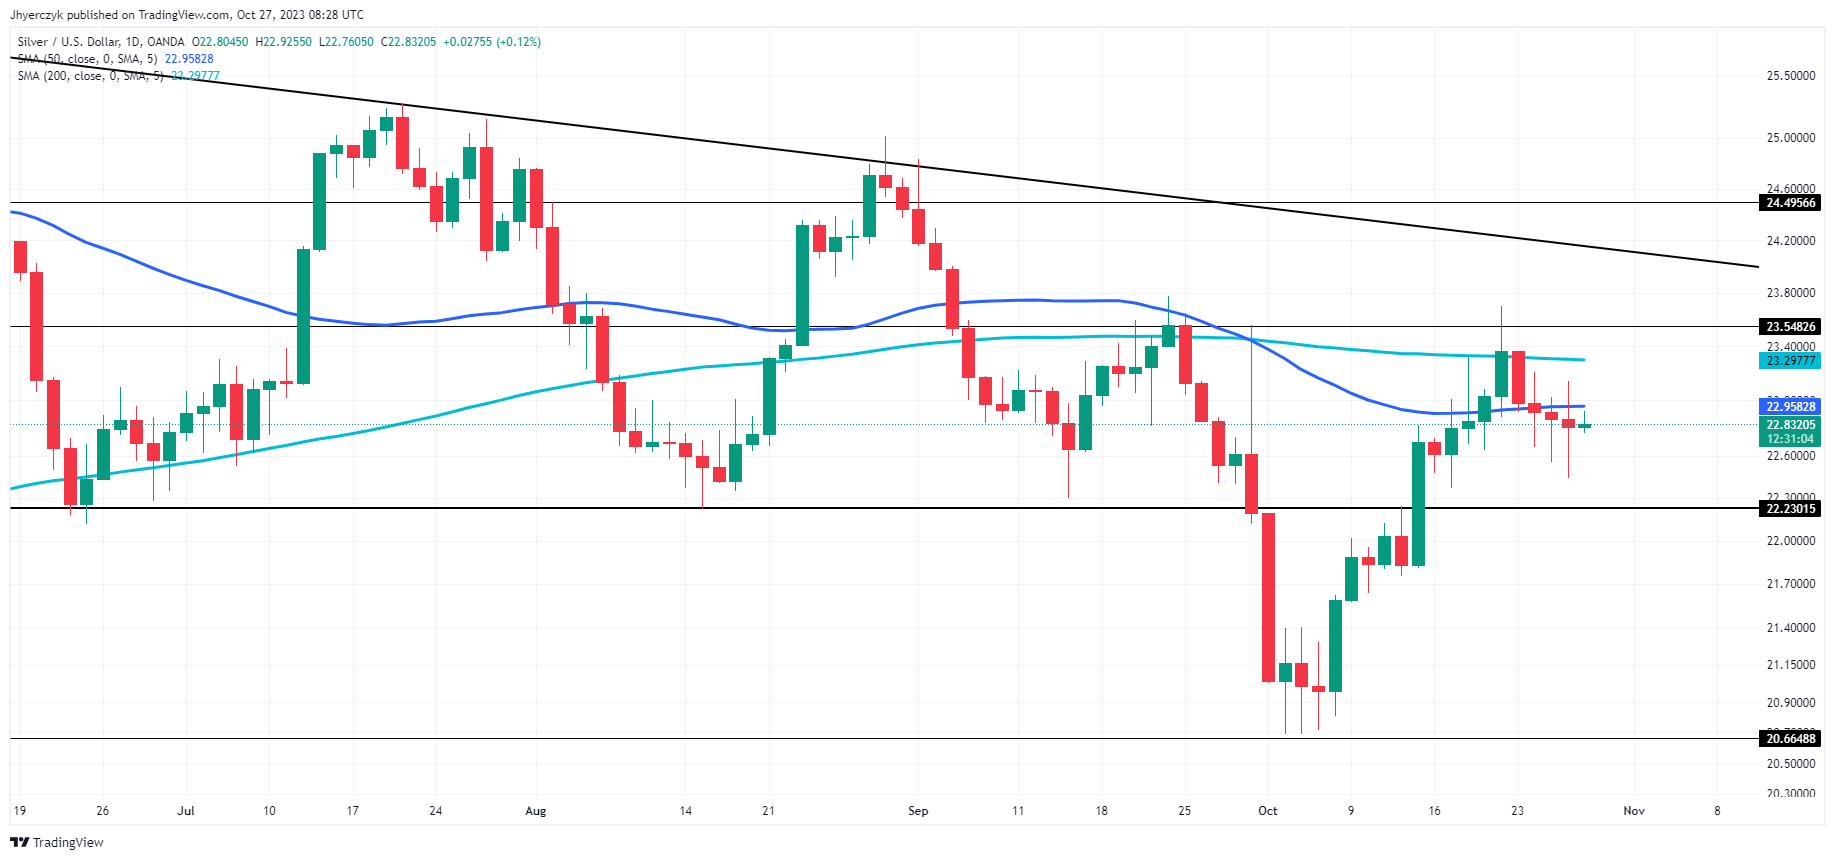
The U.S. economy is showing signs of robust health, growing at its fastest pace in nearly two years in Q3. While strong economic data typically pressure safe-haven assets, silver has maintained its upward trajectory. However, the looming prospect of U.S. interest rate hikes has capped gains below the $24.00 mark. Investors are keenly awaiting the U.S. Personal Consumption Expenditure (PCE) price index for further clues on the Federal Reserve’s policy direction.

Currency Dynamics

The U.S. dollar’s modest weekly gain has made silver slightly more expensive for overseas buyers. In Europe, the European Central Bank’s decision to keep interest rates unchanged adds another layer to the metal’s pricing dynamics.

Short-term Forecast

The short-term outlook for silver appears cautiously bullish. While higher U.S. interest rates could act as a headwind, prevailing geopolitical tensions are likely to sustain demand for the metal. As a result, silver is expected to hold steady, especially if geopolitical risks continue to escalate.

Technical Analysis

Daily Silver XAG/USD 

Hang Seng Index, ASX 200, Nikkei 225: Futures Flash Red after Overnight US Losses

Hang Seng Index, ASX 200, Nikkei 225: Futures Flash Red after Overnight US Losses

Overview of the Thursday Session

On Thursday, the Nikkei led the Hang Seng Index and ASX 200 into negative territory.

US corporate earnings and 10-year US Treasury yields negatively impacted the Thursday session. Alphabet (GOOGL) earnings disappointed, resonating during the Wednesday US session. On Wednesday, the US equity markets reacted to the Alphabet results, with the Nasdaq Composite Index sliding by 2.43%. The Dow and the S&P 500 saw losses of 0.32% and 1.43%.

Trading Derivatives carries a high level of risk to your capital and you should only trade with money you can afford to lose. Trading Derivatives may not be suitable for all investors, so please ensure that you fully understand the risks involved, and seek independent advice if necessary. A Product Disclosure Statement (PDS) can be obtained either from this website or on request from our offices and should be considered before entering into a transaction with us. Raw Spread accounts offer spreads from 0.0 pips with a commission charge of USD $3.50 per 100k traded. Standard account offer spreads from 1 pips with no additional commission charges. Spreads on CFD indices start at 0.4 points. The information on this site is not directed at residents in any country or jurisdiction where such distribution or use would be contrary to local law or regulation.

10-year US Treasury yields surged by 2.74%, ending the Wednesday session at 4.957%. Rising yields added to the risk-off mood through the Thursday Asian session.

On Thursday, there were no economic indicators from the Asian region to influence market risk sentiment. The lack of stats left US corporate earnings and US equity market moves from Wednesday to impact risk appetite.

US GDP Numbers Test Fed Rate Hike Bets

US economic indicators from Thursday and US corporate earnings will influence the Friday Asian market session. The US economy had a breakout in Q3. However, the GDP report highlighted weaker-than-expected disposable income and inflation. The numbers suggested the Fed may be near the end of its monetary policy tightening cycle.

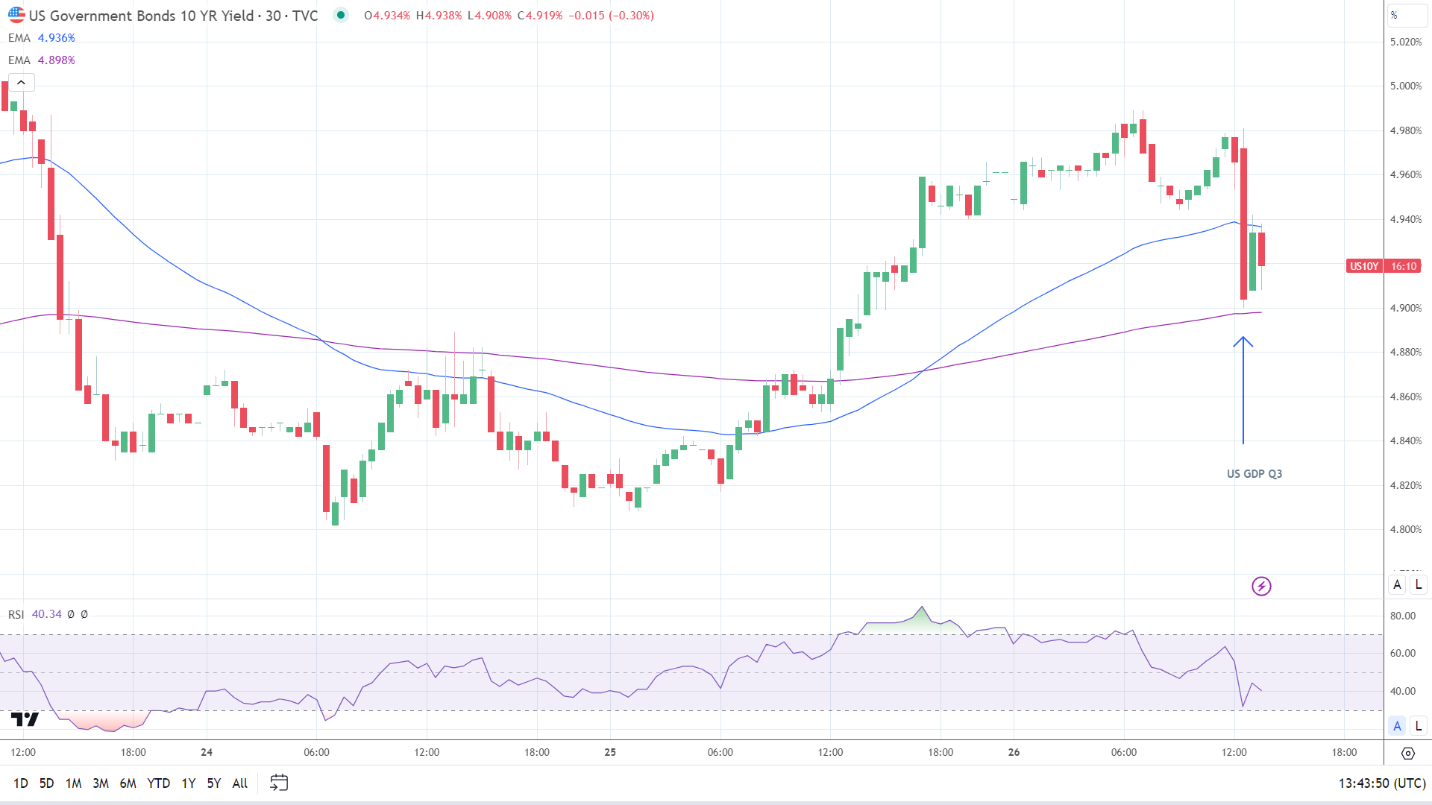
10-year US Treasury yields tumbled by 2.14% to end the Thursday session at 4.851%. Yields slumped in response to the GDP report.

Treasury yields slide in response to US GDP Report.
10-Year US Treasury Yields – 271023However, the US equity markets ended the Thursday session in negative territory. The resilience of the US economy could allow the Fed to keep interest rates higher for longer. US corporate earnings also impacted risk sentiment.

Meta Platforms (META) beat earnings estimates but forecast a weaker outlook. META ended the Thursday session down 3.73%. However, Amazon.com (AMZN) beat revenue forecasts, gaining 0.72% during after-hours trading.

On Thursday, the US equity markets reacted to the US GDP Report and corporate earnings. The Nasdaq Composite Index fell by 1.76%, with the Dow and S&P 500 declining by 0.76% and 1.17%.

The US session will influence the Asian markets on Friday. However, the Asian economic calendar also warrants consideration.

Industrial profits from China, inflation numbers from Japan, and producer prices from Australia will be in focus. Investors will also be mindful of US inflation numbers during the Friday US session. Stickier-than-expected figures could fuel bets on a December Fed rate hike.

In the Futures Markets, the ASX 200 and the Nikkei 225 were down 3 and 40 points, respectively.

ASX 200

ASX 200 struggled on Thursday.
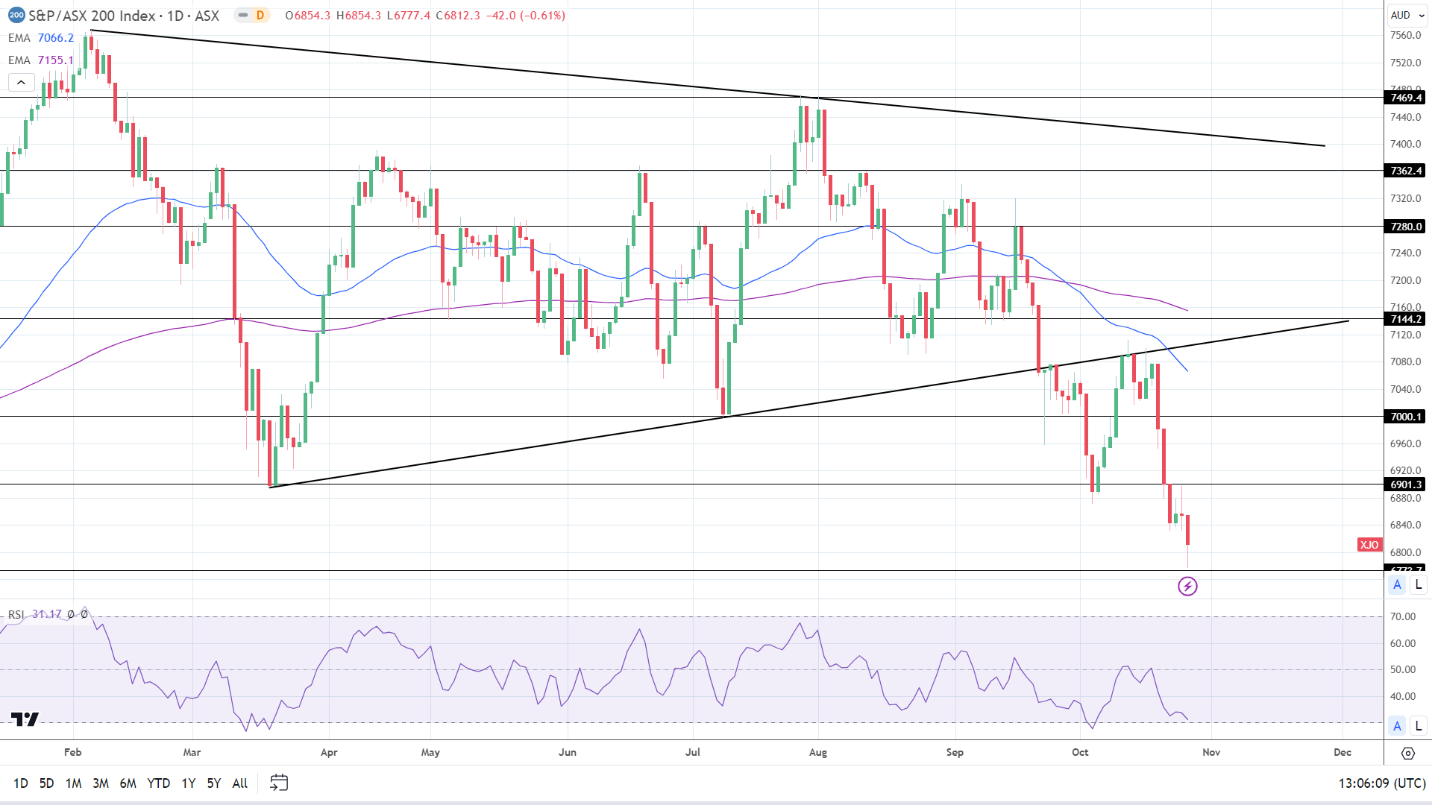
ASX200 271023 Daily ChartThe ASX 200 declined by 0.61% on Thursday. The S&P/ASX All Technology Index (XTX) tumbled by 2.47% as investors reacted to the rise in yields and Alphabet’s earnings. On Thursday, the big four banks ended the day in negative territory on hawkish RBA policy bets. However, mining stocks cushioned the downside.

Westpac Banking Corp (WBC) slid by 1.11%, with the National Australia Bank (NAB) declining 0.42%. ANZ Group (ANZ) and the Commonwealth Bank of Australia (CBA) fell by 0.24% and 0.36%.

However, Fortescue Metals Group (FMG) gained 0.86%. Rio Tinto (RIO) and BHP Group Ltd (BHP) rose by 1.20% and 0.47%. Newcrest Mining (NCM) declined by 1.27%.

Woodside Energy Group (WDS) and Santos Ltd (STO) saw gains of 0.03% and 0.26%.

Hang Seng Index

Hang Seng Index saw red on Thursday.
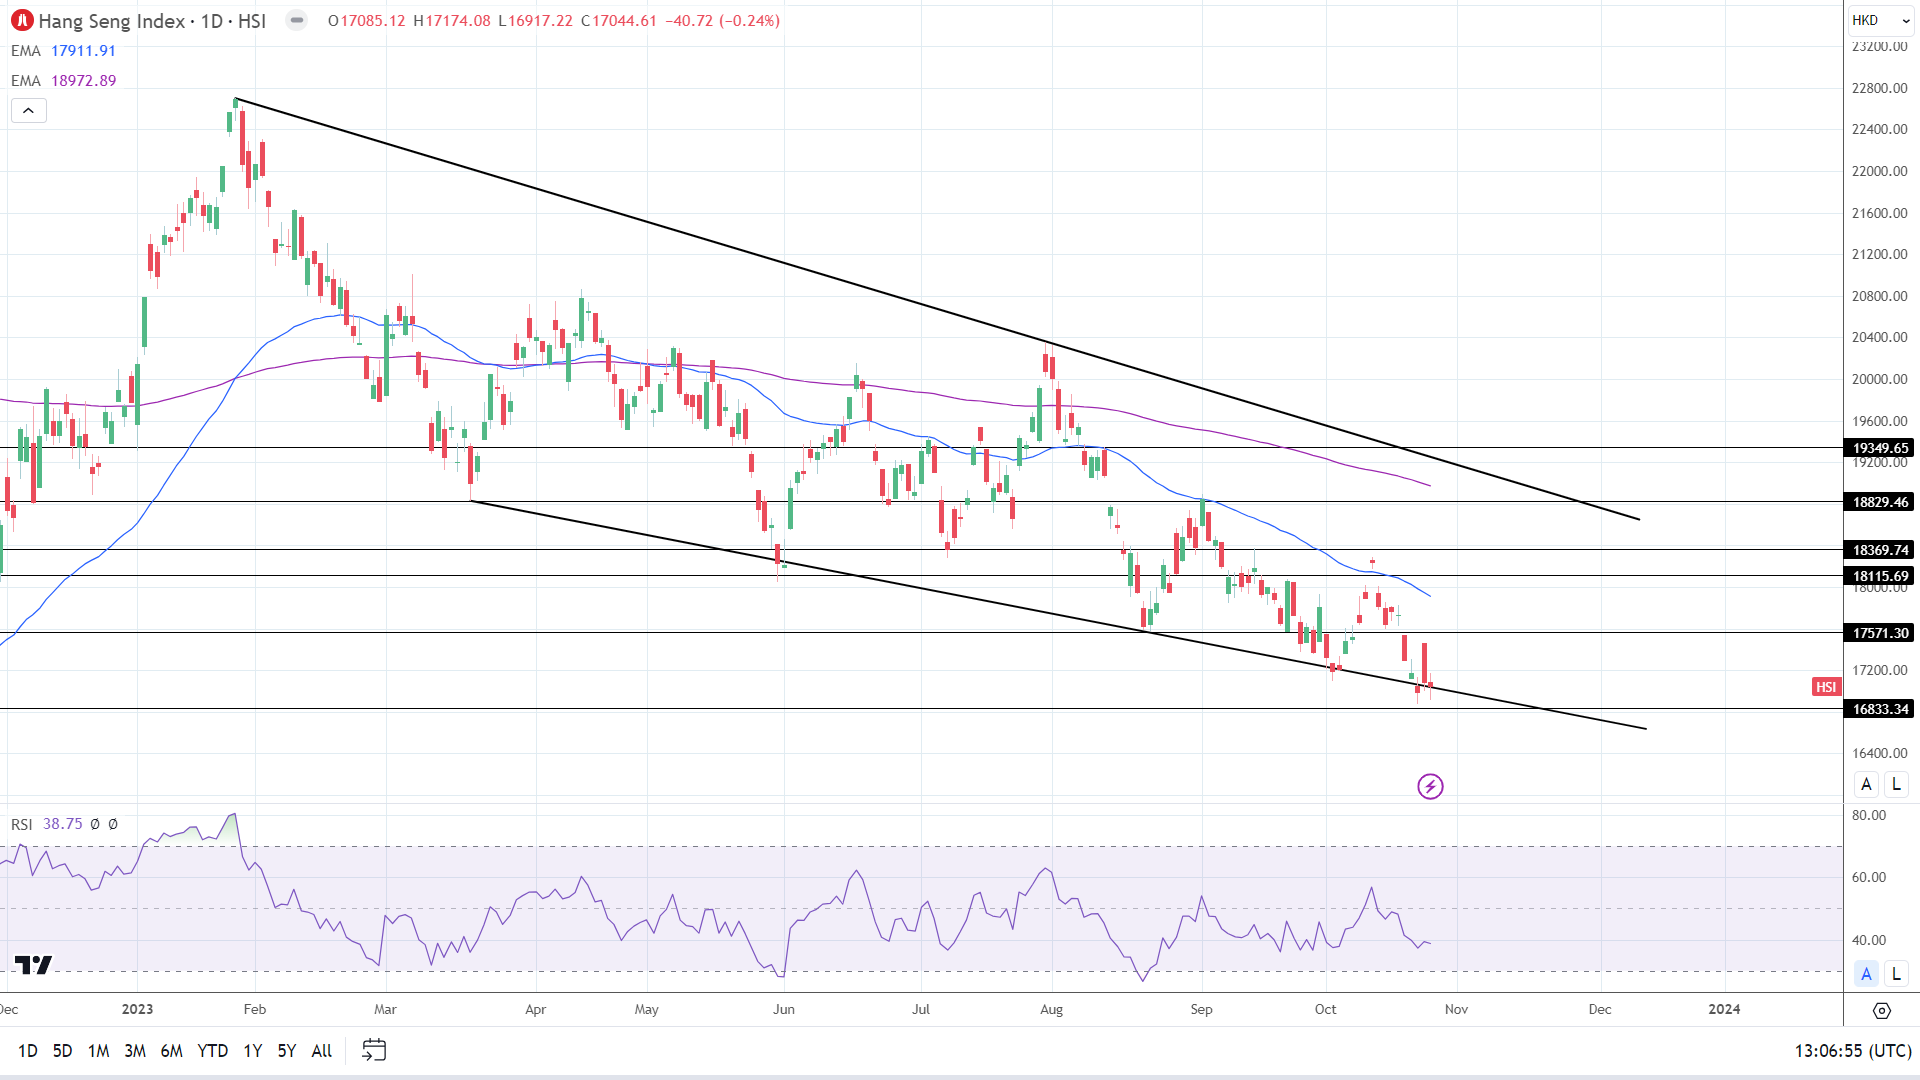
HSI 271023 Daily ChartThe Hang Seng Index fell by 0.24% on Thursday.

Alibaba Group Holding Ltd (HK:9988) rose by 0.57%, while Tencent Holdings Ltd (HK:0700) fell by 0.07%.

Bank stocks also had a mixed session. HSBC Holdings PLC (HK:0005) slid by 2.31%. However, China Construction Bank (HK:0939) and Industrial and Commercial Bank of China (HK:1398) saw gains of 1.12% and 0.80%.

Nikkei 225

Nikkei tumbled on Thursday.
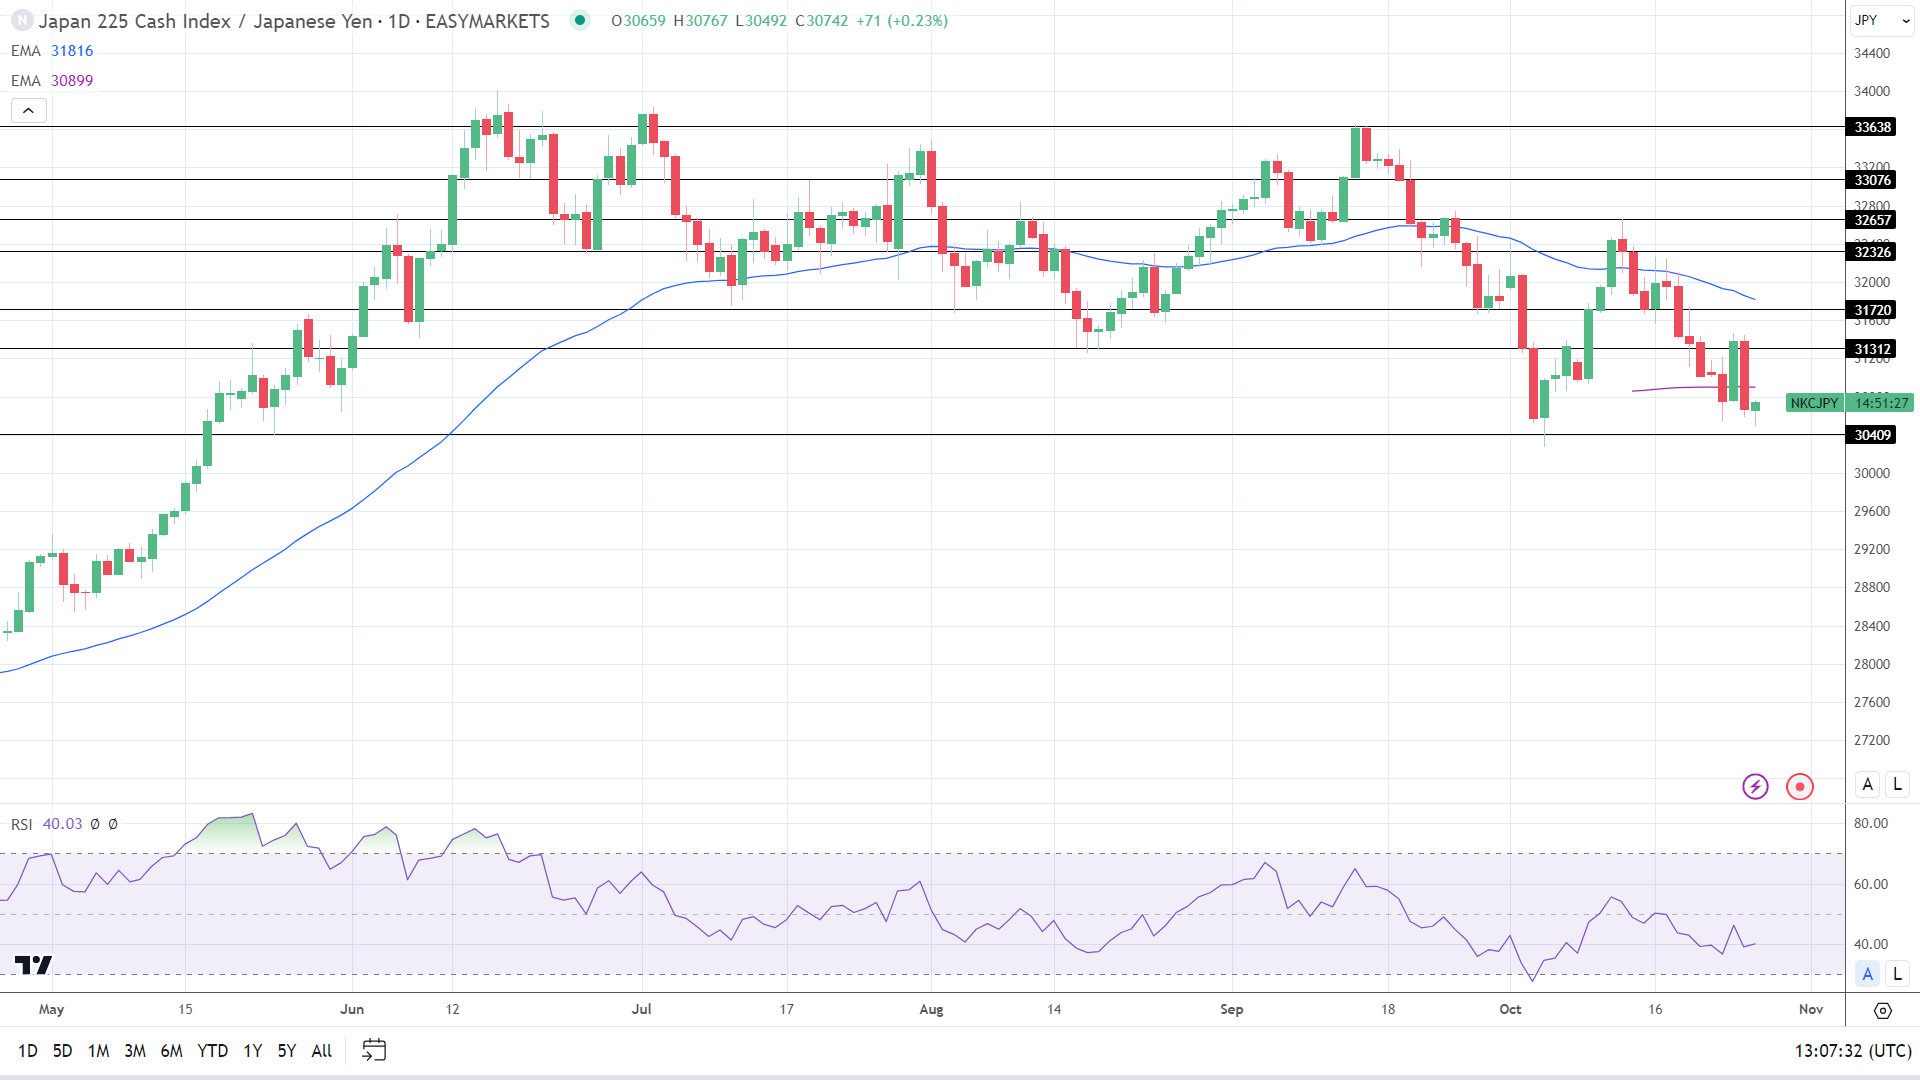
Nikkei 271023 Daily Chart(Graph for reference purposes only)

The Nikkei tumbled by 2.14%, with chip stocks delivering heavy losses.

SoftBank Group Corp. (9984) and Tokyo Electron Limited (8035) slid by 4.17% and 5.03%. Sony Corp. (6758) ended the day down 2.82%, with Fast Retailing Co (9983) falling by 2.56%. KDDI Corp. (9433) slipped by 0.91%.

Bank stocks also ended the Thursday session in negative territory. Sumitomo Mitsui Financial Group (8316) and Mitsubishi UFJ Financial Group (8306) ended the Thursday session down 1.22% and 0.97%, respectively.