Crypto News: Valkyrie Files Amendment Prospectus as SEC Prepares for Closed-Door Meeting

Crypto News: Valkyrie Files Amendment Prospectus as SEC Prepares for Closed-Door Meeting

Valkyrie Funds Files Amendment Prospectus

On Monday, progress toward a BTC-spot ETF market continued. Bloomberg Intelligence Analyst James Seyffart shared the latest BTC-spot ETF activity, saying,

“UPDATE: Valkyrie Funds joins the prospectus amendment train for their spot Bitcoin ETF. Things are still moving behind the scenes.”

Trading Derivatives carries a high level of risk to your capital and you should only trade with money you can afford to lose. Trading Derivatives may not be suitable for all investors, so please ensure that you fully understand the risks involved, and seek independent advice if necessary. A Product Disclosure Statement (PDS) can be obtained either from this website or on request from our offices and should be considered before entering into a transaction with us. Raw Spread accounts offer spreads from 0.0 pips with a commission charge of USD $3.50 per 100k traded. Standard account offer spreads from 1 pips with no additional commission charges. Spreads on CFD indices start at 0.4 points. The information on this site is not directed at residents in any country or jurisdiction where such distribution or use would be contrary to local law or regulation.

Investors are waiting for the SEC to approve the first batch of crypto-spot ETFs. These amendments are likely a result of ongoing discussions and requests from the SEC.

SEC Sends Closed Door Meeting Agenda

On Monday, attorney Scott Johnsson shared the latest from the SEC, saying,

“November 2 – I believe this is the first closed meeting of the Commissioners since Grayscale appeal deadline expired and the mandate was delivered. Agenda includes resolving litigation claims and admin proceedings. There were leaks out of the closed meeting ahead of the BITCO launch.”

The closed-door meeting is scheduled to occur one week before the Court’s deadline for the SEC and Ripple to jointly propose a briefing schedule regarding remedies for the remaining charges against Ripple.

The SEC v Ripple case might be a hotly debated topic at the November 2 SEC meeting.

Ripple holds the trump card in the form of the Hinman speech-related documents. The SEC may need to decide whether to agree to settlement terms that could prevent them from appealing the Programmatic Sales ruling.

Beyond the SEC v Ripple case, the SEC might also discuss the ongoing SEC v Coinbase (COIN) case and the current review process of BTC-spot ETFs.

Technical Analysis

Bitcoin Analysis

BTC remained above the 50-day and 200-day EMAs, affirming bullish price signals.

A BTC move through the $35,265 resistance level would give the bulls a run at the $36,400 resistance level. BTC-spot ETF application-related news will remain the focal point.

However, a BTC return to sub-$34,000 would support a move toward the $32,436 support level.

The 14-Daily RSI reading of 81.44 shows BTC sitting in overbought territory.
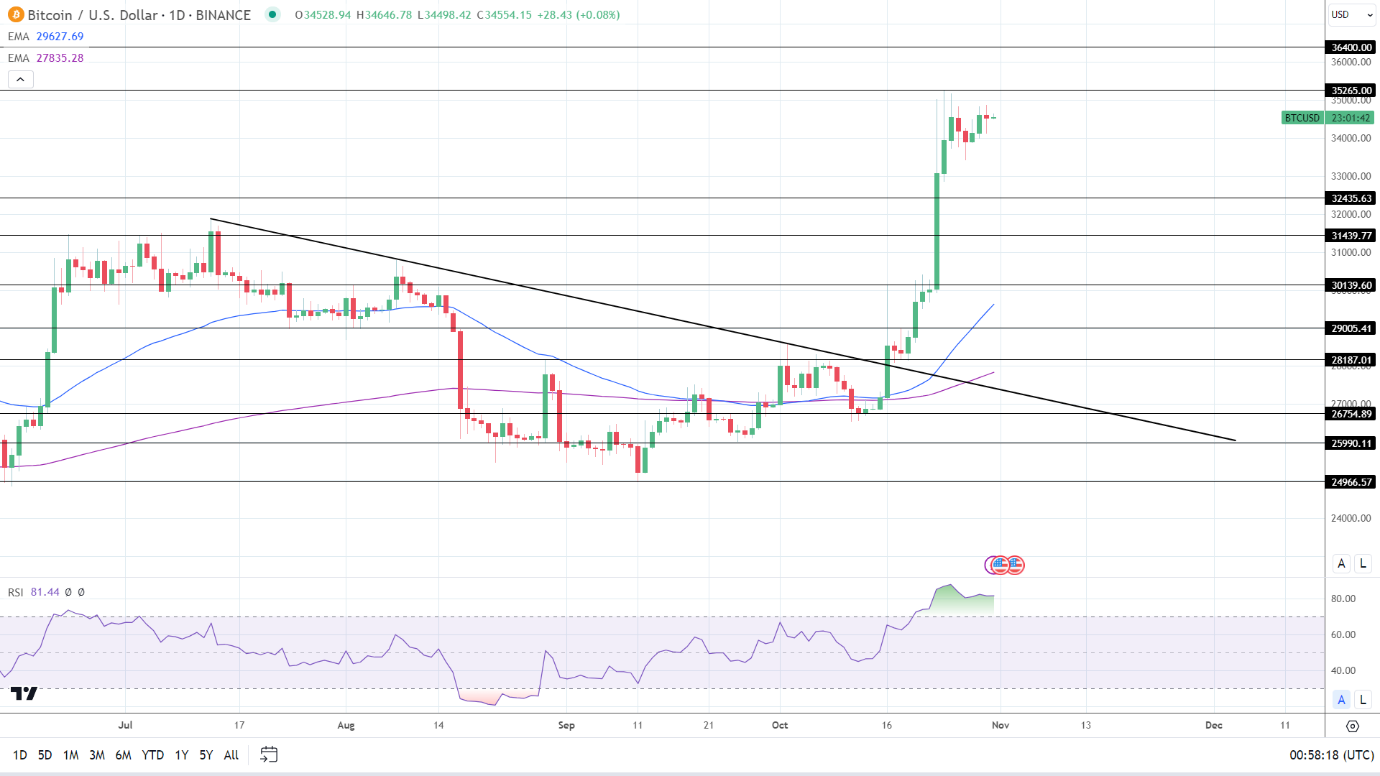
BTC Daily Chart sends bullish price signals.
BTCUSD 311023 Daily Chart

Ethereum Analysis

ETH stood above the 50-day and 200-day EMAs, sending bullish price signals.

An ETH return to $1,850 would give the bulls a run at the trend line and the $1,926 resistance level.

SEC activity and ETH-spot ETF news will also be focal points on Tuesday.

An ETH fall through the $1,805 support level would bring the $1,741 support level and the 200-day EMA into play.

ETH sits in overbought territory with a 14-Daily RSI reading of 71.73. Seller pressure could intensify, barring a favorable crypto event.
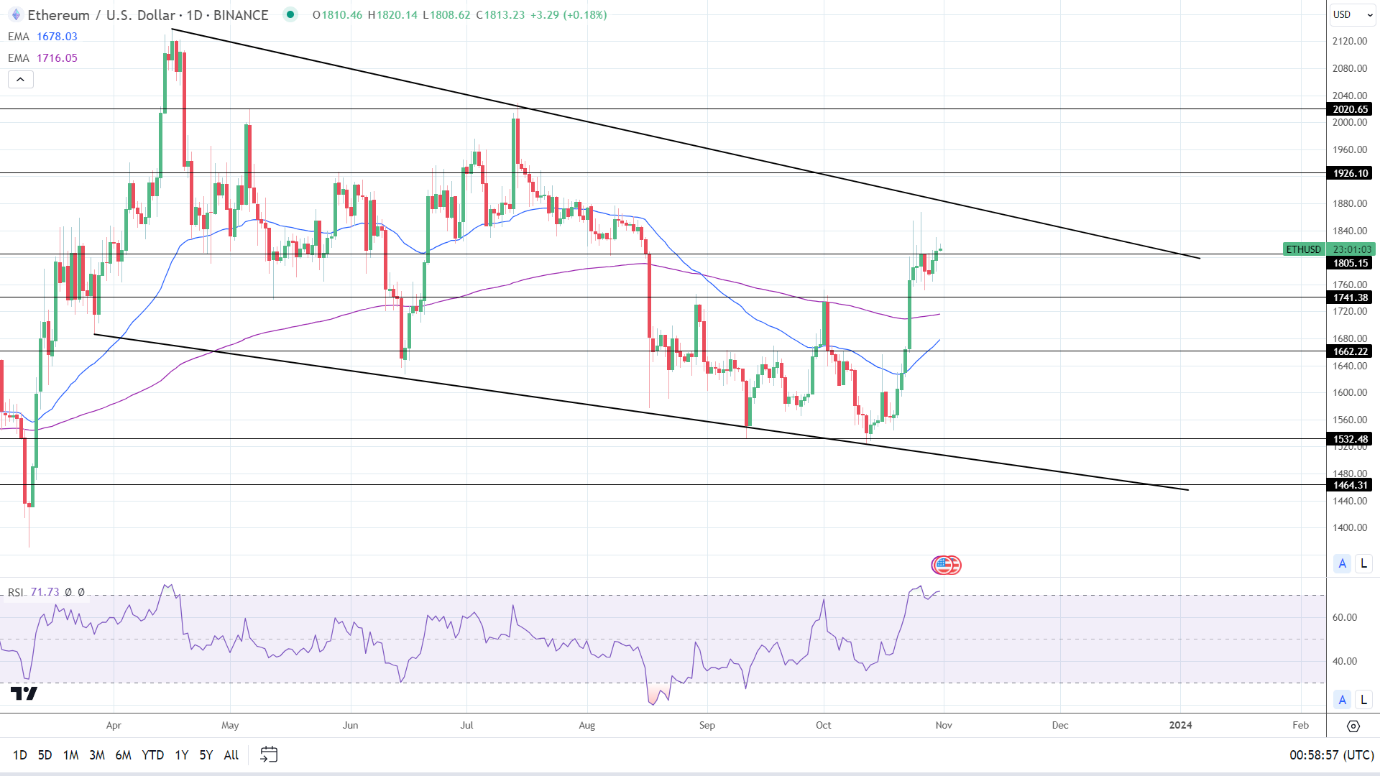
ETH Daily Chart sends bullish price signals.
ETHUSD 311023 Daily Chart
Brent Crude Oil Starts the Week on the Back Foot as ‘War Premium’ Subsides

Brent Crude Oil Starts the Week on the Back Foot as ‘War Premium’ Subsides

Oil Starts the Week on the Back Foot

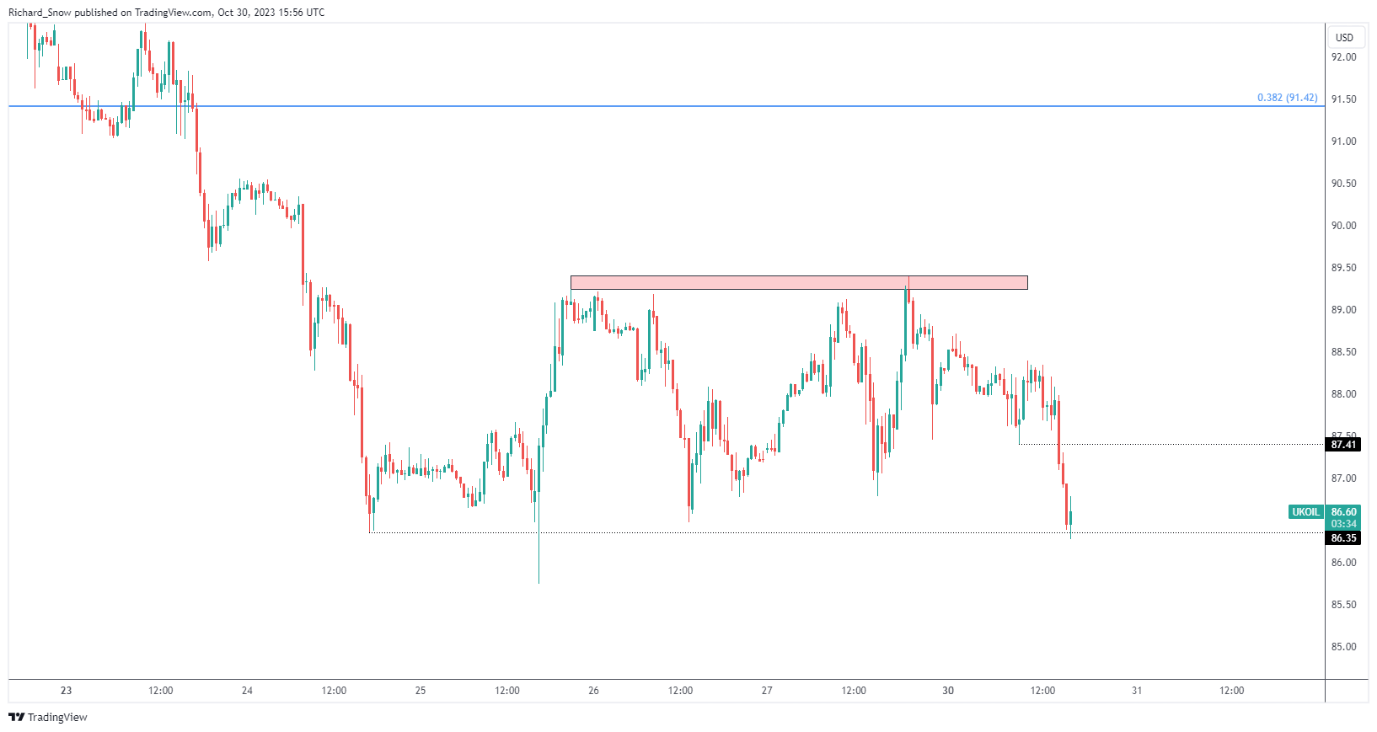
Oil prices were bid on Friday, retesting the $89 per barrel level once again. Two days prior, the same narrow intra-day range was observed between $87 and $89 where prices has remained.

However, today oil dropped sharply back to $87 once it became clear that the war in the Middle East had not escalated to a full ground invasion – a chance markets have not been willing to take. In fact, oil and gold had shown a tendency to rise into the weekend as traders positioned for the worst. Monday then represents a period of reflection and slight relief seeing that a massive operation was avoided or delayed.

Oil has also shown a lower sensitivity to news flow from the region after OPEC distanced itself from political responses after Iran called for an oil embargo on Israel. The focus appears to have become less about supply uncertainties and more about waning global demand for oil as major economies struggle under restrictive conditions. EU data this morning revealed another quarterly contraction in Germany, narrowly avoiding another technical recession after Q2 GDP came in flat. The negative outlook for growth is likely to feed into a lower global demand for oil which may see prices ease into the end of the year.

The 30-minute chart shows the oil price drop on a more magnified level, now testing the $87 level.

Brent Crude 30-Minute Chart

image1.png

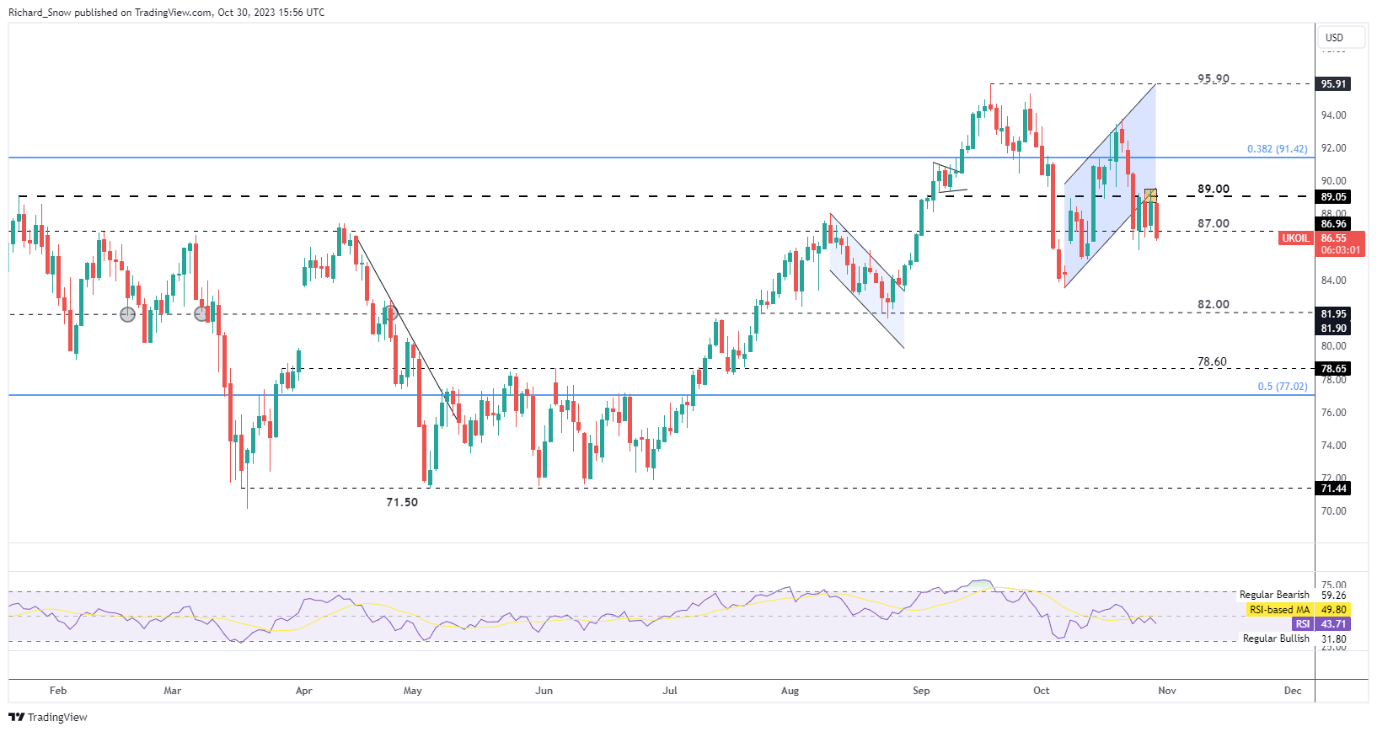
The daily chart shows the multi-day consolidation after invalidating the ascending channel. The direction of the commodity remains uncertain as incoming data shifts the focus from one concern to the next. However, oil supply in the region has been unaffected and therefore, concerns linked to the global growth slowdown may soon outweigh supply concerns, placing downward pressure on oil. A tight oil market should ensure prices do not drop too low, possibly facilitating range bound setups.

Brent Crude Oil Daily Chart

image2.png

WTI oil sentiment data below can be used as a proxy for Brent crude oil:

S&P 500 and Gold (XAU/USD) Take Diverging Paths Ahead of a Raft of Data Releases

S&P 500 and Gold (XAU/USD) Take Diverging Paths Ahead of a Raft of Data Releases

The S&P 500 looks set to arrest its slump today as safe-haven appeal takes a breather and traders focus on a host of data events later this week. The tension in the Middle East threatened to boil over heading into the weekend. However, the ground offensive by the Israeli military turned out to be less than first feared which appears to have helped risk sentiment.

Download the complementary US EQUITIES Forecast for Q4 Now!

Earnings at the back end of last week remained largely positive with no significant misses except the already discussed Alphabet cloud business. McDonald’s released earning this morning and surprised with a beat thanks in part to new products and low pricing keeping customers coming back for more.

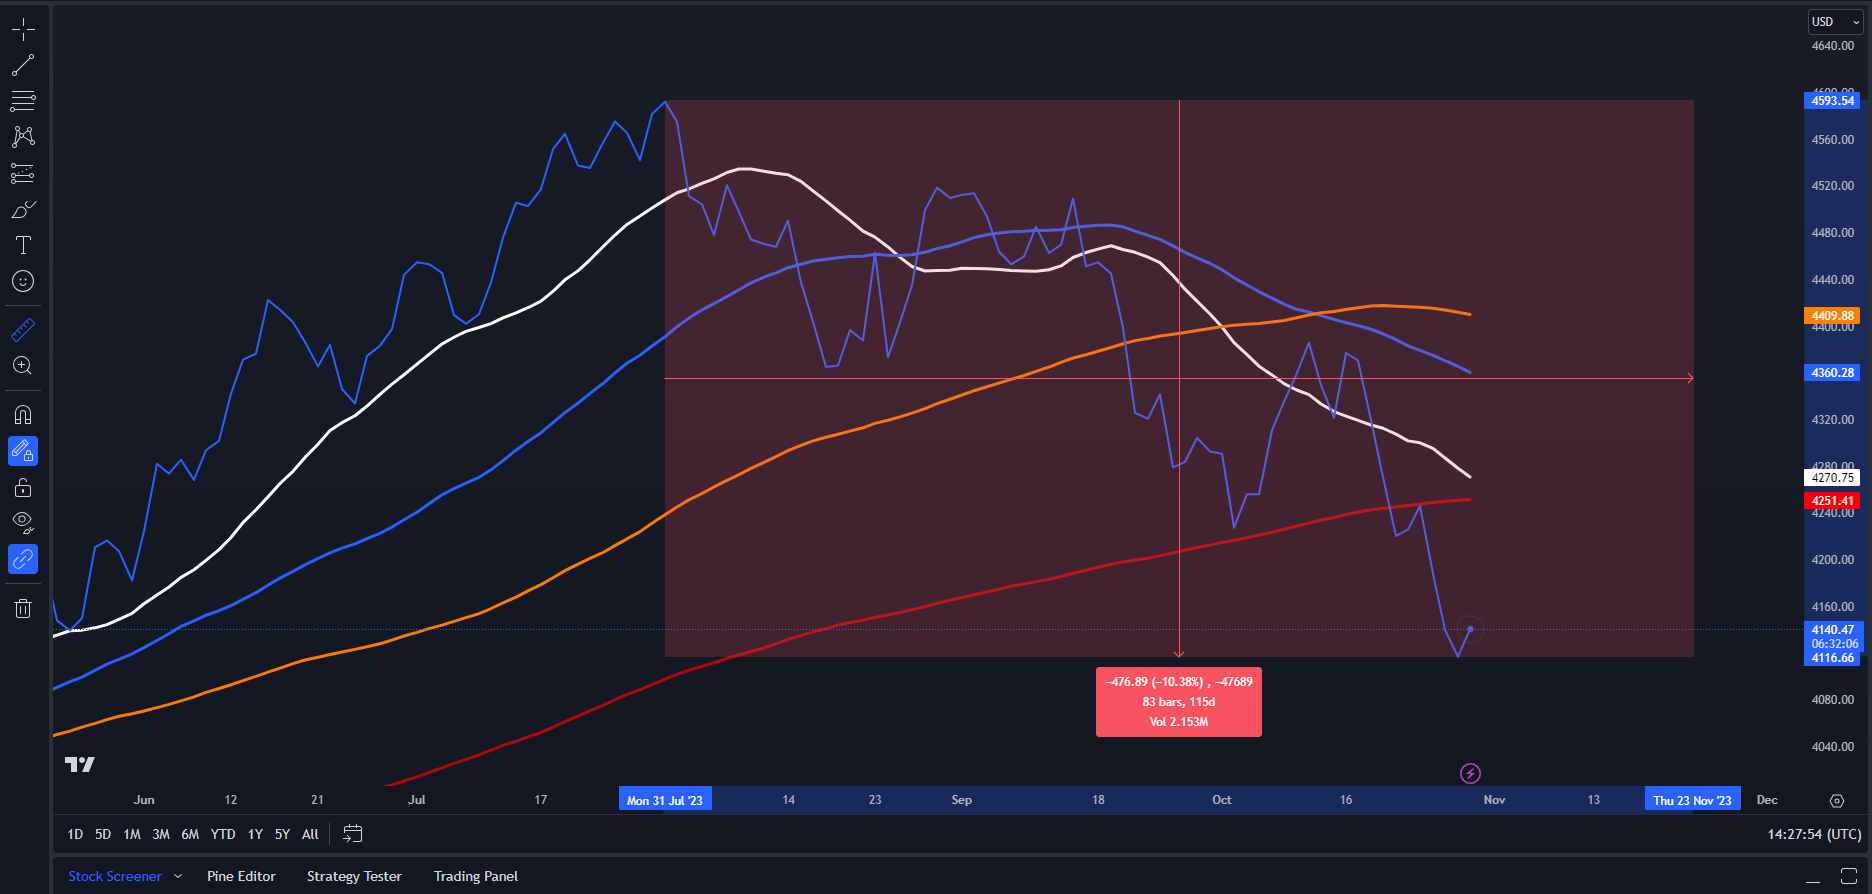
On Friday the S&P had lost around 10% from the July high which is key as a dop of 10% in equity markets is usually viewed as a correction. Buying pressure has returned since but whether or not it will be sustainable will be something to watch as the week unfolds.

S&P 500 Losses from the July High Exceeds 10%- Correction?

image1.png

S&P 500 TECHNICAL OUTLOOK

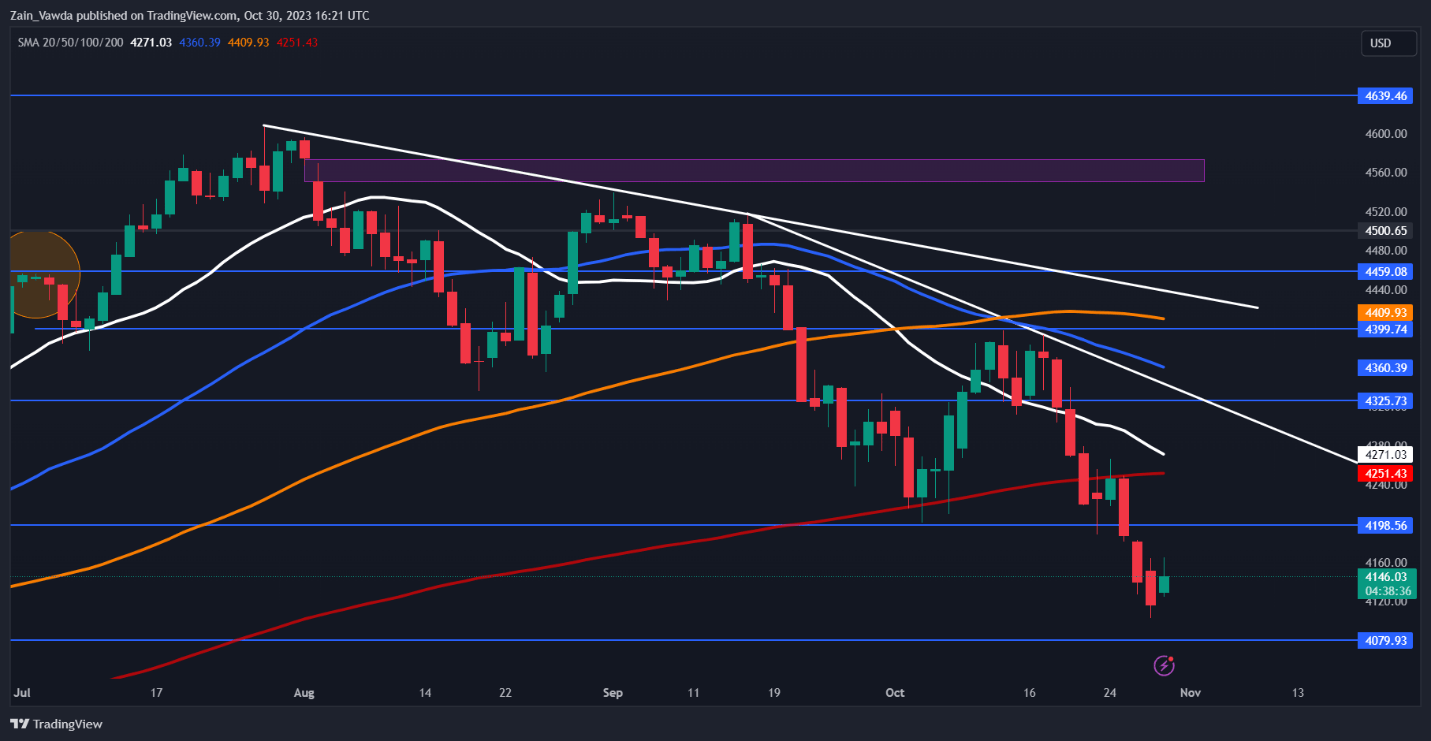
Form a technical perspective, the S&P failed to reach the 4000 mark as discussed last week with a pullback today. However, we are seeing a bit of selling pressure returns as we head deeper into the US session. The S&P as mentioned earlier has fallen 10% from the YTD high in what is usually considered a corrective move. This could also in part be the reason for the buying pressure while sellers may also be cashing in ahead of heavy data releases later in the week.

In what could be viewed as an ominous sign is the approach of a potential death cross formation as the 20-day MA looks to cross below the 200-day MA. This would be a nod to the strength of the downtrend as well as provide sellers with a bit more optimism for further declines. Now I am not sure if this will happen before the FOMC meeting, and we could remain rangebound till the meeting is out of the way.

Key Levels to Keep an Eye On:

Support levels:

  • 4100
  • 4000
  • 4047

Resistance levels:

  • 4198
  • 4251
  • 4325

S&P 500 October 30, 2023

image2.png

GOLD OUTLOOK

Gold for its part enjoyed buying pressure late into the US session on Friday as news came through that Israel would begin a ground offensive. Safe-Haven appeal clearly helping the precious metal end the week on a high.

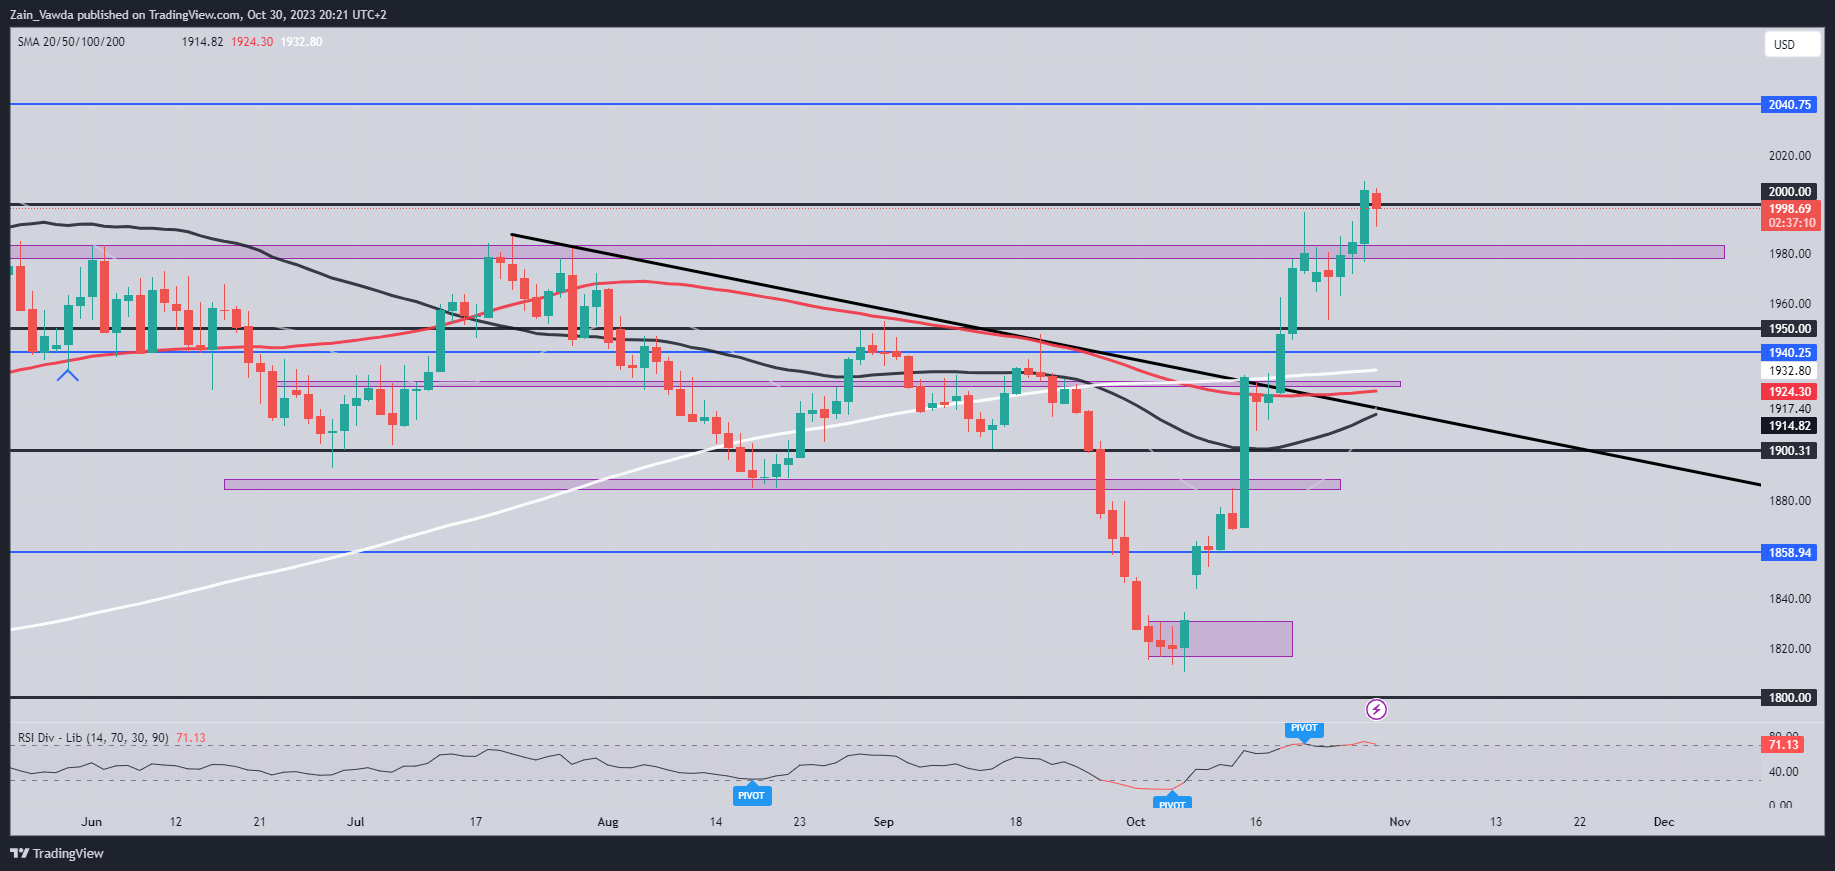
As mentioned, we are seeing a slight improvement in sentiment to start the week which has seen Gold flirt with the $2000 mark. If the bullish rally is to continue, we do need acceptance above the $2000 mark. The situation in the Middle East remains the key driver for Gold prices ahead of the FOMC meeting on Wednesday and without any surprise from the Fed could continue to drive prices for the foreseeable future.

A lot of data ahead this week coupled with the continuation of US earnings season. Market participants appear to be adopting a cautious approach heading into the FOMC meeting on Wednesday as doubts linger around another rate hike from the Central Bank.

image3.png

IG CLIENT SENTIMENT

Taking a quick look at the IG Client Sentiment, Retail Traders are currently LONG on Gold with 60% of traders holding LONG positions. Given the contrarian view adopted at DailyFX when it comes to client sentiment, is Gold on its way back toward the $1980 support area?

Gold (XAU/USD) October 30, 2023

USD/JPY Price Forecast: BoJ Meeting to Deliver Another Tweak to YCC Policy? 145.00 Incoming?

USD/JPY Price Forecast: BoJ Meeting to Deliver Another Tweak to YCC Policy? 145.00 Incoming?

The Yen has put in two consecutive days of gains against the greenback for the first time since August. A sign of the pressure the Japanese currency has been under for a large part of Q3 and Q4 thus far. Markets have been waiting with bated breath for the threat of FX intervention to materialize which has kept USDJPY bereft of a clear direction.

Elevate your trading skills and gain a competitive edge. Get your hands on the Japanese Yen Q4 outlook today for exclusive insights into key market catalysts that should be on every trader’s radar.

NIKKEI NEWS AND BANK OF JAPAN (BoJ) INTEREST RATE MEETING

The Japanese Government has tried to use warnings of intervention to underpin the Yen in the second half of 2023. This approach does appear to be wearing thin however, as market participants have grown accustomed to the warnings being followed up by very little action from the Central Bank.

This morning however we saw a report from Nikkei Asia that the BoJ maybe preparing to adjust the Yield Curve Control policy once more and allow 10Y Japanese Government bond Yields to rise above 1%. The question on market participants minds will be whether the BoJ will follow through. The bigger picture is obvious, in that Governor Ueda was brought in to normalize monetary policy. Yet till now we have only heard the BoJ use comments to taper Yen weakness, but one fears more may need to be done if the US Dollar Index continues to hold the high ground.

RISK EVENTS AHEAD

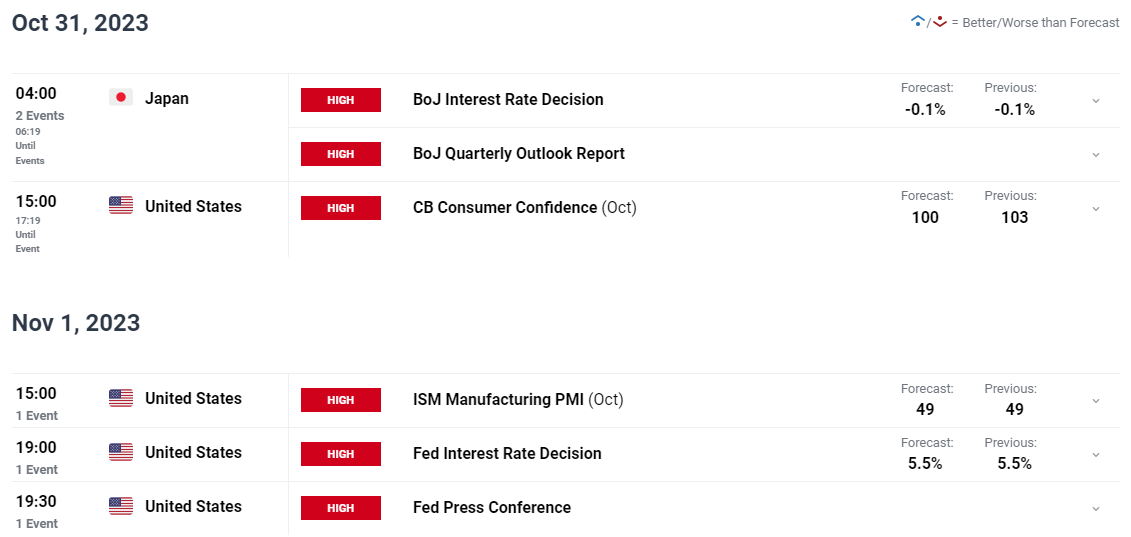
A lot on the calendar this week with tomorrows BoJ meeting kicking things off. The BoJ meeting could be the most exciting one in recent memory if the BoJ do announce a shake up to their YCC policy which could stoke some serious volatility in Japanese Yen pairs.

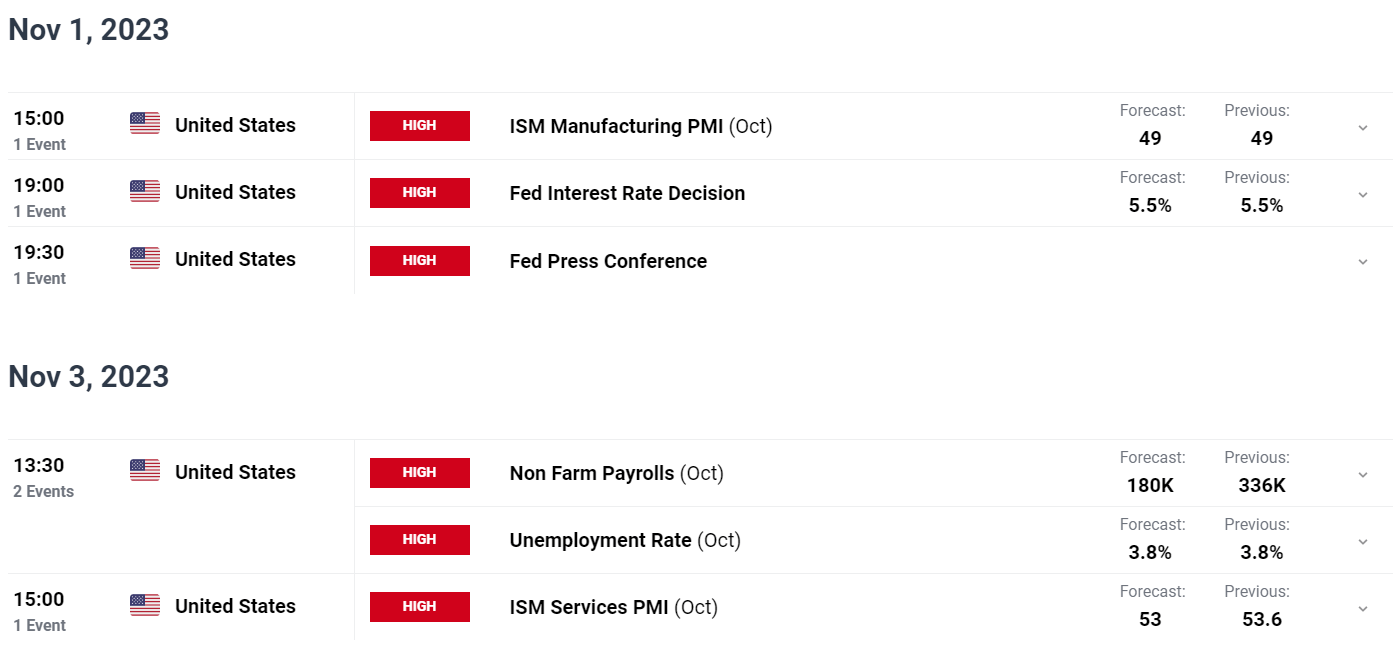
Following the BoJ meeting the outlook for the USDJPY may be drastically different ahead of the FOMC meeting. The Federal Reserve are expected to hold rates steady but focus will be on the Fed outlook moving forward and a potential hike in December. The strong data from the US keeps the door open for now with market participants looking for further clarity.

image1.png

FINAL THOUGHTS AND TECHNICAL OUTLOOK

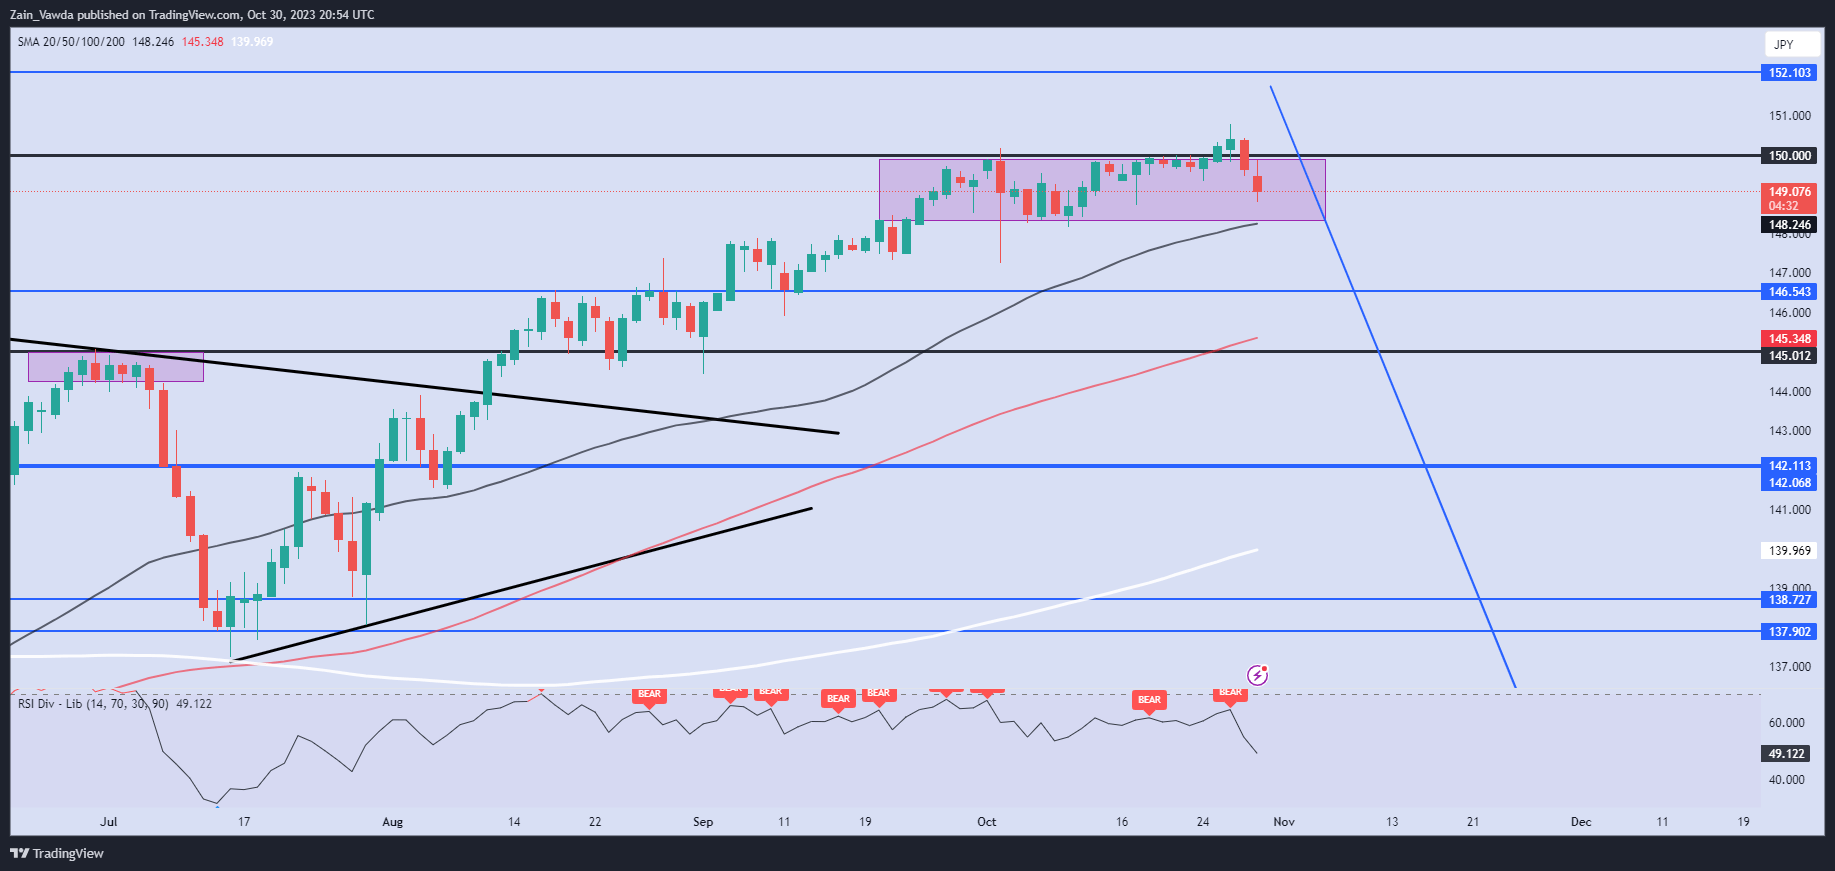
USD/JPY technical outlook remains complicated given the steep rise and long period of consolidation of late. We have however printed two successive days of losses for the first time since August, which could be a sign that further downside may be imminent. As we have discussed for months, without a change in monetary policy from the BoJ the likelihood of a sustained move to the downside may remain elusive.

A daily candle close below the recent range and 50-day MA resting around the 148.300 mark. This could be another sign that we are building bearish momentum. However, the question of how large a move we may get will depend solely on the BoJ meeting tomorrow and what changes/tweaks the Central Bank makes to monetary policy.

Key Intraday Levels to Keep an Eye On:

Support levels:

  • 148.30
  • 147.50
  • 145.00

Resistance levels:

  • 150.00
  • 152.10

USD/JPY Daily Chart – October 30, 2023

IGCS shows retail traders are currently Net-Short on USDJPY, with 83% of traders currently holding SHORT positions. Given the contrarian view adopted here at DailyFX will we see a return to the 150.00 level and beyond?

Euro Technical Outlook – Trend Might Re-Assert itself for EUR/USD but EUR/JPY Settles for Sideways for Now

Euro Technical Outlook – Trend Might Re-Assert itself for EUR/USD but EUR/JPY Settles for Sideways for Now

EUR/USD TECHNICAL ANALYSIS

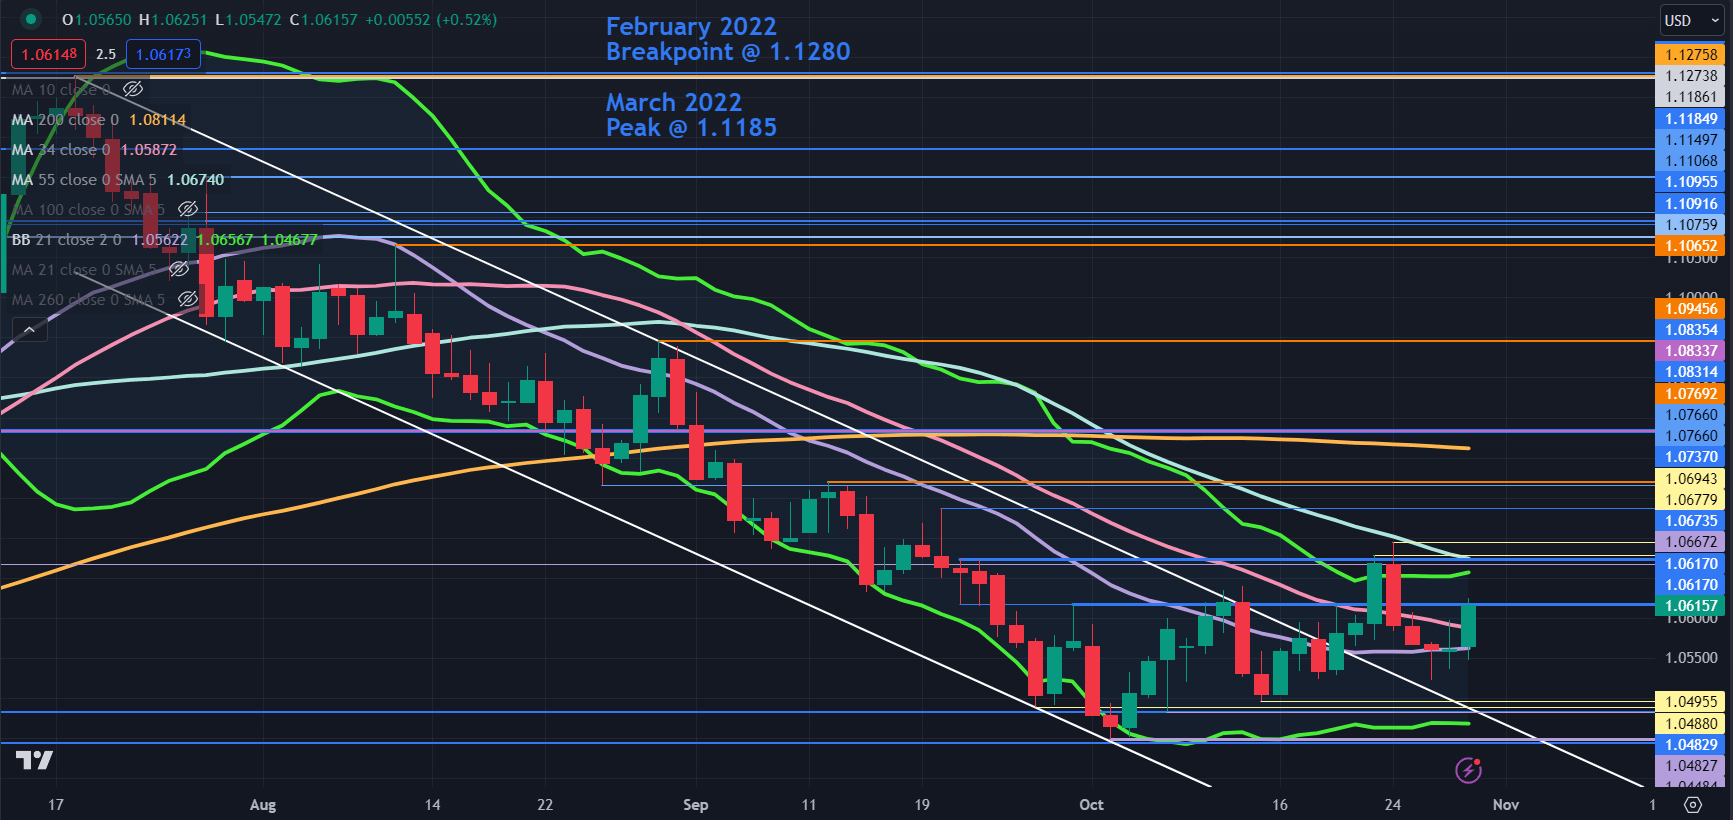
EUR/USD cleanly broke through the topside of a descending trend channel to start last week, briefly pierce minor resistance levels near 1.0680 to make a high at 1.0695.

The price action on the day that the price made that high saw a Bearish Engulfing Candlestick

formation emerged and it has gone lower in the proceeding days.

A Bearish Engulfing Candlestick opens at, or above the previous candle’s close. The length of the bearish candle ‘engulfs’ the previous green candle and it then closes below the prior candle’s open.

This reversal might signal that the descending trend may re-emerge.

The recent rally broke above the upper band of the 21-day simple moving average (SMA) based Bollinger Band. On the same day that Engulfing Candlestick materialised, the price closed back inside the band.

This potentially adds weight to the perspective that a reversal could be in play.

A bearish triple moving average (TMA) formation requires the price to be below the short-term SMA, the latter to be below the medium-term SMA and the medium-term SMA to be below the long-term SMA. All SMAs also need to have a negative gradient.

When looking at any combination of the 21-, 34-, 55- and 100-day SMAs, the criteria for a TMA have been met and might suggest that bearish momentum is evolving.

On the downside, nearby support might lie near the previous lows and breakpoints in the 1.0480 – 1.0495 area ahead of the lows seen in December 2022 and October 2023 near 1.0445.

On the topside, the 55-day SMA is currently near the recent peak and there might be a resistance zone ahead of 1.0700.

The next resistance levels could be at the breakpoints and previous highs near 1.0740, 1.0770, 1.0835 and 1.0945 ahead of a cluster zone of potential resistance in the 1.1075 – 1.1100 area.

EUR/USD DAILY CHART

image1.png

EUR/JPY TECHNICAL ANALYSIS

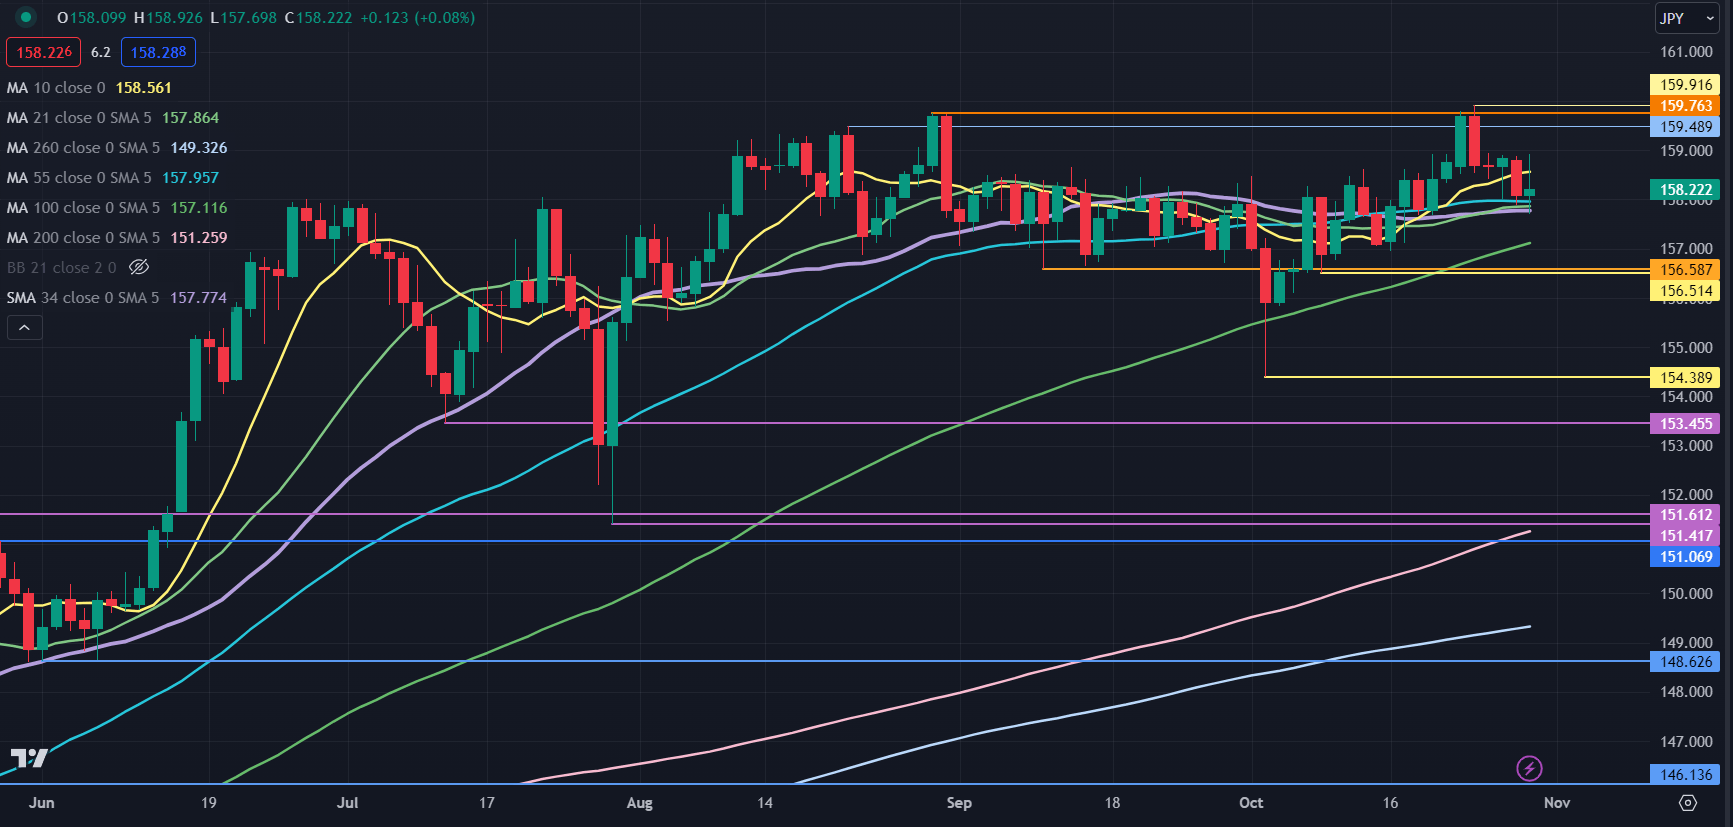
EUR/JPY appears to have settled back into its recent range after rejecting the move higher last week when it popped above the August to peak to trade at its highest level since 2008.

In the discussion above, EUR/USD seems to have a bearish TMA formation, but looking at the Simple Moving Averages (SMA) on EUR/JPY, a bullish TMA might emerge if the price edges higher.

The hindering factor is the clustering of the 21, 34- and 55-day SMAs. If the price stays above those SMAs, then it is likely that the conditions for a bullish TMA pattern will be triggered.

On the downside, support could be at the breakpoint and a recent low toward 156.50. On a sustained move lower, the levels to watch might be at the previous lows and breakpoints of 154.39, 153.45, 151.60, 151.40 and 151.07.

On the top side, the recent highs and breakpoint near 159.50, 159.75 and 159.90 may offer resistance.

EUR/JPY DAILY CHART

image2.png


Growth Versus Value Stocks: How Interest Rates Affect Valuations

Growth Versus Value Stocks: How Interest Rates Affect Valuations

When the Federal Reserve adjusts its monetary policy stance by either raising or lowering borrowing costs, the investment landscape changes, becoming more friendly or more hostile to the equity market. In this article, we will discuss how valuations and performance of value and growth stocks tend to be affected by rising and falling interest rates, but before we get to that, some context and definitions need to be established.

GROWTH STOCKS

Growth companies are often unprofitable and have speculative prospects, but investors are willing to pay a premium to own them because they have an innovative business/product that has the potential to deliver above-average returns over a long-term horizon, although there are no guarantees. They are riskier and therefore more volatile than the market in general, but their share prices usually rise faster than typical stocks because of their strong earnings growth outlook. Often, these high-flyers focus on increasing future revenue at the expense of delaying profitability, reinvesting their earnings into product research and expansion, so they do not frequently distribute capital to shareholders through dividends or buybacks.

VALUE STOCKS

Value stocks sit on the opposite spectrum. These are mature companies with a well-established business, solid balance sheets, proven history of financial performance and steadier but low growth over time. Despite their high quality and solid fundamentals, they have fallen out of favor and lost their “WOW” factor, so they trade a discount to the market and appeared undervalued based on various financial metrics such as price/earnings, price/book, cash flows, etc. Value companies typically pay dividends, offer lower volatility, and carry less risk than the market, but their share prices rarely experience explosive upward movements similar to those seen in the growth universe.

It is clear from the above introduction that different stocks have different characteristics; they are not created equal, so they will be affected by changes in monetary policy in dissimilar ways, but to try to gauge the possible impact, it is first necessary to understand a little about valuations. Very simplistically, the value of a company can be thought of as the present value of expected earnings.

By buying Apple’s shares, for example, a long-term investor has acquired an ownership claim in the company’s profits over time. To assign an intrinsic value to the perpetual cash flows associated with the business’ operations, analysts first forecast earnings growth and then discount the sum of the projected income stream to today’s dollars using a discount rate, usually a risk-free rate such as the 10-year U.S. Treasury yield. This is where interest rates play a huge role in equity investing.

Related: Everything You Need to Know About Types of Stocks

Let’s now analyze two imaginary companies, with different earnings profile over the next decade to determine how their value are affected by a changing interest rate environment. To do so, we’ll rely on a basic discounted cash flow model, using the formula below:

The model is very basic and omits key variables for simplicity, but for our purposes is enough.

1. Value Company: Company XYZ is a well-established oil producer. XYZ is expected to generate $1,000,000 in cash flows next year, and grow them by 4% every year for the next 10 years. Let’s now value this company with the U.S. 10-year yield at 0.25% and then at 3%.

Value company cash flows

2. Growth company: Company ZZZ is a recently founded tech firm that launched an innovative cloud storage software. ZZZ is expected to generate $50,000 in cash flows next year, and grow them by 90% every year for the next 10 years. Let’s proceed to value this company with the U.S. 10-year yield at 0.25% and then at 3%.

Growth company cash flows

CONCLUSIONS

The tables above show that higher discount rates produce lower equity values, but the effects vary across investment styles. In general, however, growth companies will be more sensitive to rising interest rates because of the nature and path of their cash flows: little in their early stages, large later in their life cycle.

Going back to the two hypothetical examples, growth company ZZZ lost 21.3% of its value when the discount rate used went from 0.25% to 3.0%. In real life, the less attractive valuation will likely coincide with a steep drop in the company’s stock price. Company XYZ was also affected by the change in the rate environment, but its present worth only fell by 14.3%, suggesting that companies with value characteristics may fare better when monetary policy becomes more restrictive.

Focusing on real life examples, the charts below are composed of two panels. The upper panel shows the ratio between IWD (iShares Russell 1000 Value) and IWF (iShares Russell 1000 Growth), and the lower panel displays the U.S. 10-year yield by itself.

Chart 1 is from January 2020 to May 2020. During this period, when the 10-year yield dropped from about 1.89% to 0.66%, the IWD/IWF ratio declined roughly 19%, pointing to strong growth outperformance.

CHART 1 – IWD/IWF RATIO VS US 10-YEAR YIELD (JANUARY 2020-MAY 2020)

IWD/IWF ratio

Chart 2 is from January 2022 to May 2022. During this time span, the 10-year yield climbed from 1.50% to about 2.85%. Simultaneously, the IWD/IWF ratio advanced roughly 20%, indicating strong value factor outperformance in an interest rate environment.

CHART 2 – IWD/IWF RATIO VS US 10-YEAR YIELD (JANUARY 2022-MAY 2022)

IWD IWF ratio versus 10 year yield

Why Do Trends in Markets Form?

Why Do Trends in Markets Form?

Why do trends in markets form?

Technical analysis is often a misunderstood discipline, and even misrepresented by some of its biggest proponents. Technical analysis doesn’t so much drive the market (although there is an element of technically-driven trading occurring), but is a way to analyze market participants’ collective perception of the underlying fundamental drivers and catalysts, or fundamental theme when one develops. You can think of the primary tool of technical analysis, a chart, as a footprint made collectively by all those participating in the market.

Understanding the range

To understand why trends form on a chart, we start with a frequent precursor to a trend. It typically begins with a dull, rangebound market. A rangebound market often shows up when known drivers are properly priced-in to the backdrop. This allows for sideways price movements where no new highs or new lows are coming into play. In a choppy market there is an equilibrium between buyers and sellers in the absence of an underlying driver or theme. The market is effectively in limbo. It is usually marked by low volatility, and outside of specific strategies designed to take advantage of low volatility, this type of market leaves much to be desired in terms of opportunity.

From range to breakout

In a breakout market there is a gear switch towards a fundamental theme where market participants are forced into action as risks make a shift in one direction or the other from dull market conditions. The shift can come from a large catalyst or a buildup of pressure over time. You can think of a rangebound market going into a breakout market as a pile of sand that has had its final grain dropped on it before it collapses.

A trending market is the breakout maturing a theme, which strengthens and becomes sustainable. The strength of the theme draws further participation into the market and becomes self-reinforcing. A good trend won’t be derailed by small fundamental events and data releases. These are only short-lived bumps in the road with market participants’ attention quickly turning back towards the broader underlying theme.

In the beginning of a trend, the theme isn’t visible to many, typically only to the most astute market participants. But as the trend matures, it becomes apparent to an increasingly less sophisticated crowd of traders until the trend eventually reaches a point of exhaustion and changes course. For a more in-depth look at this process, check out Market Cycles | Phases, Stages, and Common Characteristics.

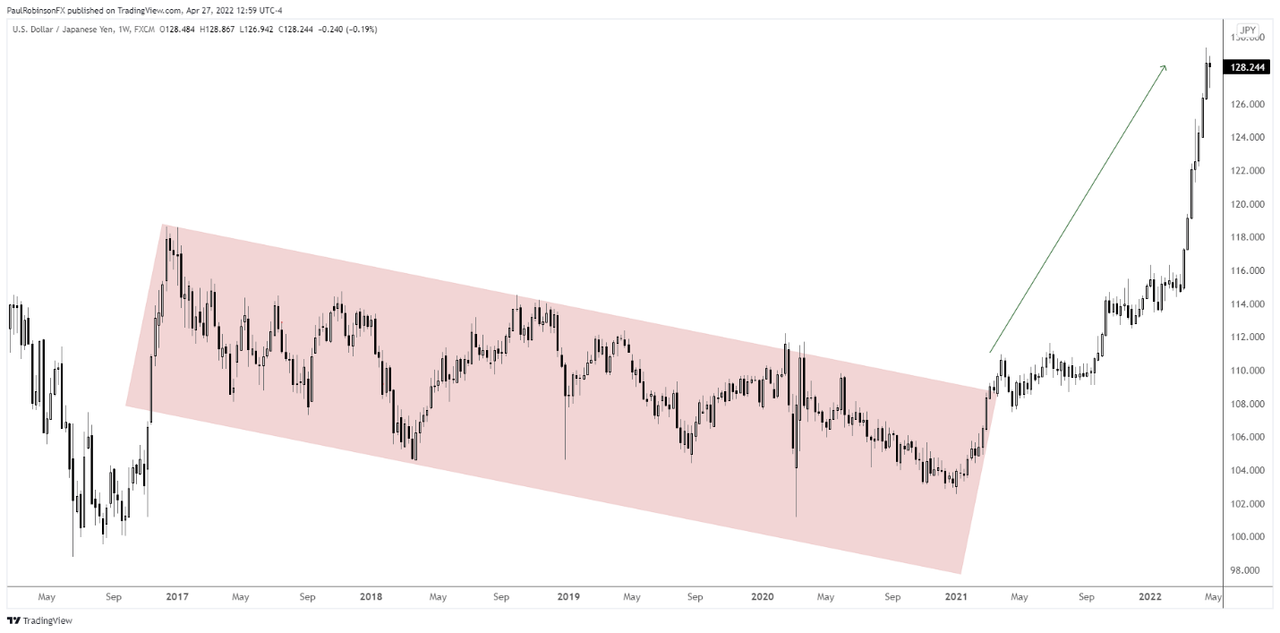
USD/JPY from 2017 to 2022 is a good example of a market that went from dormant for a long period of time to a breakout/trending market. USD/JPY volatility dried up and trading was choppy from around the beginning of 2017 until early 2021. In early 2021 USD/JPY started to break out and trend higher before posting a sharp rally in 2022 when U.S. inflation and interest rates took off sharply.

USD/JPY 2017 to 2021 Choppy Range Turning into a Powerful Trend

USD/JPY

Trends can also form suddenly when markets quickly reverse. These are a result of market participants having to adjust their positioning due to the perception of a rapidly changing backdrop. Stock markets for instance can swiftly go from a bear market to a bull market after panic selling dries up.

S&P 500 Bear Market Swiftly Turning into Bull Market

Generally speaking, trends can offer excellent opportunities for traders if approached with the proper strategy. They occur on every time frame, so there is always a trend emerging. There are many considerations to take into account when trading trending markets. We cover them in depth in the Trend Trading Guide. Check out the banner below find out more about how to become a better trend trader.

Can Unlucky Traders Still be Profitable? Finding Optimal Risk Management

Can Unlucky Traders Still be Profitable? Finding Optimal Risk Management

Often, there is an element of luck when it comes to trading. Even if your analysis is spot on, the timing is very difficult. A famous example from the real world can be found in Michael Burry, the storied US investor who correctly predicted the 2008 housing bubble from Michael Lewis’ bestseller “The Big Short”. He had to face down a revolt among his investors that nearly chased him out of the very trades that would land him in the history books. Burry’s financial backers balked at a steady stream of expensive payments made to keep his trades in play as the markets dithered.

There is a way for traders to compensate for luck – risk management. Overlooking this essential component of the strategy is how an incredibly lucky trader – someone who can frequently call trades correctly – may still lose money in the aggregate. Conversely, using risk management effectively is how a poor win rate can still translate into profitability.

How is it that a lucky trader can lose money overall? Consider a person who profited on 8 trades out of 10, making 10 dollars per trade. On the two remaining trades, however, 50 dollars were lost each time. On net, this will leave the trader 20 dollars poorer. In this special report, we will show how an unlucky trader can still be profitable, and what you can do to optimize risk management.

The First Random Walk – Understanding the Sequence

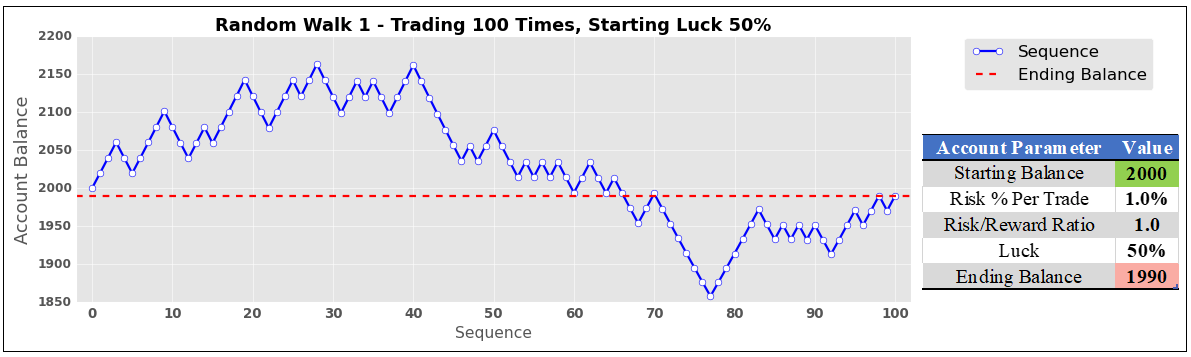
A random walk simulation was used to mimic someone trading 100 times in a row. Each random walk has a few parameters: starting account balance, the maximum risk a person is willing to take per trade as a percentage of the account balance (which stays the same as the trader makes or losses money), the risk-reward ratio (how much the trader wants to make relative to how much is put at risk), and finally the trader’s luck (the chance that a given trade in the sequence is profitable).

The first random walk is shown on the chart below. It simulates a trader that starts with a $2k account, risks 1% per trade, has a risk/reward (RR) ratio of 1:1 (meaning that the first trade risks losing $20 to make a profit of $20), and has 50% luck. Being lucky about half of the time had a predictable outcome. The ending balance ($1990) was nearly identical to where it started ($2000) after one hundred trades.

The First Random Walk – Understanding the Sequence

Study Limitations

It should be noted that this is a study computed with code and has no margin of error or human emotion factored into it. This means that no matter what, it assumes the trader being modeled always sticks to the game plan perfectly. It also assumes that trades can be seamlessly closed – with a profit or loss – at the designated settings with absolute precision. In the real world, stops may not always be executed at the specified price, resulting in some slippage. These simulations also assume 100 trades were taken, which will not match everyone’s level of activity. With that in mind, this is more of a demonstration of the importance of risk management rather than a one-size-fits-all trading system.

The Second Random Walk – Reducing Luck

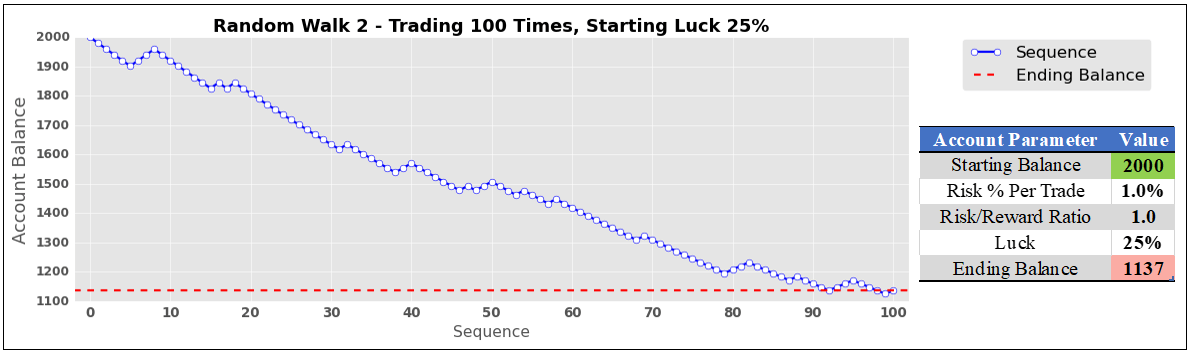
What happens when we take the same sequence but make our hypothetical trader unlucky, leaving everything else unchanged? With 25% luck, disaster strikes. Someone with a risk/reward ratio of just 1:1 would see their account balance cut almost in half after 100 trades ($1137). As we will find at the end of this journey, however, an increase in the risk/reward ratio can compensate for worse luck.

image2.png

Simulating Hundreds of Thousands of Trades to Find Optimal Risk/Reward Ratios

To find ideal risk/reward ratios for given levels of luck, these random walks were run many times to find statistically meaningful interpretations. In this study, one cycle constituted 100 trades conducted 100 times. That is a total of 10,000 trades per cycle! With each cycle, the risk/reward ratio automatically rose by 0.05, starting at 1. The program is coded to keep doing this until 100% of the trades are finished at or above the starting account balance.

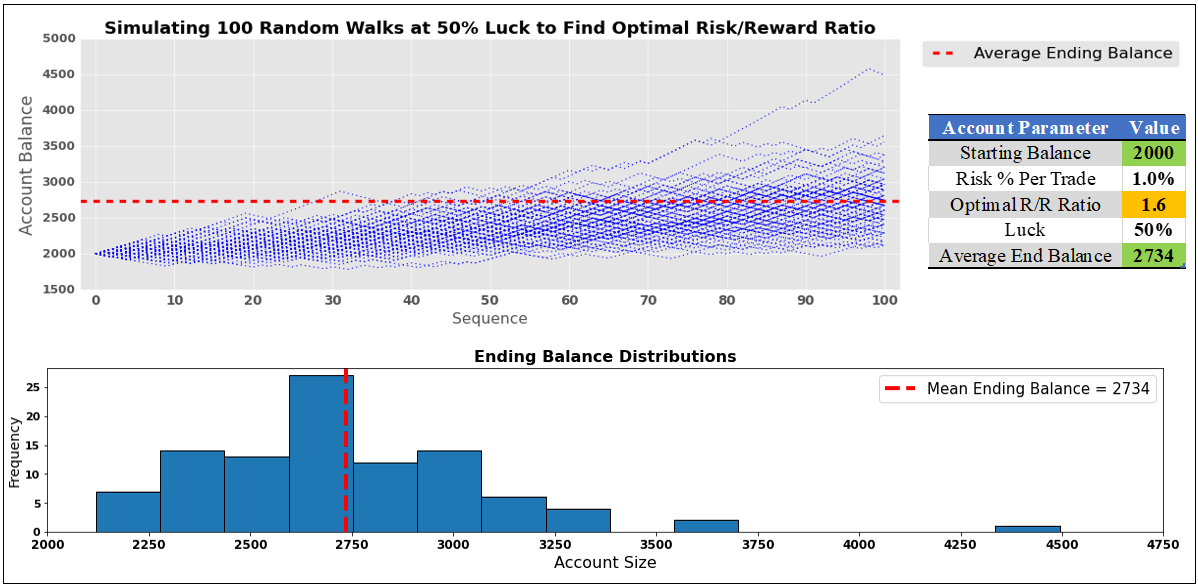
So, what does this look like for someone lucky about half of the time? Well, in the image below, we can see that the optimal risk-reward ratio is on average 1.6 (meaning that with a starting balance of $2k the strategy aims to make $32 in profit while risking $20 on the first trade). The latter two will adjust alongside the evolving account balance to maintain a 1.6 RR ratio, making sure the risk remains at 1% per trade.

The code ended up increasing the risk/reward ratio 6 times. Including the starting point, the cycle ran 7 times. In other words, 70k trades were conducted to find the optimal RR ratio. To further optimize this study, another 10 rounds of random sequences were used. This means that roughly 770,000 trades were placed to find the optimal risk/reward ratio for 50% luck! It is not exactly 770,000 because sometimes the RR ratio was above/under 1.6.

When someone is lucky half of the time, and they use a 1.6 risk-reward ratio, we can expect an average ending balance of $2734 (36.7% return, which remains constant no matter what the starting account balance size is) after 100 trades. In the lower half of the image, there is a normal distribution of outcomes. There were a couple of outliers, with an account topping $4.5k. A few others were above $3.5k.

Simulating Hundreds of Thousands of Trades to Find Optimal Risk/Reward Ratios

The Optimal Risk/Reward Ratio Curve

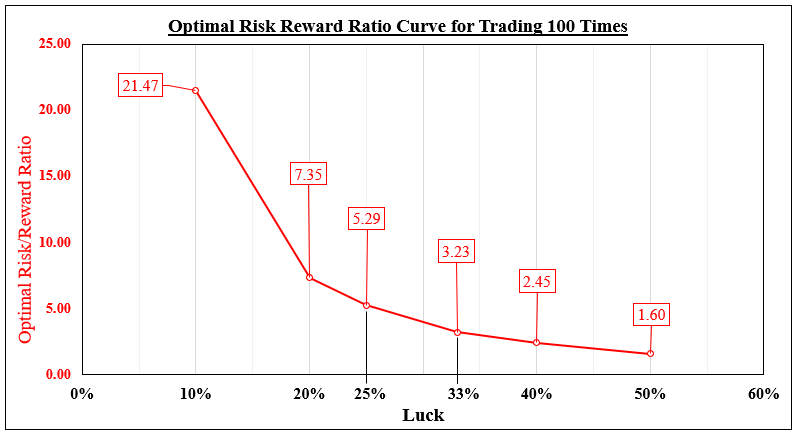
What about other levels of luck? In this study, I used the following: 50%, 40%, 33%, 25%, 20% and 10%. Optimal RR ratios are displayed in the chart below for a given luck level. As expected, lower levels of luck required higher risk/reward ratios to compensate. When you are lucky 40% of the time, an ideal RR ratio for a sequence of 100 trades seems to be 2.45.

At 2.45, a total of 30 cycles were simulated for a given random sequence. Just like before, an additional 10 were performed to help optimize this study. Combining all these sequences, roughly 3,300,000 trades were placed to find the optimal risk/reward ratio for 40% luck.

Someone lucky just 10% of the time can still make a profit. However, this would demand the daunting task of maintaining a 21.47 risk/reward ratio.

The Optimal Risk/Reward Ratio Curve

Is Trading Success Based on Luck?

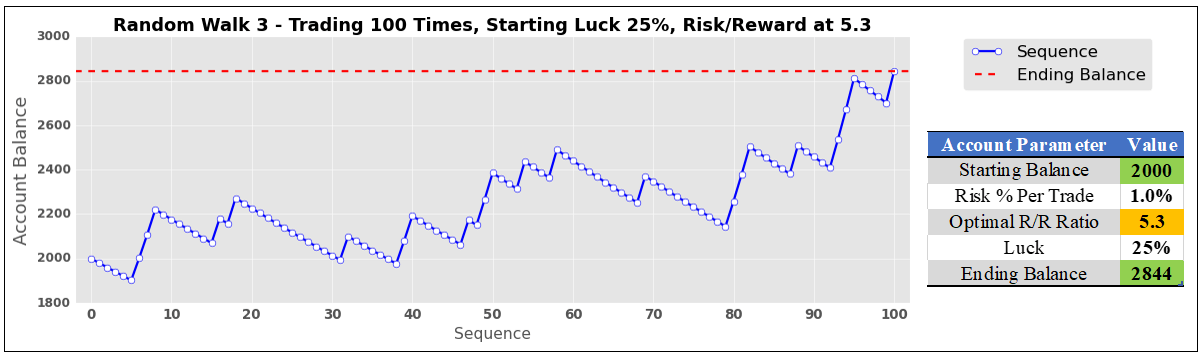
Now, let us revisit the earlier scenario of a trader that is lucky just 25% of the time. Using a 1:1 risk-reward ratio, they lost almost half of their account. Using the optimal risk/reward ratio of 5.3 suggested in our analysis, their ending balance becomes $2844, a 42.2% return. Do traders have to be lucky to be profitable? Absolutely not. Success comes down to risk management.

Is Trading Success Based on Luck?

Gold, Silver, Copper Analysis: In-depth Analysis Amid Rising Bullish Signs

Gold, Silver, Copper Analysis: In-depth Analysis Amid Rising Bullish Signs

Gold’s recent surge past $2,000 faced a pullback due to a strengthening US Dollar, driven by increasing US Treasury yields and expectations of the Federal Reserve’s policy tightening.

Although geopolitical tensions between Israel and Hamas are supporting gold as investors seek safe-haven assets, the US economy’s robust growth, reinforced by positive consumer spending and GDP reports, continues to challenge gold prices.

Upcoming policy decisions from central banks, including the Bank of Japan, Federal Reserve, and Bank of England, along with key data like China’s official PMIs and the US jobs report, are expected to influence gold’s trajectory.

This economic strength, paired with potential rate hikes, keeps the US Dollar strong, impacting other precious metals like silver and copper.

Gold Prices Forecast

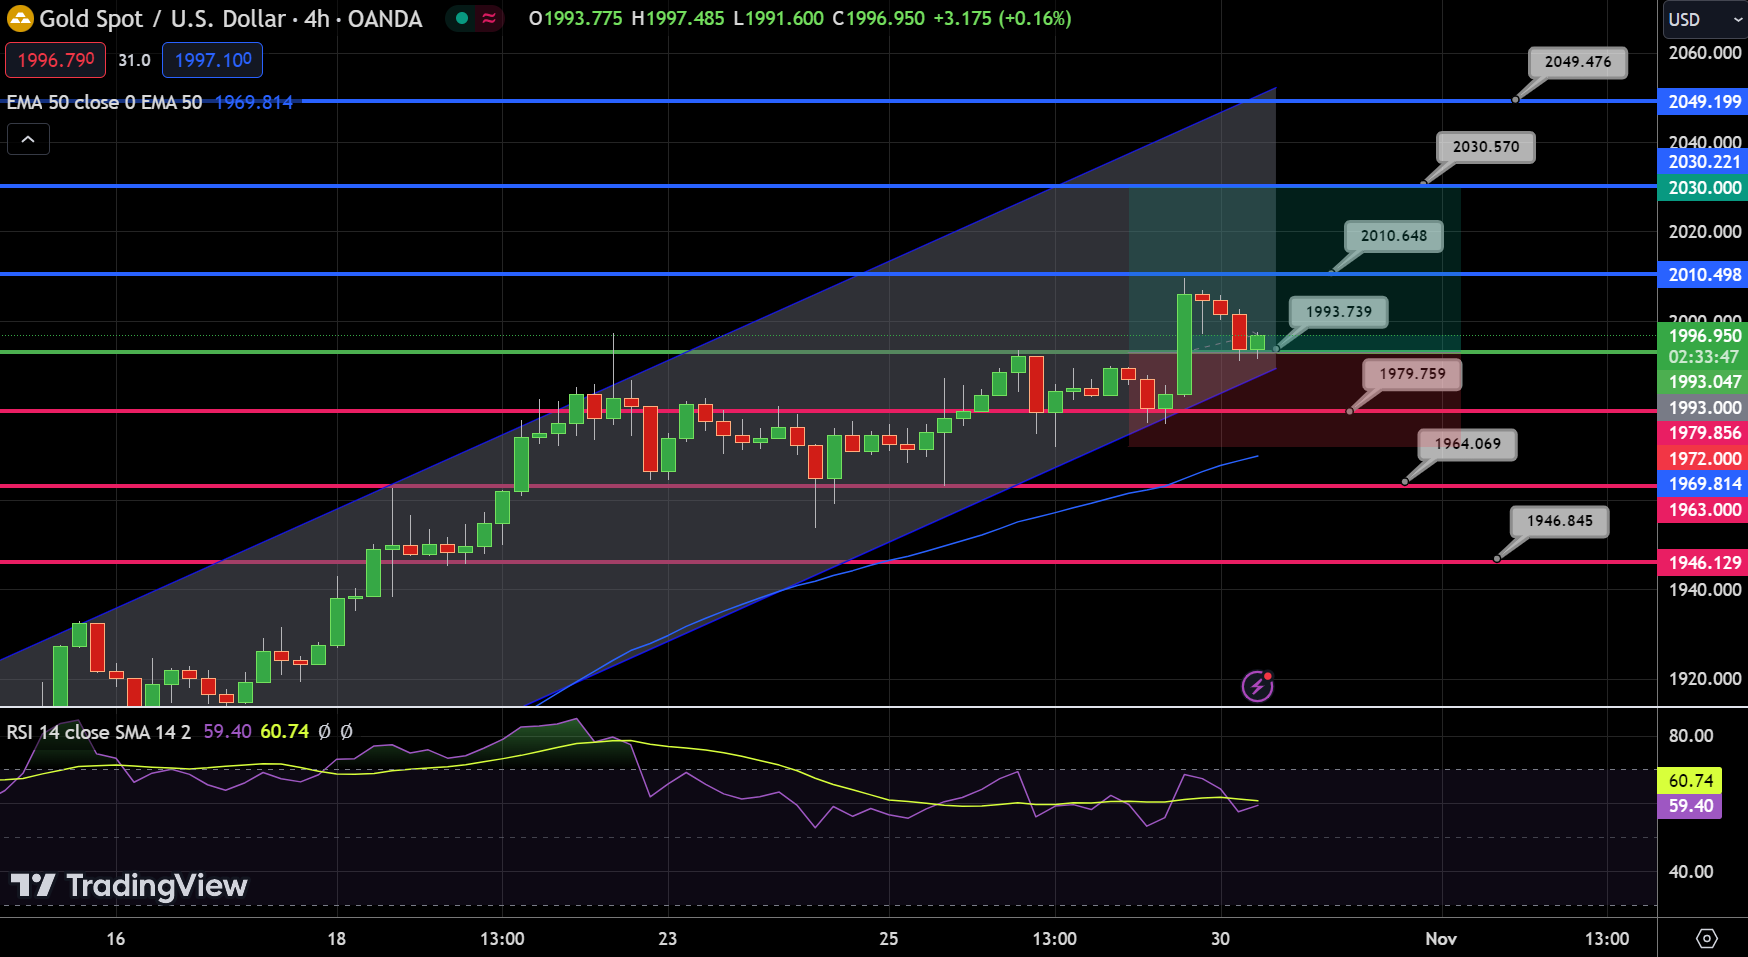
Gold Chart
Gold ChartAmidst global economic uncertainties, Gold (XAU/USD) retains its allure, manifesting a slight dip, currently priced at $1,996.95 — a 0.50% decrease. The pivot point stands firm at $1,994, marking a crucial threshold. Resistance levels are set at $2,011, $2,031, and $2,049, while immediate support hovers at $1,980, with additional cushions at $1,964 and $1,947. RSI data indicates a value of 59, suggesting a mild bullish sentiment.

The MACD line’s subtle lead over its signal line hints at potential upward momentum. Furthermore, the price comfortably exceeds the 50 EMA ($1,970), reinforcing a short-term bullish stance.

An observed upward channel pattern supports gold around the $1,990 range, underpinning its bullish trend above this level. Expectations lean toward gold testing the $2,011 resistance in imminent sessions.

Silver Prices Forecast

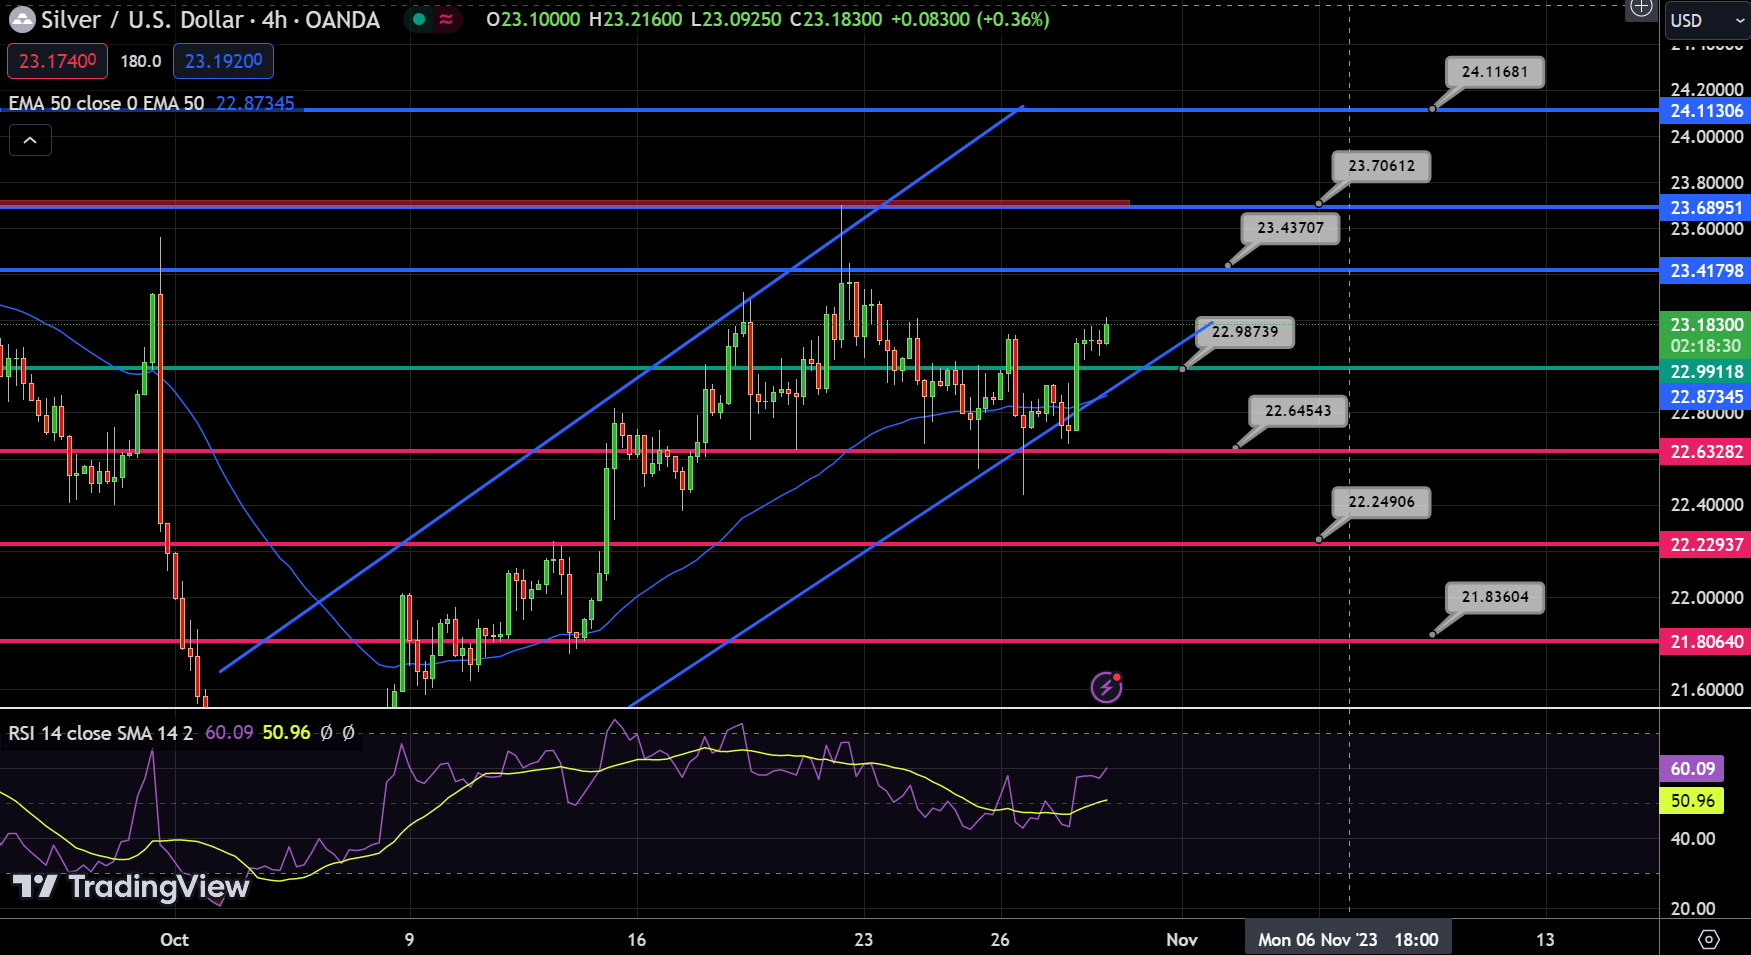
Silver Chart
In the precious metals sphere, Silver (XAG/USD) has exhibited a shimmering performance, currently marked at $23.183 — a rise of 0.31%. The metal’s pivot point, set at $22.99, serves as a critical juncture for potential price movements.If silver continues its upward spree, it might face resistance at $23.44, then $23.71, and finally, a more optimistic $24.12. Conversely, any declines might find an initial buffer at $22.65, followed by $22.25 and a solid base at $21.84.

The RSI suggests a value of 60, hinting at a mildly bullish sentiment. The MACD closely shadows its signal line, indicative of a potential bullish outlook. Notably, the price surpasses the 50 EMA, set at $22.87, solidifying its short-term bullish position.

An upward channel, coupled with a bullish engulfing candle, signals a buying trend around $22.85. Thus, if silver remains bullish above $23, we might soon see it challenge the $23.44 resistance.

Copper Prices Forecast

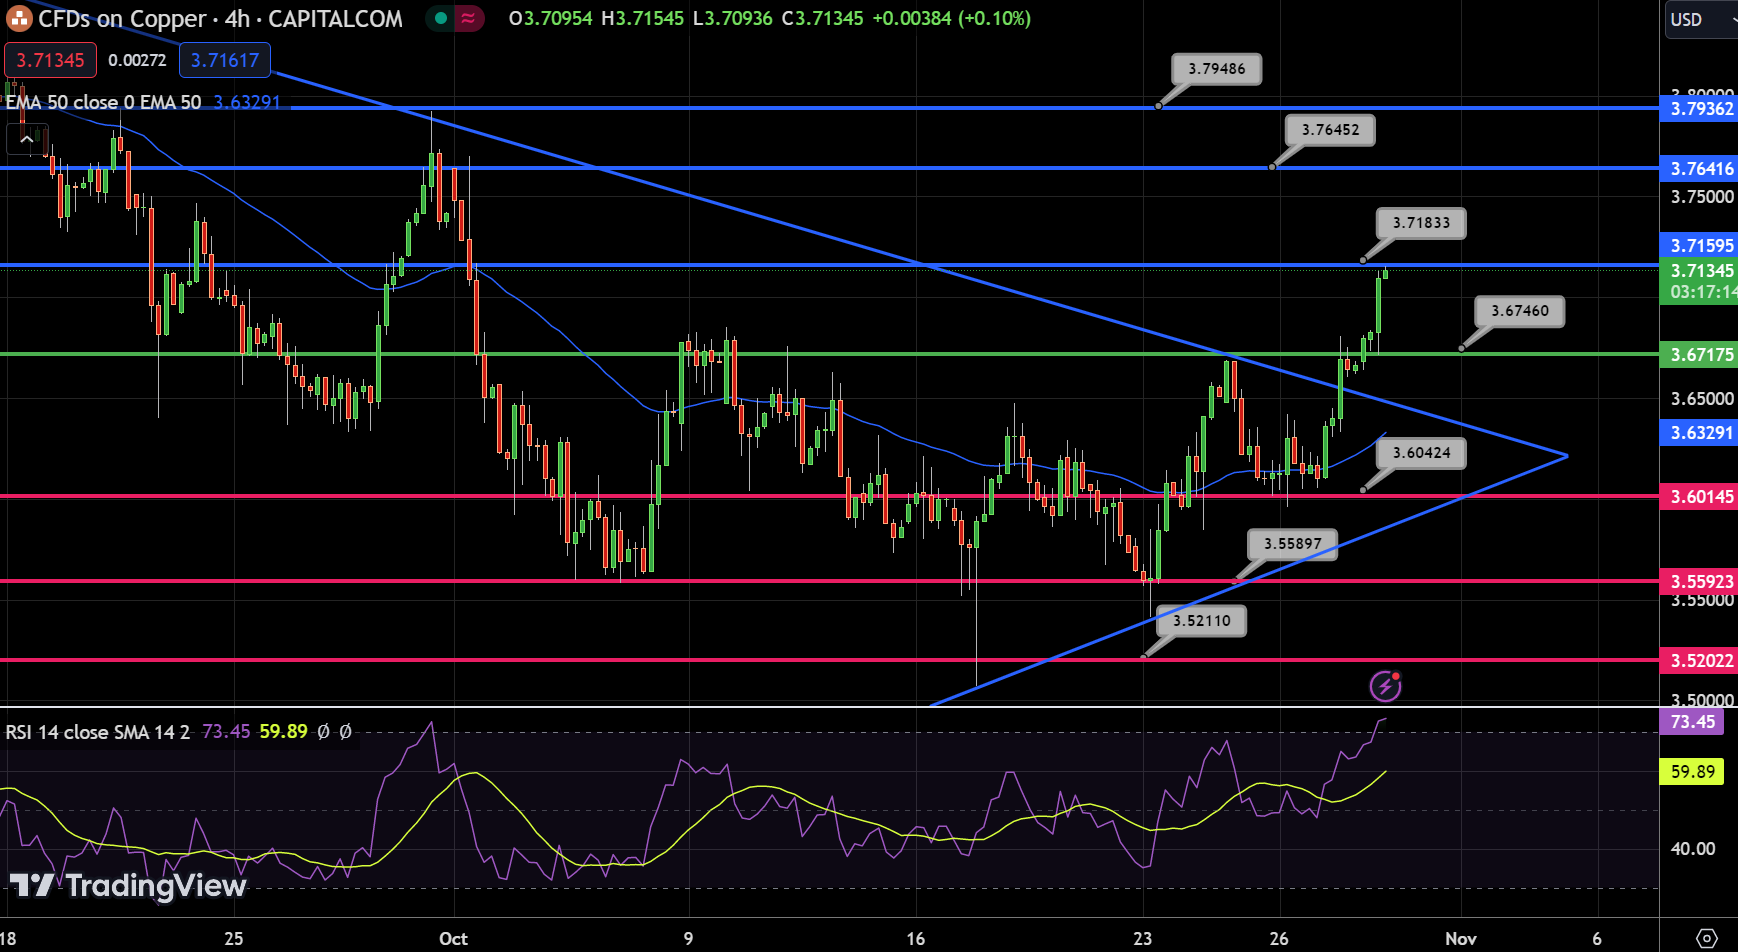
Copper Chart
Copper ChartAs October draws to a close, Copper paints a promising picture, trading at $3.71, marking an appreciable uptick of 1.31%. The metal’s pivot point, crucial for forecasting potential price fluctuations, stands at $3.67. Should copper’s bullish run persist, it could first confront resistance at $3.72, advancing to $3.76, and further on to $3.79.

Conversely, a downward shift may first find support at $3.60, descending further to $3.56 and possibly settling around $3.52. Technical indicators like the RSI sit at 73, signaling an overbought market, while the MACD suggests potential upward momentum, particularly given its recent crossover.

Furthermore, with the current price surpassing the 50 EMA at $3.63, short-term trends appear bullish. Notably, a symmetrical triangle’s bullish breakout indicates active buying, cementing the positive sentiment.

In essence, maintaining bullish momentum above $3.67 could soon see copper testing the $3.72 resistance.

The Week Ahead: Monetary Policy in Focus with the BoJ, the Fed, and the BoE in Action

The Week Ahead: Monetary Policy in Focus with the BoJ, the Fed, and the BoE in Action

For the Dollar:

Employment costs, consumer confidence, and the housing sector will be in focus on Tuesday. Consumer confidence and employment figures are likely to garner more interest. An upward trend in employment costs and consumer confidence could signal a positive consumption outlook.

On Wednesday, ADP nonfarm employment, JOLTs Job Openings, and manufacturing sector PMI numbers will draw investor attention. JOLTs Job Openings and the ADP numbers will likely influence bets on a Fed interest rate hike.

However, the numbers may have a limited impact on the US dollar. The Fed interest rate decision, rate statement, and press conference will impact the US dollar and the global financial markets. With the markets betting on the Fed leaving rates unchanged, forward guidance will be the key.

Nonfarm productivity and unit labor costs for Q3 and weekly jobless claims need consideration on Thursday. A pickup in productivity and tight labor market conditions could support a more hawkish Fed.

On Friday, the US Jobs Report and ISM Non-Manufacturing PMI survey will wrap up a busy week. Wage growth and the unemployment rate will be focal points. An upward trend in wage growth would fuel consumption and demand-driven inflation, leaving a hawkish Fed rate path to counter.

For the EUR:

German inflation and GDP numbers will kickstart the week for the EUR/USD. Hotter-than-expected inflation numbers and a German economic contraction would test buyer demand for the EUR.

On Tuesday, German retail sales will draw interest. However, Q3 GDP numbers and October inflation figures for the Eurozone will have more impact on the EUR/USD. French GDP and inflation numbers also warrant consideration before the Eurozone data.

On Thursday, Manufacturing PMI numbers will influence buyer appetite for the EUR/USD. The Italian Manufacturing PMI and revisions to PMIs for Germany and the Eurozone need attention.

German trade data and Eurozone unemployment figures will also provide direction on Friday.

Beyond the numbers, ECB commentary requires monitoring. ECB Chief Economist Philip Lane is on the calendar to speak on Thursday. ECB Executive Board members Luis de Guindos (Mon/Tues), Isabel Schnabel (Thurs), Andrea Enria (Mon), and Edouard Fernandez-Bollo (Thurs) will also deliver speeches.

For the Pound:

The Bank of England will put the Pound in the spotlight on Thursday. Recent UK economic indicators may have forced the BoE to leave interest rates unchanged. However, sticky inflation and elevated wage growth remain concerns.

The MPC Meeting Minutes and BoE Governor Andrew Bailey will dictate the impact of the policy decision on the Pound. A decision to leave rates unchanged, with a dovish tone, will pressure the Pound.

Economic indicators also need consideration. UK house prices and Manufacturing PMIs will be in focus on Wednesday. On Friday, revisions to the UK Services PMI will likely impact appetite for the Pound more.

On Friday, BoE Chief Economist Huw Pill is on the calendar to speak. Comments relating to the economy, inflation, and monetary policy need consideration.

For the Loonie:

Canadian GDP figures for August will influence the buyer appetite for the Loonie on Tuesday. On Friday, employment figures also need consideration.

Beyond the numbers, Bank of Canada commentary will garner investor interest. Senior Deputy Governor Rogers and Governor Macklem are on the calendar to speak on Tuesday and Thursday.

Out of Asia:

For the Aussie Dollar:

Retail sales will influence the appetite for the Aussie dollar on Monday. Better-than-expected figures could fuel bets on an RBA rate hike. On Thursday, trade data also needs consideration.

From elsewhere, private sector PMIs from China will impact the AUD/USD pair. The NBS and Caixin Manufacturing PMIs are out on Tuesday and Wednesday before the Caixin Services PMI on Friday.

For the Kiwi Dollar:

The Kiwi dollar sits in the hands of the RBNZ and market risk sentiment. On Wednesday, the RBNZ Financial Stability Report will draw investor interest. RBNZ Governor Orr is also on the calendar to speak on Wednesday.

From elsewhere, the PMI numbers from China also need consideration.

For the Japanese Yen:

The Bank of Japan (BoJ) will impact buyer appetite for the Japanese Yen this week. On Tuesday, the BoJ will deliver its interest rate decision. The markets expect the BoJ to leave interest rates in negative territory. However, revisions to inflation forecasts and forward guidance on monetary policy will garner investor attention.

Upward revisions to inflation forecasts could force the BoJ to signal a possible move away from its ultra-loose monetary policy stance.

Out of China

NBS private sector PMIs will draw investor interest before the Caixin private sector PMIs on Wednesday and Friday. The Caixin Manufacturing (Wed) and Caixin Services PMIs (Fri) will influence market risk sentiment. A pickup in private sector activity would support the view that stimulus measures are effective.