The CPI and Forex: How CPI Data Affects Currency Prices

The CPI and Forex: How CPI Data Affects Currency Prices

What is CPI and why does it matter to forex traders?

The Consumer Price Index, better known by the acronym CPI, is an important economic indicator released on a regular basis by major economies to give a timely glimpse into current growth and inflation levels.

Inflation tracked through CPI looks specifically at purchasing power and the rise of prices of goods and services in an economy, which can be used to influence a nation’s monetary policy.

CPI is calculated by averaging price changes for each item in a predetermined basket of consumer goods, including food, energy, and also services such as medical care.

It is a useful indicator for forex traders due to its aforementioned effect on monetary policy and, in turn, interest rates, which have a direct impact on currency strength. The full utility of knowing how to interpret CPI as a forex trader will be explored below.

CPI release dates

CPI release dates usually occur every month, but in some countries, such as New Zealand and Australia, quarterly. Some nations also offer yearly results, such as Germany’s index. The US Bureau of Labor Statistics has reported the CPI monthly since 1913.

The following table shows a selection of major economies and information about their CPI releases.

Country/jurisdiction Compiling body Frequency of releases
Australia Australian Bureau of Statistics Quarterly
Canada Statistics Canada Monthly
China National Bureau of Statistics of China Monthly
Eurozone European Central Bank Twice monthly
Germany Federal Statistical Office of Germany Monthly, yearly
Italy Istat Monthly
India Ministry for Statistics and Programme Implementation Monthly
Japan Statistics Japan Monthly
UK Monetary Policy Committee Monthly
US US Bureau of Labor Statistics Monthly

Why forex traders should follow CPI data

Understanding CPI data is important to forex traders because it is a strong measure of inflation, which in turn has a significant influence on central bank monetary policy.

So how does CPI affect the economy? Often, higher inflation will translate to higher benchmark interest rates being set by policymakers, to help dampen the economy and subdue the inflationary trend. In turn, the higher a country’s interest rate, the more likely its currency will strengthen. Conversely, countries with lower interest rates often mean weaker currencies.

The release and revision of CPI figures can produce swings in a currency’s value against other currencies, meaning potentially favorable volatility from which skilled traders can benefit.

Also, CPI data is often recognized as a useful gauge of the effectiveness of the economic policy of governments in response to the condition of their domestic economy, a factor that forex traders can consider when assessing the likelihood of currency movements.

The CPI can also be used in conjunction with other indicators, such as the Producer Price Index, for forex traders to get a clearer picture of inflationary pressures.

What to consider when trading forex against CPI data

When using CPI data to influence forex trading decisions, traders should consider the market expectations for inflation and what is likely to happen to the currency if these expectations are met, or if they are missed.

Similar to any major release, it may be beneficial to avoid having an open position immediately before. Traders might consider waiting for several minutes after the release before looking for possible trades, since forex spreads could widen significantly right before and after the report.

Below is a chart displaying the monthly inflation rates for the US. For the latest month, expectations are set at 1.6% inflation compared to last year’s data. If CPI is released higher or lower than expectations this news event does have the ability to influence the market.
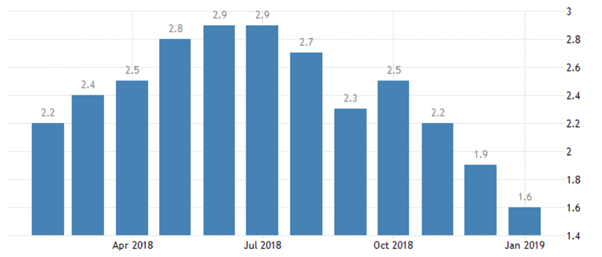
Chart to show US inflation levels in 2018/19. Source: TradingEconomics.com. US Bureau of Labor Statistics

One way the effects of CPI data can be interpreted is by monitoring the US Dollar Index, a 2018/19 example chart for which is below. If CPI is released away from expectations, it is reasonable to believe this may be the catalyst to drive the Index to fresh highs, or to rebound from resistance.

Since the Index is comprised of EUR/USD, USD/JPY, and GBP/USD, by watching the US Dollar we can get a full interpretation of the events outcome.
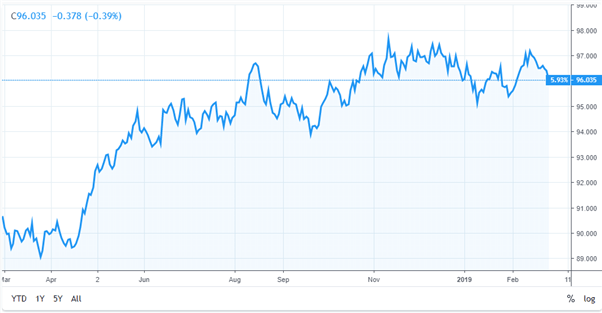
Chart to show movement in the US Dollar Index. Source: TradingView.com

As can be observed in the example above, as inflation rose during the first half of 2018, the US Dollar Index went up accordingly. But with US inflation drifting lower in the following months and with a missed target of 2%, this pushed US interest rate hikes off the agenda. As a result, the dollar struggled and weakened against a basket of other currencies.

Not every fundamental news release works out through price as expected.

Once the CPI data has been released and analyzed, traders should then look to see if the market price is moving through or rebounding off any areas of technical importance. This will help traders understand the short-term strength of the move and/or the strength of technical support or resistance levels, and help them make more informed trading decisions.

 

Fibonacci Confluence on FX Pairs

Fibonacci Confluence on FX Pairs

Italian mathematician Leonardo Fibonacci is credited with finding the Fibonacci sequence in the 13th century, hence the name ‘Fibonacci’. And while his book Liber Abaci introduced the Fibonacci sequence to the western world, traces can actually be found going back as far as 200 BC in Indian mathematics. The sequence is fairly simple: Two numbers added together produce the next value. So 1+1 = 2, and then 1+2 = 3, and then 2+3 = 5, 5+3 = 8, and so on. The first 22 values of the Fibonacci sequence are printed below:

1, 1, 2, 3, 5, 8, 13, 21, 34, 55, 89, 144, 233, 377, 610, 987, 1597, 2584, 4181, 6765, 10946, 17711

This starts to get interesting once we look at the numbers relationship within the sequence to each other. If we take a value and divide by the preceding value, we will get a number approximately close to 161.8%. So, each number in the sequence is 161.8% greater than the prior value after we get out of the initial portion of the sequence (after the value of 89). This is the Golden Ratio of 161.8%.

17711/10946 = 1.61803

10946/6765 = 1.61803

6765/4181 = 1.61803

What struck Fibonacci almost a thousand years ago and the same thing that amazed a thousand years before that is how widely this ratio, and this sequence can be found in the world around us. In Liber Abaci, Fibonacci used the mating cycle of rabbits as an example, showing how rabbit populations in isolation would grow according to the numerical sequence of 1, 1, 2, 3, 5, 8, 13, etc. But this is just the tip of the iceberg, the number of flower petals will often follow the sequence: Lilies have three petals while buttercups have five, chicory’s have 21 and daisies have 34. Each petal is placed at .618 per turn in order to allow for maximum sunlight. Tree branches, in the way that trunks split and in the way that branches will grow, display the Fibonacci sequence. Shells, hurricanes – even human faces adhere to the Golden ratio in a geometric spiral pattern.

Right now, you can look down at your right arm to notice that you probably have eight fingers, five on each hand, three bones in each finger, two bones in each one thumb and one thumb on each hand. Oh – and the ratio between your forearm and hand – that probably applies by the Golden ratio, as well.

Applicability to Markets

While the application of Fibonacci in nature keeps many graduate level mathematics students busy, traders have more pressing concerns: Applying the study to financial markets. In its most common form, Fibonacci is the use of the golden ratio in support and resistance analysis. So, plot a significant move, draw a line at 61.8% of that move, and we have an area to watch for a possible retracement to find support. The reciprocal of .618 is .382, so this gives us another value to work with at the 38.2% level.

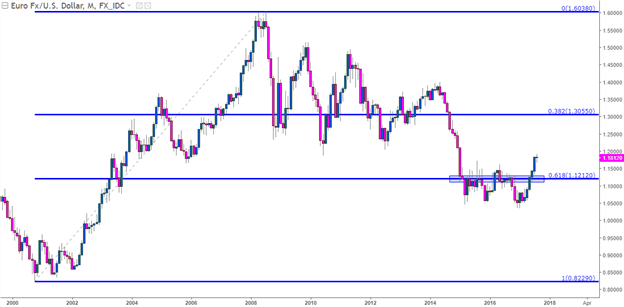
On the chart below, we’re looking at the lifetime move in EUR/USD, taking the low in the year 2000 up to the high in 2009. We start at the beginning of the move and draw the retracement to the top, and 38.2% of the way-down we can see the retracement at 1.3056. We can also see the 61.8% retracement of this move at 1.1212. Notice how this level helped to set resistance in the pair for 15 out of 30 months after the level came into play in January of 2015. As EUR/USD was dropping like a rock in anticipation of ECB QE coming online in a few short months, we caught support at this level on the way down in January of 2015; but after that we had eight consecutive months of resistance showing at or around this key 61.8% retracement level.

EUR/USD Monthly: 15 of 30 Months with Resistance at 61.8% Retracement, 3 Months of Support

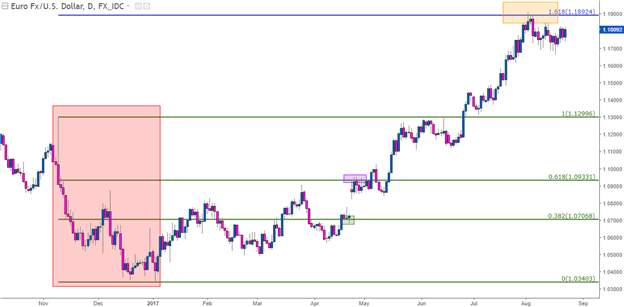
The past few months have been quite the wild ride for EUR/USD. After a rather threatening drop around the U.S. Presidential Election leading into the start of 2017 (shown in red below), the pair put in an aggressive reversal as bulls have run amok. But – when prices were in the process reversing from the prior bearish mode into a more bullish state, the 38.2% retracement of the post-Election move showed up as a bit of support (shown in green) before the 61.8% retracement provided a bit of resistance (indicated with purple). After prices broke above those highs and ran with reckless abandon, resistance has begun to show at the 161.8% extension of that move (orange box).

EUR/USD Daily: Fib Applied to recent move in EUR/USD, 161.8 Extension Providing Resistance

Taking it a Step Further

Levels found at 61.8 and 38.2% retracements can be valuable for traders, and this can be seen on major moves of all stripes and flavors. This can be applied on short-term charts just like long-term charts, but as is usually the case in technical analysis, longer-term studies will have a tendency to be a bit more consistent given the larger number of opinions over the greater evaluation period.

But we can go a step further with Fibonacci analysis. Earlier, we shared that .382 is the reciprocal of .618, and this is true – but this isn’t the only relevance behind .382. If we take any number in the sequence after the initial set of values, and divide it by the value two places further in the sequence – we will have .382 or 38.2%.

13/34 = .382

21/55 = .3818 – rounded up to .382

34/89 = .382

55/144 = .3819

But we can go even a step further by dividing a value in the sequence by the value three places later to consistently arrive at a value of 23.6.

13/55 = .2363

21/89 = .2359

34/144 = .2361

55/233 = .2361

This gives us another retracement value to work with of 23.6%. So, now we have the 23.6, 38.2 and 61.8% retracement levels to apply in the effort of finding support and/or resistance.

We’re not done yet: We can still take this a step further. With 23.6, 38.2 and 61.8% retracement levels, the study will be rather uneven with two values in one half of the retracement and only one in the latter half. This has elicited creativity across market participants, as many will simply take the reciprocal of 23.6 and apply that as a level, as well. This would be the 76.4% retracement, which doesn’t have any actual Fibonacci relevance behind it. But – at .786 we have an interesting number to work with, as this is the square root of .618, and can be a potentially more attractive stand-in to .764.

This now gives us four values across the chart, and out of practice, many traders will apply a mid-line at 50% which, again, has no actual Fibonacci value; but that observation is far less important to traders than the fact that other traders and analysts have it on their chart and, hence, may respond to it.

This now gives us five values to work with when applying Fibonacci retracements to trading analysis: 23.6, 38.2, 50, 61.8 and 78.6 (or 76.4).

Putting it All Together

As previously noted, the purpose of this analysis is not to show us what will definitely happen in the future. No form of analysis can bring that, whether it’s based on Fibonacci, Astrology or Psychological levels. The value in support and resistance identification is in the ability to manage risks with trading setups. If prices are trending higher, fantastic, then look to buy support so that if the up-trend does break-down, you can get out at a minimum of a loss, all in the effort of mitigating the damage when markets inevitably turn-around. But if that up-trend does continue, bingo, you’re in a great spot to manage a winning position.

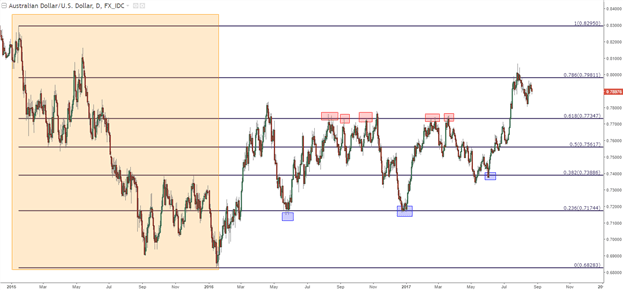
The key to applying Fibonacci retracements is to find a workable major move, and then to allow price action to be the guide in how each level should be approached. On the daily chart of AUD/USD below, we’re looking at a Fibonacci retracement applied to a previous bearish move. The 2015 high drawn down to the 2016 low is shown in orange below, and we’ve used red and blue boxes to highlight a few of the more prominent instances of resistance or support to have developed off of these intervals.

Notice that while the above chart is far from perfect in the fact that it did not catch every point of support or resistance, it did show quite a few. As we discussed in our last article, the prospect of confluence can incorporate levels from different styles of analysis, such as psychological whole numbers.

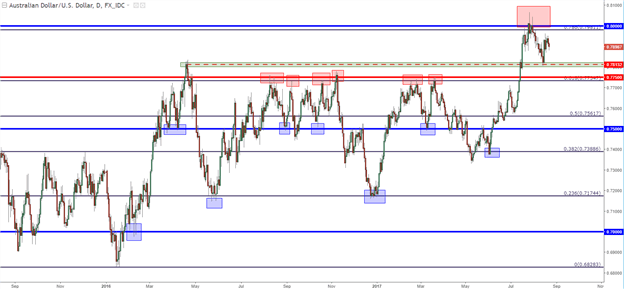
On the below chart of AUD/USD, we took the same Fibonacci retracement above and added in levels for the psychological levels at .7000, .7500 and .8000, along with a price action swing indicated with a green box. Notice, that while we don’t catch every top or bottom, we catch quite a few of them with these very simple forms of analysis. And that resistance that held in the pair around the 61.8% retracement, that level is confluent with the .7750 psychological level, and this is likely why that level was so difficult for bulls to break through.

AUD/USD Daily: Confluence of Support and Resistance

Swiss National Bank Cuts Rates, Cites Strong Franc as it Looks to Fuel Growth

Swiss National Bank Cuts Rates, Cites Strong Franc as it Looks to Fuel Growth

Swiss National Bank (SNB) Voted to Lower the Interest Rate by 25 Basis-Points

The SNB voted to lower interest rates by 25 basis points to set the policy rate at 1.25%. The rate cut was expected by the majority of the market but there was a notable outside chance that the Bank may decide to hold given the phenomenal drop in inflation and firm wage growth that revealed few, if any, signs of abating.

image1.png

Chairman Jordan referred to the recent appreciation of the franc being due to political uncertainty. A stronger local currency makes Swiss exports more expensive to its trading partners and can weigh on growth. Jordan also communicated the Banks commitment to intervene in the FX market in any direction, if deemed necessary. The announcement resulted in a drop in the value of the franc.

Learn how to prepare for high impact economic data or events with this easy to implement approach:

Swiss Inflation – The Envy of Developed Markets

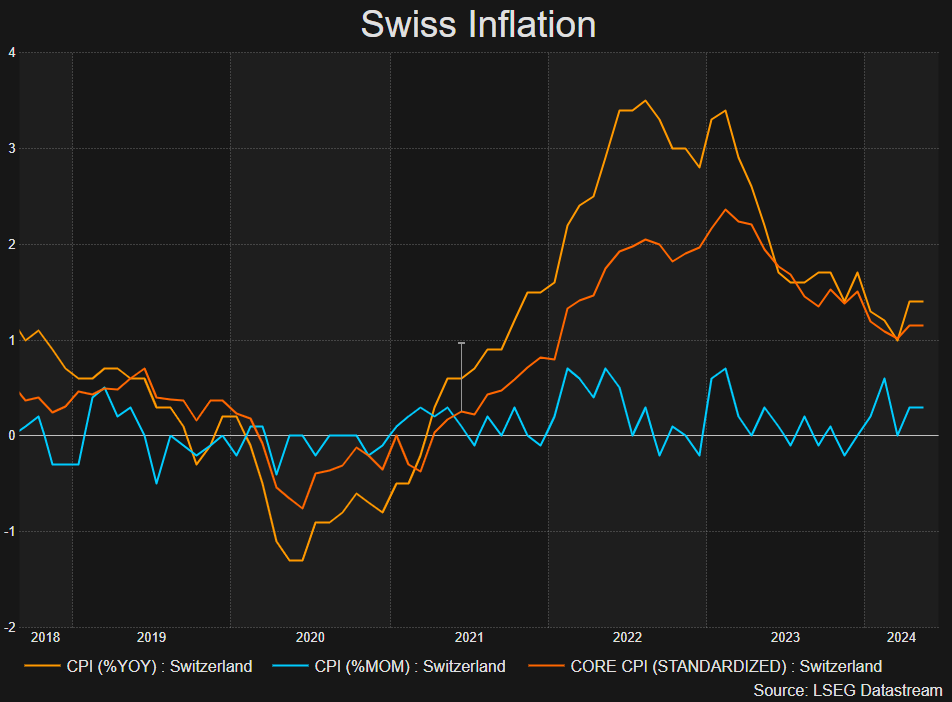
Swiss inflation remains comfortably beneath the 2% target, remaining at 1.4% for a second month in a row as other countries like the US and the EU are yet to achieve the feat. Just yesterday, the UK managed to hit the Bank of England’s 2% target but unlike Switzerland, UK inflation is expected to remain above 2% for some time thereafter.

Swiss Inflation (Headline and Core Measures of CPI)

image2.png

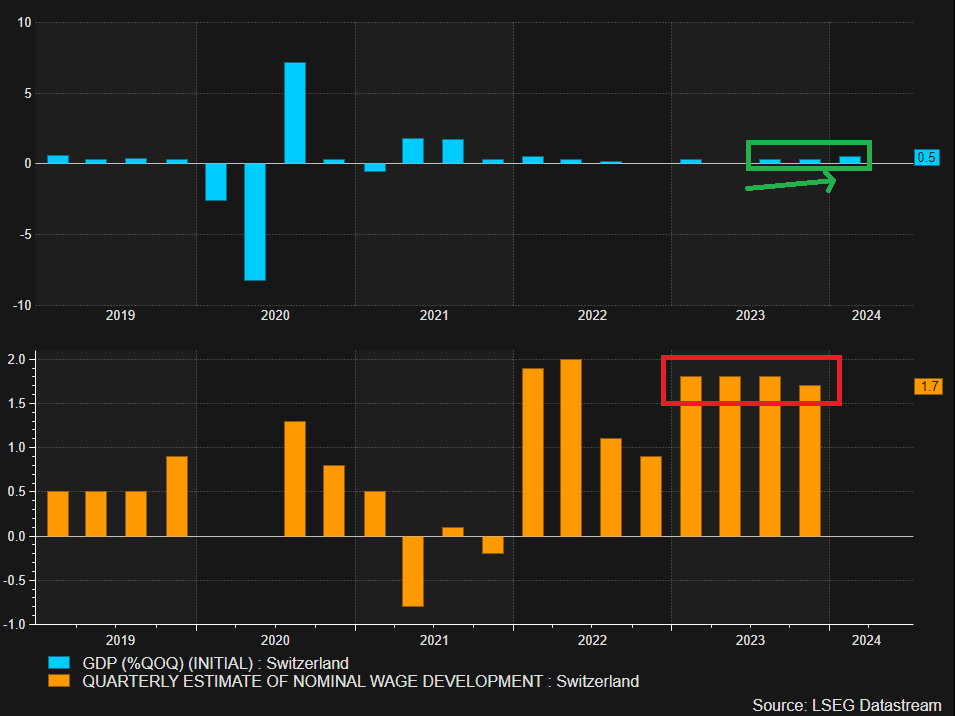
Swiss GDP and Wage Growth Gave SNB Hawks a Reason to Hold

Early signs of an economic recovery in Switzerland have been building, suggesting that rates are not too restrictive to hamper growth. In addition, wages in Switzerland had shown resilience, holding at 1.8% for three quarters in a row, only dropping marginally in Q4 2023 to 1.7%. These developments provided some uncertainty around the decision with many of the view the Bank might have held rates steady.

GDP Showing Green Shoots and Wage Pressures Hold Firm

image3.png

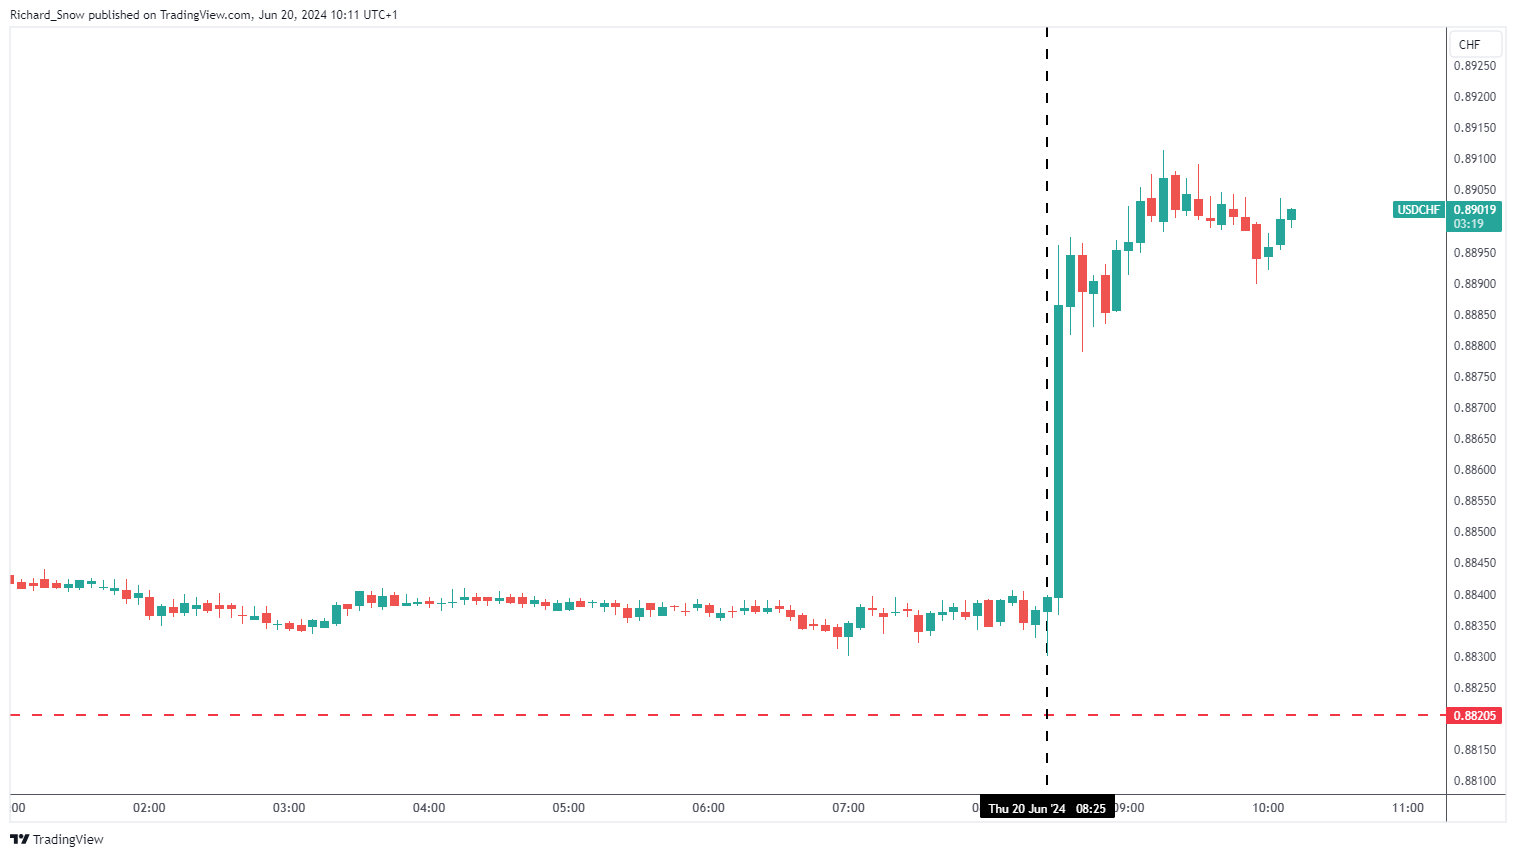
USD/CHF Immediate Market Reaction and Outlook

With many market participants holding out for an unchanged interest rate announcement today, its unsurprising to see a sharp repricing in the franc (weakness) as USD/CHF climbed 67 pips in the aftermath.

USD/CHF 5-Minute Chart

image4.png

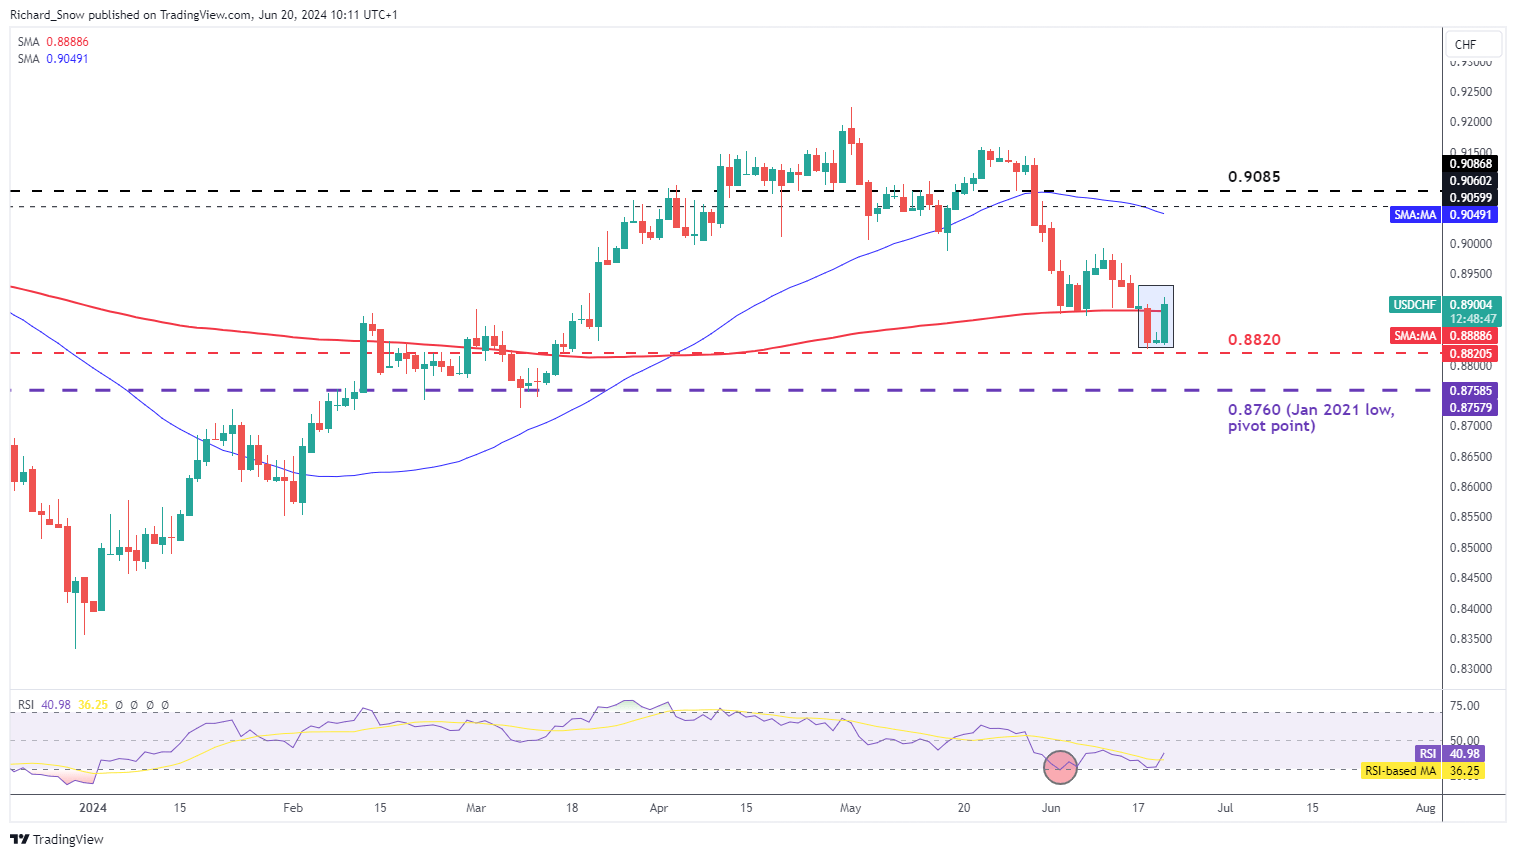
The weaker franc presents a potential reversal formation unfolding at the moment. Should price action close for the day around current levels, the three-day candle formation could be likened to that of a morning star – a typically bullish reversal pattern. The one concern here is the longevity of bullish drivers around the dollar. Hawkish revision to the Fed’s inflation forecast sent the greenback sharply higher but with inflation appearing on track for 2%, markets may soon price in a rate cut as early as Q3. US PCE data next week will help provide direction for the dollar and either confirm or invalidate CPI improvements.

USD/CHF Daily Chart

image5.png


EUR/USD and EUR/GBP Latest Retail Sentiment Analysis

EUR/USD and EUR/GBP Latest Retail Sentiment Analysis

EUR/USD – Mixed Outlook

According to the latest IG retail trader data, 54.49% of traders hold a net-long position, with the ratio of long to short traders at 1.20 to 1. The number of net-long traders has decreased by 0.84% compared to the previous day but has increased by 34.83% compared to last week. On the other hand, the number of net-short traders has increased by 7.36% from yesterday but has decreased by 4.00% from last week.

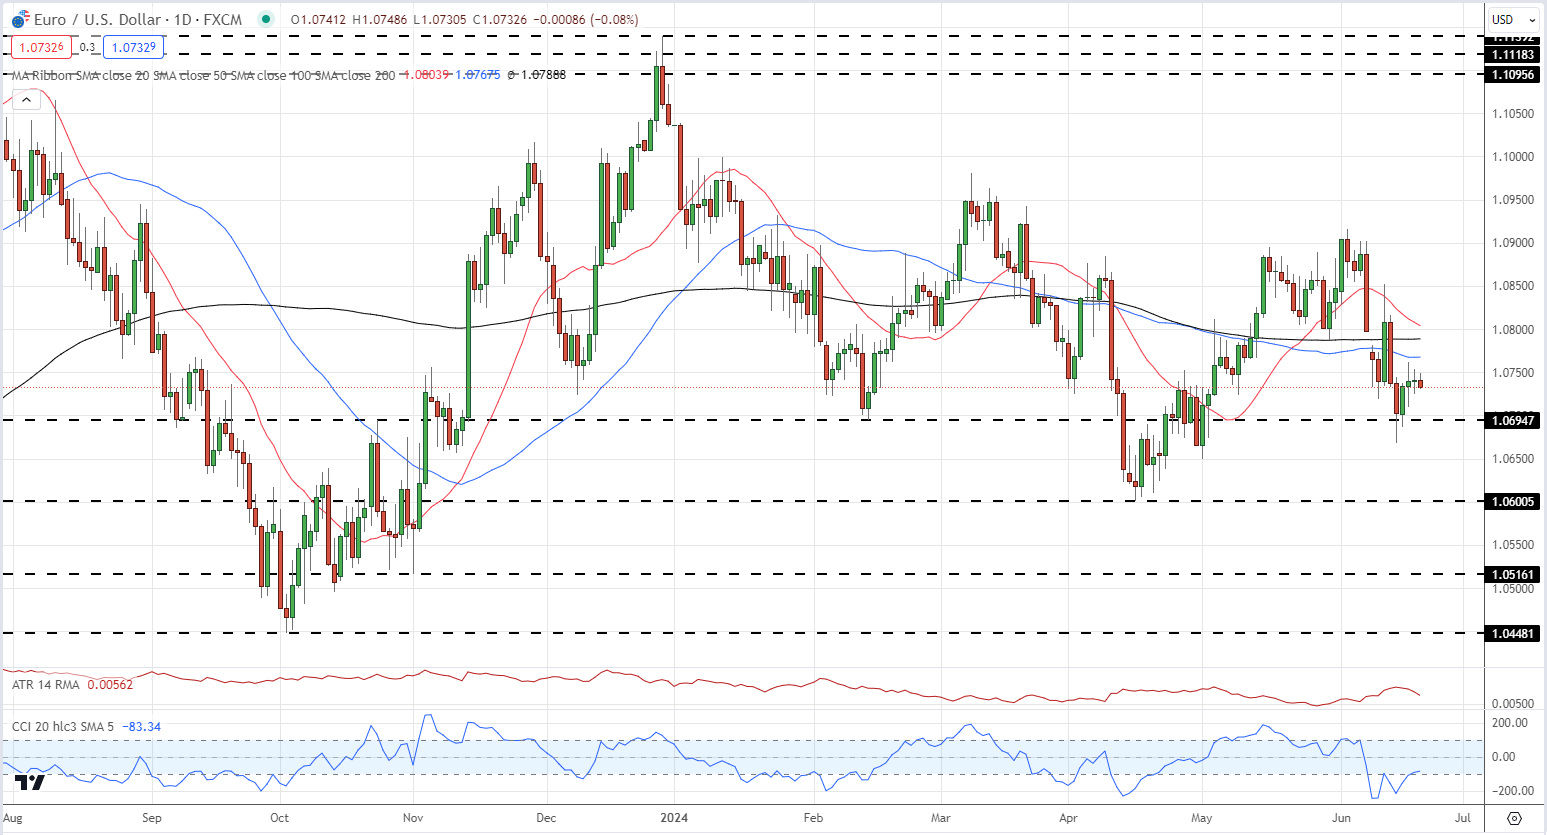
Our approach typically contrasts with crowd sentiment, and the fact that traders are net-long suggests that EUR/USD prices may continue to fall. However, the current positioning is less net-long than yesterday but more net-long compared to last week. This combination of current sentiment and recent changes presents a mixed trading bias for the EUR/USD pair.

EUR/USD Daily Price Chart

image1.png

EUR/GBP – Traders Heavily Long

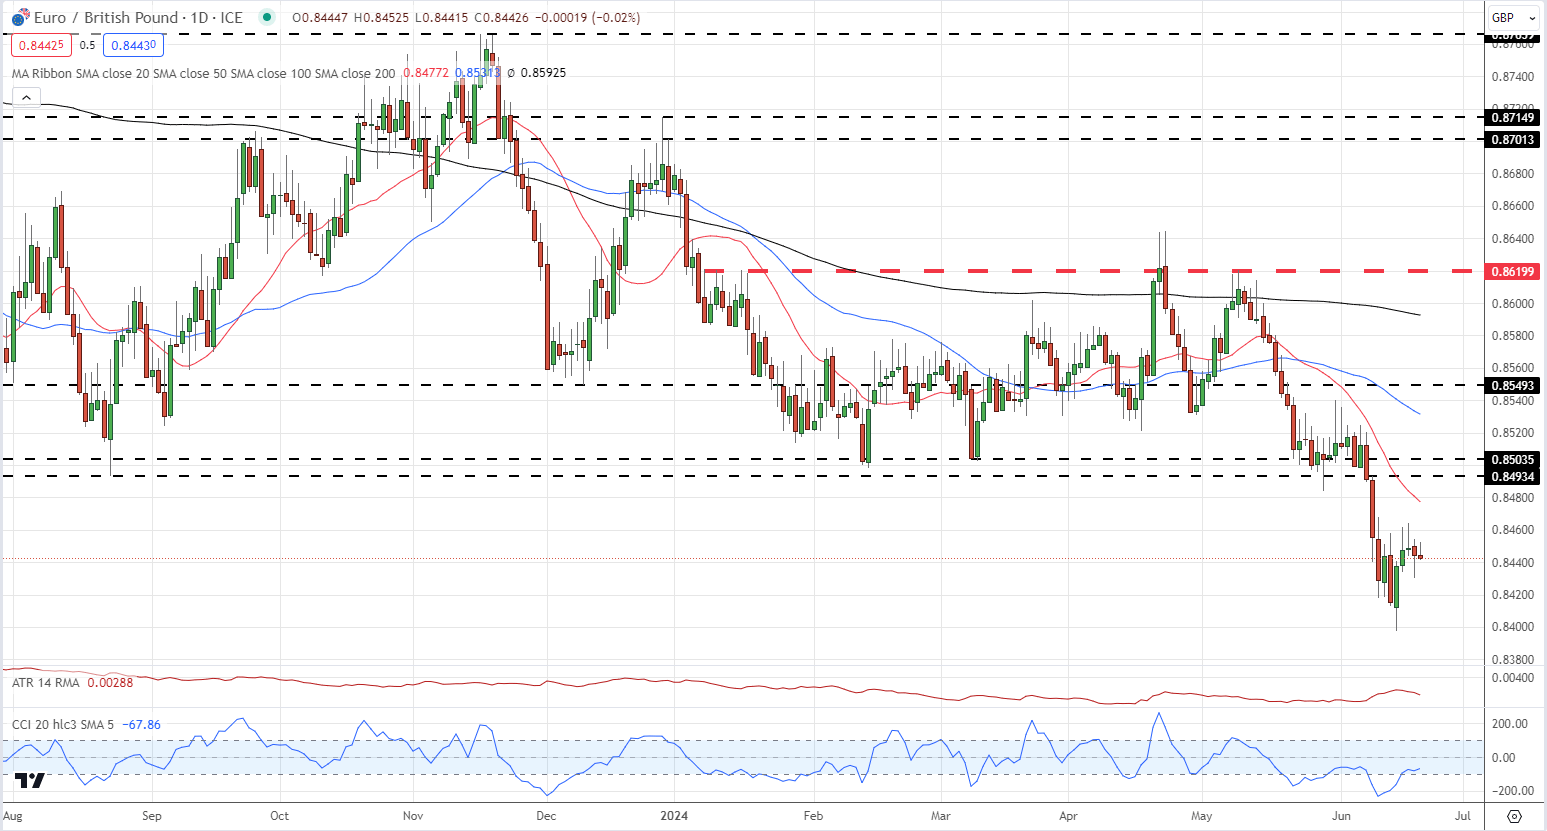
The latest IG retail trader data reveals that 73.13% of traders are maintaining a net-long position, with the ratio of long to short traders standing at 2.72 to 1. While the number of net-long traders has increased by 1.73% compared to the previous day, it has decreased by 6.71% from last week. In contrast, the number of net-short traders has decreased by 3.00% from yesterday but has increased by 48.09% from last week.

Our strategy typically involves taking a contrarian view to crowd sentiment, and the fact that traders are net-long suggests that EUR/GBP prices may continue to decline. However, the positioning is more net-long than yesterday but less net-long compared to last week. This combination of current sentiment and recent changes presents a mixed trading bias for the EUR/GBP pair.

EUR/GBP Daily Chart

image2.png

The Swiss National Bank: A Forex Trader’s Guide

The Swiss National Bank: A Forex Trader’s Guide

What is the SNB?

The Swiss National Bank was established in 1907. It is responsible for the monetary policy of Switzerland and issues Swiss Franc banknotes. As of 2015, the Swiss National Bank is privately owned with most shares belonging to the Swiss Cantons. Like other central banks, the SNB uses different monetary policy tools to bring about price stability and take account of economic developments.

The factor that holds the most importance to traders is monetary policy, which we will explain in depth in this article. Other factors, like the independence of the central bank are also important but are more prevalent issues in emerging market economies.

Key Economic Mandates of the Swiss National Bank

According to the Swiss National Bank, their primary goals are:

1. Price stability – which is stability of the exchange rate and/or inflation

2. Economic development – which is focus of development and stability of the economy

Price Stability

Monetary policy is extremely important for the entire economy. It prevents runaway inflation and attempts to ground inflation expectations so that the economy can grow at a regular pace. In order to maintain price stability, the Swiss National Bank and their monetary policy committee (MPC) have set an inflation target of less than 2% for CPI per annum.

If inflation goes above the target of 2%, the Swiss National Bank may have to increase interest rates. The increase in interest rates may cause an appreciation in the Swiss Franc (CHF) as investors increase capital flows into the higher yielding currency. It may also have a negative effect on the stock market, as businesses will have to pay higher rates to lend and equity valuations will be discounted at a higher interest rate. Monetary policy data can be found on our economic calendar.

However, it is not always the case that the Swiss National Bank will increase interest rates if inflation is above target. In some cases, like when GDP growth is still low or negative, the Swiss National Bank may keep interest rates low to stimulate the economy. It is important to understand that the Swiss National Bank will be looking for a balance between healthy inflation and economic growth.

Join our central bank webinar to watch our senior currency strategist discuss and analyze current central bank trends.

Economic developments are intertwined with monetary policy. Changes in economic outlook often cause central bankers to update their monetary policy plans in order to stabilize the economy.

How SNB interest rates affect the Swiss Franc (CHF)

The Swiss National Bank can affect the value of the Swiss Franc through changes in interest rate expectations. Traders should understand that currencies appreciate/depreciate when interest rate expectations increase/decrease, not just from increases in the nominal interest rate.

The Swiss Central Bank, like most central banks, use different monetary policy tools to control the interest rate. The forex market normally prices in current interest rate expectations, changes in these expectations can cause the Swiss Franc to depreciate or appreciate. The Swiss National Bank can do this by giving the market forward guidance (telling the market) that they expect further hikes or less hikes (or cuts) in the future.

The general principle for how interest rates affects the Swiss Franc and the stock market are given below:

  1. Higher interest rate expectations increase the strength of the Swiss Franc and negatively affect equity values.
  2. Lower interest rate expectations decrease the strength of the Swiss Franc and positively affect equity values.

Interest rate impact on the economy

The Swiss National Bank lowers interest rates when it is trying to stimulate the economy (GDP) and increases interest rates when it is trying to contain inflation caused by an economy operating above potential (overheating).

Lower interest rates stimulate an economy in a few ways:

  1. Businesses can borrow money and invest in projects that will receive more than the risk borrowing rate.
  2. When interest rates are lower the stock market is discounted at a lower rate, leading to an appreciation in stock market values which causes a wealth effect.
  3. People invest their money into the economy (stocks and other assets) because they can earn more in these assets than at currently low interest rates.

How to trade SNB interest rate decisions

The table below displays the possible scenarios that come from a change in interest rate expectations, traders can use this information to forecast if the currency is likely to appreciate or depreciate and how to trade it.

Market expectations Actual Results Resulting FX Impact
Rate Hike Rate Hold Depreciation of currency
Rate Cut Rate Hold Appreciation of currency
Rate Hold Rate Hike Appreciation of currency
Rate Hold Rate Cut Depreciation of currency

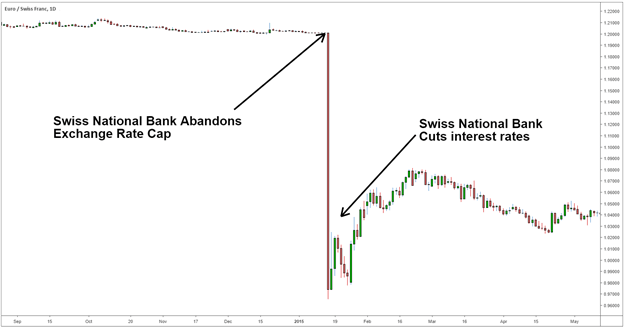
Let’s look at the example below on the EUR/CHF. In 2015 the Swiss National Bank took the market by surprise by abandoning an exchange rate cap on the Swiss Franc. The Swiss Franc, which was capped to the EUR at 1.2 francs per Euro appreciated around 20% initially, policy makers then began to cut interest rates leading to a depreciation of the Swiss Franc.

Swiss National Bank removes currency peg


A Price Action Tell: Support at Prior Resistance, Resistance at Prior Support

A Price Action Tell: Support at Prior Resistance, Resistance at Prior Support

PRICE ACTION SUPPORT AND RESISTANCE

As discussed throughout our education section, there’s a plethora of ways to find support and resistance levels. Fibonacci is a popular tool and psychological levels can carry some significant weight. But, if markets don’t acknowledge that support or resistance – what is its point? There isn’t one, right? The only utility for support and resistance is the ability to highlight something that may happen, while allowing the trader to adopt an objective framework for their own activity within a market.

As we looked at in our Price Action Support and Resistance article, there’s a couple of primary ways to use prior price action to find actionable levels to work with. But we also ended by saying that there’s one more way that traders can incorporate prior price movements in the effort of finding support and resistance, and that’s by incorporating older levels that may come back into the picture.

Support and Old or Prior Resistance

When in an up-trend, prices will often ebb and flow with a general bias towards the ebbing as opposed to the flowing. And when prices do pullback, traders are often looking for that point with which it becomes attractive again to buy. One possible reference point – prior swing-highs or prior points of resistance. And, in the case of down-trends, prior swing-lows or points of support as potential resistance. Let’s look at an example in GBP/USD to illustrate.

Each of the blue lines below indicate an area of prior resistance that came into play as support. And red lines indicate an area of support that’s come into the picture as resistance.

GBP/USD Weekly Price Chart

Price Action Support resistance

Chart prepared by James Stanley; GBP/USD Weekly chart, Oct 2019 – April 2022

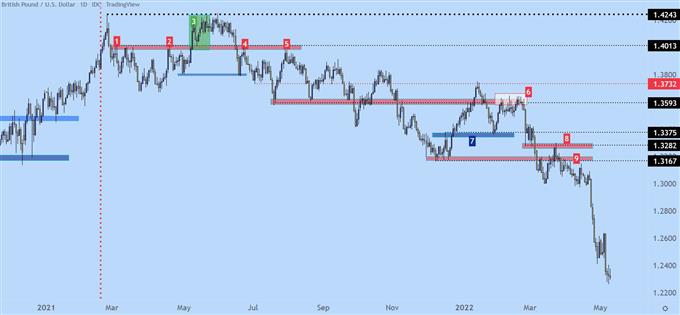
Let’s get a bit more granular with this situation, using the below chart. We’ll begin with the red vertical line, after which price action puts in a swing at the 1.4013 level (marked as ‘1’ on the below chart). You can see multiple wicks on the daily chart in the red box accompanying that line, and this is highlighting a resistance reaction that holds from early-March through the May open (marked as ‘2). That resistance offered a few different inflections but buyers eventually break through, indicated by the green box in early-May (marked as ‘3’).

But, buyers are thwarted at the same exact level that had come into play a few months earlier, plotted at 1.4243, and after bulls failed to breakthrough, sellers eventually take control and elicit a breakdown back-below the 1.4013 price. Buyers push down to the purple box, around 1.3800, before a bounce develops and that sends prices right back into that same zone of resistance (marked as ‘4’).

That inflection leads to another fresh low, around the 1.3600 area, but sellers still don’t have full control, as price pushes back up to that same resistance zone but fails to get all the way there. This is a lower-high, and indication that sellers were on the sidelines and unwilling to wait for price to test the high. They enter a bit earlier, and this leads to a lower high before sellers swing a bit more aggressively (marked as ‘5’).

GBP/USD Daily Price Chart (2021 – Feb 2022)

Price Action Tell image 2

Chart prepared by James Stanley; GBP/USD Daily chart, Jan 2021 – March 2022

After that second resistance reaction (marked by ‘5’ above), sellers push price right back to support, which isn’t ready to give way yet. That happens a couple of months later.

But, perhaps more importantly, in early 2022 trade, that same zone around the 1.3600 handle becomes a massive spot of resistance. This gyration has now taken six months but there’s still a discernible bearish bias as indicated by the lower-highs. But, notably, notice how intense the resistance reaction is in the white box on the right side of the chart (marked as ‘6’). This took almost three weeks to resolve but, once it did, prices started a sell-off that ran for a long time. Along the way there were more items of short-term resistance coming in as support (marked as ‘7’) and prior items of support coming in as resistance (marked as ‘8’). In box 9, I wanted to highlight the build of lower-highs, below box 8 as that prior swing was continuing to help form some resistance.

GBP/USD Daily Price Chart (2021 – May 2022)

price action tell part 3

Top 5 Types of Doji Candlesticks

Top 5 Types of Doji Candlesticks

Types of Doji: The Patterns All Traders Should Know

A Doji candlestick signals market indecision and the potential for a change in direction. Doji candlesticks are popular and widely used in trading as they are one of the easier candles to identify and their wicks provide excellent guidelines regarding where a trader can place their stop.

In this article we explain how Doji patterns are formed and how to identify five of the most powerful and commonly traded types of Doji:

  1. Standard Doji
  2. Long legged Doji
  3. Dragonfly Doji
  4. Gravestone Doji
  5. 4-Price Doji

types of doji candlesticks

How are Doji candlestick patterns formed?

Dojis are formed when the price of a currency pair opens and closes at virtually the same level within the timeframe of the chart on which the Doji occurs. Even though prices may have moved between the open and the close of the candle; the fact that the open and the close takes place at almost the same price is what indicates that the market has not been able to decide which way to take the pair (to the upside or the downside).

Keep in mind that the higher probability trades will be those that are taken in the direction of the longer-term trends. When a Doji occurs at the bottom of a retracement in an uptrend, or the top of a retracement in a downtrend, the higher probability way to trade the Doji is in the direction of the trend. In case of an uptrend, the stop would go below the lower wick of the Doji and in a downtrend the stop would go above the upper wick.

doji formation

Top 5 Types of Doji Candlestick Patterns

1. Standard Doji pattern

A Standard Doji is a single candlestick that does not signify much on its own. To understand what this candlestick means, traders observe the prior price action building up to the Doji.

standard doji

Trades based on Doji candlestick patterns need to be taken into context. For example, a Standard Doji within an uptrend may prove to form part of a continuation of the existing uptrend. However, the chart below depicts a reversal of an uptrend which shows the importance of confirmation post the occurrence of the Doji.

standard doji

2. Long-legged Doji

The Long-Legged Doji simply has a greater extension of the vertical lines above and below the horizontal line. This indicates that, during the timeframe of the candle price action dramatically moved up and down but closed at virtually the same level that it opened. This shows the indecision between the buyers and the sellers.

long-legged doji

At the point where the Long-Legged Doji occurs (see chart below), it is evident that the price has retraced a bit after a fairly strong move to the downside. If the Doji represents the top of the retracement (which we do not know at the time of its forming) a trader could then interpret the indecision and potential change of direction. Subsequently looking to short the pair at the open of the next candle after the Doji. The stop loss would be placed at the top of the upper wick on the Long-Legged Doji.

long legged doji

3. Dragonfly Doji

The Dragonfly Doji can appear at either the top of an uptrend or the bottom of a downtrend and signals the potential for a change in direction. There is no line above the horizontal bar which creates a ‘T’ shape and signifies that prices did not move above the opening price. A very extended lower wick on this Doji at the bottom of a bearish move is a very bullish signal.

dragonfly dojidragonfly doji

4. Gravestone Doji

The Gravestone Doji is the opposite of the Dragonfly Doji. It appears when price action opens and closes at the lower end of the trading range. After the candle open, buyers were able to push the price up but by the close they were not able to sustain the bullish momentum. At the top of a move to the upside, this is a bearish signal.

gravestone dojigravestone doji

5. 4 Price Doji:

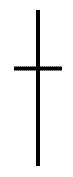
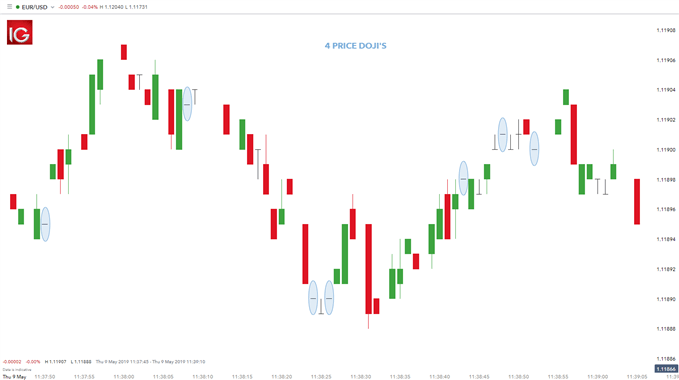
The 4 Price Doji is simply a horizontal line with no vertical line above or below the horizontal. This Doji pattern signifies the ultimate in indecision since the high, low, open and close (all four prices represented) by the candle are the same. The 4 Price Doji is a unique pattern signifying once again indecision or an extremely quiet market.

4 price dojiprice doji

UK Inflation Hits Bank of England Target – What Now?

UK Inflation Hits Bank of England Target – What Now?

UK CPI Hits Bank of England Target

Headline CPI drops to the Bank of England’s target of 2% for the first time in nearly 3 years. This is an impressive feat given how high inflationary pressures rose at their peak. The decline has been led by falling goods inflation and markedly lower energy prices.

image1.png

Customize and filter live economic data via our DailyFX economic calendar

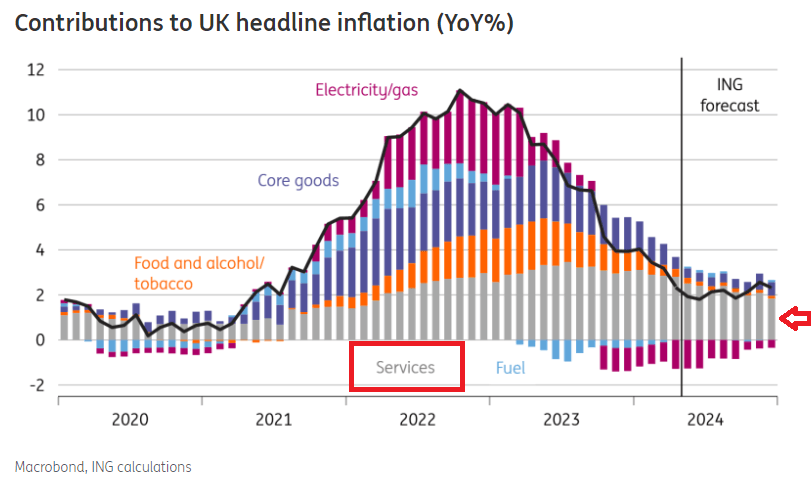
With inflation seemingly under control, why isn’t the Bank of England’s Monetary Policy Committee (MPC) falling over themselves to lower the bank rate? The answer lies mostly within a subset of the broader inflation print – services inflation – which remains uncomfortably high.

Learn how to prepare for high impact economic data or events with this easy to implement approach:

The chart below shows how other contributors to the CPI headline figure have fallen with some measures like fuel and electricity/gas turning negative (deflationary) on a year-on-year basis. However, services inflation (grey histograms) have shown little progress and remain at elevated levels – threatening the overall inflation outlook.

image3.png

The chart below shows the little progress made in the services sector with both average wages and services CPI having made tiny inroads but appear to be heading in the right direction. Therefore, ahead of tomorrow’s Bank of England rate decision, there may be a nod to a future rate cut but the committee is likely to point to this stubborn stickiness of services inflation for its lack of urgency to alter interest rates.

image4.png

Source: Refinitiv, Fathom Consulting

Markets assign around 5% chance of a cut after tomorrow’s BoE statement, with a greater chance of a move in September.

Implied Interest Rate Path in Basis Points

image5.png

Source: Refinitiv, prepared by Richard Snow

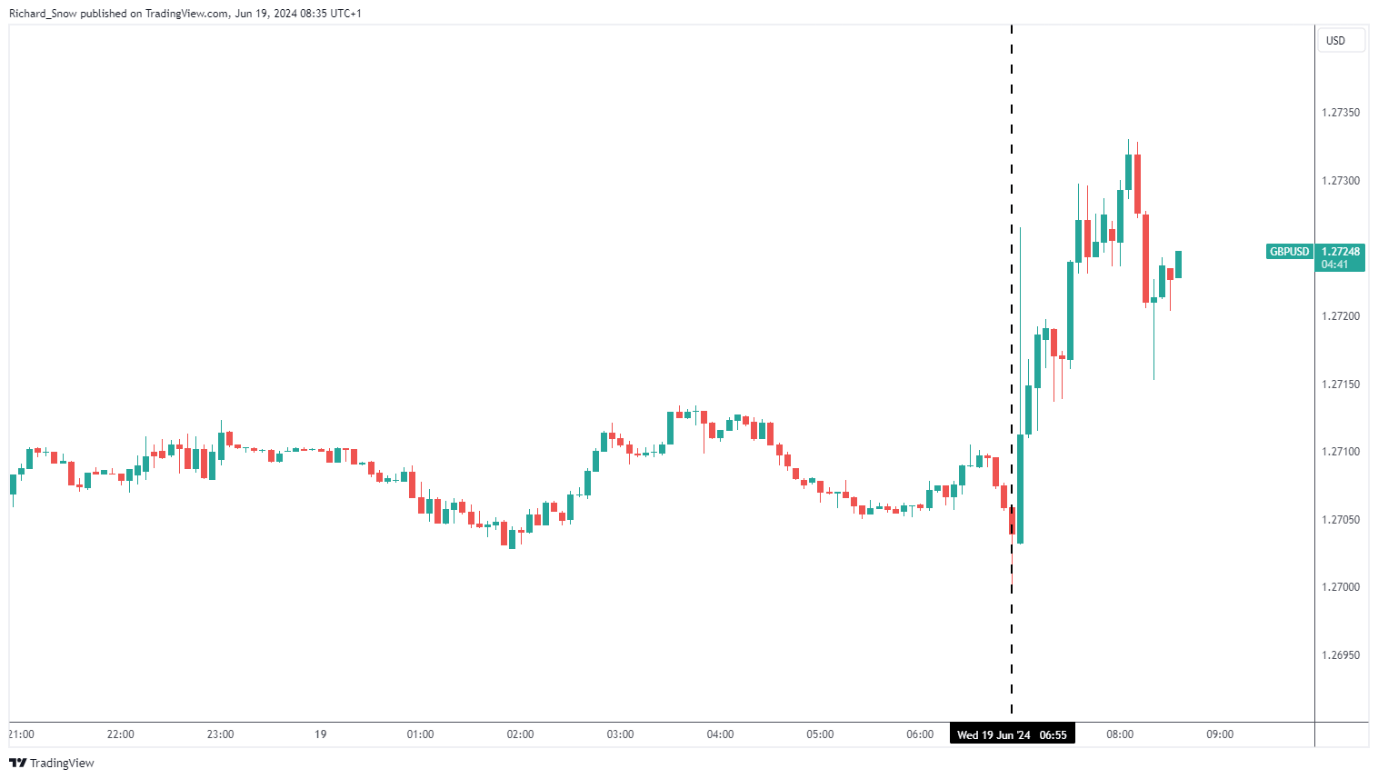
On the back of the stubborn services inflation print, GBP/USD rose a tad in the minutes after the release.

image6.png

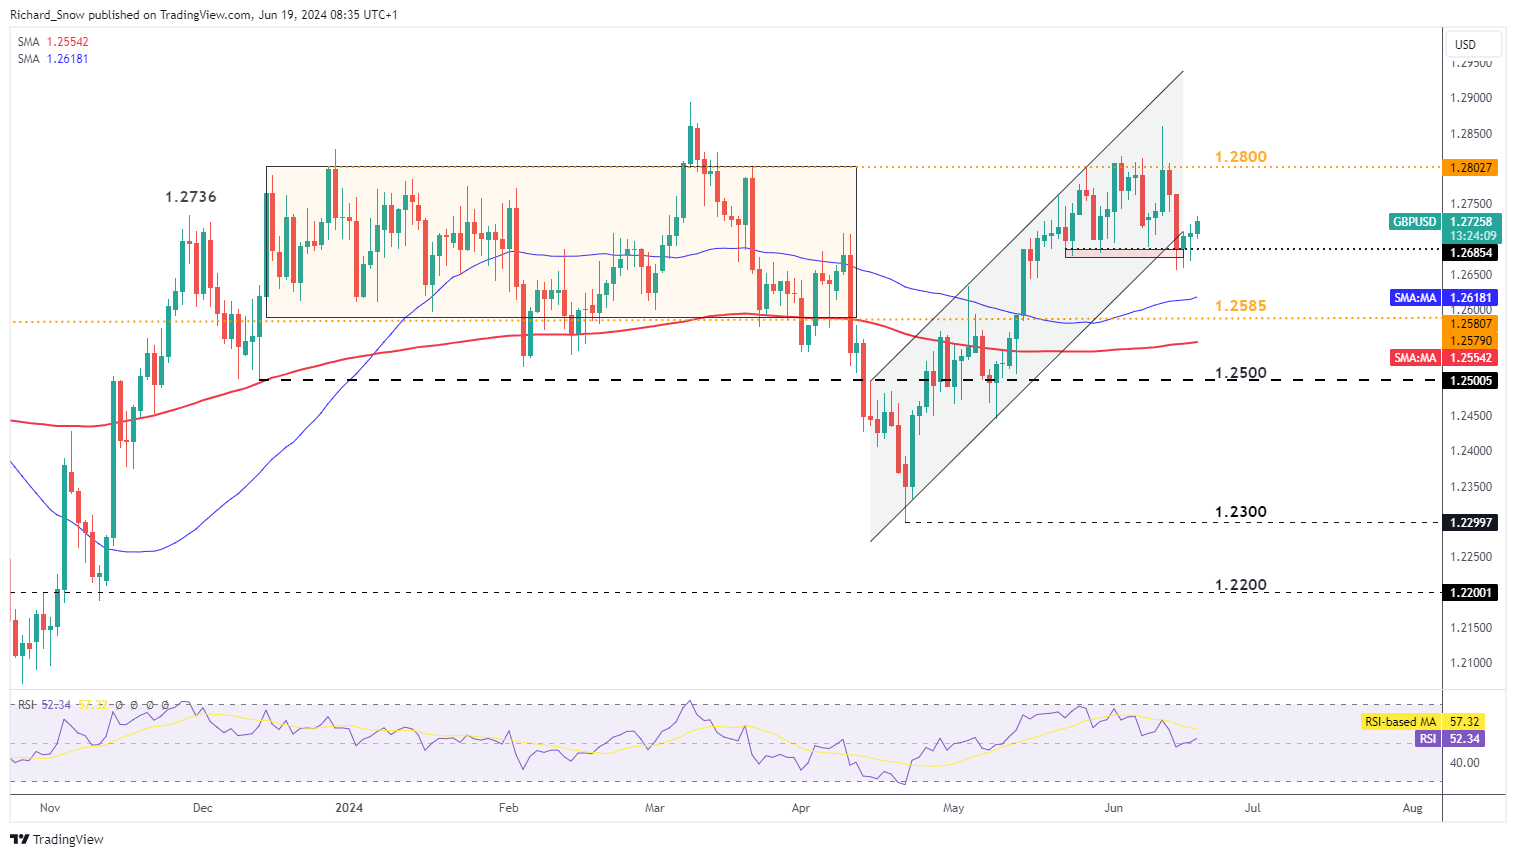
GBP/USD continues to edge higher after hawkish revisions to last week’s Fed projection for inflation and growth jolted the dollar back into life. The pair appears to have found support around 1.2685 ahead of the BoE meeting with 1.2800 the next notable level of resistance.

GBP/USD Daily Chart

image7.png


Supply and Demand Trading: A Forex Trader’s Guide

Supply and Demand Trading: A Forex Trader’s Guide

Supply and demand trading explained

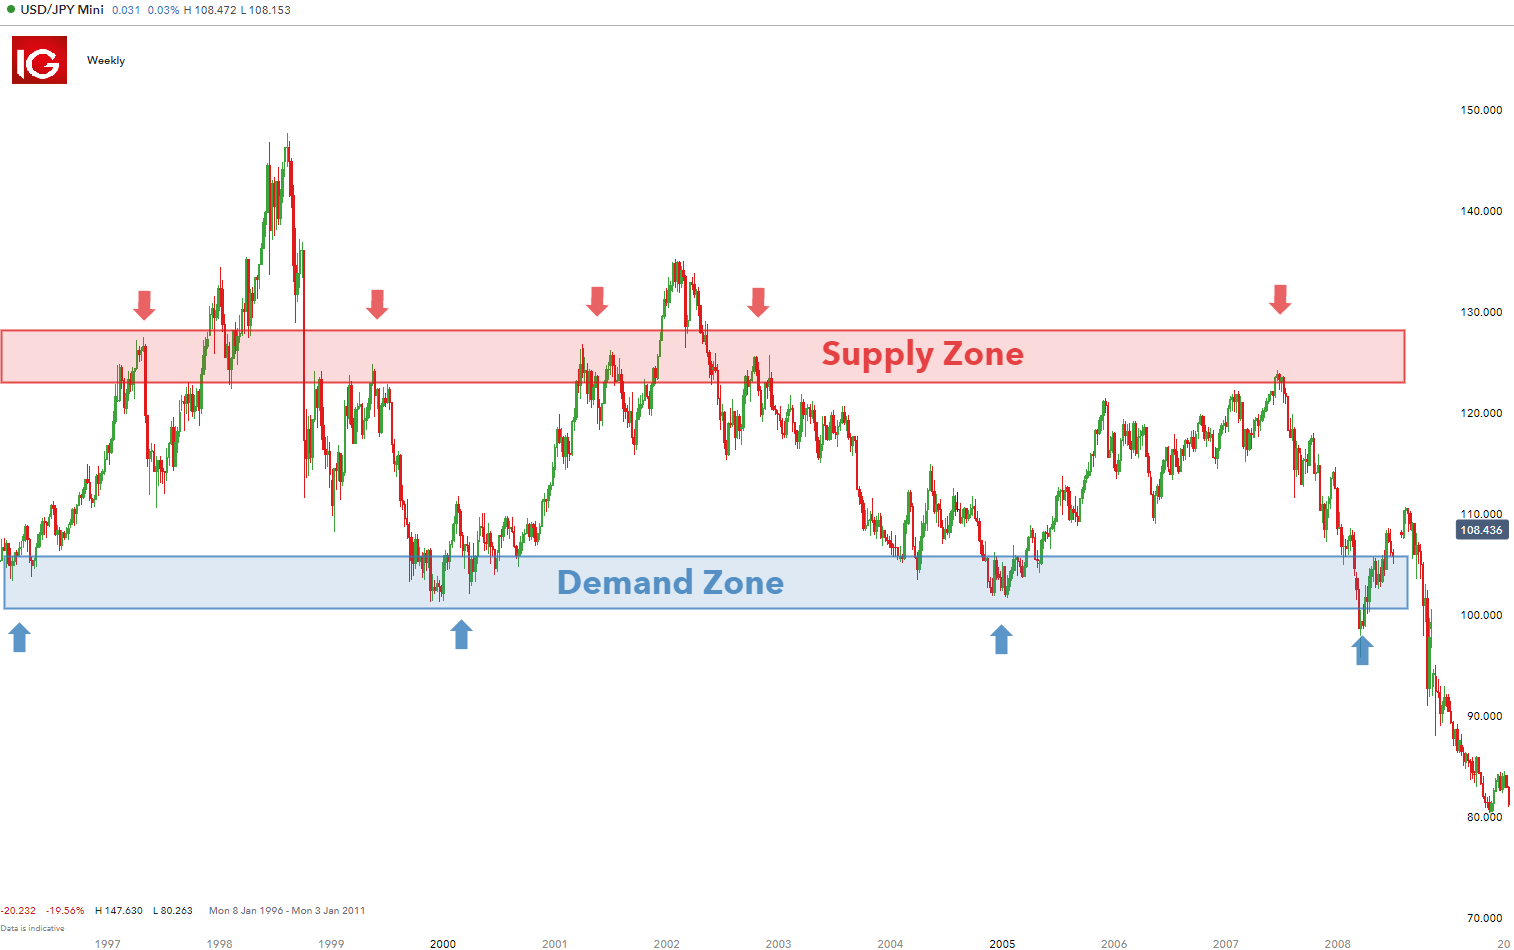
Often, a currency pair will climb to an area of resistance called a ‘selling zone’, where sellers perceive there to be great selling potential at a relatively overbought price. The reverse is also true for currency pairs that drop to relatively low levels, ‘demand zone’ where buyers perceive there to be great value to buy.

If you haven’t learned the basics of the supply and demand, or would like a refresher, read our guide on the forces of supply and demand.

Understanding Supply and Demand Zones

Supply and demand zones are observable areas on a forex chart where price has approached many times in the past. Unlike lines of support and resistance, these resemble zones more closely than precise lines.

Traders can customize charts to identify the demand and supply zones as shown on the USD/JPY below.

Supply and demand trading using zones

3 Tips for Using Supply and Demand to Trade Forex

1) Use longer time frames to identify supply and demand zones

By zooming out, traders are able to get a better view of areas where price had bounced off previously. Be sure to use the appropriate charts when altering the between multiple time frames. Draw a rectangular shape to denote this zone. Demand and supply zones do not necessarily have to appear together – often currency pairs can reveal one or the other.

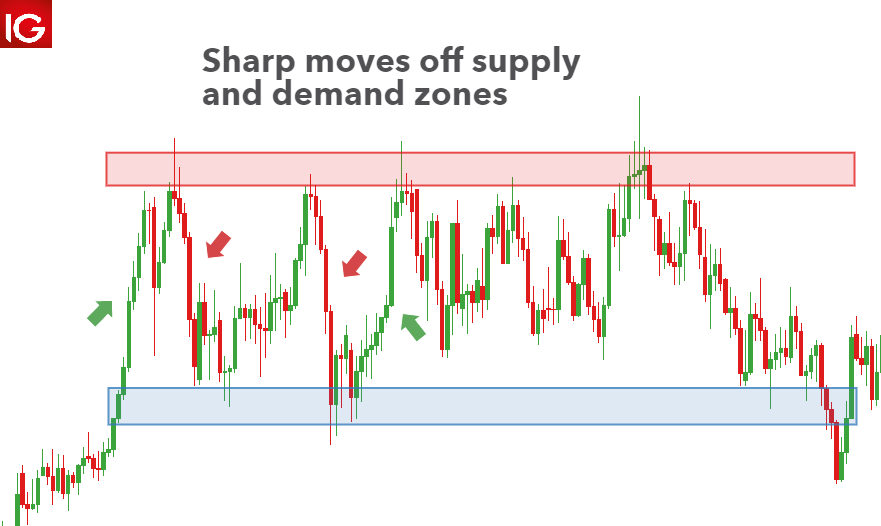
2) Identify strong moves off the potential demand/supply zone

Certain price levels offer value to either bullish or bearish traders. Once institutional traders and big banks see this value, they will look to capitalize on it. As a result, price action tends to accelerate relatively quickly until the value has diminished or has been fully realized. Witnessing multiple instances of this at the same price level increases the probability that it is an area of value and therefore, a supply or demand zone.

sharp moves off demand and supply zones

3) Use indicators for confirmation of support and demand zones

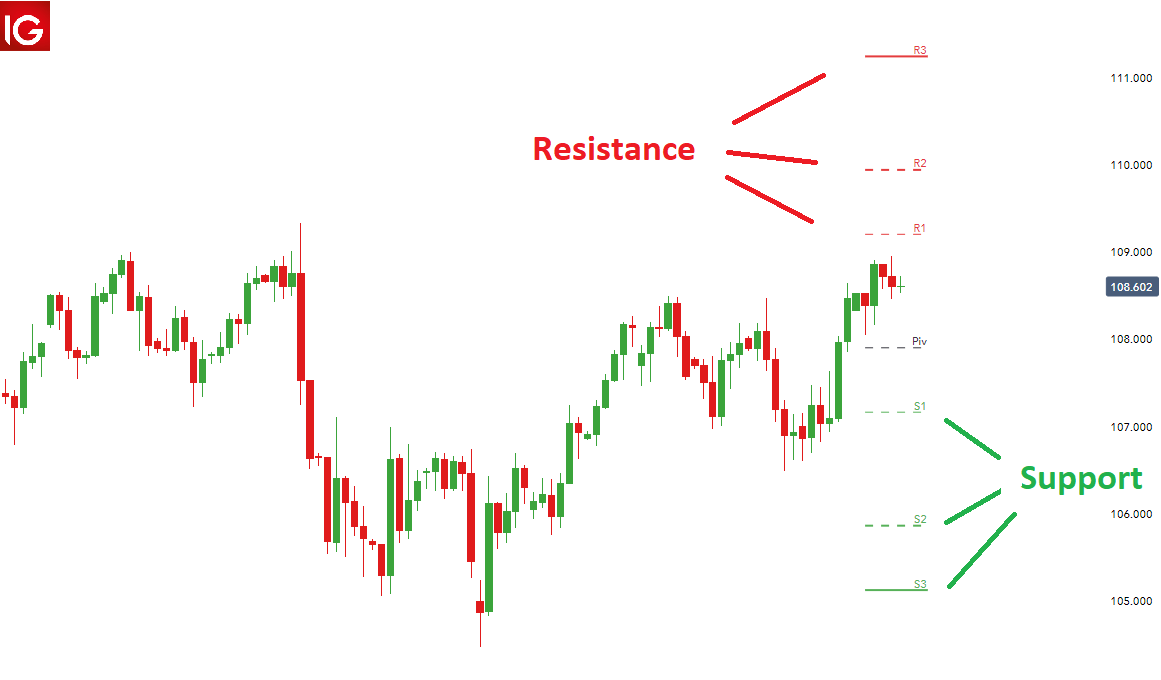
Traders can incorporate daily or weekly pivot points to identify or confirm supply or demand zones. At DailyFX, we have a dedicated page showing relevant support and resistance levels for all major markets. Traders should look for support and resistance levels to line up with demand and supply zones for higher probability trades.

using pivot points

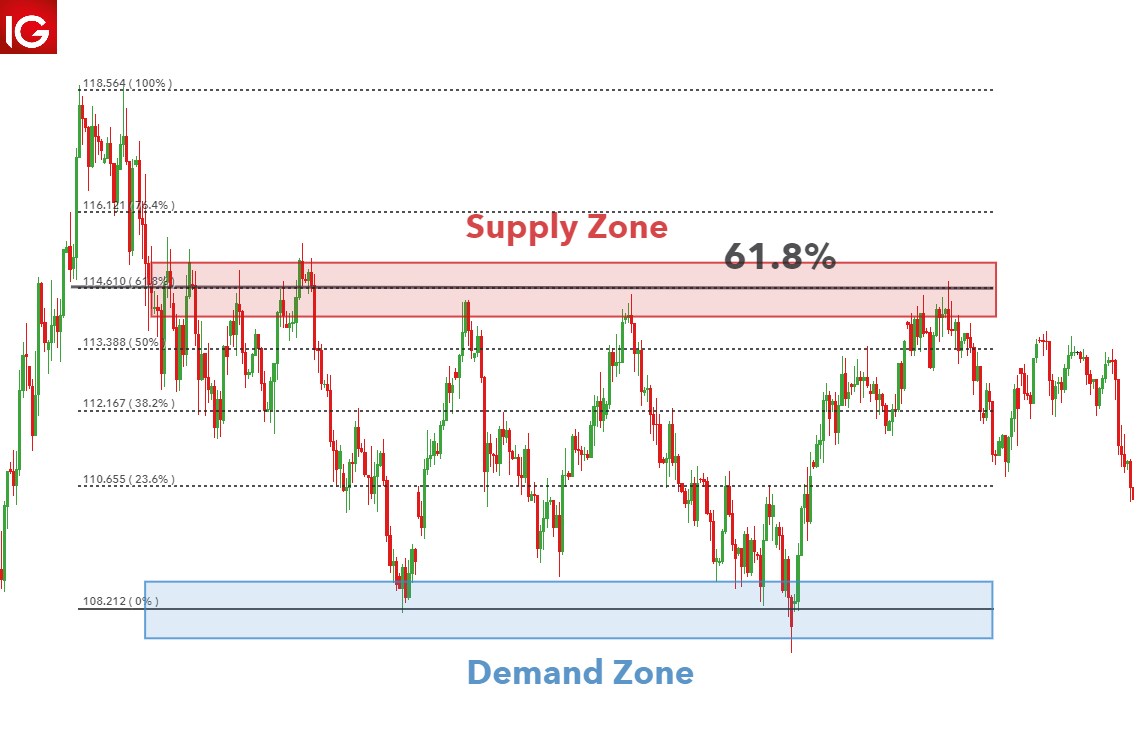
Furthermore, traders can use Fibonacci levels for greater accuracy on possible turning points at supply or demand zones. The 61.8% level is regarded as a significant level and corresponds with the supply zone in the chart below.

supply and demand trading using Fibonacci levels

Supply and Demand Trading Strategies

Range trading strategy

Supply and demand zones can be used for range trading if the zones are well established. Traders can incorporate the use of a stochastic indicator or RSI to assist in identifying overbought and oversold conditions.

Since this is a non-directional trade in terms of the trend, both long and short entries can be spotted. After viewing oversold/overbought conditions on a longer-term chart, traders can zoom into a smaller time frame to spot an ideal entry.

USD/JPY range trading example

Breakout strategy

The breakout strategy is another supply and demand trading strategy. Price cannot remain within a defined range forever and will eventually make a directional movement. Traders look to gain favorable entry into the market, in the direction of the breakout, as it may be the start of a strong trend.

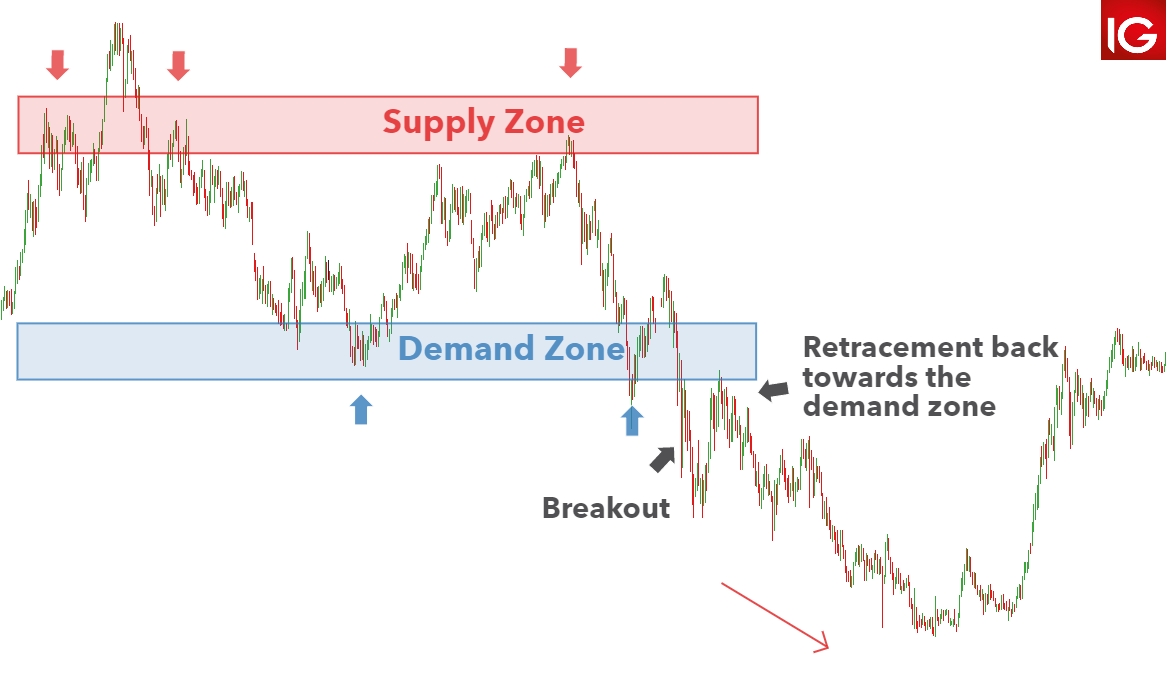
The USD/JPY chart shows a break out of the trading range but then retraces back towards the demand zone. Traders that place a short trade at the breakout are susceptible to being stopped out in this scenario. One way to mitigate this is to anticipate the retracement back to the demand zone before pacing the short trade.

Supply and demand trading strategy on breakouts

Using supply and demand zones as risk management parameters

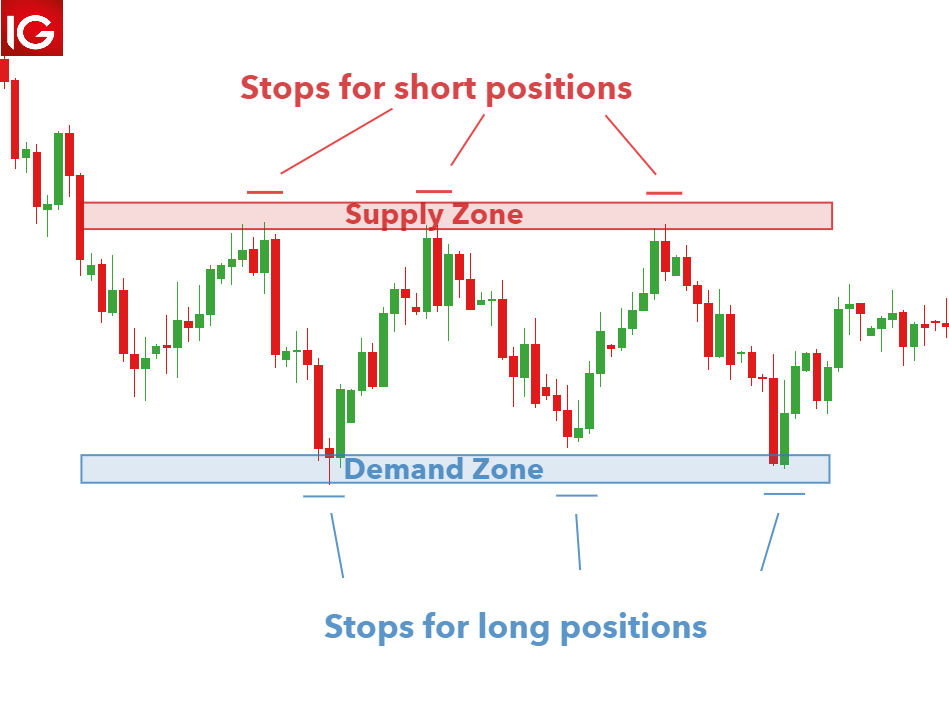
Demand and supply zones are very similar to support and resistance and therefore, these areas provide an indication as to where a trader can place stops and limits.

These areas allow traders to implement a positive risk to reward approach on all trades. Range traders that are selling at the supply zone can set stops above the supply zone and targets at the demand zone. Conservative traders can set the target above the demand zone or implement a number of other risk management techniques.

The USD/SGD chart below shows how stops and limits can be placed with reference to supply and demand zones:

supply and demand risk management strategy

How to Deal with FOMO to Become a Better Trader

How to Deal with FOMO to Become a Better Trader

Dealing with the fear of missing out – or FOMO – is a highly valuable skill for traders. Not only can FOMO have a negative emotional impact, it can cloud judgment and overshadow logic, which is problematic when making trading decisions.
So what is FOMO in trading? It’s the fear traders get when they think they might be missing out on big opportunities, or that other traders are more successful. Traders who understand FOMO, where it comes from and how they react to it are in a strong position to tackle it at its root cause: the innermost workings of their own mind.

This article will help you get to grips with your FOMO, offering solutions to stop it in its tracks – or even to prevent it from arising in the first place.

Where Does FOMO in Trading Come From?

FOMO in trading has deep-seated emotional roots and it stems from our interconnected daily lives. The modern trader lives in a world where social media is commonplace and they are bombarded with stories of others succeeding.

FOMO can stem from various feelings and emotions that occur during trading, including fear, greed, jealousy and impatience. The fast-paced nature of trading means many situations can drive these emotions. From newsworthy events, to sudden market movements, to something as simple as a conversation with another trader, there’s the potential for FOMO.

Explore the roots of FOMO in trading and learn what characterizes a FOMO trader.

Stuck in a FOMO rut? How to Deal with FOMO in Trading

Putting a stop to your FOMO isn’t a quick fix, so don’t feel disheartened. It’s a case of adjusting thought processes – and that isn’t something which happens straight away. The feeling of missing out on a great opportunity can be pervasive.

It might help to remember that it happens to everyone; even the most experienced traders experience The Fear. Here are five top ways to deal with FOMO and become a better trader:

1. Accept the FOMO

The first step to overcoming FOMO is accepting it. This can provide a great deal of relief – the idea that everyone is having a better time, and is more successful, can be lonely and isolating.

Warning signs

Traders having thoughts like this might need to accept their FOMO:

“FOMO? What FOMO? I’m in full control of my trading.”

A refusal to accept FOMO means a trader won’t change their habits, staying stuck in an unfulfilling cycle of reliance on others.

How to accept FOMO

Remember that FOMO affects traders all the time. It might help to share experiences with others, in a group learning environment like a webinar. Our DailyFX analyst, Paul Robinson regularly hosts webinars addressing psychology in trading and issues such as FOMO.

2. Work on your trading psychology

FOMO is intrinsically linked to psychology; the emotions of trading can take over and make traders question their own decisions.

Warning signs

Thoughts like this could indicate the focus is the here and now, not the bigger picture:

“I can’t believe I missed that opportunity! Chances like that don’t come around often. I bet other traders took it… their trades will be in the money now.”

Trading based on emotions can be risky, and can lead to cyclical behavior – entering trades, panicking, selling, feeling regret, and doing the same thing again…

Chart showing possible effects of FOMO if traders don't overcome it

This chart illustrates what can happen if traders get carried away by FOMO. It uses the Relative Strength Index as an indicator, showing when the Japanese Yen has been overbought or oversold. The second set of arrows illustrates a situation where the trader has become overconfident, and is worried about missing out on another opportunity. In their excitement, greed and fear of missing out take over – the trader ignores signals to sell in the hope of getting a bigger win, and ends up making a loss.
How to improve trading psychology

Learning to improve trading psychology starts with an analysis of strengths and weaknesses. Why not get some ideas on trading psychology from the DailyFX Podcast? This will help you overcome FOMO and improve your psychology.

3. Control your social media activity

Social media can be helpful to traders, but it can also be detrimental – when it looks like everyone else is winning trades, it’s easy to become disillusioned and demotivated.

Warning signs

You might need to consider your relationship with social media if you regularly have thoughts like this:

“I’ll just check Twitter to get some ideas… but it’s full of people winning trades. Why can’t I be more like them?!”

Using social media can knock your confidence if it feels like others know something you don’t. It can create a feeling of FOMO rather than proving constructive.

How to control your social media activity

There’s no need to cut yourself off from the world, but try to use social media in a way that’s helpful for you. Take a look at the #FOMOintrading hashtag to see if you can relate to anyone else’s experiences, and follow @DailyFX and our analysts to get hints, tips and ideas for trades.

4. Keep a trading journal

A trading journal will help you log your activity and reflect on it. It’s an excellent self-reflection tool, allowing you to spot the habits that are helpful and put a stop to those that might lead to FOMO trading.

Warning signs

You might need to make better use of your trading journal if you’re having thoughts like this:

“This feels like a good opportunity. I think I’ll go for it. The markets seem to be working in my favor.”

These thoughts suggest you need to spend some time evaluating your trading and establishing what works for you. A trading journal will help.

How to keep a trading journal

Everyone’s trading journal will be different – yours will be personal to you, and based on your trading goals. Lean how to create a trading journal and use it to its full potential, putting you in a better position to trade with confidence, not fear.

5. Manage your risk

Managing risk carefully is an important step in moving away from FOMO – and if you are tempted into trades through the fear, good risk management will be your backup to ensure losses don’t spiral out of control.

Warning signs

Your risk management strategy will come into play if you’re having thoughts like this:

“Everyone else is trading this market, it can’t be that risky… I don’t want to miss out.”

FOMO can make a trade seem more appealing but it doesn’t substitute a strategy. It’s important that all outcomes are considered so you can manage risk.

How to manage risk

Good risk management sets a precedent for good trading. Learn about the importance of risk management, how it can help control emotions when trading, and why it’s essential for you.

How to Stop FOMO Before it Happens

A good approach to deal with FOMO is to trade in a way that prevents it from occurring in the first place. Here are some ideas and actionable tips to help you focus on your trading goals and activities, rather than worrying about what others are doing:

  1. Establish a routine. Trading can be an isolating activity, which is one of the reasons FOMO can kick in. Having a routine really helps. This gives you time to analyze the markets, plan trades and make the decisions that are right for you – without the distractions of others. Once you find a routine that works, it’s much easier to focus. Find out how successful traders and analysts manage their routines and balance their time on the markets.
  2. Look to the future. Don’t dwell on the past. The mind will naturally focus on the negatives but it’s possible to teach it not to. Losing some money might seem like a big deal, especially at first, but the most confident and strategic traders know this is all part of the bigger picture. There will always be another opportunity and once this becomes part of the trading psyche, it’s much easier to avoid FOMO. A practical way to keep up the forward momentum is to use our market sentiment tool, which will help you to make more accurate predictions and get a better idea of whether signals are bullish or bearish.
  3. Create a trading plan. There are no buts: you need a trading plan. Trading outside of a plan could mean risking too much capital or entering trades at the wrong time. It’s easy to think a situation is unique, but a trading plan should cover all eventualities. If a trading plan is watertight, you will have the tools they need to make money long term. Learn how to create a trading plan in just seven steps. This will help you establish objective trading strategies and beat FOMO.
  4. Enjoy trading. When you are happy and content in your own activities you’re less likely to feel the FOMO. An important factor in this is feeling that you’ve really mastered your trading. We have educational resources available for traders of all levels, helping you get to grips with the basics or find more advanced strategies. You can also learn more about creating your own success in our guide to the Traits of a Successful Trader.

Embrace the JOMO!

JOMO stands for the joy of missing out. It pays to take a step back, collect your thoughts, and simply enjoy your own space and routine. There’s a lot to be said for JOMO, and adjusting thought patterns to eliminate FOMO is a solid psychological strategy to take.

A Trader’s Toolkit for Dealing with FOMO

To summarize, here are the essential tools required to deal with FOMO and become a better trader.

Toolkit to overcome FOMO