Litefinance is excited to announce an exclusive cash price giveaway to their online client.
We are here to appreciate and support our new online client.
THIS IS HOW IT WORKS
1: Fellow us on Instagram @litefinance_warri
2: Fellow us on Facebook @litefinance forex
CONDITIONS
1: Like the giveaway post
2: Tag three of your friends and let them like the giveaway post as well both Facebook and Instagram
3: Register your account for free and verified it. likewise your friends too then stand a chance to win
4. Price money is non withdraw-able, but you can trade with it and make profit. Your profit generated can be withdraw.
PRICE INCLUDES
1: 1st price $500
2: 2nd price $300
3: 3rd price $200
So what are you still waiting for? Register now @ www.litefinancenig.com
UK Sheds Jobs but Pay Grows to 5.9% – Complicating BoE Rate Outlook
UK Job Market Eases Further While Wages Remain Persistently High
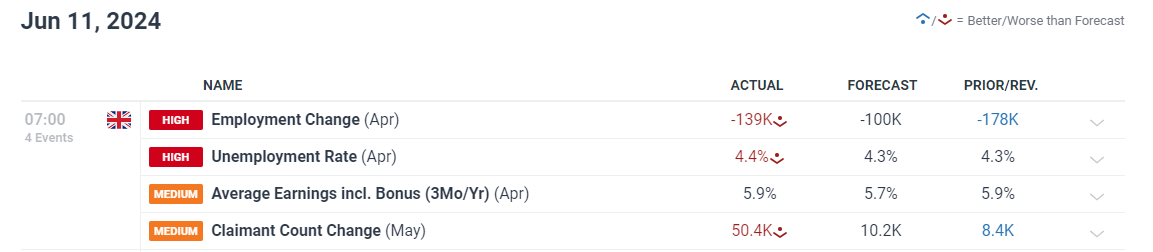
The UK job market showed further signs of vulnerability after May witnessed the highest claimant count (application for unemployment benefits) since February 2021. Restrictive monetary policy has helped bring inflation down in a notable fashion but the labour market is feeling the effects.
In the three-month period ending in April, employment contracted by 139k (-100k expected) which follows on from a loss of 178k in the three months prior to that.
Average weekly earnings in April rose to 5.9%, proving a sticky data point for the Bank of England to contemplate ahead of next weeks policy setting meeting. However, the Bank has previously expressed it is no longer looking at earnings data as a major contributing factor to inflation pressures, meaning the overall decline in broader measures of inflation are likely to point the Monetary Policy Committee (MPC) towards an eventual rate cut towards the latter stages of the year.
Learn how to prepare for high impact economic data or events with this easy to implement approach:
Market pricing reveals an expectation of one, maybe two rate cuts this year – much like the Fed – with November expected to be the month of interest while September remains a possibility if the data becomes increasingly more dovish (lower CPI, higher unemployment rate, low/contracting growth).
Implied BoE Basis Point Cuts into Year End
Market Reaction
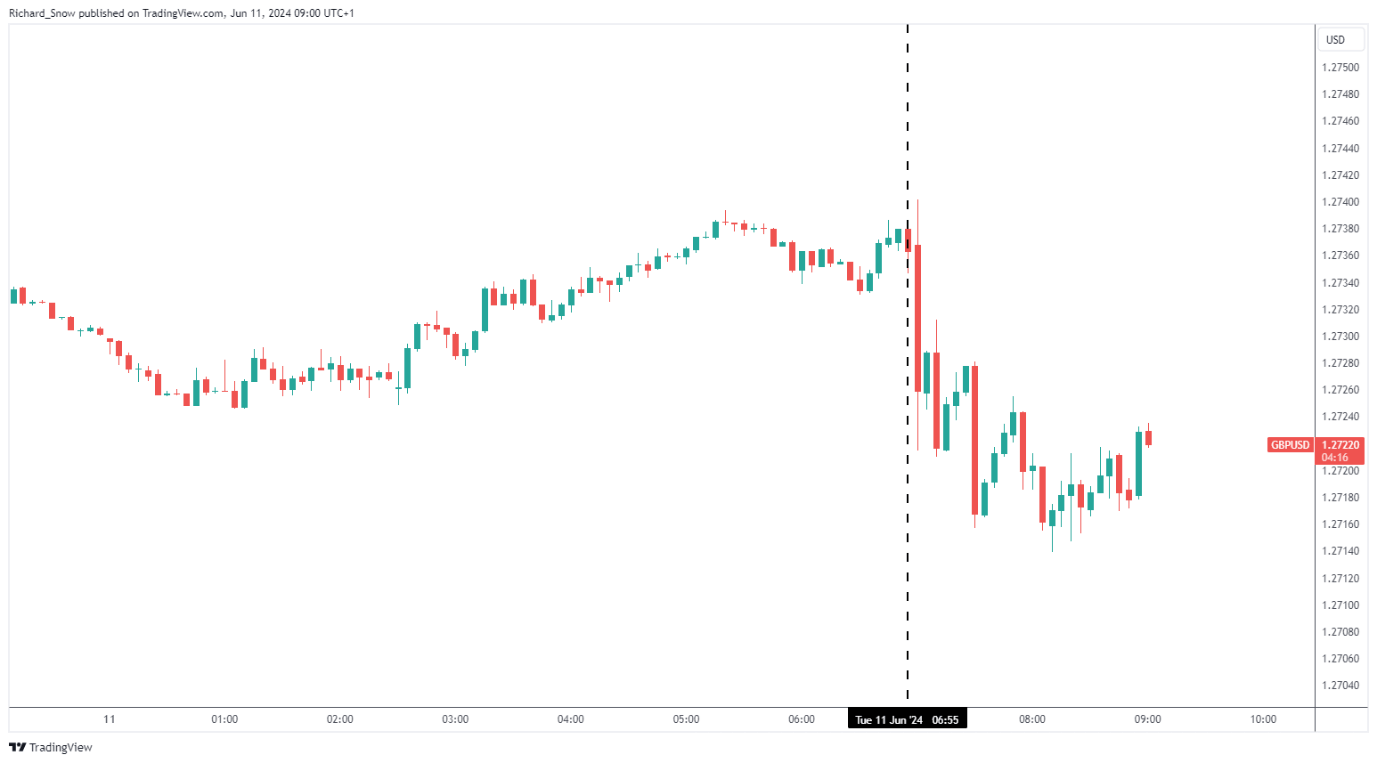
Cable understandably dropped in the wake of the data, with the unemployment rate and May claimant data presenting a worrying picture but the reaction appears limited ahead of major US event risk still to come tomorrow (CPI, FOMC).
GBP/USD 5-minute chart
The UK data has helped extend the bearish GBP/USD move that developed in the wake of Friday’s massive NFP shock that sent the dollar higher. Understandably, moves are contained ahead of the main event of the week (FOMC) with he Fed due to update its dot plot projection of the Fed funds rate by year end. Many expect an upward revision in the dot plot (fewer rate cuts). The question now is whether stubborn inflation data in the US, alongside a resurgent jobs market will be enough to erase two or just one rate cut from the yearly outlook.
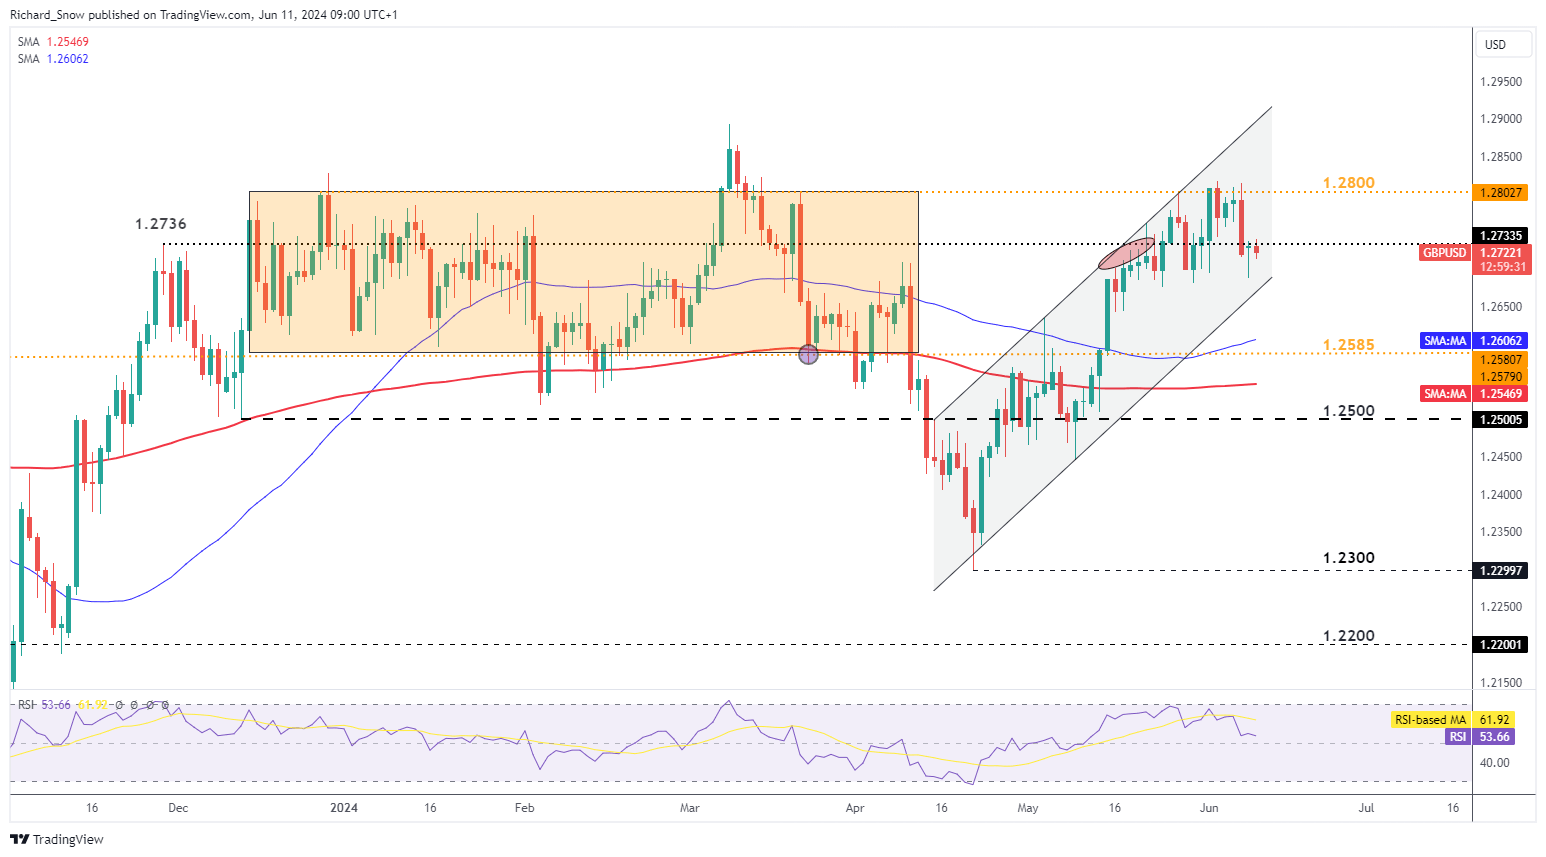
GBP/USD trades below the 1.2736 swing high from the end of last year, opening up channel support as the next level of support. To the upside, 1.2800 produces a clear level of resistance, capping prior advances.
GBP/USD Daily Chart
How to Read a Candlestick Chart
What is a candlestick chart?
A candlestick chart is simply a chart composed of individual candles, which traders use to understand price action. Candlestick price action involves pinpointing where the price opened for a period, where the price closed for a period, as well as the price highs and lows for a specific period.
Price action can give traders of all financial markets clues to trend and reversals. For example, groups of candlesticks can form patterns which occur throughout forex charts that could indicate reversals or continuation of trends. Candlesticks can also form individual formations which could indicate buy or sell entries in the market.
The period that each candle depicts depends on the time-frame chosen by the trader. A popular time-frame is the daily time-frame, so the candle will depict the open, close, and high and low for the day. The different components of a candle can help you forecast where the price might go, for instance if a candle closes far below its open it may indicate further price declines.
Boost your chart patterns expertise with our interactive quiz!
Our Forex Trading Patterns Quiz will test your knowledge of some of the most important trading patterns. Take the test today by clicking on the link and raise your technical analysis game!
Interpreting a candle on a candlestick chart
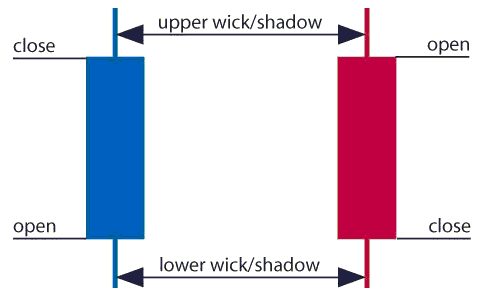
The image below represents the design of a typical candlestick. There are three specific points (open, close, wicks) used in the creation of a price candle. The first points to consider are the candles’ open and close prices. These points identify where the price of an asset begins and concludes for a selected period and will construct the body of a candle. Each candle depicts the price movement for a certain period that you choose when you look at the chart. If you are looking at a daily chart each individual candle will display the open, close, upper and lower wick of that day.

Open price:
The open price depicts the first price traded during the formation of the new candle. If the price starts to trend upwards the candle will turn green/blue (colors vary depending on chart settings). If the price declines the candle will turn red.
High Price:
The top of the upper wick/shadow indicates the highest price traded during the period. If there is no upper wick/shadow it means that the open price or the close price was the highest price traded.
Low Price:
The lowest price traded is the either the price at the bottom of the lower wick/shadow and if there is no lower wick/shadow then the lowest price traded is the same as the close price or open price in a bullish candle.
Close Price:
The close price is the last price traded during the period of the candle formation. If the close price is below the open price the candle will turn red as a default in most charting packages. If the close price is above the open price the candle will be green/blue (also depends on the chart settings).
The Wick:
The next important element of a candlestick is the wick, which is also referred to as a ‘shadow’. These points are vital as they show the extremes in price for a specific charting period. The wicks are quickly identifiable as they are visually thinner than the body of the candlestick. This is where the strength of candlesticks becomes apparent. Candlesticks can help traders keep our eye on market momentum and away from the static of price extremes.
Direction:
The direction of the price is indicated by the color of the candlestick. If the price of the candle is closing above the opening price of the candle, then the price is moving upwards and the candle would be green (the color of the candle depends on the chart settings). If the candle is red, then the price closed below the open.
Range:
The difference between the highest and lowest price of a candle is its range. You can calculate this by taking the price at the top of the upper wick and subtracting it from the price at the bottom of the lower wick. (Range = highest point – lowest point).
Having this knowledge of a candle, and what the points indicate, means traders using a candlestick chart have a clear advantage when it comes to distinguishing trendlines, price patterns and Elliot waves.
Bar Chart vs Candlestick Chart
As you can see from the image below, candlestick charts offer a distinct advantage over bar charts. Bar charts are not as visual as candle charts and nor are the candle formations or price patterns. Also, the bars on the bar chart make it difficult to visualize which direction the price moved.
How to read a candlestick chart
There are various ways to use and read a candlestick chart. Candlestick chart analysis depends on your preferred trading strategy and time-frame. Some strategies attempt to take advantage of candle formations while others attempt to recognize price patterns.
Interpreting single candle formations
Individual candlesticks can offer a lot of insight into current market sentiment. Candlesticks like the Hammer, shooting star, and hanging man, offer clues as to changing momentum and potentially where the market prices maytrend.
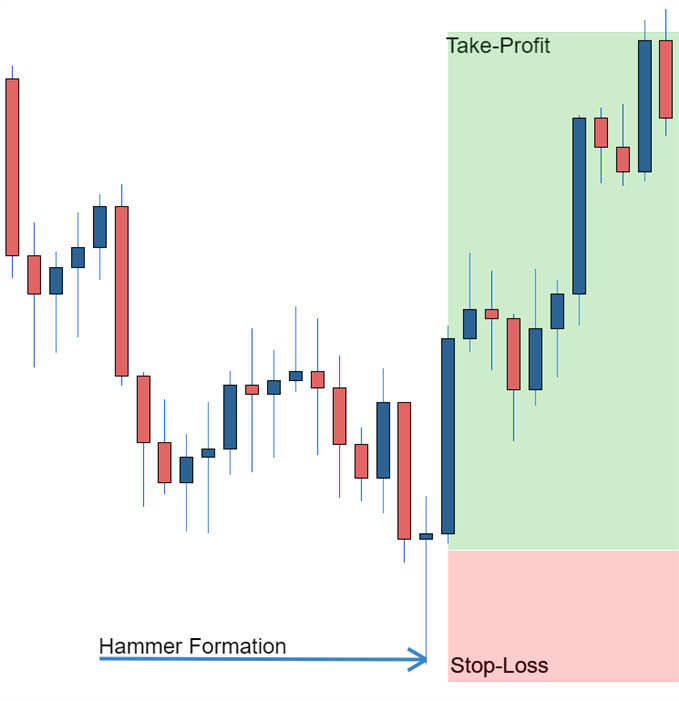
As you can see from the image below the Hammer candlestick formation sometimes indicates a reversal in trend. The hammer candle formation has a long lower wick with a small body. Its closing pricing is above its opening price. The intuition behind the hammer formation is simple, price tried to decline but buyers entered the market pushing the price up. It is a bullish signal to enter the market, tighten stop-losses or close out a short position.
Traders can take advantage of hammer formations by executing a long trade once the hammer candle has closed. Hammer candles are advantageous because traders can implement ‘tight’ stop-losses (stop-losses that risk a small amount of pips). Take-profits should be placed in such a way as to ensure a positive risk-reward ratio. So, the take-profit is larger than the stop-loss.

Recognizing price patterns in multiple candles
Candlestick charts help traders recognize price patterns that occur in the charts. By recognizing these price patterns, like the bullish engulfing pattern or triangle patterns you can take advantage of them by using them as entries into or exit signals out the market.
For example, in the image below we have the bullish engulfing price pattern. The bullish engulfing is a combination of a red candle and a blue candle that ‘engulfs’ the entire red candle. It is an indication that it could be the end of a currency pairs established weakness. A trader would take advantage of this by entering a long position after the blue candle closes. Remember, the price pattern only forms once the second candle closes.
As with the hammer formation, a trader would place a stop loss below the bullish engulfing pattern, ensuring a tight stop loss. The trader would then set a take-profit. For more forex candlestick charts check our forex candlesticks guide where we go in depth into the advantages of candlestick charts as well as the strategies that can be implemented using them.
Top 8 Forex Trading Strategies and their Pros and Cons
What is a Forex Trading Strategy?
A forex trading strategy defines a system that a forex trader uses to determine when to buy or sell a currency pair. There are various forex strategies that traders can use including technical analysis or fundamental analysis. A good forex trading strategy allows for a trader to analyse the market and confidently execute trades with sound risk management techniques.
Forex Strategies: A Top-level Overview
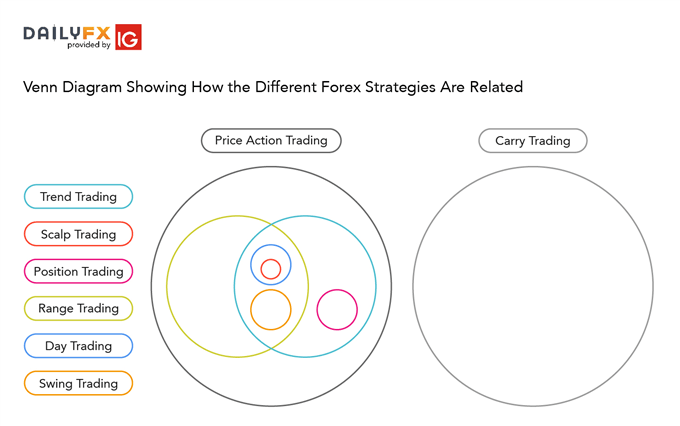
Forex strategies can be divided into a distinct organisational structure which can assist traders in locating the most applicable strategy. The diagram below illustrates how each strategy falls into the overall structure and the relationship between the forex strategies.
Forex Trading Strategies That Work
Forex trading requires putting together multiple factors to formulate a trading strategy that works for you. There are countless strategies that can be followed, however, understanding and being comfortable with the strategy is essential. Every trader has unique goals and resources, which must be taken into consideration when selecting the suitable strategy.
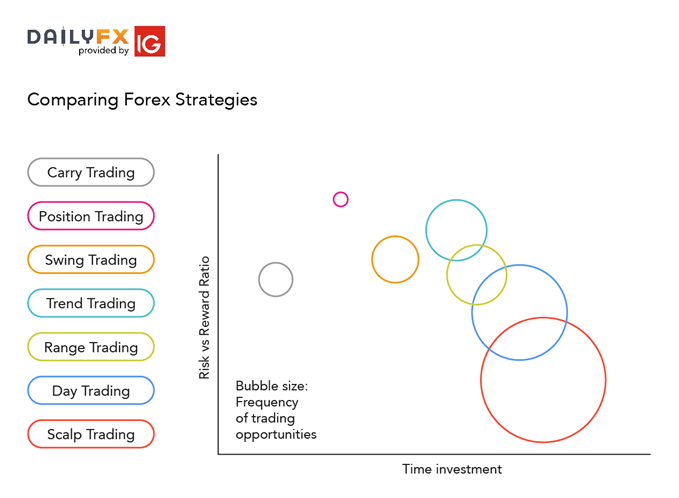
There are three criteria traders can use to compare different strategies on their suitability:
- Time resource required
- Frequency of trading opportunities
- Typical distance to target
To easily compare the forex strategies on the three criteria, we’ve laid them out in a bubble chart. On the vertical axis is ‘Risk-Reward Ratio’ with strategies at the top of the graph having higher reward for the risk taken on each trade. Position trading typically is the strategy with the highest risk reward ratio. On the horizontal axis is time investment that represents how much time is required to actively monitor the trades. The strategy that demands the most in terms of your time resource is scalp trading due to the high frequency of trades being placed on a regular basis.
1. Price Action Trading
Price action trading involves the study of historical prices to formulate technical trading strategies. Price action can be used as a stand-alone technique or in conjunction with an indicator. Fundamentals are seldom used; however, it is not unheard of to incorporate economic events as a substantiating factor. There are several other strategies that fall within the price action bracket as outlined above.
Length of trade:
Price action trading can be utilised over varying time periods (long, medium and short-term). The ability to use multiple time frames for analysis makes price action trading valued by many traders.
Entry/Exit points:
There are many methods to determine support/resistance levels which are generally used as entry/exit points:
Within price action, there is range, trend, day, scalping, swing and position trading. These strategies adhere to different forms of trading requirements which will be outlined in detail below. The examples show varying techniques to trade these strategies to show just how diverse trading can be, along with a variety of bespoke options for traders to choose from.
2. Range Trading Strategy
Range trading includes identifying support and resistance points whereby traders will place trades around these key levels. This strategy works well in market without significant volatility and no discernible trend. Technical analysis is the primary tool used with this strategy.
Length of trade:
There is no set length per trade as range bound strategies can work for any time frame. Managing risk is an integral part of this method as breakouts can occur. Consequently, a range trader would like to close any current range bound positions.
Entry/Exit points:
Oscillators are most commonly used as timing tools. Relative Strength Index (RSI), Commodity Channel Index (CCI) and stochastics are a few of the more popular oscillators. Price action is sometimes used in conjunction with oscillators to further validate range bound signals or breakouts.
Example 1: USD/JPY Range Trading
USD/JPY has been exhibiting a prolonged range bound price level over the past few years. The chart above illustrates a clear support and resistance band which traders use as entry/exit points. The RSI oscillator demonstrates timing of entry/exit points as highlighted by the shaded blue and red boxes – blue: overbought and red: oversold.
Range trading can result in fruitful risk-reward ratios however, this comes along with lengthy time investment per trade. Use the pros and cons below to align your goals as a trader and how much resources you have.
Pros:
- Substantial number of trading opportunities
- Favourable risk-to reward ratio
Cons:
- Requires lengthy periods of time investment
- Entails strong appreciation of technical analysis
3. Trend Trading Strategy
Trend trading is a simple forex strategy used by many traders of all experience levels. Trend trading attempts to yield positive returns by exploiting a markets directional momentum.
Length of trade:
Trend trading generally takes place over the medium to long-term time horizon as trends themselves fluctuate in length. As with price action, multiple time frame analysis can be adopted in trend trading.
Entry/Exit points:
Entry points are usually designated by an oscillator (RSI, CCI etc) and exit points are calculated based on a positive risk-reward ratio. Using stop level distances, traders can either equal that distance or exceed it to maintain a positive risk-reward ratio e.g. If the stop level was placed 50 pips away, the take profit level wold be set at 50 pips or more away from the entry point.
Example 2: Identifying the Trend
In the simple example above, EUR/USD exhibits an upward trend validated by higher highs and higher lows. The opposite would be true for a downward trend.
EUR/USD Trading the Trend
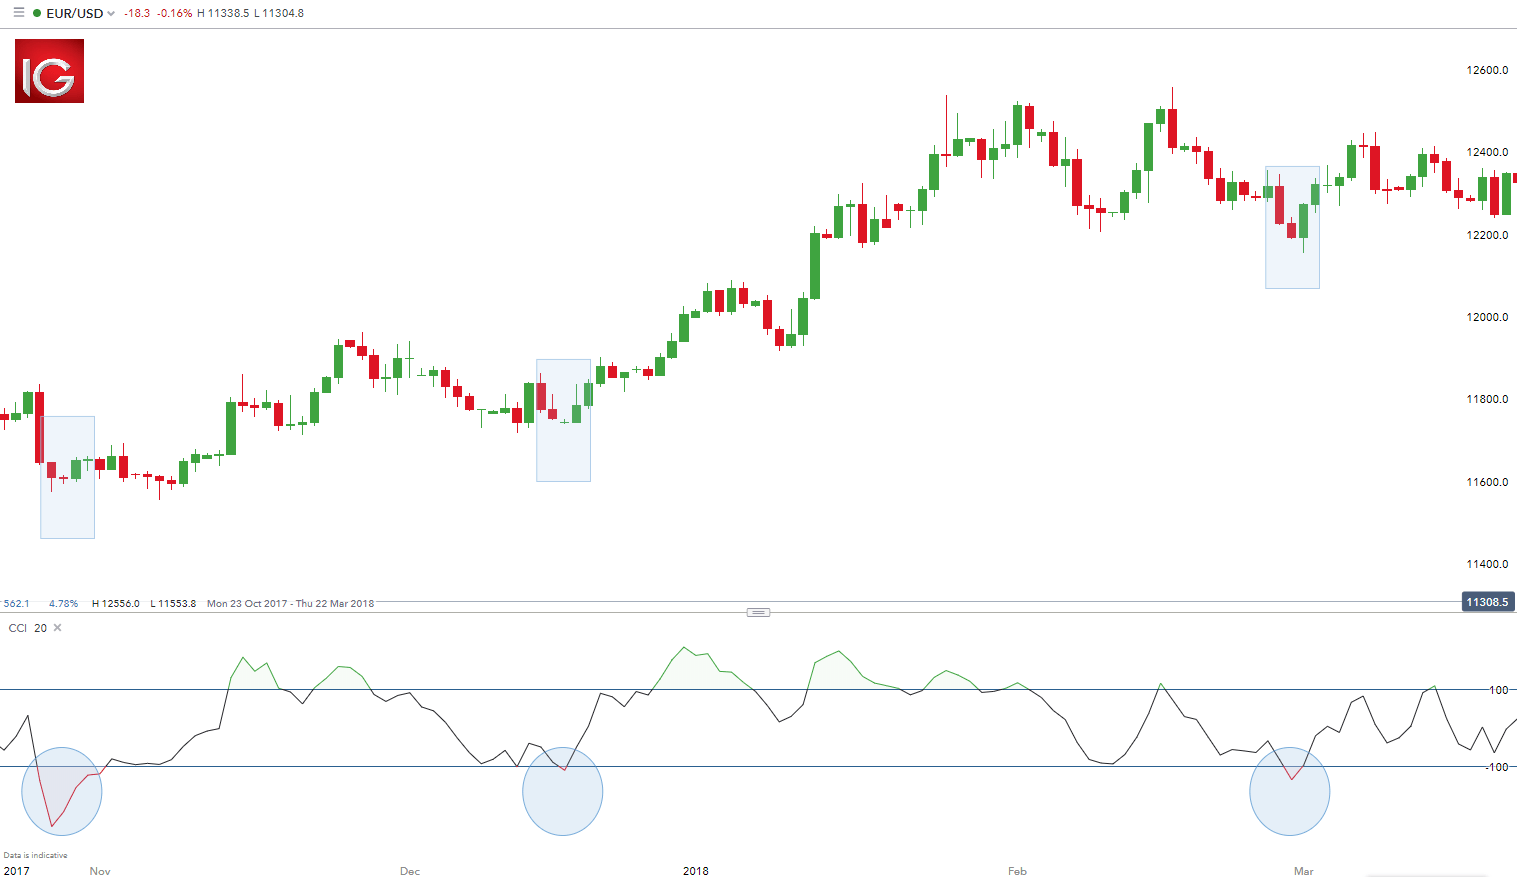
When you see a strong trend in the market, trade it in the direction of the trend. For example, the strong uptrend in EUR/USD above.
Using the (CCI) as a tool to time entries, notice how each time CCI dipped below -100 (highlighted in blue), prices responded with a rally. Not all trades will work out this way, but because the trend is being followed, each dip caused more buyers to come into the market and push prices higher. In conclusion, identifying a strong trend is important for a fruitful trend trading strategy.
Trend trading can be reasonably labour intensive with many variables to consider. The list of pros and cons may assist you in identifying if trend trading is for you.
Pros:
- Substantial number of trading opportunities
- Favourable risk-to reward ratio
Cons:
- Requires lengthy periods of time investment
- Entails strong appreciation of technical analysis
4. Position Trading
Position trading is a long-term strategy primarily focused on fundamental factors however, technical methods can be used such as Elliot Wave Theory. Smaller more minor market fluctuations are not considered in this strategy as they do not affect the broader market picture. This strategy can be employed on all markets from stocks to forex.
Length of trade:
As mentioned above, position trades have a long-term outlook (weeks, months or even years!) reserved for the more persevering trader. Understanding how economic factors affect markets or thorough technical predispositions, is essential in forecasting trade ideas.
Entry/Exit points:
Key levels on longer time frame charts (weekly/monthly) hold valuable information for position traders due to the comprehensive view of the market. Entry and exit points can be judged using technical analysis as per the other strategies.
Example 3: Germany 30 (DAX) Position Trading
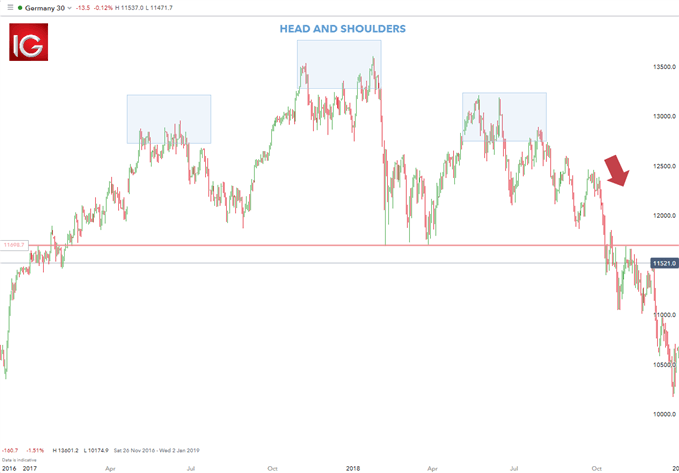
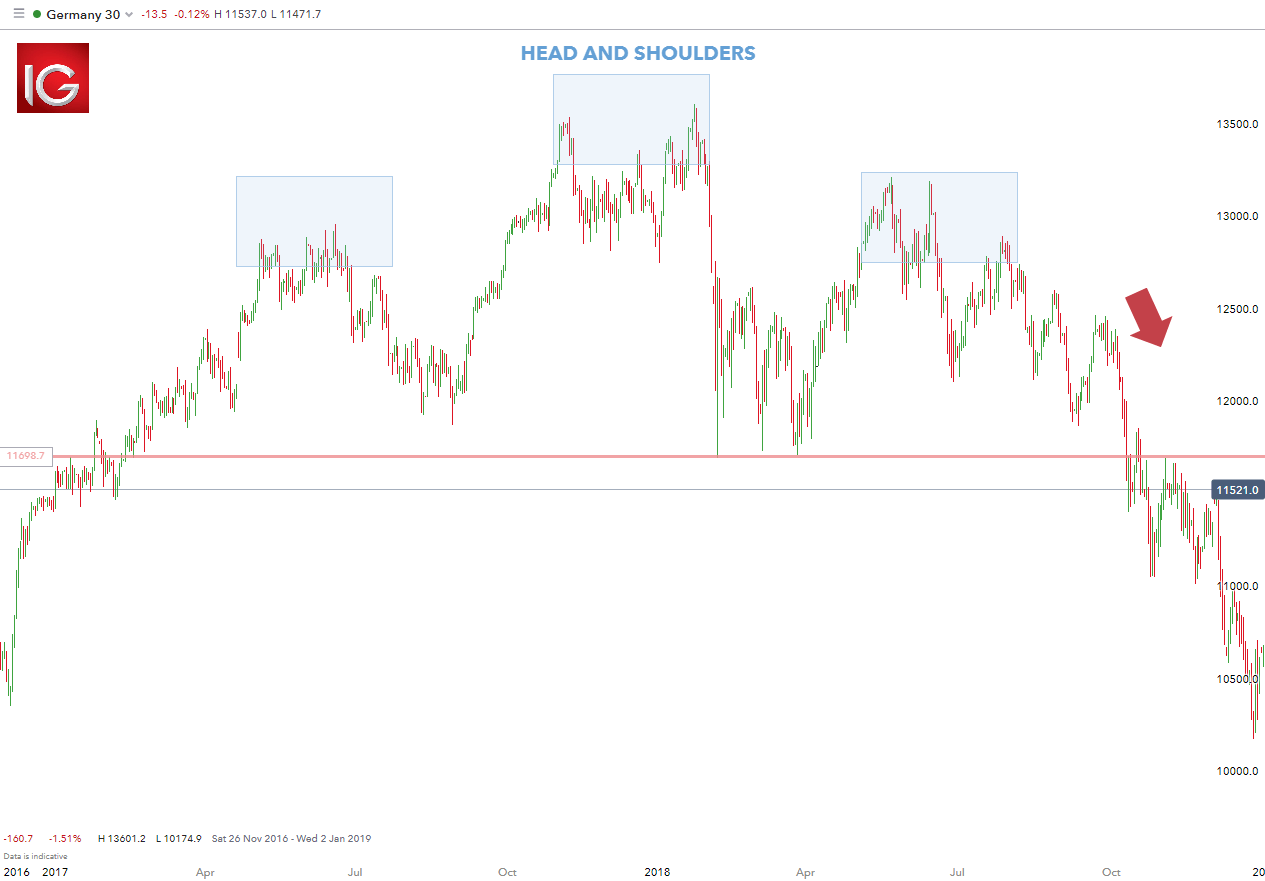
The Germany 30 chart above depicts an approximate two year head and shoulders pattern, which aligns with a probable fall below the neckline (horizontal red line) subsequent to the right-hand shoulder. In this selected example, the downward fall of the Germany 30 played out as planned technically as well as fundamentally. Towards the end of 2018, Germany went through a technical recession along with the US/China trade war hurting the automotive industry. Brexit negotiations did not help matters as the possibility of the UK leaving the EU would most likely negatively impact the German economy as well. In this case, understanding technical patterns as well as having strong fundamental foundations allowed for combining technical and fundamental analysis to structure a strong trade idea.
List of Pros and Cons based on your goals as a trader and how much resources you have.
Pros:
- Requires minimal time investment
- Highly positive risk-to reward ratio
Cons:
- Very few trading opportunities
- Entails strong appreciation of technical and fundamental analysis
5. Day Trading Strategy
Day trading is a strategy designed to trade financial instruments within the same trading day. That is, all positions are closed before market close. This can be a single trade or multiple trades throughout the day.
Length of trade:
Trade times range from very short-term (matter of minutes) or short-term (hours), as long as the trade is opened and closed within the trading day.
Entry/Exit points:
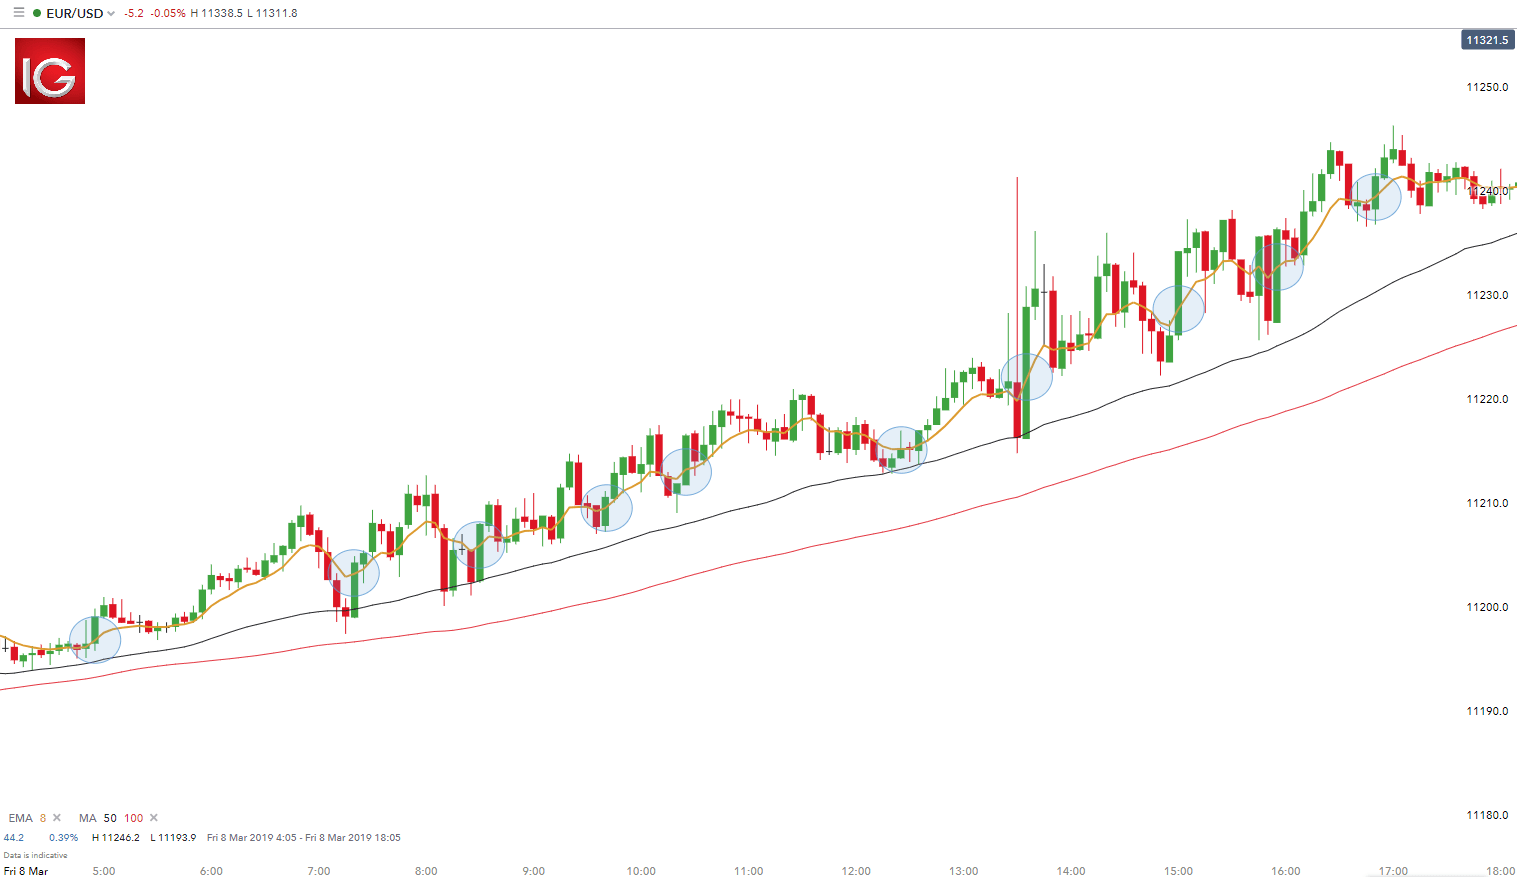
Traders in the example below will look to enter positions at the when the price breaks through the 8 period EMA in the direction of the trend (blue circle) and exit using a 1:1 risk-reward ratio.
Example 4: EUR/USD Day Trading
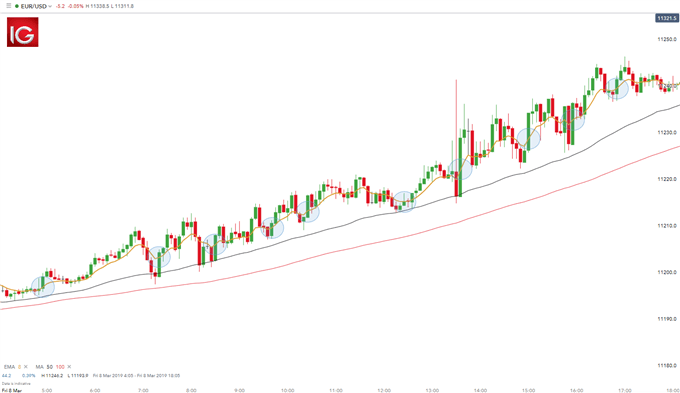
The chart above shows a representative day trading setup using moving averages to identify the trend which is long in this case as the price is above the MA lines (red and black). Entry positions are highlighted in blue with stop levels placed at the previous price break. Take profit levels will equate to the stop distance in the direction of the trend.
The pros and cons listed below should be considered before pursuing this strategy. Day trading involves much time and effort for little reward, as seen from the EUR/USD example above.
Pros:
- Substantial number of trading opportunities
- Median risk-to reward ratio
Cons:
- Requires lengthy periods of time investment
- Entails strong appreciation of technical analysis
6. Forex Scalping Strategy
Scalping in forex is a common term used to describe the process of taking small profits on a frequent basis. This is achieved by opening and closing multiple positions throughout the day. This can be done manually or via an algorithm which uses predefined guidelines as to when/where to enter and exit positions. The most liquid forex pairs are preferred as spreads are generally tighter, making the short-term nature of the strategy fitting.
Length of trade:
Scalping entails short-term trades with minimal return, usually operating on smaller time frame charts (30 min – 1min).
Entry/Exit points:
Like most technical strategies, identifying the trend is step 1. Many scalpers use indicators such as the moving average to verify the trend. Using these key levels of the trend on longer time frames allows the trader to see the bigger picture. These levels will create support and resistance bands. Scalping within this band can then be attempted on smaller time frames using oscillators such as the RSI. Stops are placed a few pips away to avoid large movements against the trade. The MACD indicator is another useful tool that can be exercised by the trader to enter/exit trades.
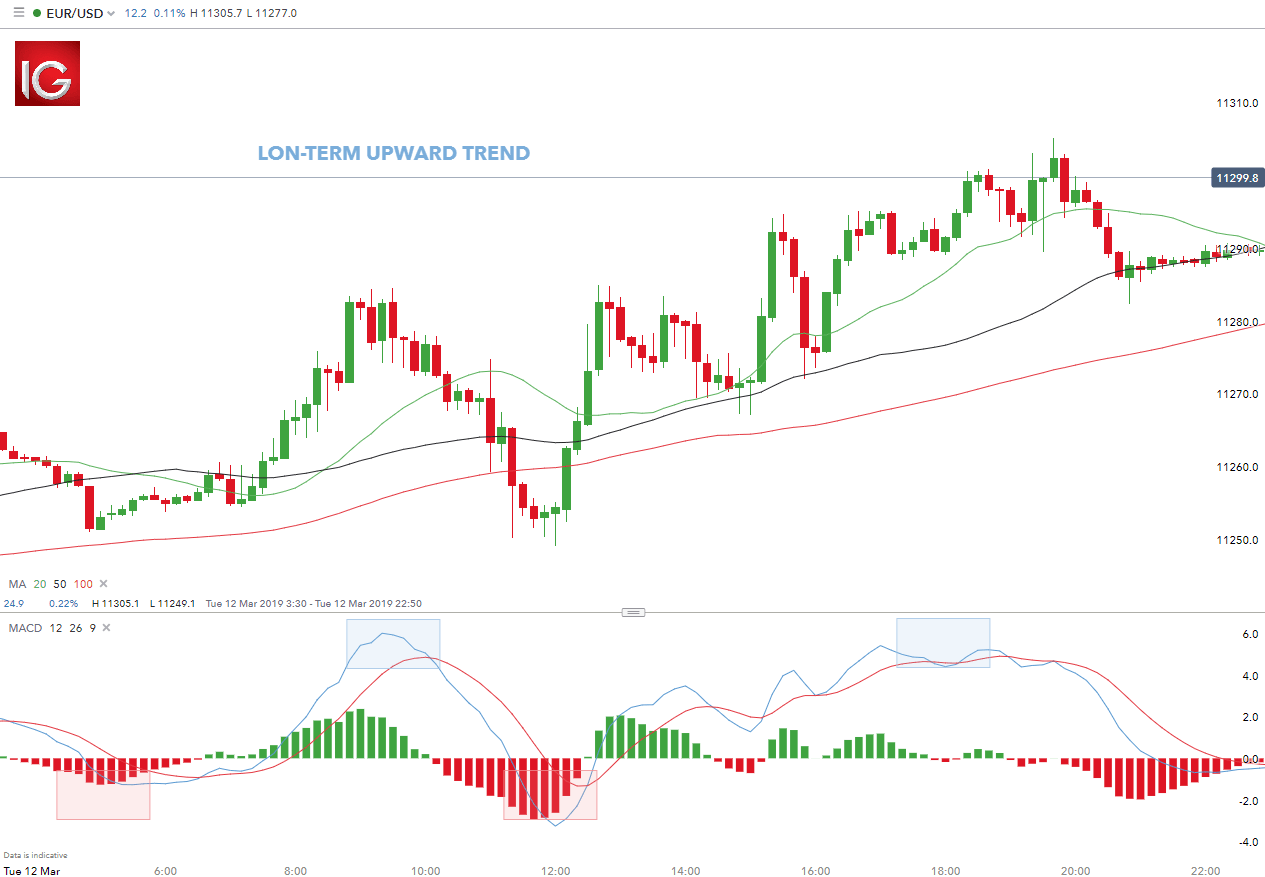
Example 5: EUR/USD Scalping Strategy
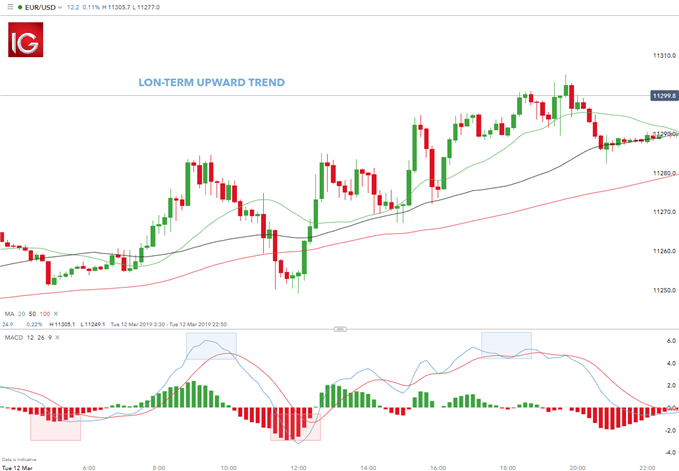
The EUR/USD 10 minute above shows a typical example of a scalping strategy. The long-term trend is confirmed by the moving average (price above 200 MA). The smaller time frame is then used to target entry/exit points. Timing of entry points are featured by the red rectangle in the bias of the trader (long). Traders can also close long positions using the MACD when the MACD (blue line) crosses over the signal line (red line) highlighted by the blue rectangles.
Traders use the same theory to set up their algorithms however, without the manual execution of the trader.
With this practical scalp trading example above, use the list of pros and cons below to select an appropriate trading strategy that best suits you.
Pros:
- Greatest number of trading opportunities from all forex strategies
Cons:
- Requires lengthy periods of time investment
- Entails strong appreciation of technical analysis
- Lowest risk-to reward ratio
7. Swing Trading
Swing trading is a speculative strategy whereby traders look to take advantage of rang bound as well as trending markets. By picking ‘tops’ and ‘bottoms’, traders can enter long and short positions accordingly.
Length of trade:
Swing trades are considered medium-term as positions are generally held anywhere between a few hours to a few days. Longer-term trends are favoured as traders can capitalise on the trend at multiple points along the trend.
Entry/Exit points:
Much like the range bound strategy, oscillators and indicators can be used to select optimal entry/exit positions and times. The only difference being that swing trading applies to both trending and range bound markets.
Example 6: GBP/USD Swing Trading Strategy
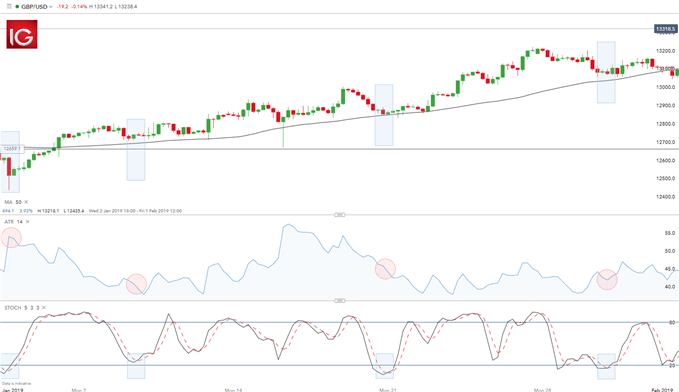
A combination of the stochastic oscillator, ATR indicator and the moving average was used in the example above to illustrate a typical swing trading strategy. The upward trend was initially identified using the 50-day moving average (price above MA line). In the case of an uptrend, traders will look to enter long positions with the old adage of ‘buy low, sell high’.
Stochastics are then used to identify entry points by looking for oversold signals highlighted by the blue rectangles on the stochastic and chart. Risk management is the final step whereby the ATR gives an indication of stop levels. The ATR figure is highlighted by the red circles. This figure represents the approximate number of pips away the stop level should be set. For example, if the ATR reads 41.8 (reflected in the last ATR reading) the trader would look to place the stop 41.8 pips away from entry. At DailyFX, we recommend trading with a positive risk-reward ratio at a minimum of 1:2. This would mean setting a take profit level (limit) at least 83.6 (41.8 x 2) pips away or further.
After seeing an example of swing trading in action, consider the following list of pros and cons to determine if this strategy would suit your trading style.
Pros:
- Substantial number of trading opportunities
- Median risk-to reward ratio
Cons:
- Entails strong appreciation of technical analysis
- Still requires extensive time investment
8. Carry Trade Strategy
Carry trades include borrowing one currency at lower rate, followed by investing in another currency at a higher yielding rate. This will ultimately result in a positive carry of the trade. This strategy is primarily used in the forex market.
Length of trade:
Carry trades are dependent on interest rate fluctuations between the associated currencies therefore, length of trade supports the medium to long-term (weeks, months and possibly years).
Entry/Exit points:
Strong trending markets work best for carry trades as the strategy involves a lengthier time horizon. Confirmation of the trend should be the first step prior to placing the trade (higher highs and higher lows and vice versa) – refer to Example 1 above. There are two aspects to a carry trade namely, exchange rate risk and interest rate risk. Accordingly, the best time to open the positions is at the start of a trend to capitalise fully on the exchange rate fluctuation. Regarding the interest rate component, this will remain the same regardless of the trend as the trader will still receive the interest rate differential if the first named currency has a higher interest rate against the second named currency e.g. AUD/JPY.
Could carry trading work for you? Consider the following pros and cons and see if it is a forex strategy that suits your trading style.
Pros:
- Little time investment needed
- Median risk-to reward ratio
Cons:
- Entails strong appreciation of forex market
- Infrequent trading opportunities

How to use the PPI in Forex Trading
Using PPI to trade forex: Talking points
- PPI stands for the Producer Price Index, which is an important piece of economic data
- PPI data is released during the second week of each month.
- Forex traders can use PPI as a leading indicator to forecast consumer inflation measured by the Consumer Price Index (CPI).
PPI is an important piece of economic data due to its signaling effect on future expected inflation. Traders monitor PPI in forex trading because of the positive relationship between inflation and interest rates, but ultimately, traders are concerned with how the resultant interest rate changes are likely to affect currency pairs. Continue reading to learn more about the PPI index and how it affects the foreign exchange market.
What is PPI and what does it measure?
PPI stands for Producer Price Index and measures the change in the price of finished goods and services sold by producers. PPI data represents the monthly change in the average price of a basket of goods purchased by manufacturers.
How is PPI calculated?
PPI examines three production areas; commodity-based, industrial-based, and stage-of-processing-based companies. Released by the Bureau of Labor Statistics, PPI is created using data collected from a mailed survey of retailers selected via a process of systematic sampling of all firms listed with the Unemployment Insurance System.
Traders can see changes in PPI expressed as a percentage change from the previous year, or on a month to month basis.
PPI and inflation
A positive change in the PPI index implies that costs are rising and, in the end, price increases get passed down to consumers. If this effect is large enough, there will be an increase in future CPI figures to reflect that the general level of prices has increased.
Inflation and the effect on the economy
An increase in the general price level is good for an economy but only when this is contained. When demand for goods and services increases, businesses must increase capital expenditure and hire more workers in order to increase their output to meet higher demand. The problem arises when prices increase drastically, resulting in a decrease in the purchasing power of a country’s currency. $1 can buy less than it could one year ago, for example.
In the 1950s, gasoline was $0.27, while apartment rent was $42/month and a movie ticket was $0.48. These figures are nowhere near to where they are today, and this reflects how inflation erodes the value of local currency. In an attempt to combat the erosion of purchasing power, central banks effectively reduce inflation by raising the benchmark interest rate.
How does PPI impact currencies?
When it comes to money there is always a trade-off: individuals can save money and earn interest, or they can spend money immediately and forgo any interest payments.
If PPI is on the rise it may cause the interest rates to rise. When interest rates go up, electing to save money looks more attractive as the reward (interest) is greater than before. Spending money becomes costlier because consumers would effectively be losing out on the higher interest rate when they choose to spend money instead of saving. As a result, increased PPI may filter down into increased rates and a stronger currency.
Using the Euro as an example, forex traders know that higher interest rates results in increased financial flows by foreign investors wanting to buy the higher yielding Euro. This effect tends to drive the value of the Euro up as the demand for the Euro has increased.
A popular strategy chasing higher interest rates is the “carry trade” strategy; whereby traders borrow funds in a currency that has a low interest rate and buy a currency with a higher interest rate.
Money follows yield and traders will look to take advantage of this.
How PPI affects the US dollar
The Producer Price Index tends to have little effect on the US dollar initially. This is because in the real economy there is a time lag between the increase in prices from producers, and the end result of higher inflation resulting from consumers having to fork out more at the tills.
However, don’t be misled by the “low priority” impact assessment of this data release. Astute traders are able to forecast the knock-on effects PPI is likely to have on CPI and interest rates and trade accordingly. Thus, the most valuable component of the PPI data is the signaling effect it provides to the market.
FOMC Preview: Dot Plot to Reveal Fewer Rate Cuts in 2024
Fed to Stay the Course and Delay Timing of First Rate Cut
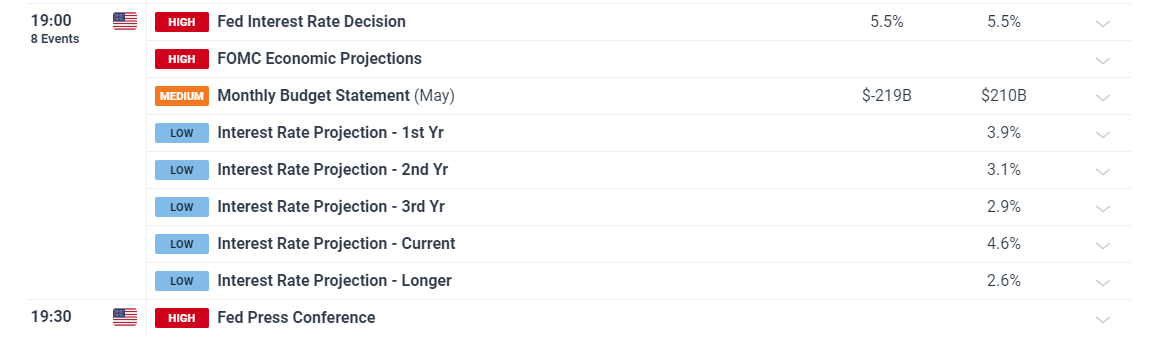
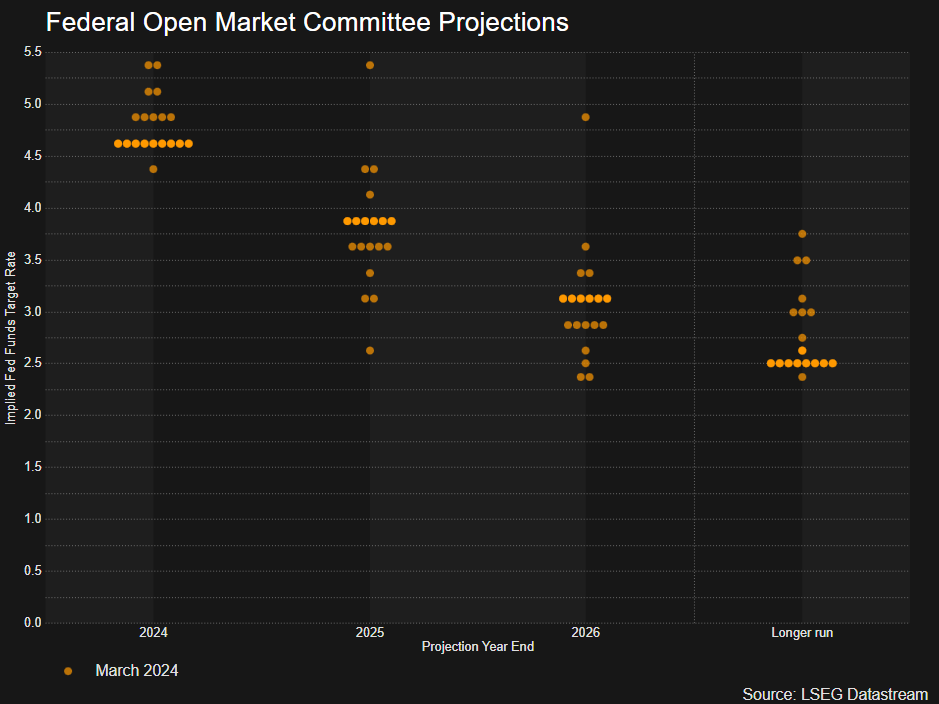
The Fed’s Federal Open Market Committee (FOMC) is overwhelmingly expected to keep interest rates unchanged after the two-day meeting ends on Wednesday – when the official statement and summary of economic projections are due. A real mix of fundamental data has complicated the outlook for the US economy and dented confidence amongst the rate setting committee that inflation is heading towards the 2% target. Most observers will focus on the Fed’s updated dot plot to gauge the path of potential US interest rates.
Inflation Shows First Inkling of a Return to 2% Trajectory – Not Enough to Restore Confidence
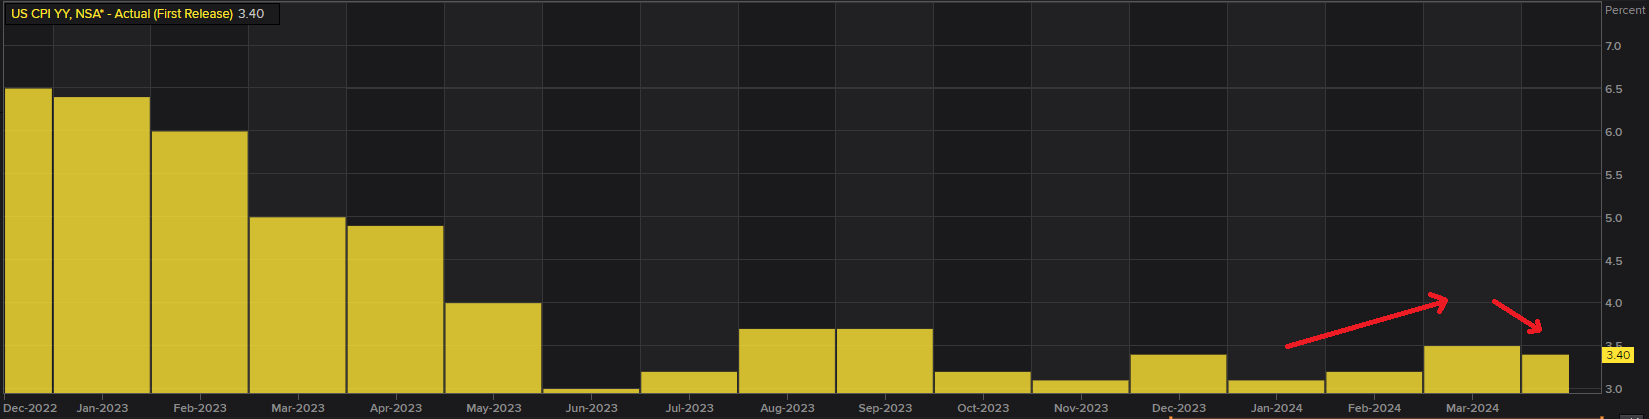
The committee is likely to deliver a similar message to the May meeting, maintaining restrictive monetary policy until they feel confident inflation is moving towards 2%. April’s year-on-year inflation print provided the first move lower since January, with Q1 synonymous with hot, rising inflation.
To make things more interesting, the May CPI data is due mere hours before the Fed statement, offering markets a catalyst ahead of the meeting. Services inflation will attract a lot of attention and more importantly, super core inflation (services inflation less housing and energy) as the Fed has placed great importance around this figure as a highly relevant gauge of inflation pressures in the economy.
US Headline CPI Year-on-Year Change
Source: Refinitiv, prepared by Richard Snow
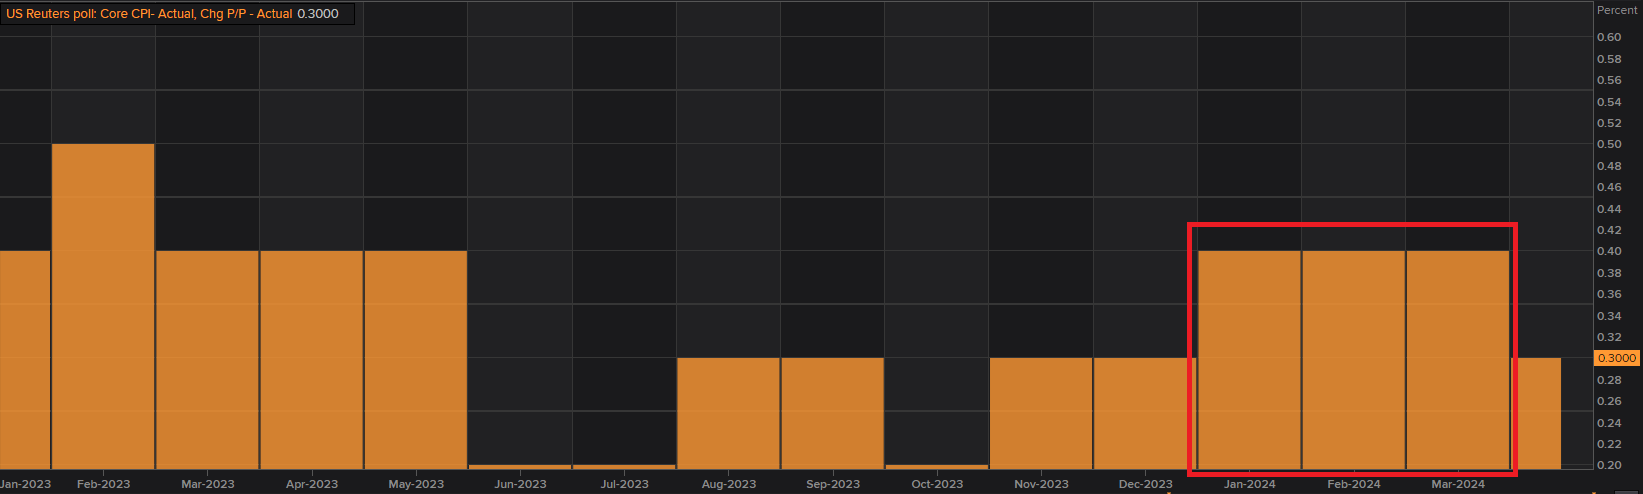
Another source of anguish for the Fed has been the month-on-month core CPI print which failed to move notably below the 0.4% level until the April data – revealing little let up in price pressures.
US Core CPI Month-on-Month
Fed Dot Plot Likely to Draw the Most Attention
Markets have moved away form a potential September rate cut after Friday’s bumper NFP surprise and now fully price in a 25 basis point cut in December, essentially wagering the Fed will only cut once this year.
Market Implied Basis Point Cuts for 2024
Source: Refinitiv, prepared by Richard Snow
However, markets are expecting a downward revision from the Fed but the jury is out as to whether the Fed will trim their forecasts back by a single cut or as much as two cuts which would align the Fed with the market view.
US growth forecasts will also be updated at a time when US GDP has moderated notably since the 4.9% in Q3 2023. Q1 GDP disappointed massively when compared to estimates but the Atlanta Fed’s forecast of Q2 GDP has recovered strongly, to 3.1% (annualised), suggesting the economy is on track for a strong rebound. It is important to note the Atlanta Fed’s forecast takes into account incoming data and has not anticipated the remaining data for June which will likely impact the actual figure.
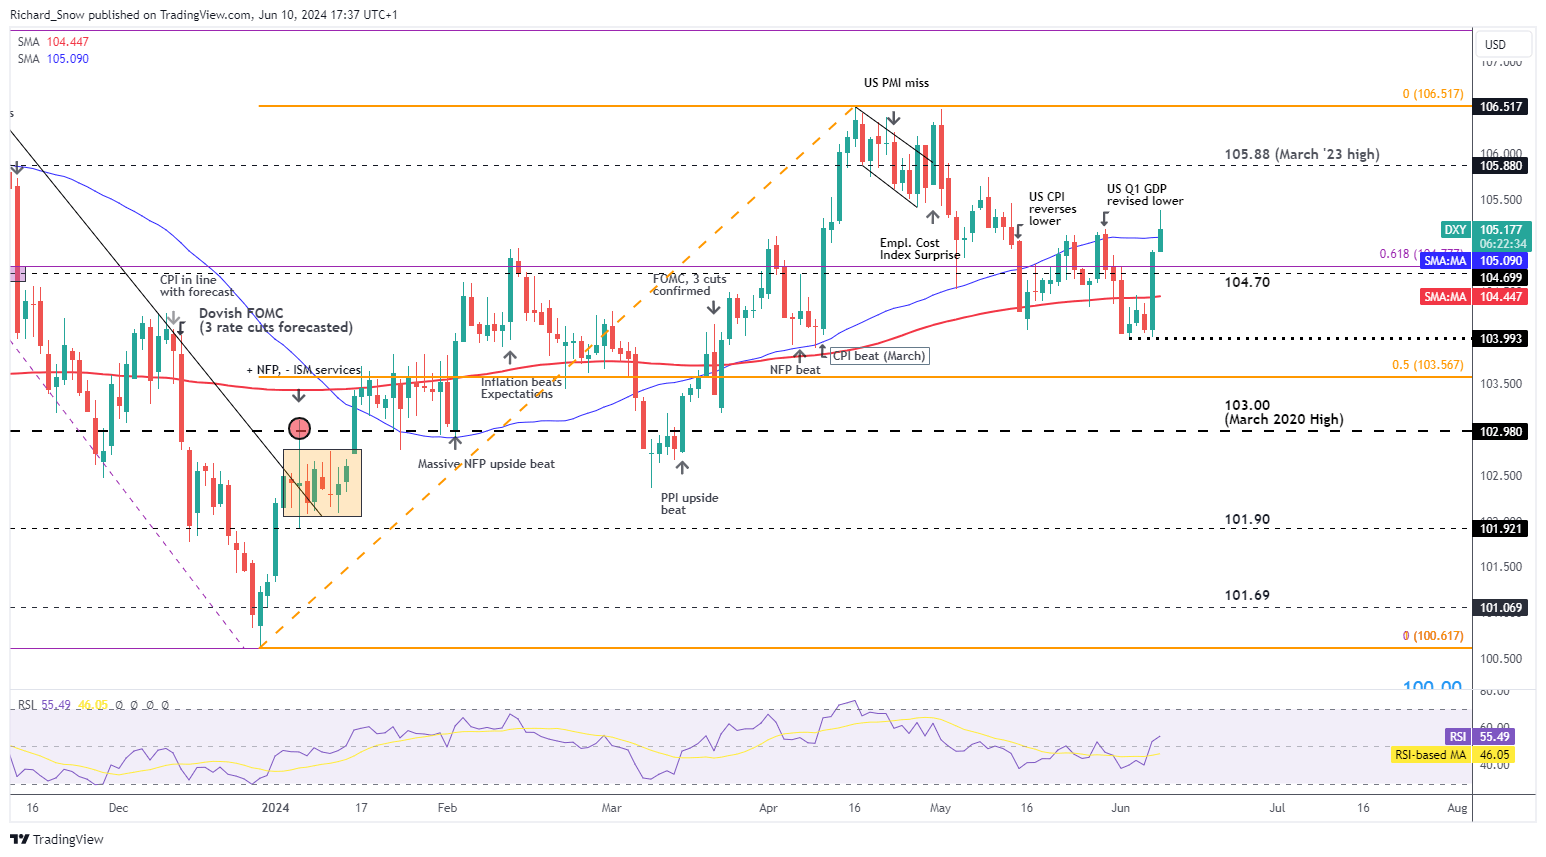
US Dollar’s Continued Ascent Reliant on Inflation and the Dot Plot
The US dollar surged higher on the back of Friday’s impressive NFP print. However, the longer-term direction of travel remains to the downside as there remains an expectation that interest rates will have to come down either this year or next as the economy is likely to come under strain the longer it operates under restrictive conditions. This assumption limits the dollar’s upside potential unless inflation data persistently surprises to the upside. Nevertheless, the shorter-term move witnessed in the dollar could extend if the Fed foresee just a single rate cut this year.
A lower CPI print on Wednesday could see the dollar ease as inflation remains the chief concern for the Fed but recent prints have not been awfully helpful, suggesting a sharp drop is a low probability event. Given that markets anticipate just one rate cut this year, the greenback may pullback in the event the Fed trims its rate cut expectations from three to two for 2024. 105.88 remains the level of interest to the upside while 104.70, the 200 SMA, and 104.00 remain levels of note to the downside.
US Dollar Basket (DXY) Daily Chart
If you’re puzzled by trading losses, why not take a step in the right direction? Download our guide, “Traits of Successful Traders,” and gain valuable insights to steer clear of common pitfalls
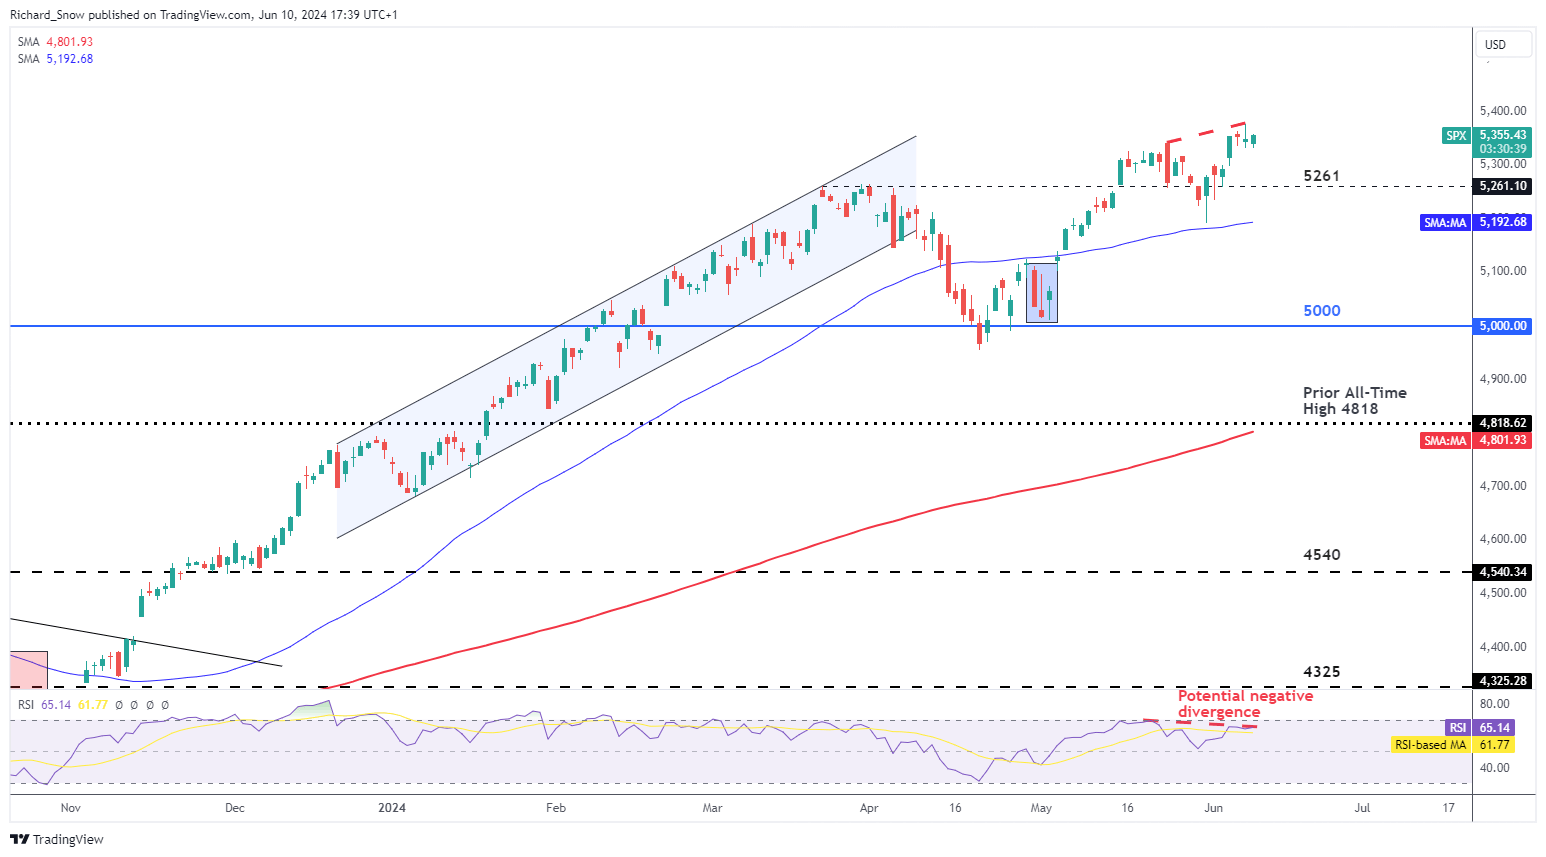
S&P 500 Consolidates at Fresh High Ahead of the FOMC Meeting
A dovish Fed outcome is likely to refuel the impressive equity performance to another high but a lower revision to the dot lot could weigh on stocks and send the index lower. In that scenario, 5260 and the blue 50-day simple moving average (SMA) appear as levels of interest to the downside.
S&P 500 Daily Chart
Euro, CAC 40 Sink on French Snap Election Call; EUR/USD and EUR/GBP Latest
The Euro is weakening across a range of EUR-pairs in early trade after this weekend’s European elections saw a marked shift to the right. After being heavily defeated by Marine Le Pen’s National Party, French President Emmanuel Macron called a snap election, while in Germany Chancellor Olaf Scholz saw his Social Democrat Party beaten by the far-right Alternative for Germany (AFG) party. France will go to the polls on June 30th, while Chancellor Scholz is now under pressure also to call an election.
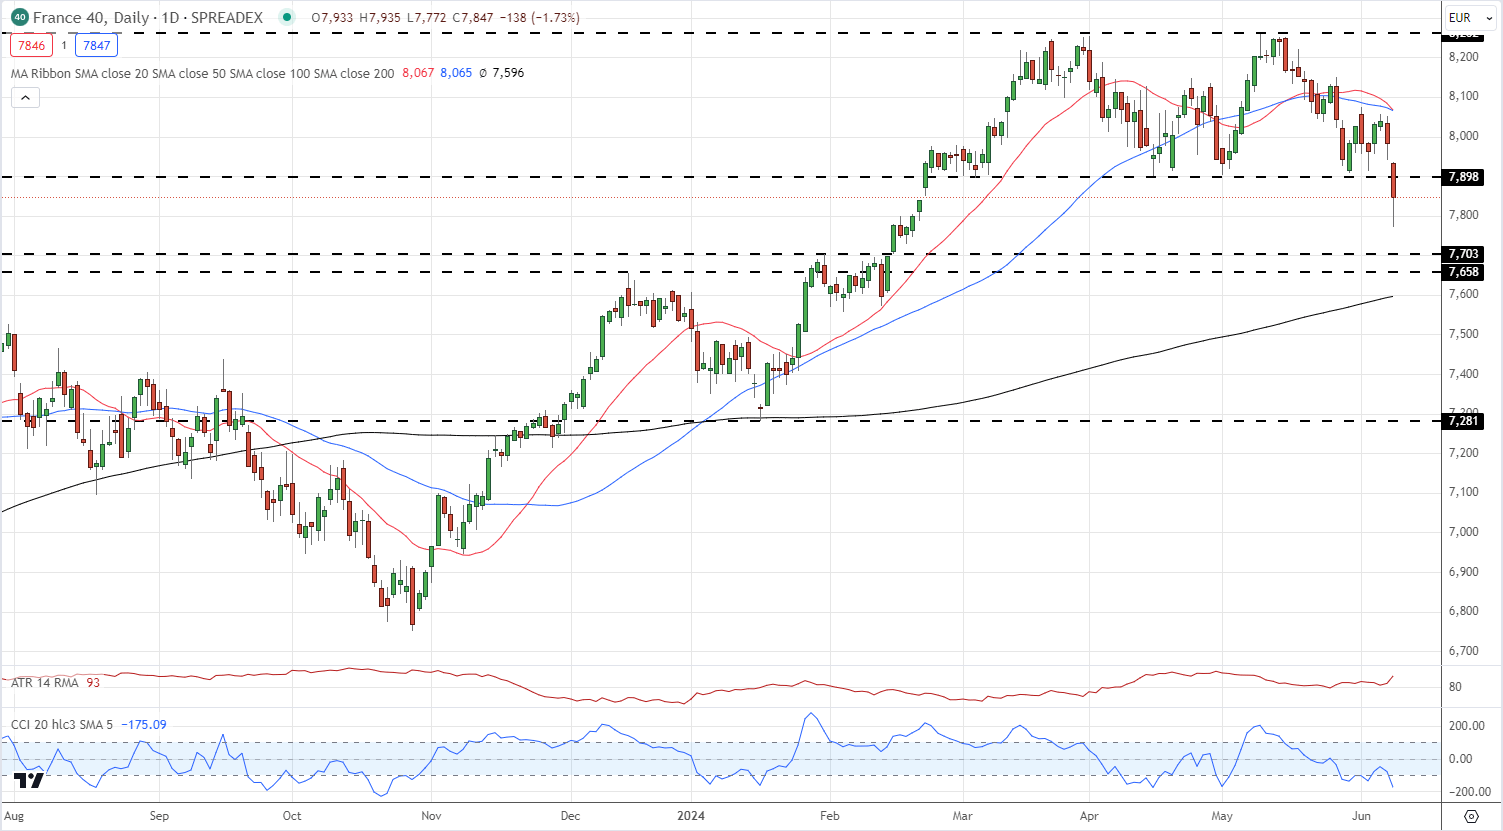
The renewed political uncertainty can be seen across a range of assets Monday, with the French CAC 40 currently trading over 1.7% lower, while the Euro is weak against a range of currencies. The CAC 40 is trading at a fresh multi-month low after breaking support around the 7,900 level. The next zone of support is seen between 7,703 and 7,658.
CAC 40 Daily Chart
Recent changes in sentiment warn that the current France 40 price trend may soon reverse lower despite the fact traders remain net short.
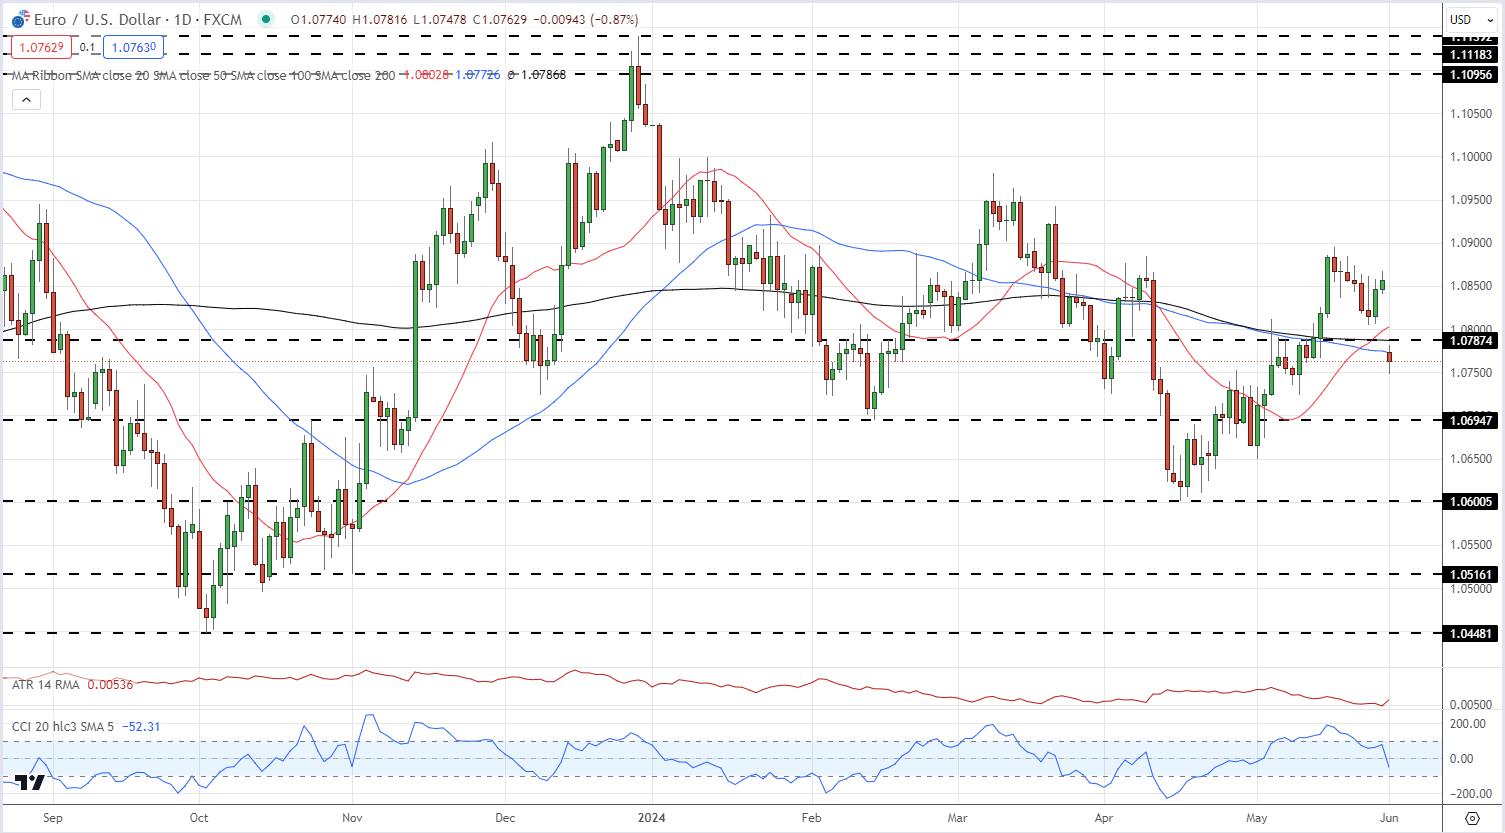
EUR/USD fell through all three simple moving averages and prior horizontal support in early trade before finding stability around 1.0750. The next level of support is seen just below 1.0700.
EUR/USD Daily Price Chart
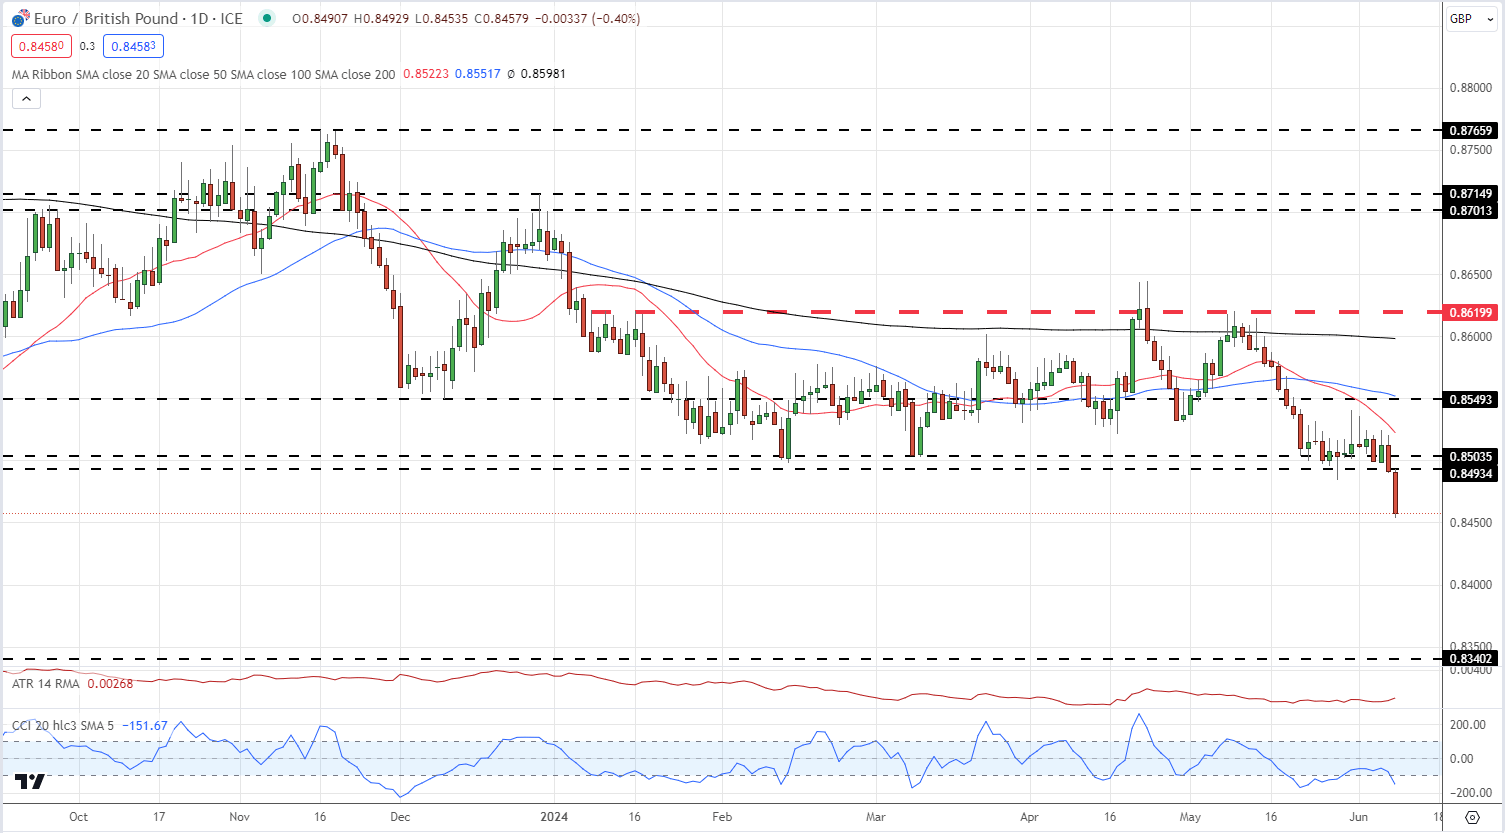
EUR/GBP is now back at lows seen 22 months ago after support around the 0.8500 area fell with ease earlier today. This area now turns into short-term resistance. The next level of support is seen at around 0.8340, the early August 2022 swing-low.
EUR/GBP Daily Chart
Retail Trader Sentiment Analysis: EUR/GBP Bias Remains Mixed
According to the latest IG retail trader data, 79.17% of traders are net-long with the ratio of traders long to short at 3.80 to 1.The number of traders net-long is 0.41% higher than yesterday and 3.78% higher than last week, while the number of traders net-short is 4.84% higher than yesterday and 7.80% lower than last week.
We typically take a contrarian view to crowd sentiment, and the fact traders are net-long suggests EUR/GBPprices may continue to fall. Positioning is less net-long than yesterday but more net-long from last week. The combination of current sentiment and recent changes gives us a further mixed EUR/GBP trading bias.
Will the Massive NFP Surprise Influence Fed Thinking ahead of FOMC?
The massive surprise in US job growth lent a strong hand to the downtrodden dollar ahead of US CPI for May and the FOMC meeting in the week to come.
Non-farm payroll data jolted markets on Friday after the number of jobs added in May surpassed even the most optimistic of estimates. In addition, average earnings for May also rose above the highest estimate compared to May last year to extend the dollar’s bullish advance.
The fact that the unemployment rate rose to 4% appeared to fade into the background as it was not notable enough to detract from the jobs and wage data. Next week, more top tier US data is due with a bumper very busy Wednesday consisting of US CPI and the FOMC rate decision later in the evening. The surprising jobs data is unlikely to derail the current Fed thinking but has had an effect on market pricing where there is just the one rate cut fully priced in this year with a chance of a second. Other macroeconomic data in the US has eased, meaning the jobs data will need to be followed closely if any trend is emerging but for now, it is just one print.
Sterling is also in focus next week and it appears to have quietly appreciated in the background. UK jobs data is followed by GDP data for April. The UK labour market has softened more visibly than in the US but growth is showing positive signs if recent surveyed data is to be taken at face value. The Bank of Japan rounds up the week after officials pointed towards a more relaxed approach to aggressive bond purchases – an outcome that could see Japanese 10-year yields trade freely above the 1% mark which is likely to provide a lift for the yen.
How to Trade After a News Release
Post-release trading strategies
1. Trend following strategy
This strategy involves the use of multiple time frames, as well as, well-defined levels of support and resistance that come into play after a news release.
Traders can adopt this strategy when the current market price is approaching a well-defined level of support or resistance but isn’t quite there yet. The volatility after the news release has the potential to push the market toward the trendline. If price respects the trendline, traders can look to trade in the direction of the trend and trade the potential bounce.
The following 4 points are of assistance for this type of trade:
- Determine trend direction on a daily chart
- Draw support and resistance lines
- Select a forex time frame anywhere from 1 – 4 hours
- Buy near support in uptrend and sell near resistance in downtrend
Keep in mind that news releases have the potential to break through longstanding levels of support and resistance which underscores the importance of using tight stops when pursuing this strategy.
2. Dual spike breakout strategy
This strategy involves waiting for market volatility to reveal a range before trading a break of that range and makes use of a five-minute chart. For illustrative purposes this section incorporates the US Non-Farm Payroll (NFP) release as this often has the greatest potential to move the market.
After the NFP release, wait 15-minutes for three five-minute candles to close. Take note of the highest price and the lowest price of the three closed candles. Next, place an entry order to go long at the highest price and an entry to go short at the lowest price. Once an order is triggered, targets can be set at twice the distance of the high/low channel while stops can be set above resistance for short trades and below support for long trades.
The disadvantage of this strategy is that volatility can push price above or below the short-term range, triggering an entry order, and then immediately reversing to hit a stop loss.
This strategy can be applied in the following way:
- Customize the chart settings to show 5- minute charts
- Take note of the highs and lows of the first three candles
- Set entry orders when price breaks above or below the range
- Set stops and limits
- Delete the unfilled order
<alt image desc> Dual spike forex news trading strategy
3. News Reversal Strategy
The market can trade in one direction immediately after a major news release only to reverse and trade in the opposite direction.
The news reversal strategy looks to trade the news after the release and focuses on a sudden, sustained reversal in direction after a strong initial move in price.
The reversal could be the result of algorithms or, the market as a whole, feeling that there was an overreaction in price – prompting trades in the opposite direction.
The downside of this strategy is that no reversal takes place and the price continues trading in the direction on the initial spike.
How to implement the news reversal strategy:
- Initial spike in price: News with great market moving potential generally lead to a spike in price as the news is released.
- Look out for a reversal: Traders can wait 10-15 minutes for the reversal to bring price back to where it was before the release.
- Entry: Enter as price breaks above/below pre-release levels.
- Set multiple target levels: Traders should consider setting multiple target levels. As one is triggered, traders can take profit on half of the position and adjusting the stop on the remaining position to breakeven.
Trading forex after the release: Conclusion
Trading the news after the release can be a more conservative way to approach news trading. This is due to the emotions from the news release subsiding allowing a trader time to plan a technical set up for their trade. Regardless of your trading approach to news trading, risk management and utilizing small amounts or no leverage is critical to maintaining capital in your account to make the next trade.
US Dollar Jumps After NFPs Thump Expectations, Gold Hits a One-Month Low
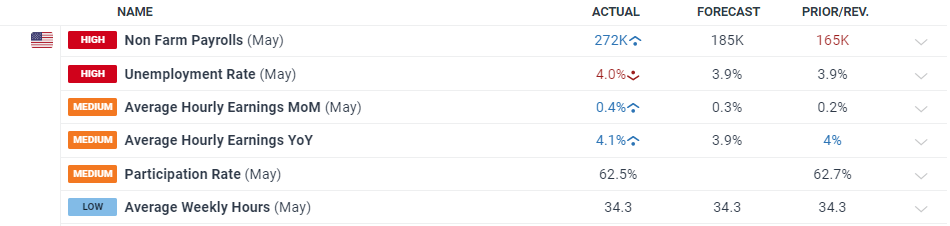
The latest US Jobs Report showed 272k new roles created in May, dwarfing expectations of 185K and April’s 165k (revised lower from 175k). The unemployment rate rose to 4.0%, from 3.9%, while monthly average earnings rose to 0.4% from 0.2% last month.
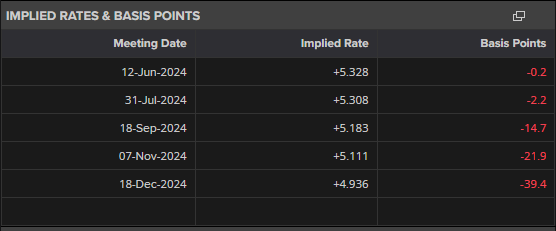
Today’s release contrasts weak ADP and JOLTs jobs data released this week, which has boosted the dollar as US rate cut expectations fade further. The market is implying that the first cut may happen in November although this isn’t fully priced.
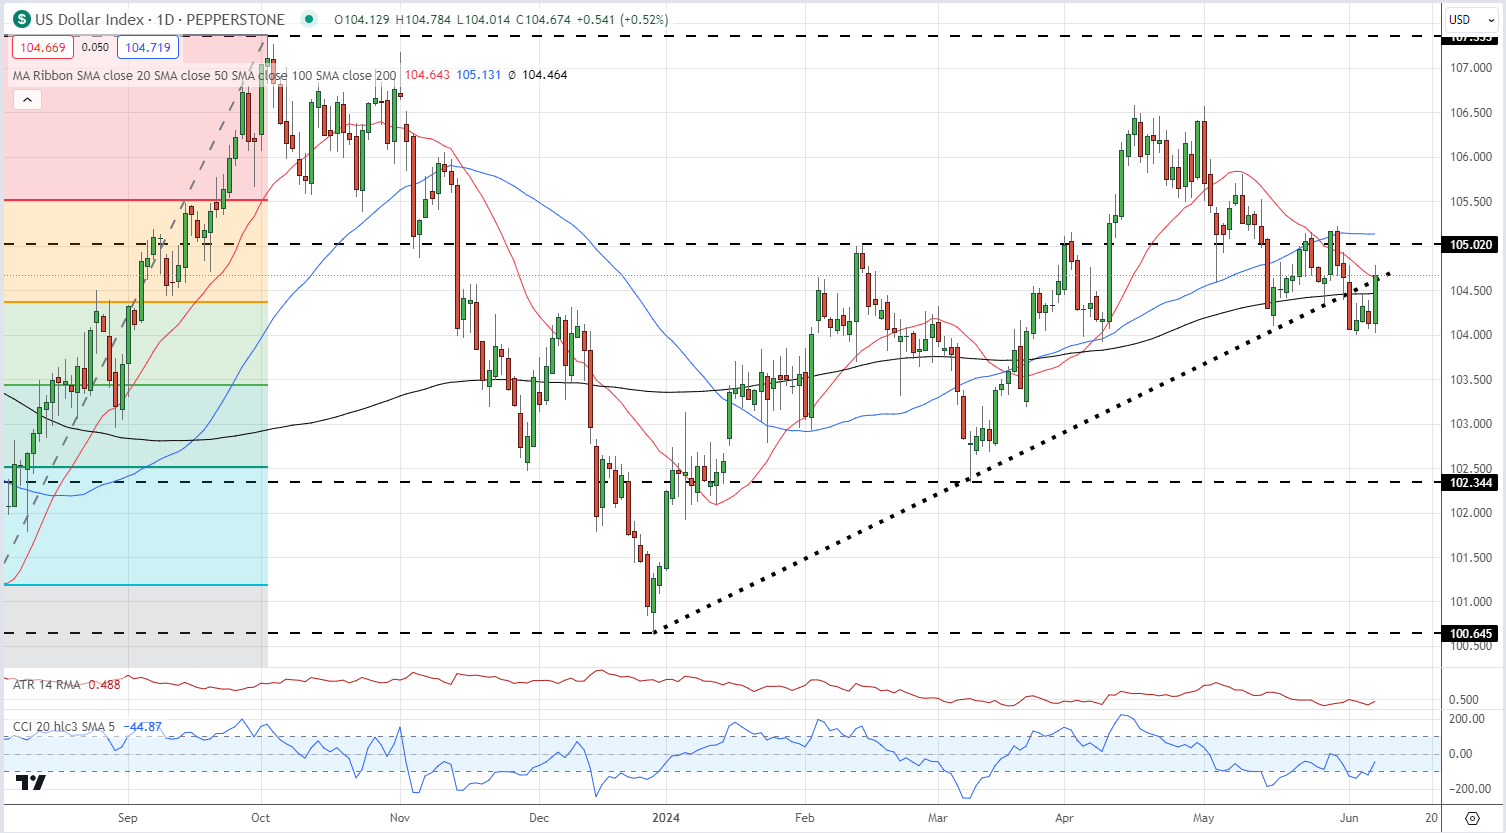
The dollar index has been under pressure this week from the weak ADP and JOLTs data but regained all of this week’s losses after the NFP numbers hit the screens. The dollar index has broken back above the 200-dsma and the 38.2% Fib retracement and is currently testing the multi-month trend support.
US Dollar Index Daily Chart
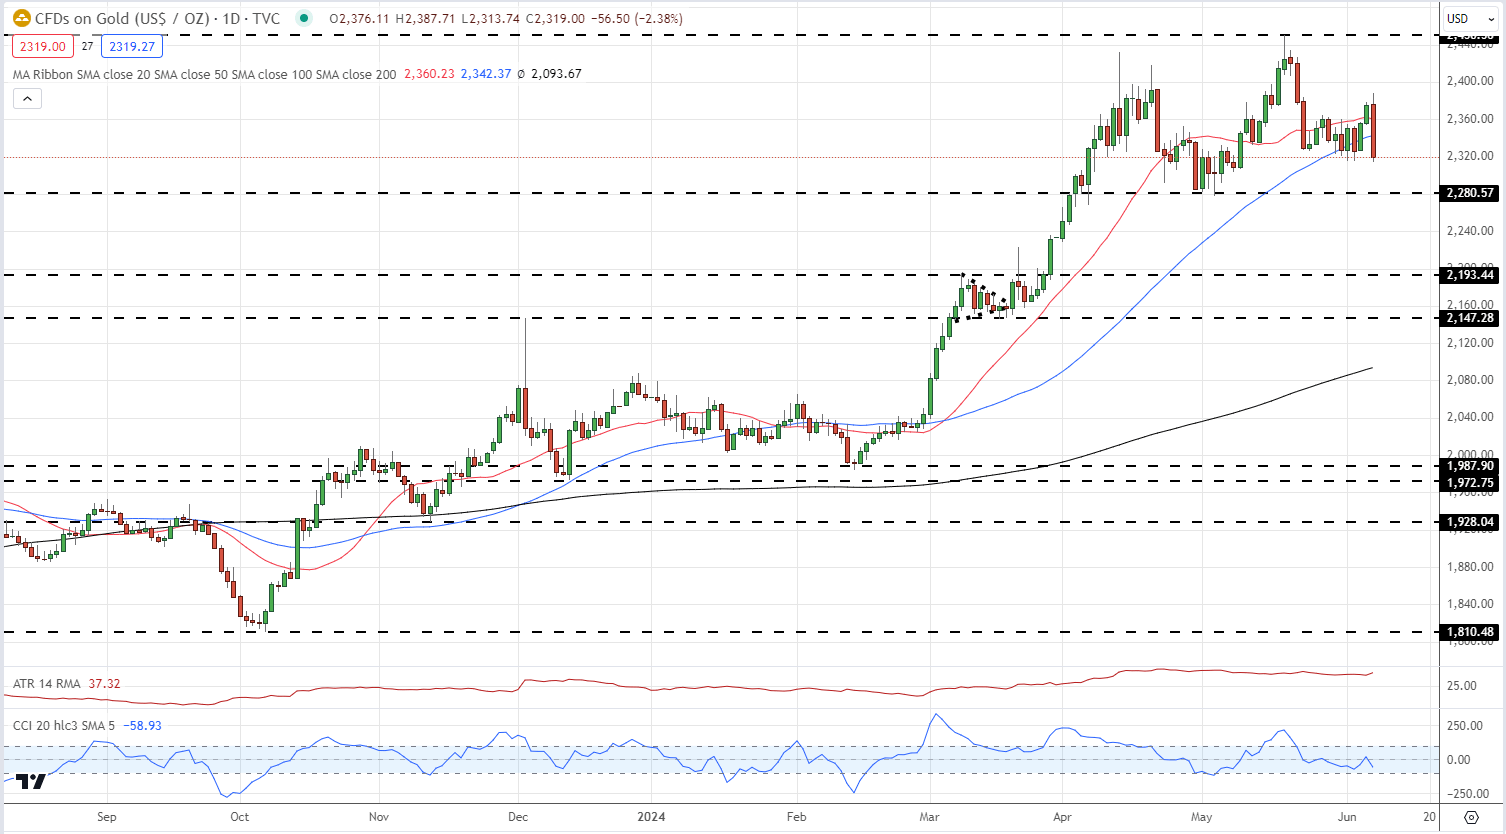
Gold is now posting a fresh one-month low and gold bulls have endured a difficult day. Earlier today a Bloomberg report noted that China had stopped buying gold, sending the precious metal down $20/oz. in quick order. A confirmed break and open below the $2,315/oz. would bring $2,280/oz. back into play.
Gold Daily Price Chart
All Charts by TradingView
Retail trader data shows 58.32% of gold traders are net-long with the ratio of traders long to short at 1.40 to 1.The number of traders net-long is 1.24% higher than yesterday and 10.13% lower from last week, while the number of traders net-short is 1.85% lower than yesterday and 0.09% higher from last week.
We typically take a contrarian view to crowd sentiment, and the fact traders are net-long suggests Gold prices may continue to fall. Positioning is more net-long than yesterday but less net-long from last week. The combination of current sentiment and recent changes gives us a further mixed Gold trading bias.