NFP Preview: Is the US Job Market Finally Weakening?

NFP Preview: Is the US Job Market Finally Weakening?

Non-Farm Payroll Data Expected to Drop in May

The main event for the week is upon us as non-farm payroll is expected to bounce back slightly from last month’s disappointing print. In April, US jobs came in way below what was expected – providing the first real sign of weakness in the labour market despite months of restrictive monetary policy filtering through the economy. The April data was the first real shock to the labour market as all prior data beat market estimates this year. As always, keep an eye on any revisions to last months print when May’s NFP figures are released this afternoon.
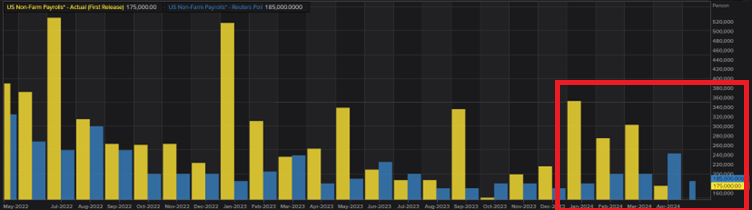
image1.png

The expectation is for 185 thousand jobs to have been added in May, which is some way off the 315k jobs added in the month of March but represents a marginal recovery from April. The unemployment rate is expected to remain steady at 3.9%.
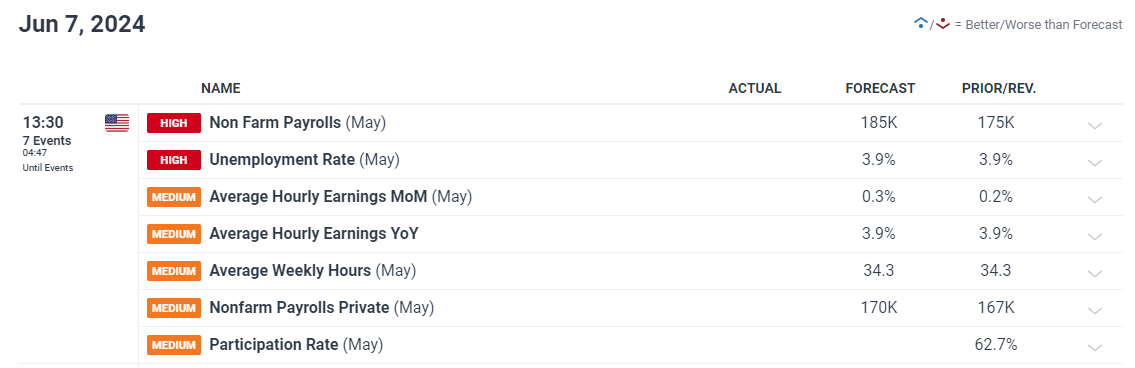
image2.png

Learn how to prepare for high impact economic data or events with this easy to implement approach:

This Week’s Jobs Data Leans Towards a Softer Print

If this week’s labour data is anything to go by, NFP could lean slightly towards the lower side of the 185k estimate with the range of potential outcomes rather wide, between 120k and 258k. Naturally, markets will be on the lookout for a any sizeable deviation from the forecast as this tends to spur speculative activity on the back of the implications the data may have for interest rates or the wider economy. Private payroll data disappointed

Job openings were trimmed back, nearer to the 8 million mark – suggesting businesses have tapered their demand for labour – while job quits rose slightly. Job quits usually provide a gauge of nervousness within the labour market as workers tend to quit when they feel their prospects of finding suitable employment elsewhere are manageable and tend to stay in their current position when companies institute hiring freezes. In addition, the National Federation of Independent Business (NFIB) survey continues to show a declining willingness of firms to hire additional workers:

NFIB Percentage of Firms Planning to Increase Employment
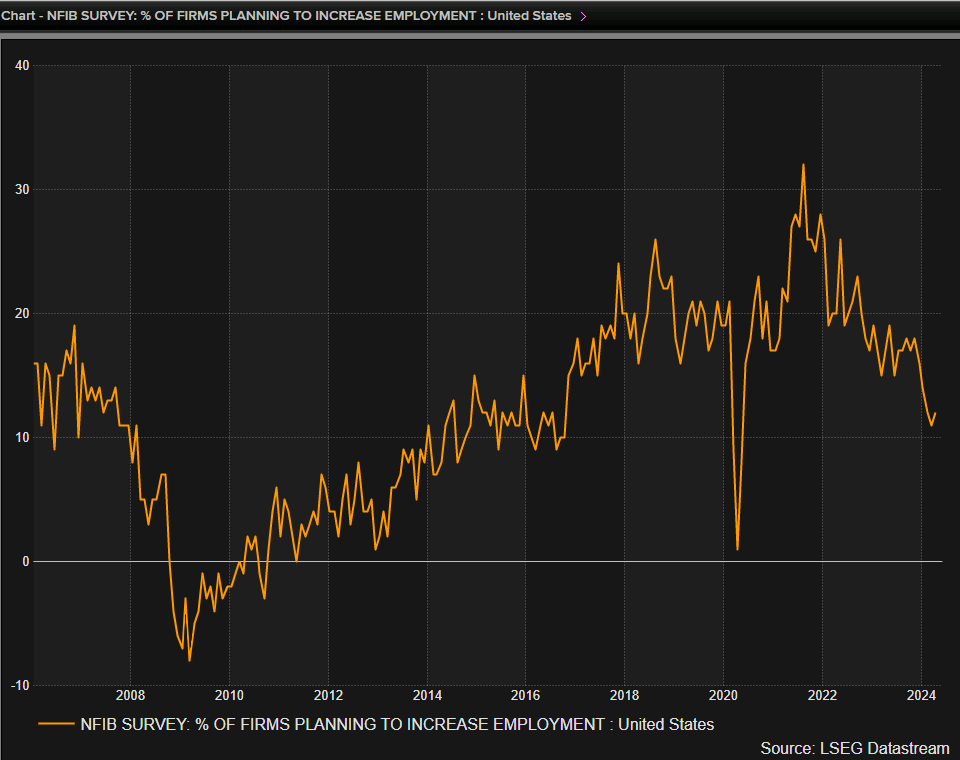
image3.png

On a broader macro level, US data appears to have turned the corner with ‘US exceptionalism’ well and truly a narrative of the past. US GDP growth for Q1 was revised lower after already massively missing the mark. Q1 GDP stands at a meagre 1.3% after initial estimates of 2.6% and the Atlanta Fed recently tracked Q2 growth at 1.8% (annualized).

Other data points like manufacturing PMI and inflation have all turned lower. One standout continues to be the services sector as those PMI figures suggest a continued expansion in the most important sector in the US.

US Dollar Snapshot Ahead of NFP: Weekly Low Comes into Sharp Focus

The US dollar got off to a bad start at the beginning of this week and yesterday’s hawkish ECB rate cut lifted the euro – placing the dollar index on the back foot once again. Disappointing US data continues to weigh on upside potential but markets still don’t fully price in two rate cuts this year but should the data worsen, that is still very much a possibility.

Ahead of NFP, this week’s low comes into focus at 104 flat. The US dollar index carries a high weighting in EUR/USD meaning the hawkish cut yesterday has weighed on the greenback with the move maintaining the potential of an extended move lower is the NFP figure misses the mark or the unemployment rate rises to 4% or above. 103 naturally becomes the next level of support but the decline may not be a fast one since inflationary pressures have dented the Fed’s confidence that we are on the path to 2%. A beat in the NFP number would need to be sizeable to propel the dollar higher, given recent disappointing data but the 200 SMA at 104.43 remains as resistance followed by 104.70.

US Dollar Basket (DXY) Daily Chart
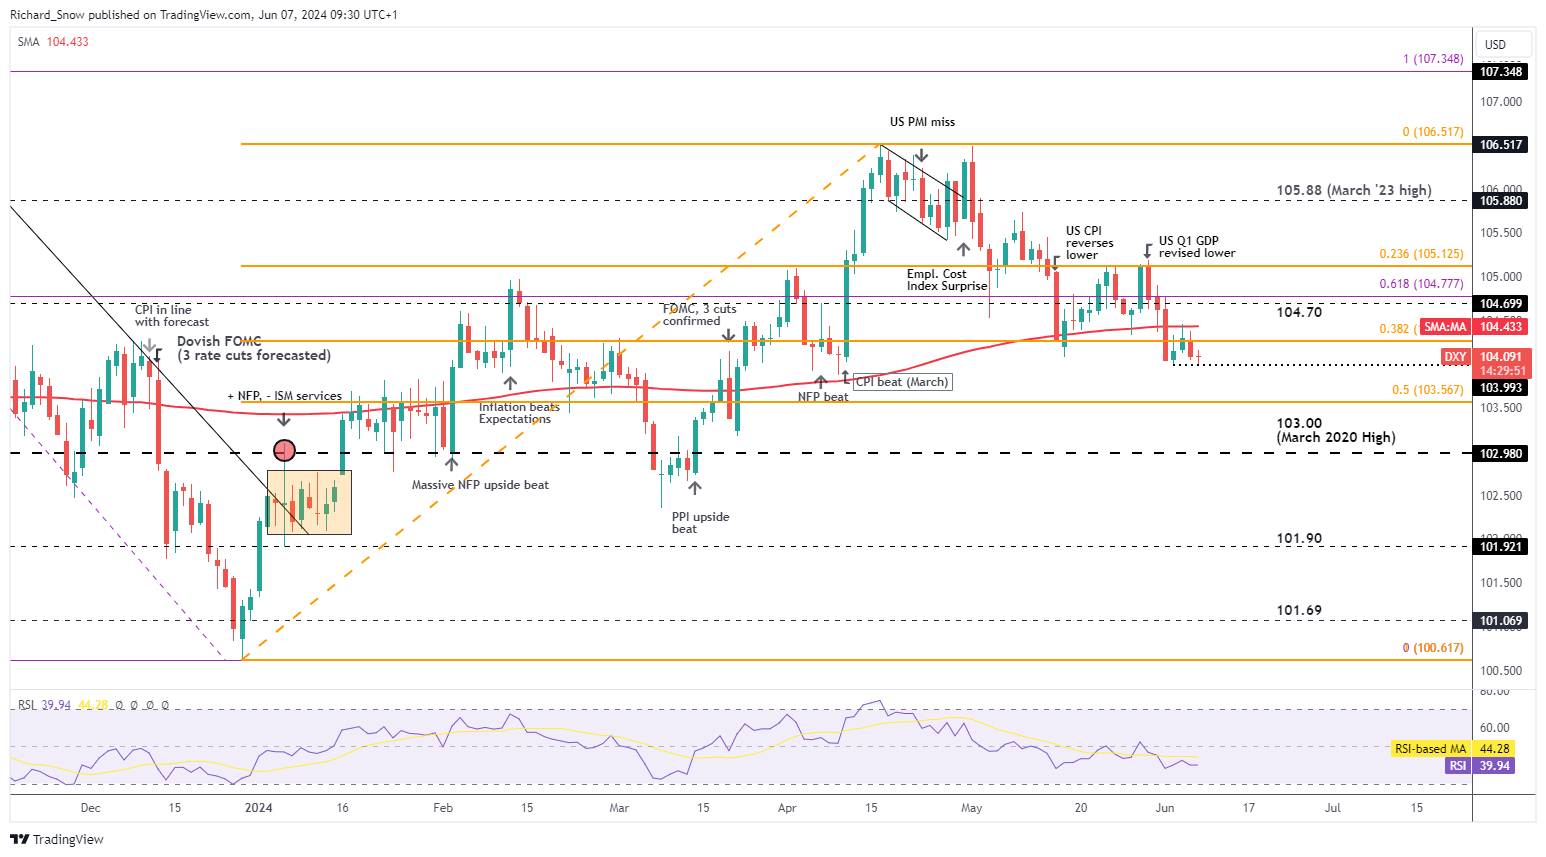
image4.png


NFP and Forex: What is NFP and How to Trade It?

NFP and Forex: What is NFP and How to Trade It?

What is the NFP?

The non-farm payroll (NFP) figure is a key economic indicator for the United States economy. It represents the number of jobs added, excluding farm employees, government employees, private household employees and employees of nonprofit organizations.

US Non Farm Payroll historical results

NFP releases generally cause large movements in the forex market. The NFP data is normally released on the first Friday of every month at 8:30 AM ET. This article will explain the role NFPs play in economics and how to apply NFP release data to a forex trading strategy.

How does the NFP affect forex?

NFP data is important because it is released monthly, making it a very good indicator of the current state of the economy. The data is released by the Bureau of Labor Statistics and the next release can be found on an economic calendar.

Employment is a very important indicator to the Federal Reserve Bank. When unemployment is high, policy makers tend to have an expansionary monetary policy (stimulatory, with low interest rates). The goal of an expansionary monetary policy is to increase economic output and increase employment.

So, if the unemployment rate is higher than usual, the economy is thought to be running below its potential and policy makers will try to stimulate it. A stimulatory monetary policy entails lower interest rates and reduces demand for the Dollar (money flows out of a low yielding currency). To learn exactly how this works, see our article on how interest rates effect forex.

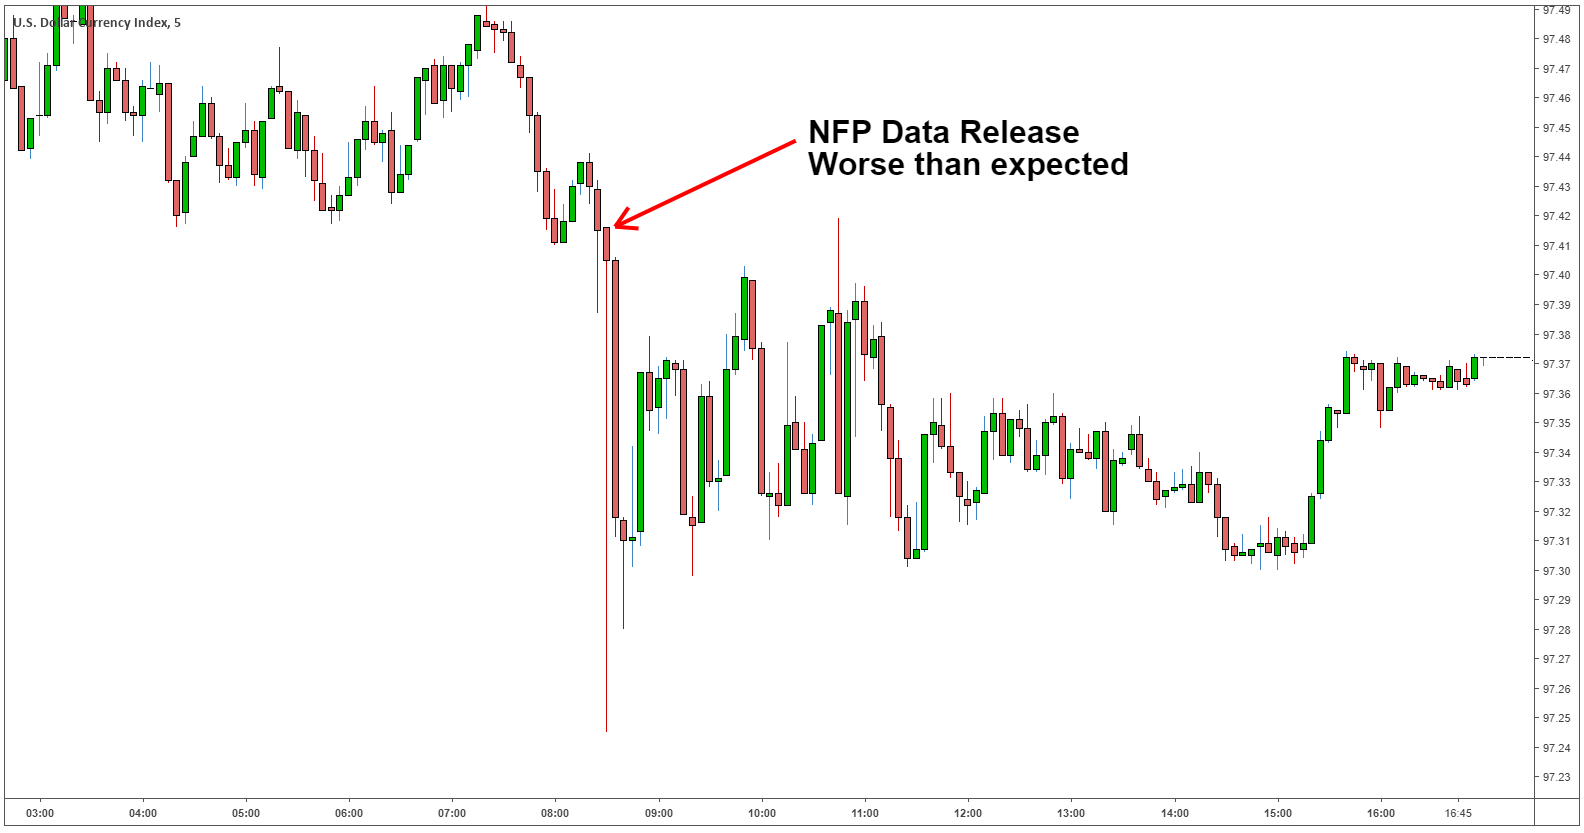
The chart below shows how volatile forex can be after an NFP release. The expected NFP results for March 8, 2019 were 180k (job additions), the actual result disappointed with only 20k jobs being added. As a result, the Dollar Index (DXY) depreciated in value and volatility increased.

NFP forex reaction

Forex traders must be wary of data releases like the NFP. Traders could get stopped-out due to the sudden increase in volatility. When volatility increases, spreads do too, and increased spreads can lead to margin calls.

Which currency pairs are most affected by NFP

The NFP data is an indicator of American employment, so your currency pairs that include the US Dollar (EUR/USD, USD/JPY, GBP/USD, AUD/USD, USD/CHF and others) are most affected by the data release.

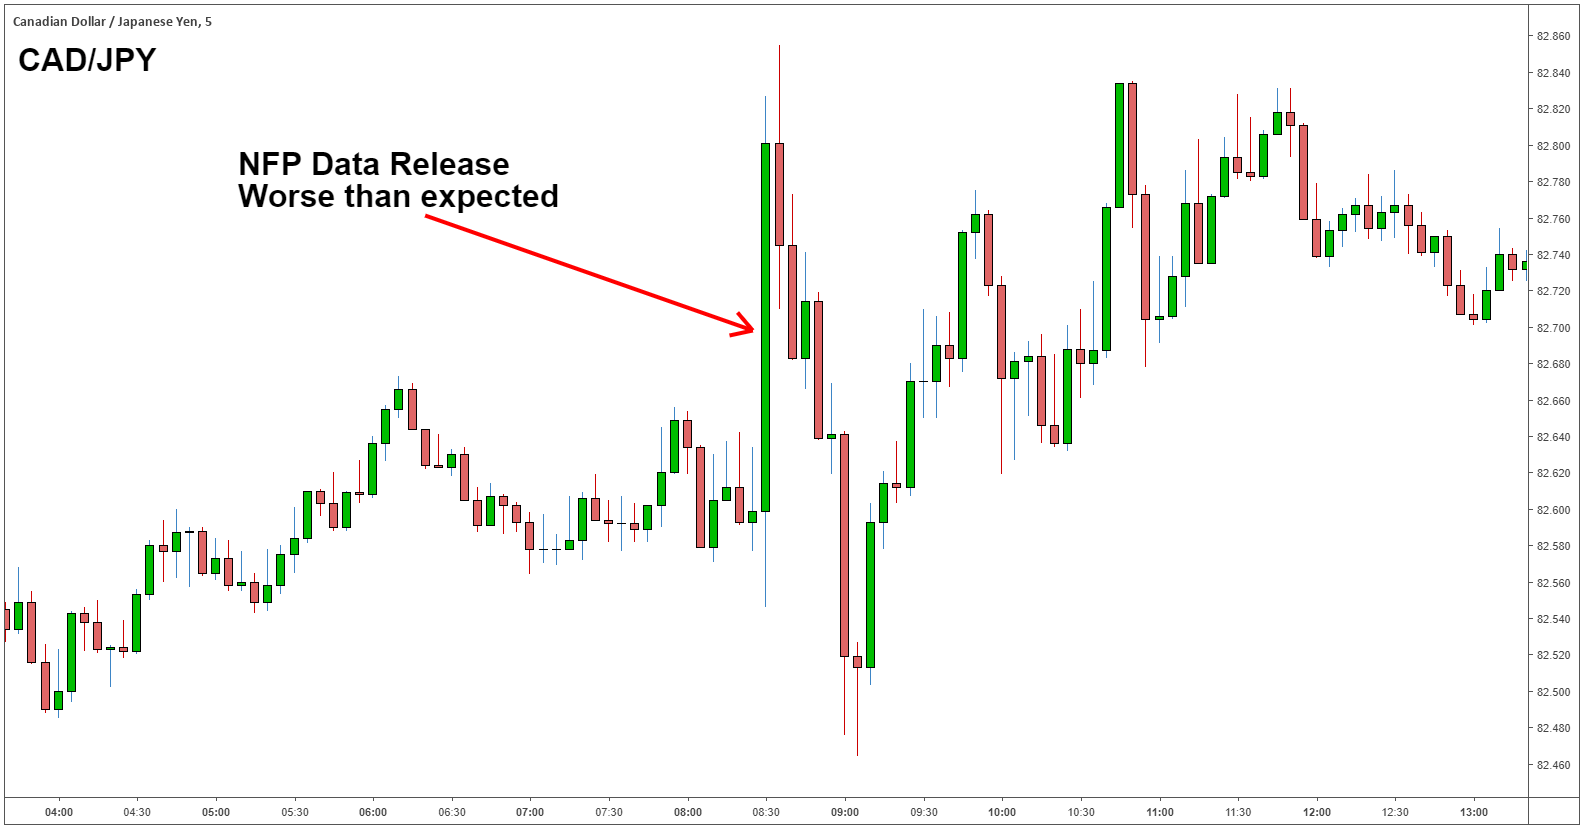
Other currency pairs also display an increase in volatility when the NFP releases, and traders must be aware of this as well, because they may get stopped out. The chart below shows the CAD/JPY during the NFP data release. As you can see, the increase in volatility could stop a trader out of their position even though they are not trading a currency pair linked to the US Dollar.

CAD/JPY NFP reaction

Non-farm payroll release dates

The Bureau of Labor statistics normally releases the NFP data on the first Friday of each month at 8:30 AM ET. The release dates can be found on the Bureau of Labor Statistic’s website.

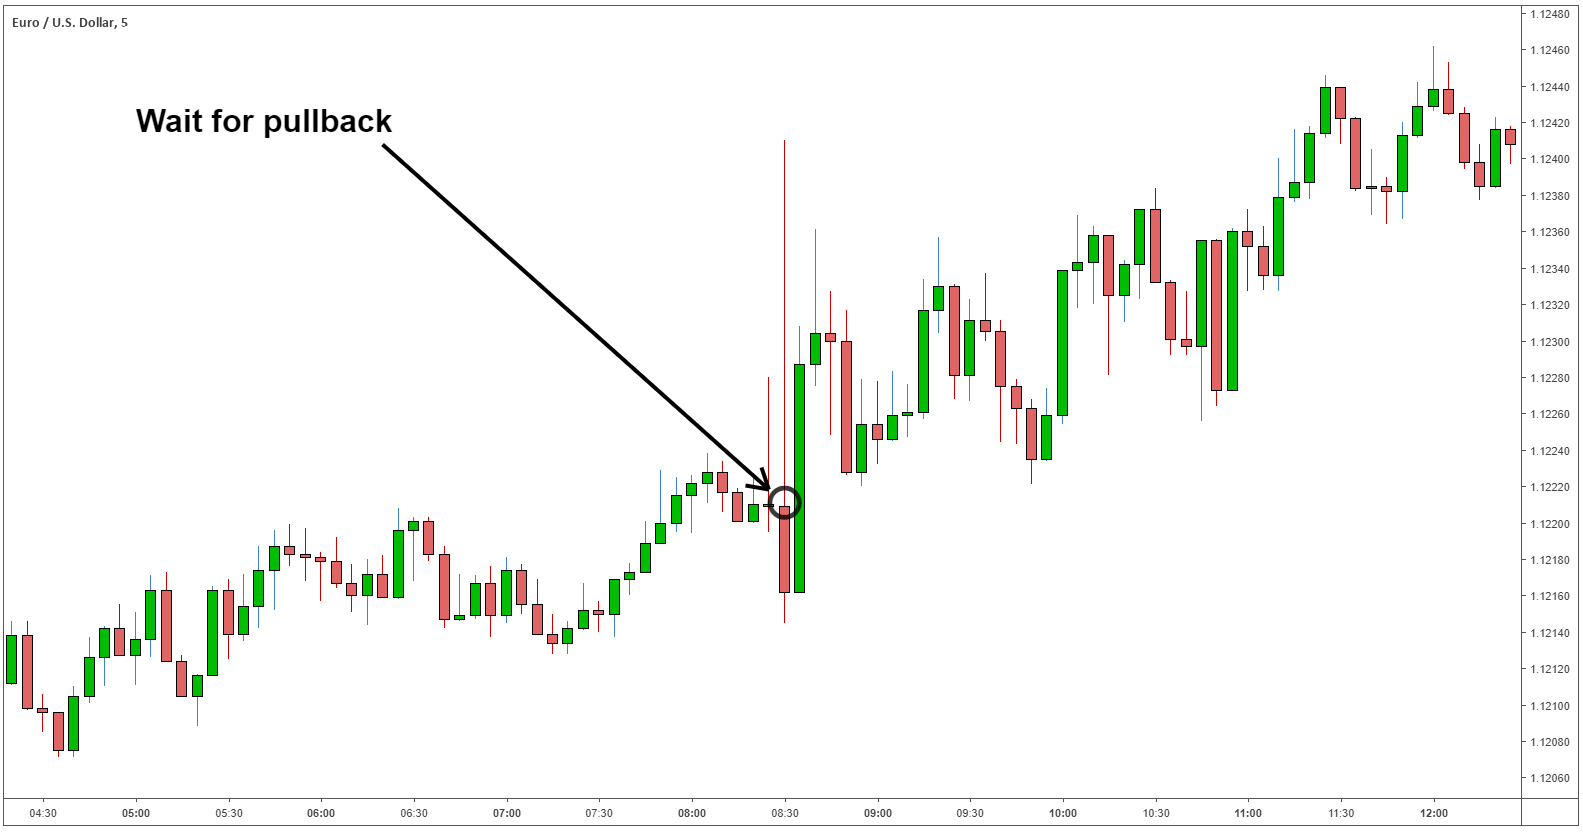
Due to the volatile nature of the NFP release, we recommend using a pull-back strategy rather than a breakout strategy. Using a pullback strategy, traders should wait for the currency pair to retrace before entering a trade.

Using the same example as above (NFP results 20k vs 180k expected) we expect the US Dollar to depreciate. In the example below, we use the EUR/USD. Because the NFP data came out worse than expected, we forecast the EUR/USD to appreciate.

EUR/USD NFP data pullback strategy

Trading Journal: What it is and How to Create One

Trading Journal: What it is and How to Create One

What is a trading journal?

A trading journal is a log that you can use to record your trades. Traders use a trading journal to reflect upon previous trades so that they may evaluate themselves, and you should too! You can use journals to evaluate where you can improve your trading. They are a useful form of record keeping.

Why trading journals are useful

Main reasons to keep a trading journal include:

  • They help you identify weak points and strong points in your style.
  • Journals could increase trading consistency.
  • The journal could keep you accountable.
  • The journal can help you choose your best trading strategy.

Keeping a journal is a simple yet extremely effective way to improve a trading plan. A trading plan is a set of rules and guidelines you will follow that includes strategy, risk management, and trader psychology.

How to create a trading journal

Creating a trading journal is simple and you can tailor one to your specific trading goals and style. The following steps are a basic guide, which are explained in more depth below:

  1. Choose between a book or a spreadsheet. We recommend using a spreadsheet.
  2. Identify what information you would like to record. (Date of trade, underlying asset, position size etc.)
  3. Record your trades directly after you have finished placing your stop losses and take profits.
  4. After a designated period (daily/monthly/weekly) compile the data and reflect upon the trades.

Step 1: Choose a book or spreadsheet

We recommend using a spreadsheet because of the built-in analytical functions. These can help you reflect upon the trades as we explain in step 4.

Step 2: Identify the information to record

The standard format of a trading journal will include these main criteria:

Currency Pair Size Long/Short Date Conviction Strategy used Points Successful or not?
USD/JPY 1 lot Long 30 Jan 19 High Fundamentals 100 Successful

The standard format is an example of a simple trade journal. It can help you reflect on your trades, but with a few extra criteria we can enhance the journal so that it provides much more useful information.

Useful information to consider adding include:

Reason for trade: The reason could be due to technical or fundamental analysis or a combination of both. Once you have executed several trades you can reflect on this information to see if your reasons for trading are bearing tangible results. This could also help you determine which strategy works better for you.

Conviction: Conviction is how you feel about the trade. If you are making the trade based on a technical pattern and if the pattern ‘checks off’ several guidelines, then we can list the conviction as ‘high’. However, if the pattern or fundamental story isn’t really clean, then the conviction may be ‘medium’ or ‘low’ depending on the factors basing the trade. By writing down your conviction, you can calculate the amount of successful trades you have had with each rank of conviction. This could help you determine whether you should only trade when you are very convinced or not.

Other: You can put whatever you feel is necessary to record in your journal. Some traders add a criterion for how they feel emotionally when placing the trade. Anything you feel will help you, write down.

Step 3: Record the trades directly after the trade

Get into the habit of recording the details of the trade directly after the trade, while it is still fresh. This way you won’t have to remember what your reasons were for taking the trade. Make sure to do this only after placing your stop-loss and take-profit.

Step 4: Compile the data and reflect upon the trades

After a certain amount of time, preferably a few months so you have enough data, you can compile the data in your trade journal.

If you have a conviction criterion in your journal, tally up the amount of successful trades made when your conviction was high, medium, and low. Once you have this data you can make the decision of whether it is worth trading only when your conviction is high or not.

For example, if you maintained a high conviction in 10 trades and eight of them were successful trades (Take-profits were hit) that’s as 80% probability of success on your historical trades. If your conviction was low on 10 trades and only two were successful trades that’s a 20% probability of success. Therefore, you would conclude that it is only worth trading when your conviction is high.

You can do this will all the different types of criteria so that you can reflect on your trading and improve.

Trading Journal Template

Here is an example of a trading journal template that includes type of trading strategy used as a criterion.

Trading Journal Template

Having discussed the different criteria, you could include in your journal, the table above illustrates how you could organize all this information in a spreadsheet. You can download the template above for personal use from page five of our free building confidence in trading guide.

Trading Journals: A Summary

Having a trading journal should be one of the first steps traders implement when learning to trade. A journal is of utmost important to testing different strategies and finding which trading plans work for individual traders.

A trading journal is essential in testing whether a current trading strategy is working. To summarize:

  • Trading journals are there to log your trading activity.
  • They help traders test different trading plans and strategies.
  • Trading journals can also help traders pinpoint strengths and weaknesses in a trading style.

To add to your knowledge see the Number One Mistake Traders Make where we analyzed thousands of live trades and came to a striking conclusion.

ZAR Update: ANC Seeks Broad ‘Unity’ Government as Coalition Talks Continue

ZAR Update: ANC Seeks Broad ‘Unity’ Government as Coalition Talks Continue

Liberation Government (ANC) Relies on Others for Parliamentary Majority

The African National Congress (ANC) saw its share of the national vote drop to 40.18% according to the Independent Electoral Commission (IEC), marking its worst showing at the polls since rising to power in 1994.

Typically, the ANC has achieved the large share of the national vote anywhere around the 60% mark. The large drop-off is mainly attributed to ousted ANC stalwart and former President Jacob Zuma and his new ‘MK’ party which took a large portion of ANC voters.

For the first time since Nelson Mandela led the organization, the party will have to enlist the help of other parties to govern. The problem is there is no clear candidate for the ANC. The white-led, business friendly Democratic Alliance (DA) received 21.81% of the vote but it is clear that there are dissenting voices within the ANC as anti-DA protests got underway outside the venue where the ANC’s National Executive Committee (NEC) was meeting to discuss possible options.

Other options include the populist uMkhonto we Sizwe (MK) led by Zuma (14.58% of the vote) or the hard-left Economic Freedom Fighters (EFF) with 9.52% of the vote. MK refuses to join forces with the ANC as long as the current President Cyril Ramaphosa remains in office. Just to make things more complicated, the DA will not work with the ANC if it brings MK and the EFF into its coalition government.

According to the constitution, a new parliament has to convene within two weeks of the declared results, which highlights the 16th of June. Markets therefore, may have to endure an extended period of uncertainty.

Are you new to FX trading? The team at DailyFX has curated a collection of guides to help you understand the key fundamentals of the FX market to accelerate your learning

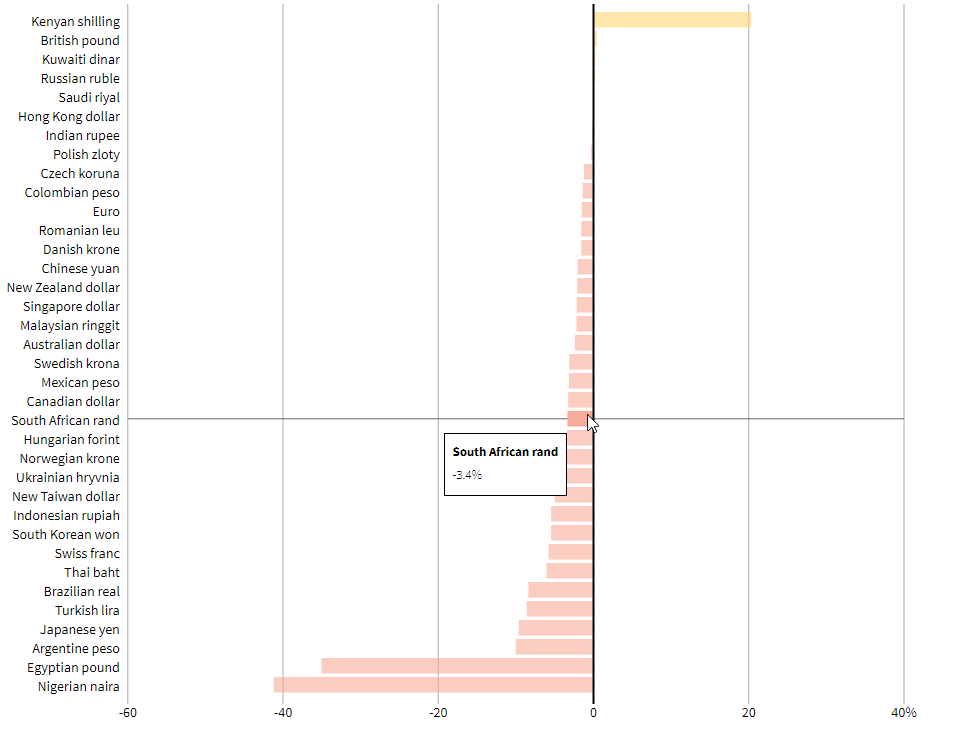
The rand has depreciated against the US dollar this year by around 3.4% and has experienced a sharper decline in the runup to the election and in the days that followed.

Selected Currencies and Their Performance Against the US Dollar in 2024

image1.png

USD/ZAR Surges Towards the 2020 High Despite a Generally Weaker Dollar

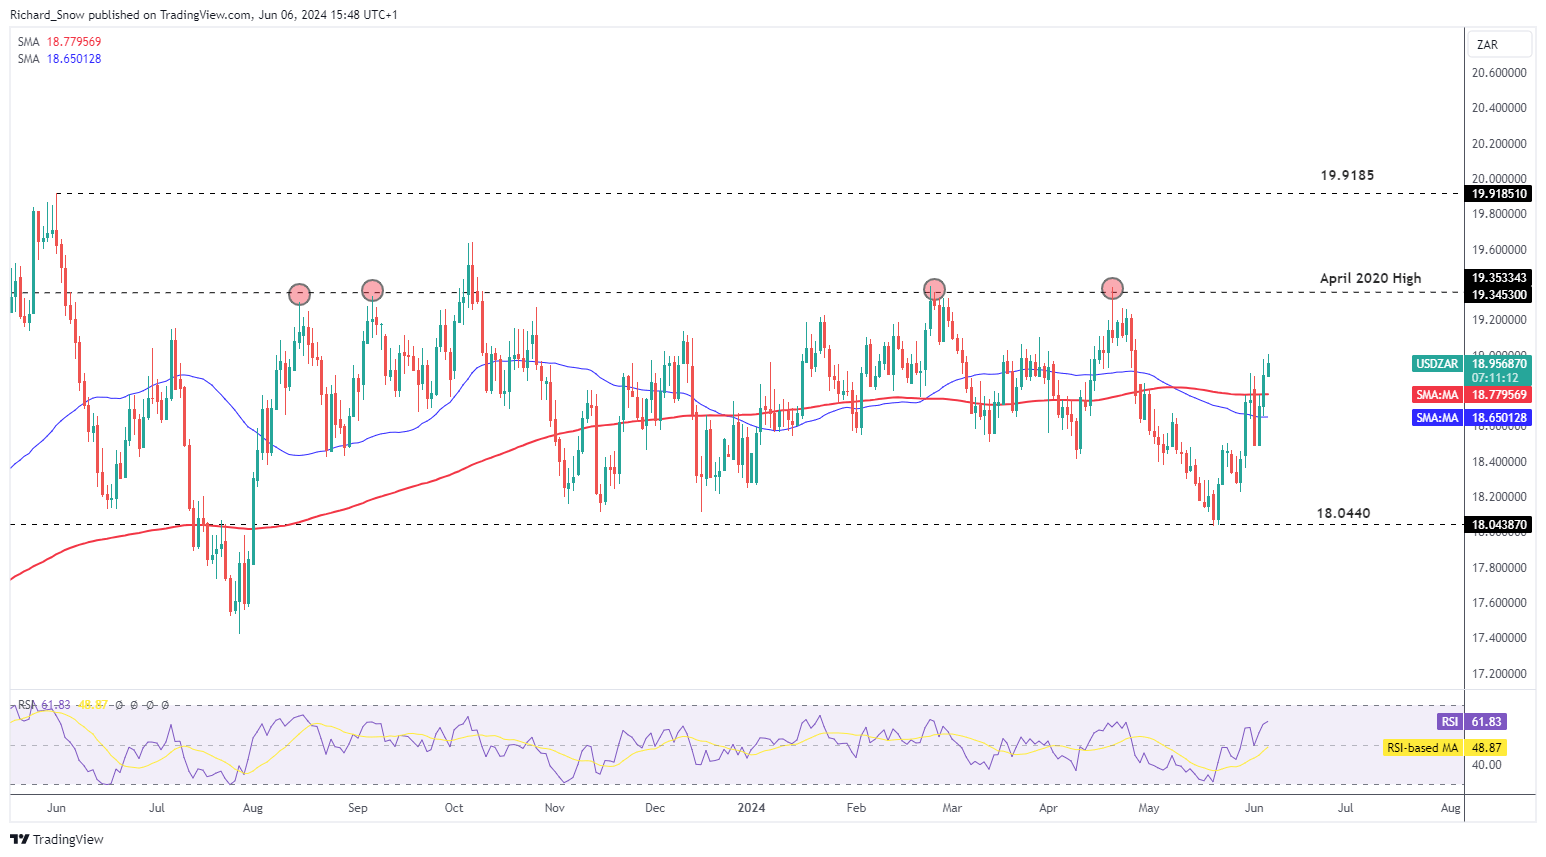
The rand has lost a lot of ground to the dollar since the swing low at 18.044. USD/ZAR has since headed higher, rising above both the 50 and 200-day simple moving averages where the pair remains currently.

The effect may have been worse had the US not been on the receiving end of weaker data that has trickled in over recent weeks as inflation appears to be heading lower again and economic growth is looking vulnerable. US real GDP growth for the first quarter (annualized) was revised lower, to 1.5% in the second estimate of the data. Estimates from the initial (advance) figure were originally as high as 2.5%.

South African GDP also missed estimates on Monday, aiding the decline. The 19.35 marker represents the nearest level of resistance in the event the rand continues to depreciate, while the 200 SMA and the swing low of 18.044 present the relevant levels of support should markets regain confidence in the political stability of the Southern African nation.

USD/ZAR Daily Chart
image2.png

If you’re puzzled by trading losses, why not take a step in the right direction? Download our guide, “Traits of Successful Traders,” and gain valuable insights to steer clear of common pitfalls

GBP/ZAR Experiences Sharp Rise but Momentum Indicator Nears Oversold Levels

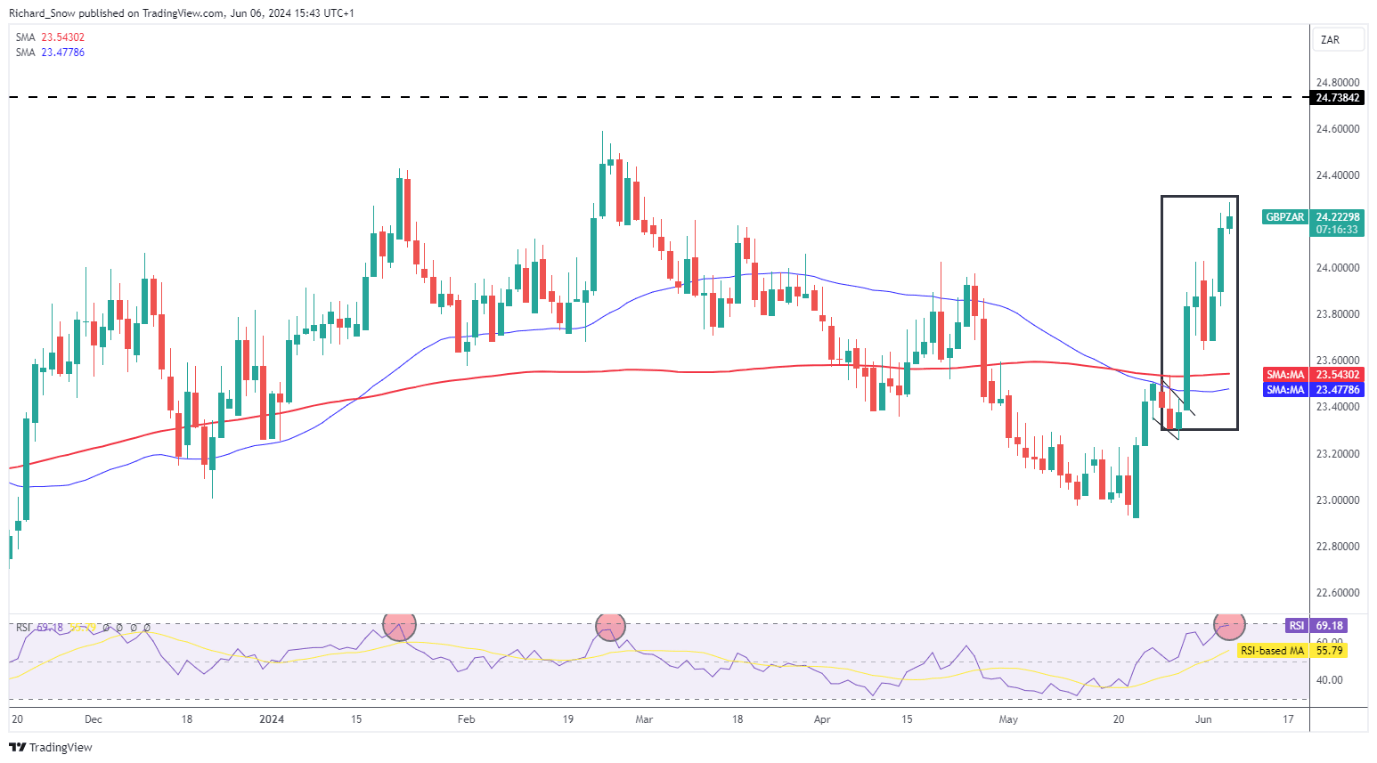
The British Pound advances against the rand and trades above the familiar 24.00 mark once more. Much like USD/ZAR, the pair trades above the 200 SMA and approaches the swing high of 24.59 back in Feb.

However, when looking at the RSI indicator, the recent move higher could come under pressure as the pair pulled back at the prior two instances the indicator neared oversold territory. It may be prudent to weigh up the technical signals with the unfolding coalition talks as a ‘bad’ outcome could see the rand depreciate further from here.

Resistance appears at the swing high of 24.59 with support at the 200 SMA around 23.54.

GBP/ZAR Daily Chart
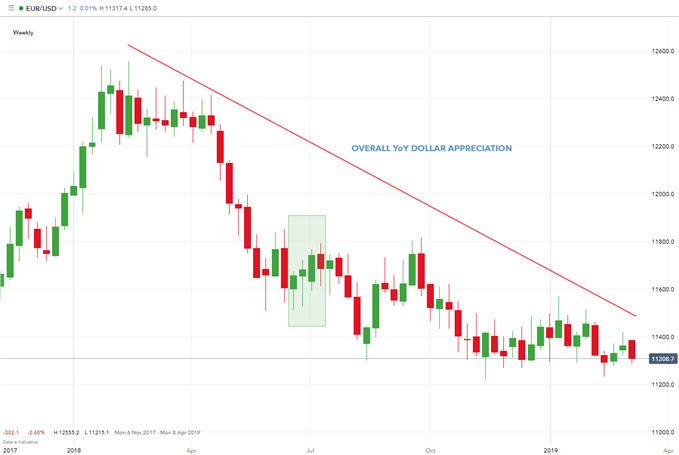
image3.png

US Dollar Slips Further, Gold Nudges Higher, Bitcoin Poised for a New ATH

US Dollar Slips Further, Gold Nudges Higher, Bitcoin Poised for a New ATH

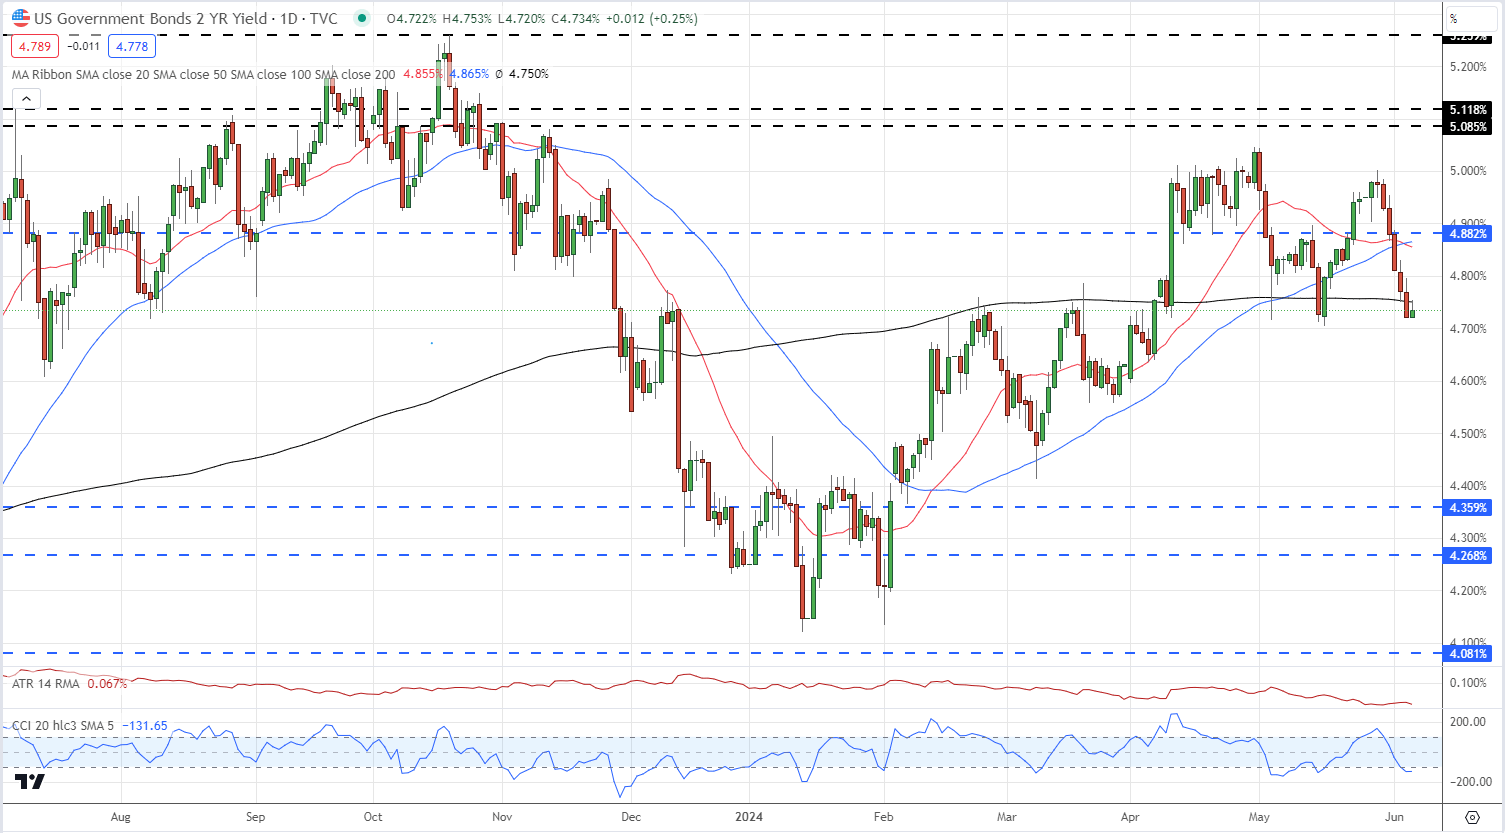
The yield on the US 2-year government is within a couple of basis points of posting a new two-month low and is dragging the US dollar lower. The recent double-high at 5.05% seems likely to be this cycle’s high, unless the Fed takes an unexpected hawkish turn, and further losses are expected over the next few weeks sheds of the Fed’s first rate cut. Six red candles in a row have pushed two-year yields into oversold territory so a small retrace higher may occur before the sell-off resumes.

US 2-Year Yields

image1.png

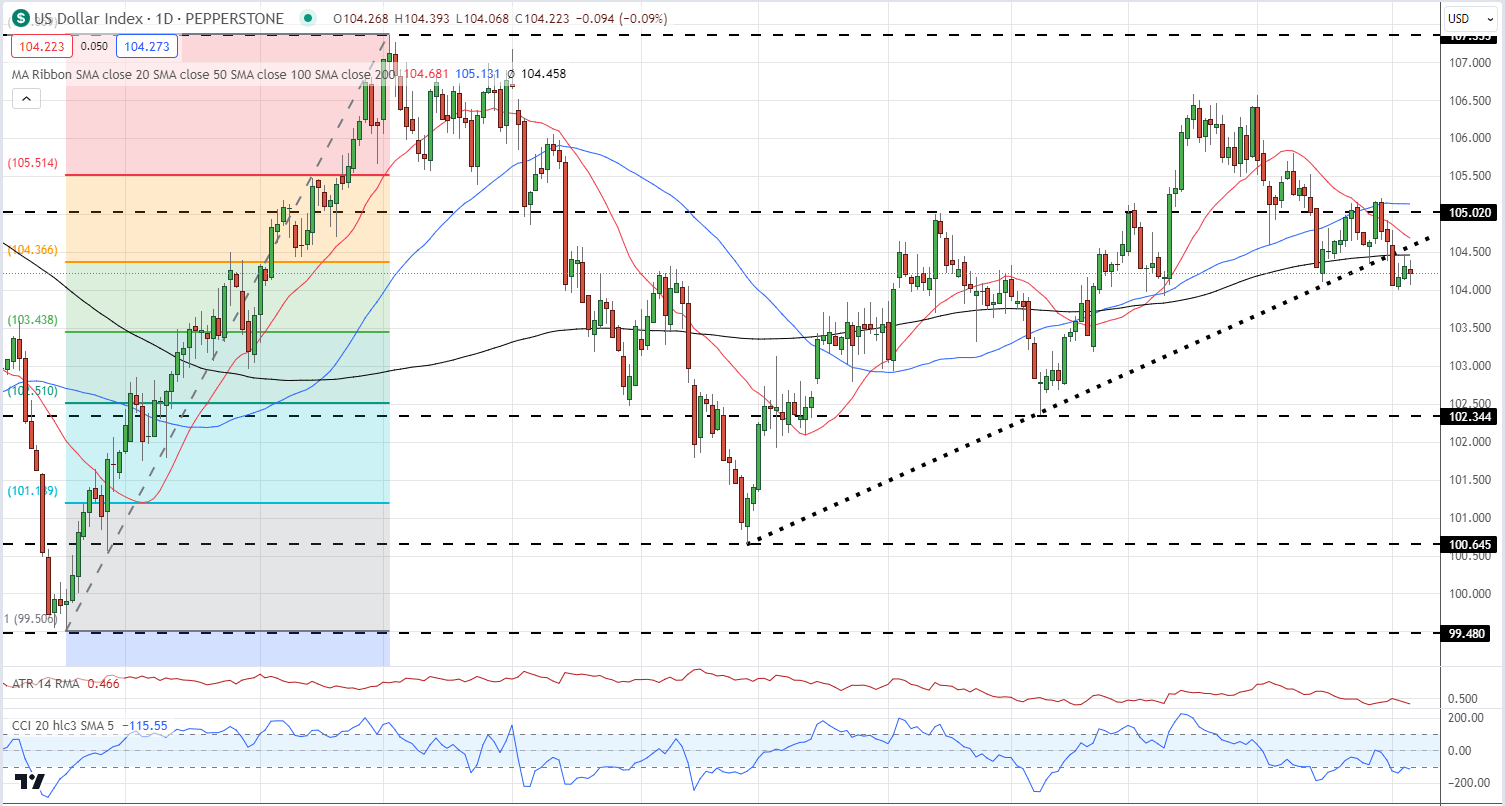
The dollar index is also looking under pressure and now trades below the 200-day simple moving average, the 38.2% Fibonacci retracement level, and recent trend support. Friday’s US Jobs Report has the ability to send the greenback higher in the short-term, but in the medium-term, the dollar index may drift down to the 50% Fib retracement at 103.44 before testing the early March swing-low at 102.34. The US dollar index is also in oversold territory so a period of consolidation is needed before the next move lower.

US Dollar Index Daily Chart
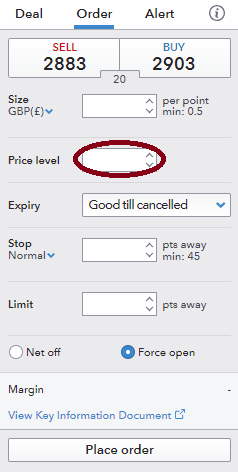
image2.png

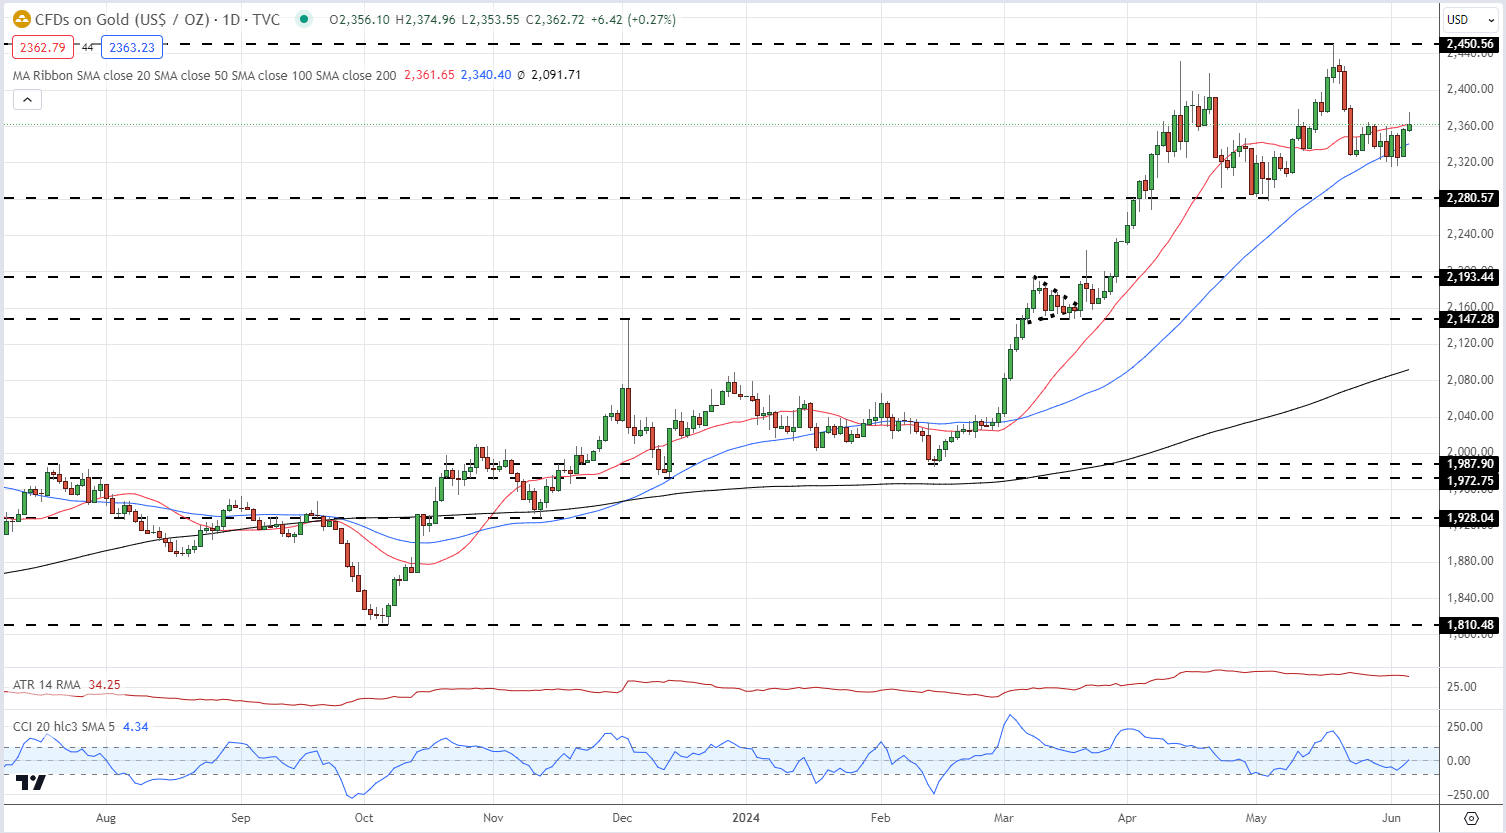
Gold is re-testing the $2,360/oz. level and a break above here would see the precious metal above the last simple moving average, adding credence to a further move higher. The recent $2,280/oz. – $2,450/oz. range should hold in the short- to medium-term.

Gold Daily Price Chart

image3.png

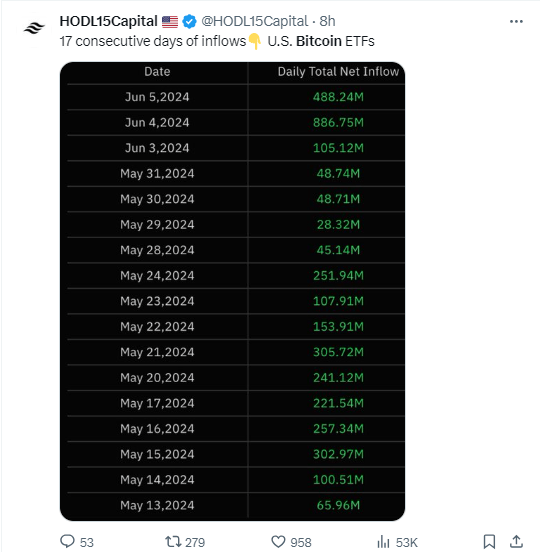
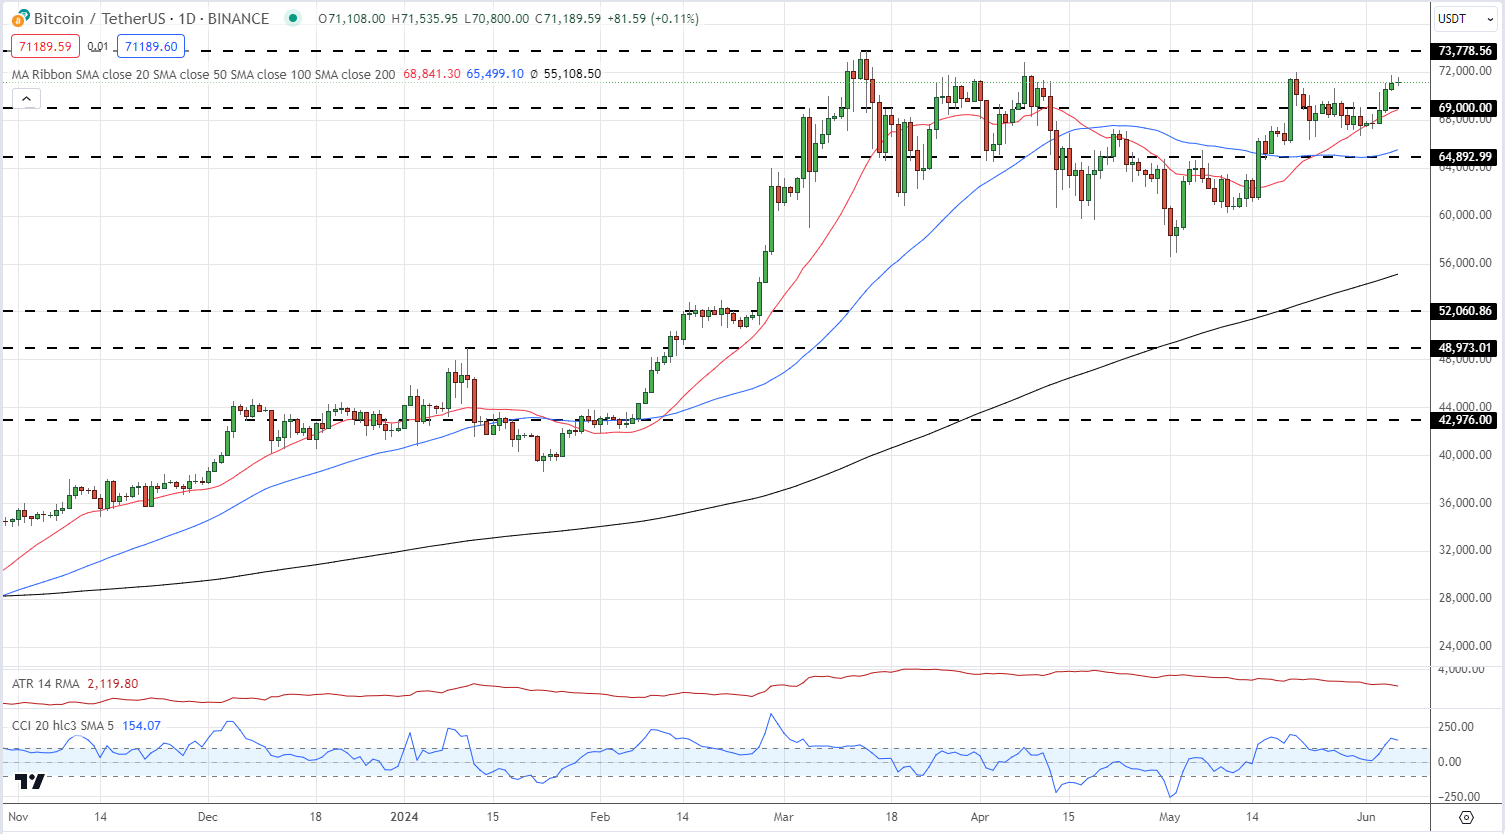
Bitcoin is closing in on the important $72k level, aided by further heavy spot ETF purchase. In the last two sessions alone, spot ETF providers have bought around $1.37 billion of Bitcoin, dwarfing the 450 Bitcoin now mined daily.

image4.png

A break and open above $72k leaves the $73,778 ATH vulnerable.

Bitcoin Daily Price Chart

image5.png

BONAZA!BONAZA!!BONAZA!!! $1000 CASH PRIZE GIVEAWAY ( LITEFINANCE BROKER)

BONAZA!BONAZA!!BONAZA!!! $1000 CASH PRIZE GIVEAWAY ( LITEFINANCE BROKER)

As a token of our appreciation for your continued support and engagement, We’re excited to announce an exclusive cash prize giveaway for our online followers!
whether you’ve been with us from the very start or have recently joined.

Here’s how it works:
– Follow us on IG @litefinance_warri & Facebook @litefinance forex

– Like the giveaway post.
– Tag two friends who you think would like to take part in the giveaway, on the instagram post
– Register & verify your LiteFinance profile @ www.litefinancenig.com
(REGISTRATION IS FREE)
LINK IN BIO

Prizes Include:
1st place: $500
2nd place: $300
3rd place: $200
Winners will be selected randomly and announced on June 30th, 2024 on our Instagram page, so stay tuned!

* Prize money is non-withdrawable. You can withdraw your trading profits generated with the prize money.

#giveaway #traders #forex #forextrader #litefinance #litefinancenigeria

Technical vs Fundamental Analysis in Forex

Technical vs Fundamental Analysis in Forex

Fundamental Analysis

Fundamental analysis involves assessing the economic well-being of a country, and by extension, the currency. It does not take into account currency price movements. Rather, fundamental forex traders will use data points to determine the strength of a particular currency.

A fundamental forex trader will analyze the country’s inflation, trade balance, gross domestic product, growth in jobs and even their central bank’s benchmark interest rate.

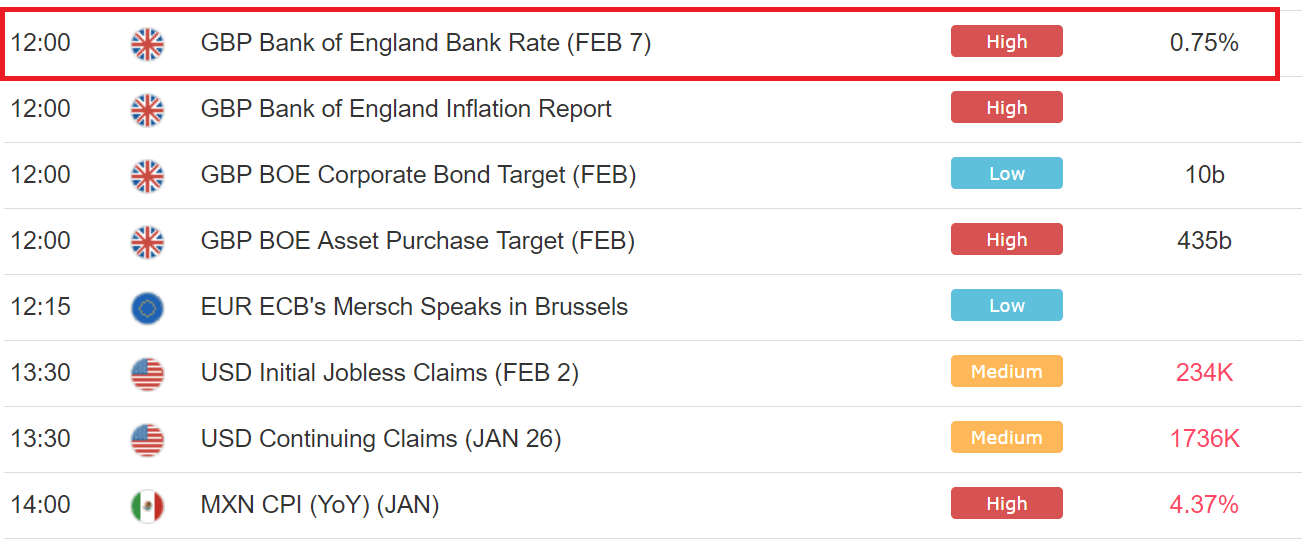
Below is an example of an economic calendar where fundamental traders will be able to keep up to date with the latest data releases. There are many data releases on any given day which is why traders should know how to filter the calendar to show relevant information only.

Fundamental analysis economic calendar

By assessing the relative trend of this and other data points, a trader is analyzing the relative health of the country’s economy and whether to trade the future movement of that country’s currency.

The table below summarizes the general effects that different economic data tends to have on the strength of a currency. However, this is not guaranteed as there are many factors that influence currency movements.

How economic data affects currencies

Expectations Effect on currency
Gross Domestic Product (GDP) Better than expected Positive
Consumer Price Inflation (CPI) Better than expected *Positive
Trade Balance Trade deficit (imports > exports) Negative
Central Bank benchmark rate Increase in interest rate Positive
ISM Manufacturing Index Better than expected Positive
PPI Producer Price Index Better than expected Positive

*Developed nations welcome moderate inflation as it is a sign of a growing economy. Developing nations view decreasing, or maintained, inflation as a positive statistic as this keeps price levels in check.

Technical Analysis

Technical analysis involves pattern recognition on a price chart. Technical traders look for price patterns such as triangles, flags, and double bottoms. Based on the pattern, a trader will determine the entry and exit points. Unlike fundamental traders, a technical trader is not as concerned about why something is moving because the trends and patterns on the charts are their signals.

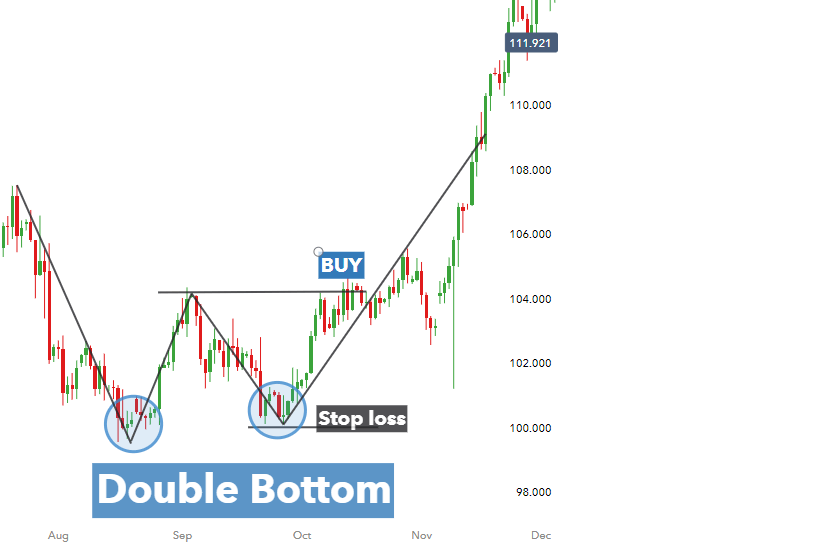
Below is an example of a chart pattern – the double bottom pattern. The market makes the first low, rebounds slightly before creating a new low and subsequently gains upward momentum as the trend reverses. Technical traders will look to set a stop loss at the recent (lowest) low and wait for the market to produce higher highs and higher lows before placing the long trade.

Head and shoulders pattern in technical analysis

In practice, technical traders will need to identify the pattern as shown below on the USD/JPY daily chart where the “W” shape can be seen.

Double bottom chart pattern for USDJPY in technical analysis

A technical forex trader will assess the price action, trend, support and resistance levels observed on a chart. Many of the patterns used in technical analysis of forex markets can be applied to other markets as well.

Additionally, traders make use of indicators and oscillators which are added to a price chart when analyzing foreign exchange markets. Moving averages, Bollinger Bands, MACD, Relative Strength Index (RSI), and stochastic tend to be some of the more common tools in a technical traders tool box. Indicators are preferred by technical traders because they are easy to use and provide clear signals.

The benefits of technical analysis

Technical analysis does not include ‘black magic’ that many fundamentalists claim. Getting started in technical analysis can be done quickly by assessing the direction and strength of trends. Traders will use the trend analysis to help them determine which pair to trade and the direction to trade it.

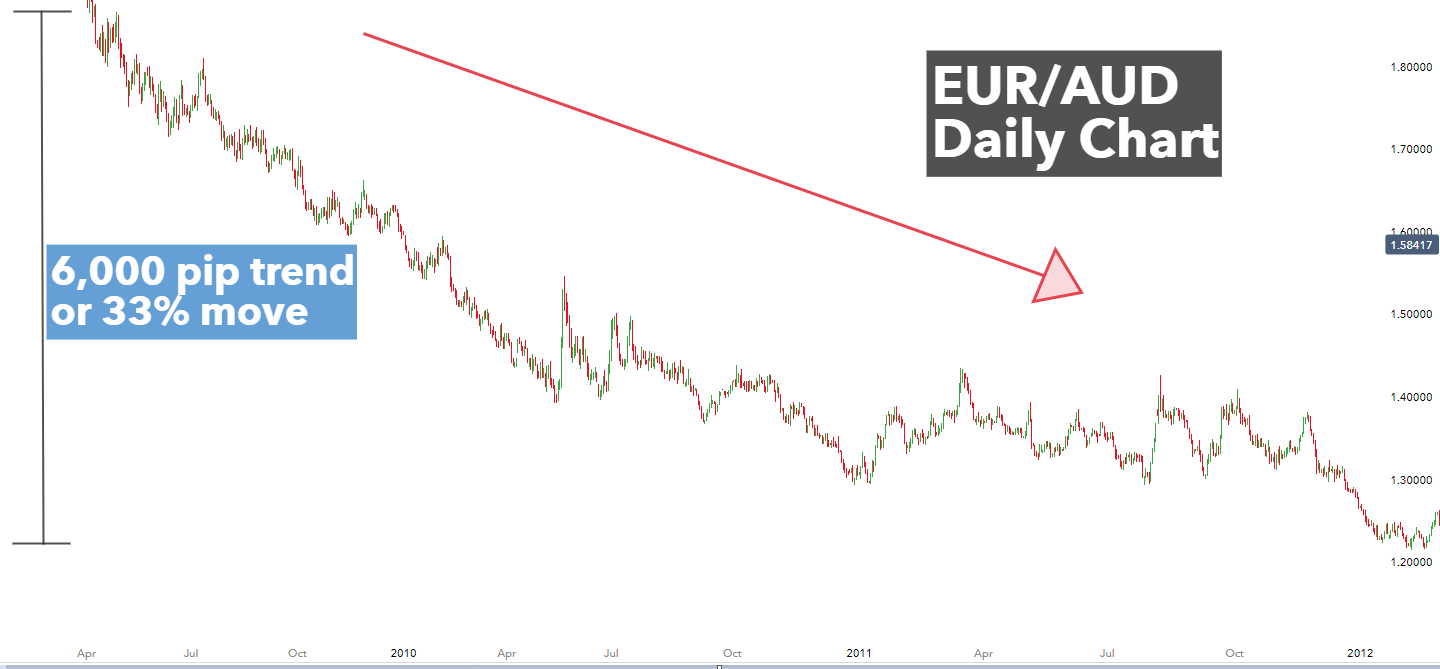
Below, is an example of how a technical trader would notice this 6,000 pip trend where the AUD is very strong relative to a very weak EUR (which is why the currency pair is moving down). Furthermore, it is clear to see that the currency pair is trading in a strong downward direction. This is referred to as a tend and traders make use of key levels, levels of support and resistance, and indicators to identify trends as soon as possible and with accuracy.

EUR/AUD daily chart showing strong downtrend

Finding out how to identify strong and weak currencies will provide traders with an indication of which currency pairs are most likely to trend and therefore lead to higher probability trades. A trader would trade in the direction of this particular trend by selling the EUR/AUD pair.

Technical vs Fundamental Analysis in Forex: Conclusion

Fundamental and technical analysis involve very different strategies and approaches to trading; offering unique value and insights to support trading decisions, and when to enter or exit a trade. While some traders prefer to use these types of analysis separately based on their preferred trading style and goals, many use a combination of the two. The benefits of combining fundamental and technical analysis are wide ranging.

AUD/USD Outlook: Aussie Growth Stagnates, Currency Resilient Amid Weaker US Data

AUD/USD Outlook: Aussie Growth Stagnates, Currency Resilient Amid Weaker US Data

Aussie Growth Stalls in Q1, Growing Just 0.1% over the Quarter

Aussie growth has been under pressure, with annualized real GDP declining, or remaining flat, every quarter since the start of 2023. The annualized figure missed estimates of 1.2% to come in at 1.1%, while the quarter on quarter figure rose a meagre 0.1%.

Household spending, which accounts for roughly 50% of Australian GDP was fractionally stronger at 1.3% but the majority of spending was channeled to essentials like electricity and healthcare as discretionary spending flattened out.

image1.png

Customize and filter live economic data via our DailyFX economic calendar

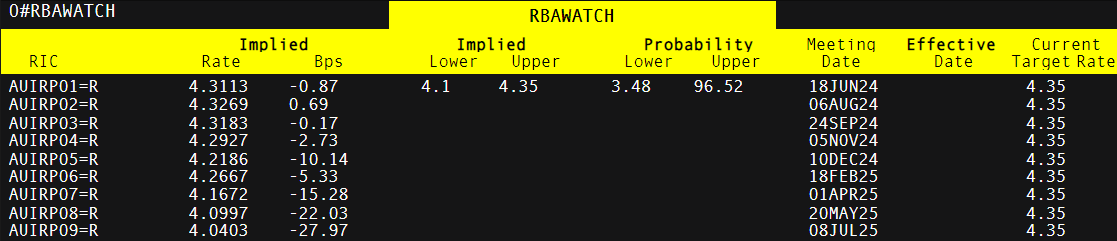
The economy is taking strain with interest rates at 4.35% but Michele Bullock expressed that policy needs to remain restrictive to bring demand and supply into greater balance. Markets do not anticipate another rate hike but equally, they do not anticipate a rate cut any time soon either. There is a little under 50% chance of a 25 basis point (bps) cut in December but a full cut is only priced in for July next year – suggesting in the absence of a drastic drop in inflation or seriously adverse economic conditions, rates will remain where the are for an extended period.

Market-Implied Basis Point Adjustments Going Forward

image2.png

If you’re puzzled by trading losses, why not take a step in the right direction? Download our guide, “Traits of Successful Traders,” and gain valuable insights to steer clear of common pitfalls:

AUD/USD Finds Resistance but a Softer USD May Underpin Price Action

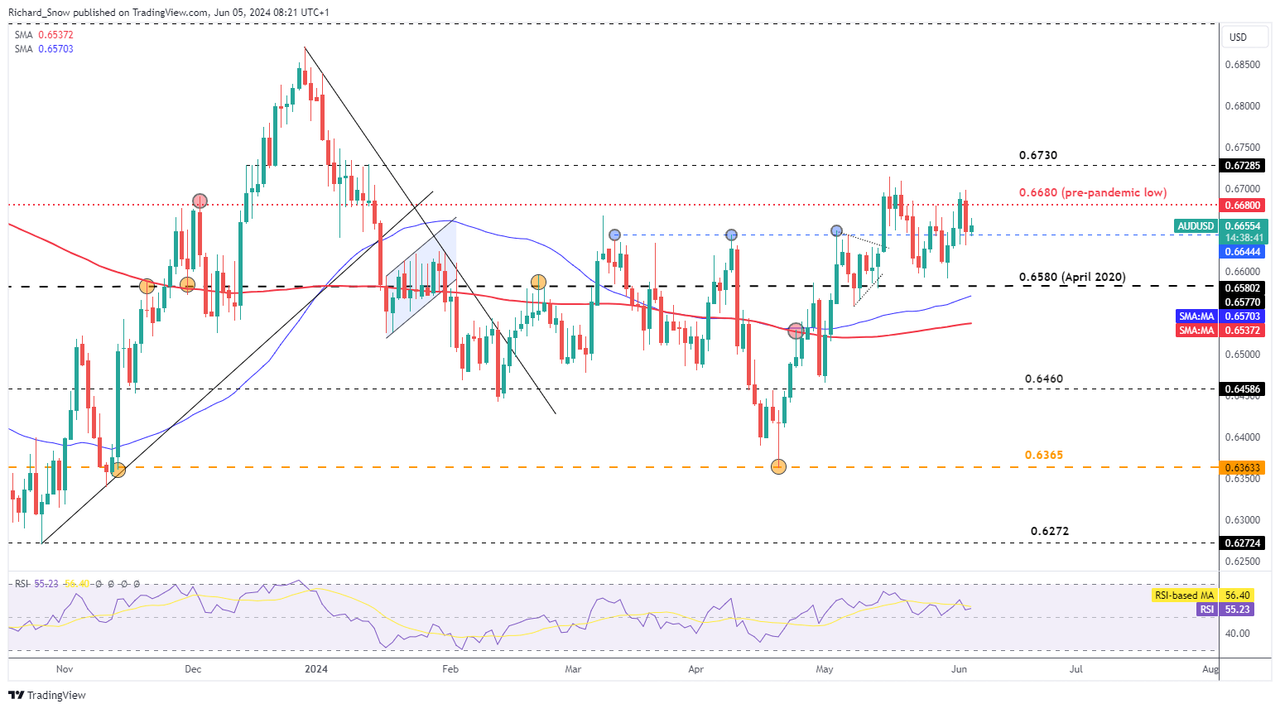
AUD/USD appears unperturbed by the lackluster growth but the currency registered a minor decline against the Kiwi dollar (at the time of writing). AUD/USD now tests the 0.6644 level which capped prices between March and May and offers support for the pair.

The market serves as a potential tripwire for a bearish continuation but conviction in recent moves lacks conviction. With both central banks looking to eventually cut interest rates, the timing of such a decision remains elusive. Although, weakening US data places the Fed in pole position when it comes to the two nations. US services PMI data today could see further weakness for the greenback following from the manufacturing sector extending the contraction further.

US NFP data will be the next major piece of relevant data but ADP private payroll data always carries the potential to provide intra-day volatility but tends not to see massive moves ahead of the more closely watched US jobs data on Friday.

Resistance remains at the swing high of 0.6714 with 0.6730 not far away.

AUD/USD Daily Chart

image3.png


Top 5 Benefits of Using Entry Orders in Forex Trading

Top 5 Benefits of Using Entry Orders in Forex Trading

Entry orders are a valuable tool in forex trading. Traders can strategize to come up with a great trading plan, but if they can’t execute that plan effectively, all their hard work might as well be thrown out the window. The forex market is open 24 hours a day, so this means no trader can keep an eye on it all the time. So, traders need a way to execute our trading plan that fits with their daily schedule.

This is where setting up forex entry orders comes into play. Entry orders allow traders to set the price that they would like to buy or sell a currency ahead of time. This will only be executed if that specific price is hit. There are several benefits to trading forex using entry orders, which we explore below.

What is an Entry Order in Forex Trading?

A forex entry order is an order that is placed at a specified price level for a currency pair. Once this price is reached, the order is then executed/filled. If the price never reaches the desired price level, the order will not execute. The type of order can vary as well, which should be taken into consideration prior to placing the forex order.

Top 5 Benefits of Using Forex Entry Orders

1. Price Control

The first benefit of entry orders is the control they provide over price level. Traders can indicate their desired price level entry point at which the trade will execute. Having this ability to designate a level allows for ease of trading without having to constantly monitor the market.

The image below shows an example of a deal ticket outlining the price field whereby a trader can set his/her price execution level. The process and layout should be similar across most platforms.

forex entry order deal ticket

2. Entry Orders Save Time

Forex entry orders are very useful for saving time. By setting one, traders do not need to be at a computer when a trend line is hit or when price breaks out of its price channel. Traders can very easily add an entry order to get in the trade if price behaves in the way he/she thinks it will. The order does the waiting and allows traders to focus on other things.

Stop and limit orders

Traders can also take things one step further by setting conditional stop and limit orders to manage a trade if the entry order is triggered while they’re not using the platform. This provides peace of mind that naked trades have not been made without managing orders attached.

To set this type of order, fill in the “Stop” and “Limit” fields on the deal ticket when placing a forex entry order (see image below).

Stops and limits set in this manner are not active until the entry order is triggered and opens a trade on our account. That is, a trader does not need to worry about a stop or limit being triggered before an entry order is hit.

stops and limits forex trading order

3. Better Money Management

Forex entry orders also help to save money. To understand this better, consider how much time traders dedicate to trading each day. 12 hours? Six hours? One hour? 10 minutes? Most probably fall near the lower end of the spectrum between 10 minutes to an hour (if we were looking at the average amount of time per day). This is because most have a day job, a family, or prior obligations to attend to.

We must now compare that amount of time to the 24-hour day that the forex market is open. If a trader spends 10 minutes a day placing trades, this means the market is being watched 0.7% of the day. If a trader spends an hour a day placing trades, he/she is watching the market about 4% of the day. Knowing this, what are the odds that a trader will be monitoring the market at a time that is optimal to physically place a trade?

The odds are probably not very good. It is much more likely that the optimal time to enter a trade will be during the other 96% of the time when a trader is away from the computer. If traders force themselves to trade during this small viewing window, they are most likely getting sub-optimal entries. Sub-optimal entries mean traders are leaving money on the table.

Traders should try to receive the most ideal price possible even though it might not be available while they are physically sitting at their computer. Entry orders can therefore give the trader the best chance of executing at the optimal price.

4. Accountability

Forex entry orders (with stops and limits attached) also help keep traders accountable. This is because they eliminate the possibility of emotions getting in the way of reliable, profitable trades, and make sure traders are following the rules to the latter.

To put this into context, before trading begins every trader should have in place a strategy with a set of rules which means they know exactly what to do in any type of situation before that situation arises. But at times, emotions (greed, fear, over-confidence, etc.) can lead traders away from their set trading plan, and this may result in them taking stabs at the market hoping to “get lucky” rather than taking a calculated risk where they believe to have an edge. Entry orders can eliminate this risk and keep traders accountable to their strategy.

5. Support Trading on a Time Frame

Trading on a custom time frame can allow for more specified trades that could be in line with upcoming market news, political events or company results depending on what market is being traded. As seen in the image below, traders can stipulate the expiry period for the entry order:

  • “Good till cancelled” – The entry order will remain active until the order is manually deleted by the trader.
  • “Good till date” – The entry order will remain active up until a specified date.

order type deal ticket for forex

How Forex Traders Use ISM Data

How Forex Traders Use ISM Data

The ISM manufacturing index plays an important role in forex trading, with ISM data influencing currency prices globally. As a result, the ISM manufacturing, construction and services indicators can provide unique opportunities for forex traders, which makes understanding this data (and how to prepare for its monthly release) essential.

Talking points:

  • What is ISM?
  • How ISM impacts currencies
  • How forex traders use ISM data

What is ISM?

The Institute for Supply Management (ISM) measures the economic activity from both the manufacturing side as well as the service side. Monthly ISM data releases include key information such as changes in production levels.

ISM was formed in 1915 and is the first management institute in the world with members in 300 countries. The data gleaned from its large membership of purchasing managers means ISM is a reliable guide to global economic activity, and as a result, currency prices. A country’s economy is often determined by its supply chain, as a result, the monthly ISM manufacturing and non-manufacturing PMI economic news releases are carefully watched by forex traders around the world.

ISM Surveys

ISM publishes three surveys – manufacturing, construction, and services – on the first business day of every month. The ISM Purchasing Managers Index (PMI) is compiled from surveys of 400 manufacturing purchasing managers. These purchasing managers from different sectors represent five different fields:

  1. Inventories
  2. Employment
  3. Speed of supplier deliveries
  4. Production level
  5. New orders from customers.

In addition, ISM construction PMI is released on the second business day of the month, followed by services on the third business day. Forex traders will look to these releases to determine the risks at any given time in the market.

How does ISM Impact currencies?

The Manufacturing and Non-manufacturing PMIs are big market movers. When these reports are released at 10:30am ET, currencies can become very volatile. Since these economic releases are based on the previous month’s historical data gathered directly from industry professionals, forex traders can determine if the US economy is expanding or contracting – much like non-farm payrolls (NFP) data.

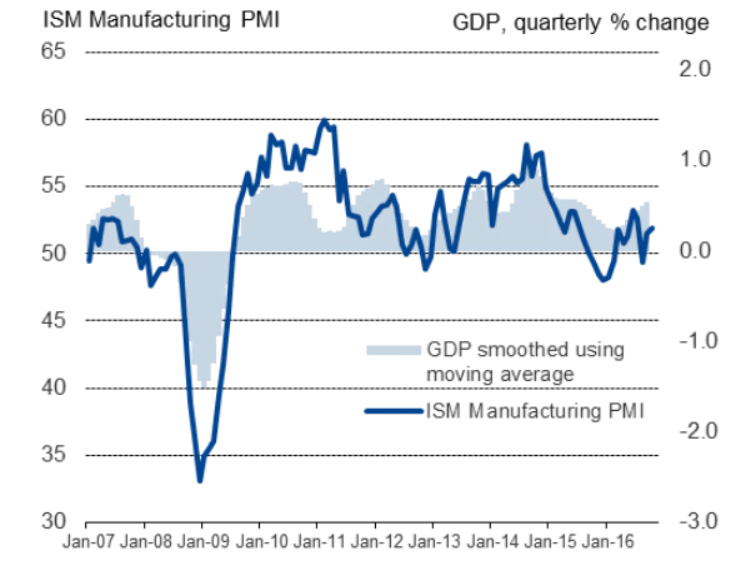
Currencies react with this information as it represents a gauge of US economic health (see image below).

ISM manufacturing PMI vs GDP

How forex traders use ISM data

Forex traders will compare the previous month’s ISM data figure with the forecasted number that economists have published. If the released PMI number is better than the previous number and higher than the forecasted number, the US dollar tends to rally. This is where fundamental and technical analysis comes together to create a trade setup.

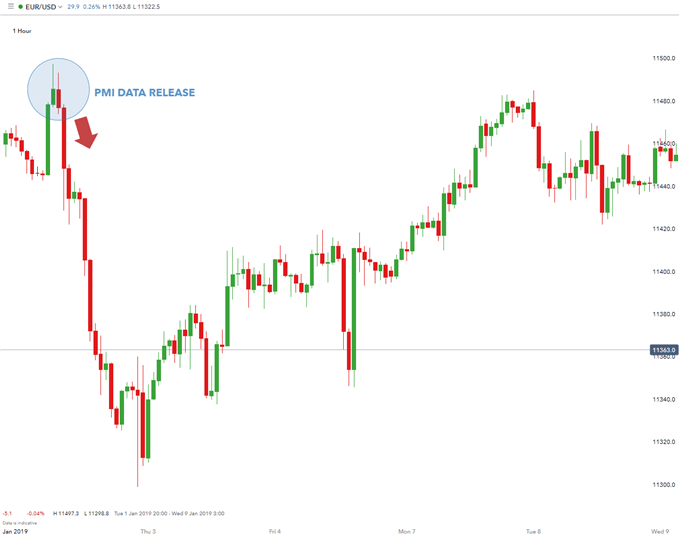
EUR/USD drops as a result of better than expected data

ism manufacturing index

In the example above, notice how the better than expected PMI number triggered a US dollar rally against the Euro. As seen in the chart (EUR/USD – one hour), the ISM Manufacturing PMI came in higher than the previous month at 54.9.

When an economic releases beats expectation, sharp fast moves can ensue. In this case, EUR/USD dropped 150 pips in a few hours. Traders often choose the Euro as the “anti-dollar” to take advantage of capital flows between two of the largest economies.

Read more on using pips in forex trading.

The Eurozone has large liquid capital markets which can absorb the huge waves of capital seeking refuge from the US. A weak US ISM Non-Manufacturing number usually leads to a dollar sell-off and a rise in the Euro. Another scenario is when the number released is in line with forecasts and/or unchanged from the previous month, then the US dollar may not react at all to the number.

Overall, an ISM PMI number above 50 indicates that the economy is expanding and is healthy. However, a number below 50 indicates that the economy is weak and contracting. This number is so important that if the PMI is below 50 for two consecutive months, an economy is considered in recession.

PMIs are also compiled for Euro zone countries by the Markit Group while US regional and national PMIs are compiled by ISM. As you can see, traders have good reason to pay special attention to the important releases from the ISM manufacturing index.