Leading vs. Lagging Indicators: Which Should You Trade With?

Leading vs. Lagging Indicators: Which Should You Trade With?

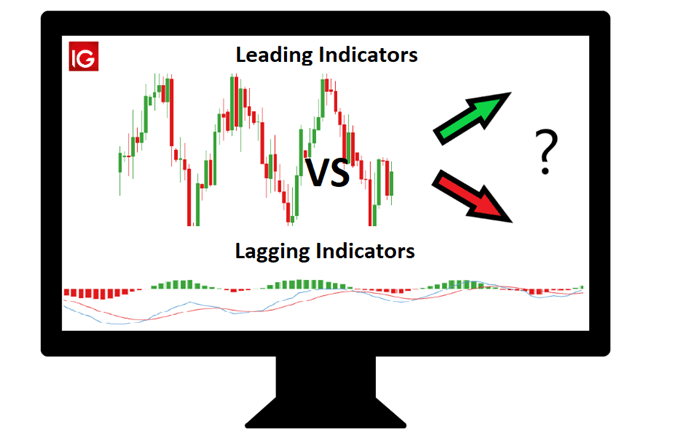
Lagging indicators use past price data to provide entry and exit signals, while leading indicators provide traders with an indication of future price movements, while also using past price data. When faced with the dilemma of leading vs lagging indicators, which should traders choose? The answer to this question ultimately comes down to individual preference after understanding the advantages and limitations of each.

What’s the difference between lagging and leading indicators?

Lagging indictors

Lagging indicators are tools used by traders to analyse the market using an average of previous price action data. Lagging indicators, as the name implies, lag the market. This entails that traders can witness a move before the indicator confirms it – meaning that the trader could lose out on a number of pips at the start of the move. Many consider this as a necessary cost in order to confirm see if the move gathers momentum. Others view this as a lost opportunity as traders forgo getting into a trade at the very start of a move.

Common lagging indicators include:

Leading indicators

A leading indicator is a technical indicator that uses past price data to forecast future price movements in the market. Leading indicators allow traders to anticipate future price movements and therefore, traders are able to enter trades potentially at the start of the move. The downside to leading indicators is that traders are anticipating a move before it actually happens and the market could move in the opposite direction. As a result, it isn’t uncommon to witness false breakouts, or, signs of a trend reversal that just land up being minor retracements.

Common leading indicators include:

Leading vs lagging indicators: Advantages and limitations

The following table presents the advantages and limitations of each indicator to assist with the ‘leading vs lagging’ conundrum.

Leading indicators Lagging indicators
Advantages Provide favourable entry points for a possible move. Provides greater conviction to enter trades – confirms recent price action
Leading indicators assist traders in their pursuit of entering higher probability trades because they identify key levels Reduces the risk of failed moves or false breakouts
Limitations Forecasted price action is not guaranteed. Traders need to apply their own knowledge of these indicators in each situation Traders sacrifice potential pips while waiting for confirmation from the lagging indicator
Leading indicators are often more insightful in advanced technical analysis techniques, such as Elliott Wave Theory, which may be daunting for new traders Lagging indicators have no concept of key levels therefore, traders need to be aware of this

Should you use leading or lagging indicators?

There are no perfect indicators. By their very nature, indicators will help traders discover likely outcomes as opposed to a sure thing. It is up to the trader to conduct thorough analysis, with the aim of stacking the odds in their favour.

To further illustrate this point, below is an example of leading vs lagging indicators in EUR/USD, where the leading indicator appears to provide a better signal. Keep in mind that this is purely for demonstration and that the lagging indicator is equally as important.

The market sold off aggressively before retracing to the significant 61.8% level. Using a simple moving average (21, 55, 200), it is clear to see that the faster blue line (21) has not crossed below the slower black (55) line and therefore, this lagging indicator has not yet provided a short signal.

However, upon further analysis traders would be able to see that the market failed to break and hold above the 200-day moving average. The 200 SMA is widely viewed as a great indicator of long-term trend and in this example, is acting as resistance. This supports the short bias for traders eying a bounce lower off the 61.8% level.
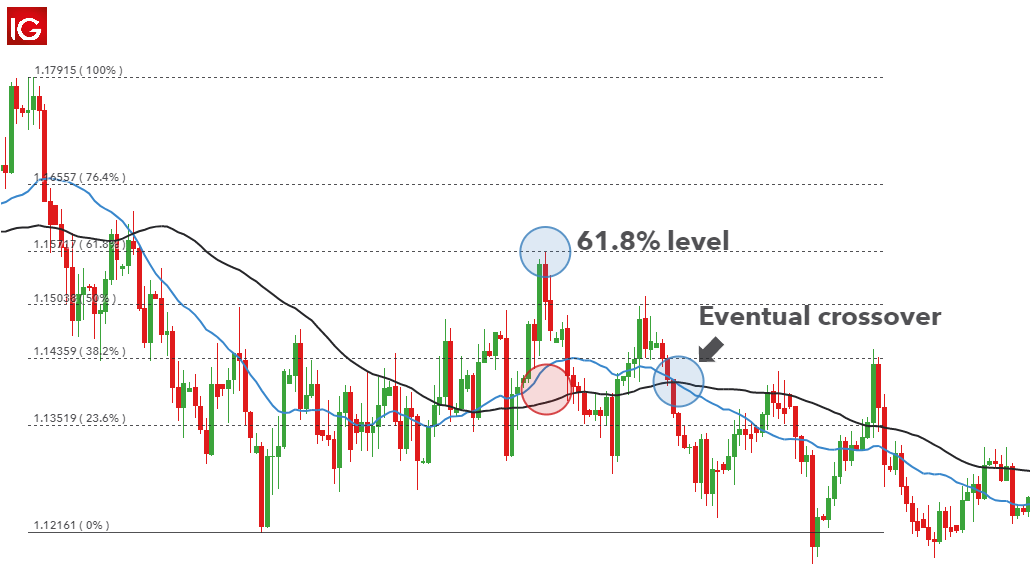
Leading vs lagging indicators on EUR/USD

Traders looking for fast signals will tend to favor leading indicators but can also reduce the time period setting on lagging indicators to make them more responsive. This however, should always be implemented with a tight stop loss to in the event the market moves in the opposite direction.

Traders seeking a greater degree of confidence will tend to favor lagging indicators. These traders often trade over longer time frames looking to capitalize on continuing momentum after entering at a relatively delayed entry level, while implementing sound risk management.

Frequently Asked Questions (FAQs)

If leading indicators provide faster signals on proposed moves then surely, they are superior to lagging indicators?

It is easy to fall into this trap as it is second nature for traders to want to capitalize on a large moves as soon as they appear. Traders need to appreciate that while leading indicators identify possible areas of future price movement, they are not to be viewed as sure things. Further analysis of trend, sentiment and momentum will help to confirm or invalidate the trade.

What combination of moving averages provide the best results?

Once more, this is about personal preference. The most popular moving averages include the 20, 50, 100 and 200 – which can be altered, using Fibonacci numbers to 21, 55, 100 and 200. The 21 period MA can be used in conjunction with the 55 MA for faster, more frequent signals while the 100 and 200 are used to assess market trend.

Central Bank Watch: Upcoming Decisions from BoE and SNB Set to Impact EUR Pairs

Central Bank Watch: Upcoming Decisions from BoE and SNB Set to Impact EUR Pairs

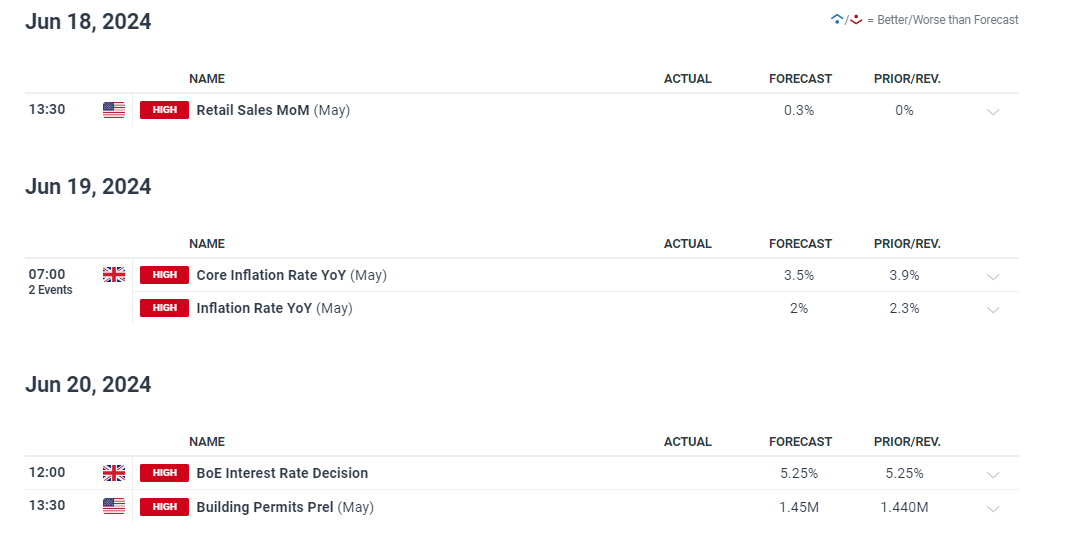
UK data returns to prominence this week with headline and core inflation expected to build on progress made in April but the Bank of England (BoE) remain laser focused on services inflation. Not long after UK CPI we have the BoE statement and press conference. Market consensus dictates that we’ll see another hold from the Bank but recent easing in the jobs market coupled with a stagnant economy in April could see the Monetary Policy Committee (MPC) tee up a rate cut for the summer.

image1.png

Alongside the BoE decision on Thursday, we’ll also get the Swiss National Bank rate decision. Markets expect another cut following the surprise cut in March, but Chairman Thomas Jordan has complicated this view after he mentioned the biggest threat to the inflation outlook is a weaker franc. Lower interest rates generally precede a period of depreciation in the local currency.

Learn how to prepare for high impact economic data or events with this easy to implement approach:

EUR/USD Encapsulates the Forces of a Stronger USD and Weaker Euro

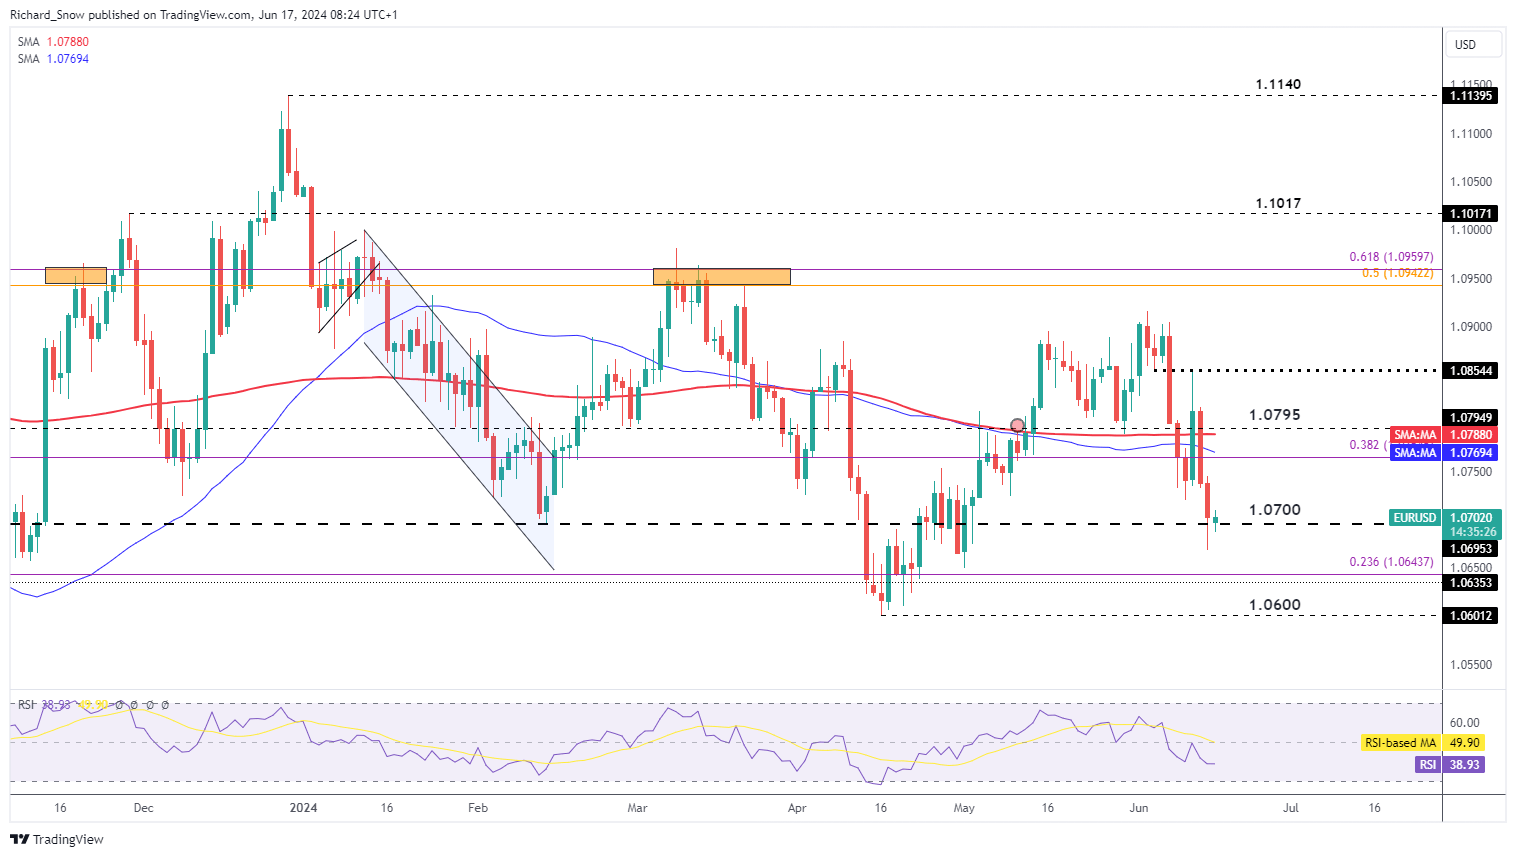
Euro dollar experienced a volatile week initially rising after encouraging US CPI data but then upward revisions to both the Fed funds and inflation outlooks spurred on the US dollar into the weekend.

The pain encapsulates 2 forces at work with the first being a stronger U.S. dollar upon recent Fed forecast revisions, and the second being a vulnerable euro in the wake of political uncertainty in France. We’ve seen a flight to safety in the European bond market led by German Bunds – inflating the risk premium across Europe which historically has led to a weaker currency.

This week we look to the 1.0700 for a potential pause in recent selling. Neither of the two currencies have major data releases planned for the week, offering up the potential for a reprieve for EUR/USD although, the RSI has not yet reached oversold conditions – something bears will be aware of. The pair will likely take its cue from political developments and the bond market this week.

EUR/USD Daily Chart

image2.png

Bank of England to Tee up a Rate Cut this Summer?

It is largely expected that the Bank of England will vote to keep rates on hold this week despite recent encouraging inflation numbers and unimpressive growth data for April. Adding to the list is the recent spike in claimant data (initial jobless claims) to levels not seen since early 2021.

Unlike the US, the UK labour market has been easing in a fairly consistent manner which is something that will factor into the Bank’s thinking this week. However, services inflation is still too high for comfort and BOE officials have communicated their determination in maintaining restrictive monetary policy until such time as it subsides sufficiently.

Looking at the implied interest rate cuts for the rest of the year the market may be under appreciating the probability of a rate cut before November or even September. At present, a rate cut at the November meeting is fully priced in with the September meeting eyed as a strong possibility.

Implied Interest Rate Probability (UK Bank Rate)

image3.png

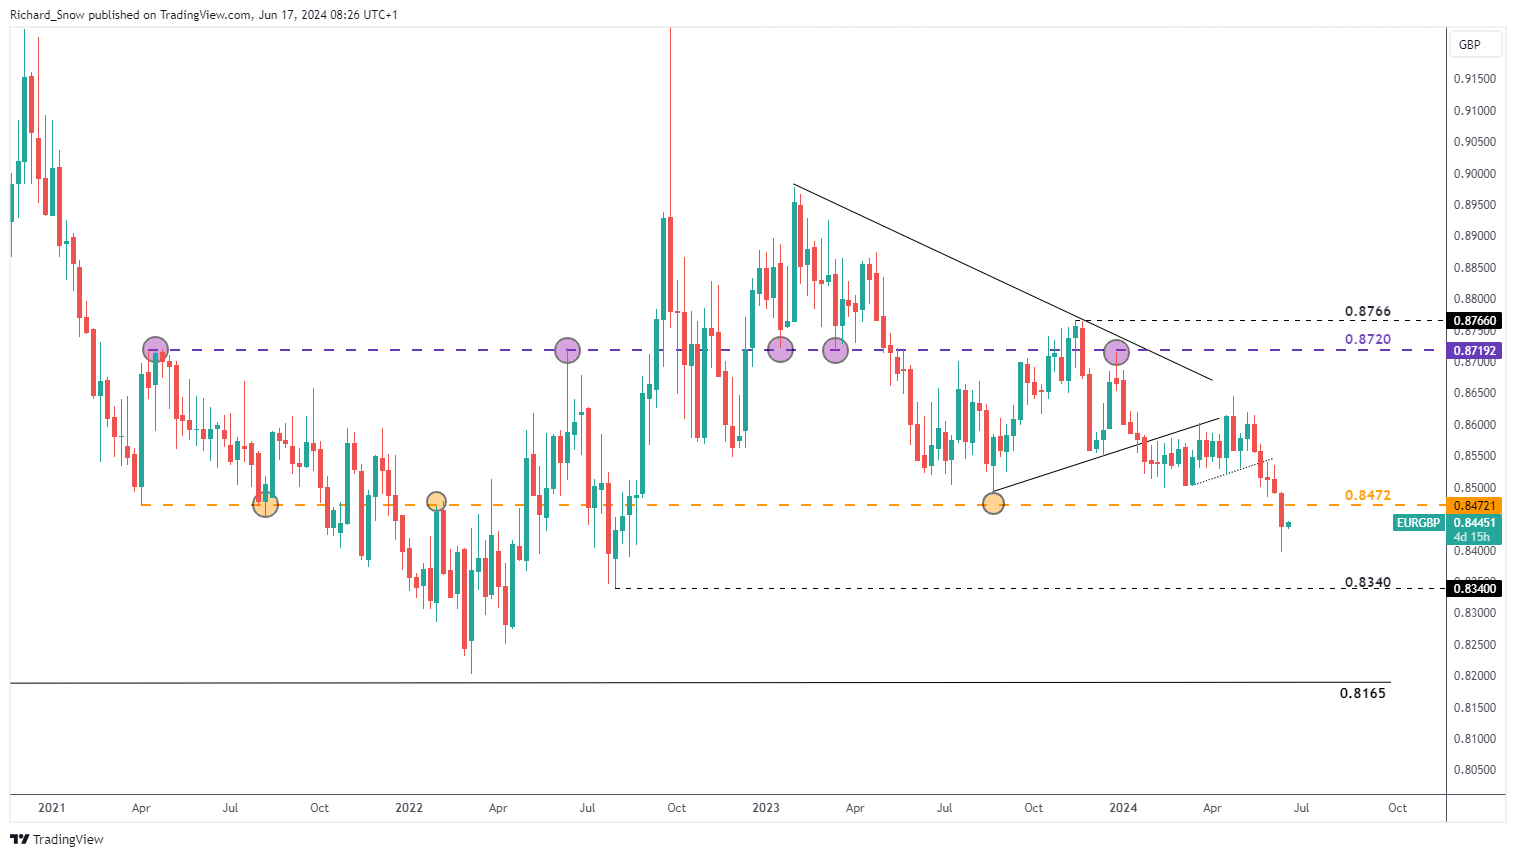
EUR/GBP has depreciated quite markedly in the last few weeks as the pound has quietly gone about its business and enjoyed its superior interest rate differential. The pair broke below 0.8472 last week – a notable pivot point. The pair is likely to be watched closely in the runup to the French elections continues alongside top tier UK data/events.

0.8340 is the next level of support which may require a pullback before another leg to the downside. A retest and rejection of 0.8472 may keep bears interested. However, should the BoE alter its messaging to accommodate a more dovish view on rates, market pricing will have to adjust – leaving sterling vulnerable. EUR/GBP levels to the upside include 0.8515 followed by 0.8560. The RSI on the daily chart has recovered from oversold territory – potentially extending the counter-trend move at the start of the week.

EUR/GBP Weekly Chart

image4.png

If you’re puzzled by trading losses, why not take a step in the right direction? Download our guide, “Traits of Successful Traders,” and gain valuable insights to steer clear of common pitfalls

Will the SNB Cut Again Despite Chairman Jordan’s Currency Comments?

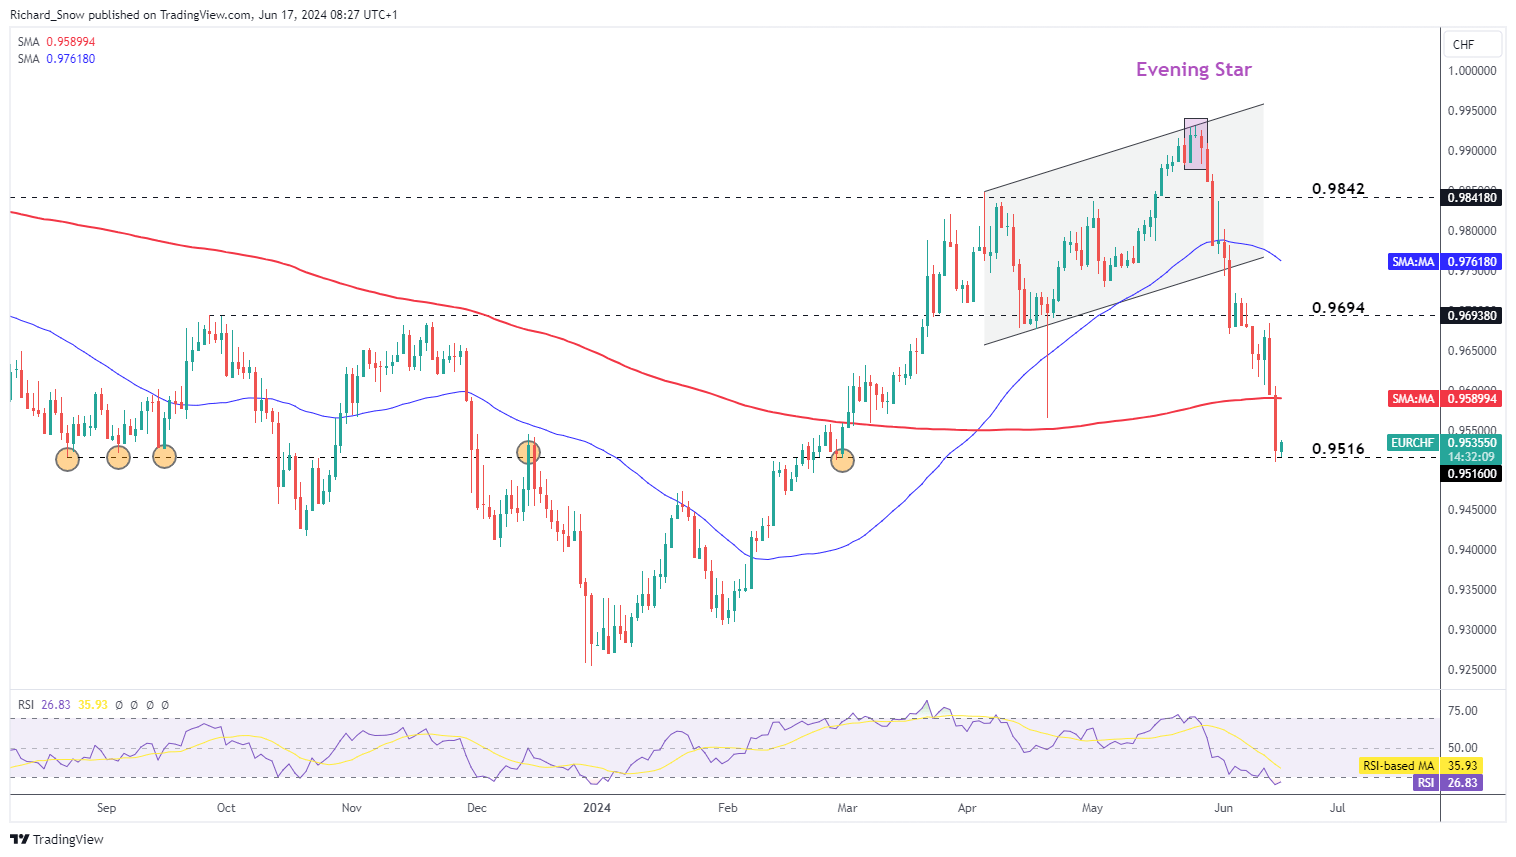
EUR/CHF will be in focus this week as the Swiss National Bank (SNB) is due to meet this week. Markets factor in a 70% chance of another rate cut but the Chairman Thomas Jordan mentioned recently that the biggest threat to the inflation outlook is a weaker franc, which resulted in massive appreciation of the currency and runs the risk of the Bank ultimately deciding to hold rates at 1.5% to prop up the value of the franc.

The pair rests at 0.9516 with little in the way between current ricing and the late December swing low at 0.9255. The pair appears to be recovering from oversold territory, meaning the counter-trend move may extend slightly until the SNB announcement.

EUR/CHF Daily Chart

image5.png


Positive Market Sentiment Nudges Risk Assets Higher, Gold Slips Lower

Positive Market Sentiment Nudges Risk Assets Higher, Gold Slips Lower

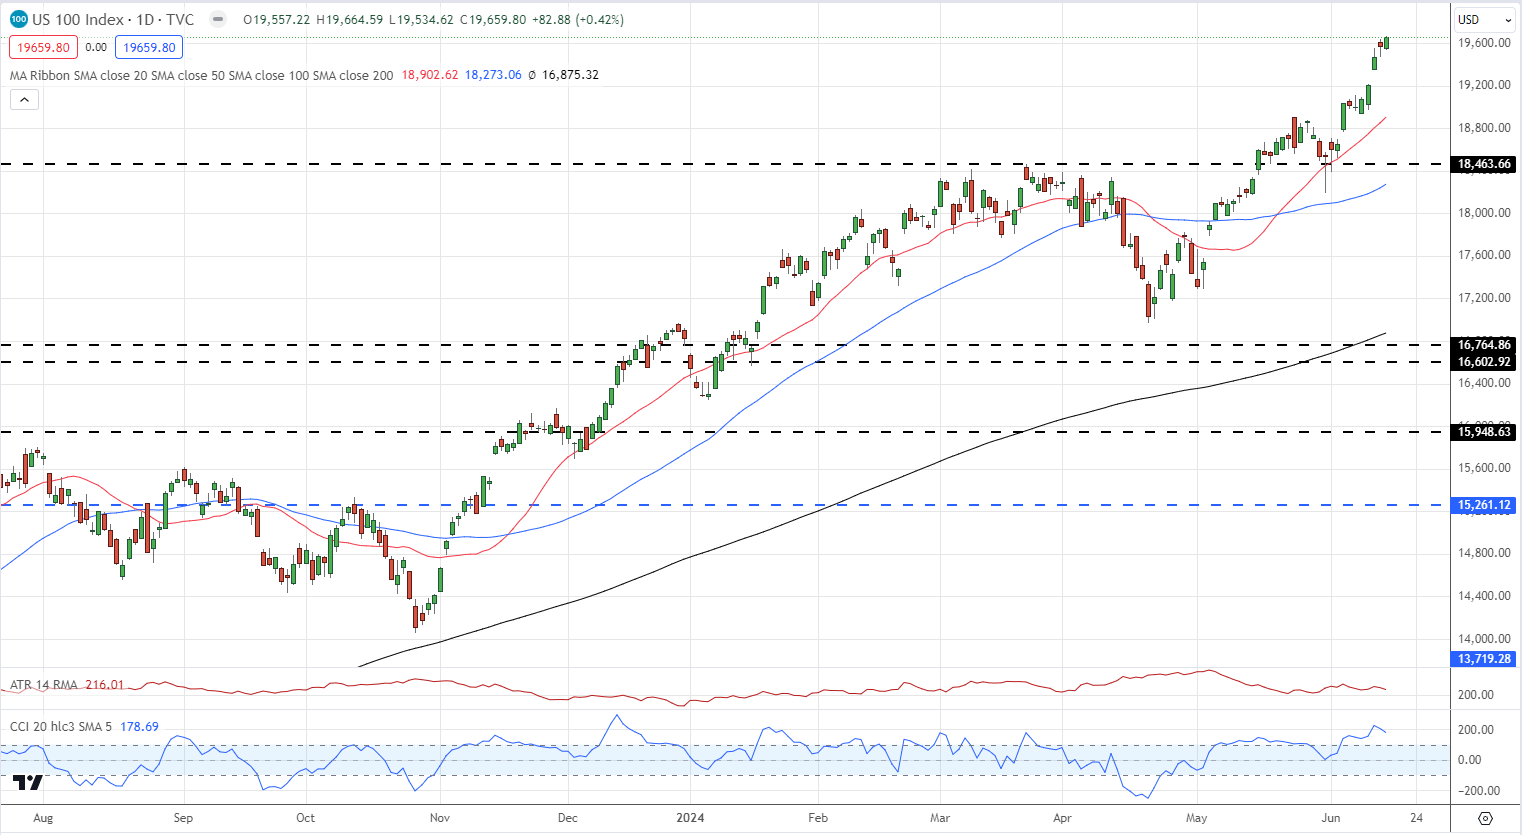
The technology sector in the United States continues its upward momentum, propelled by the persistent demand for the Mag 7 stocks. The Nasdaq 100 index is nearing the significant 20,000 level. The top three corporations in the Nasdaq – Nvidia, Microsoft, and Apple – collectively account for nearly 26% of the index’s total market capitalization. This figure underscores the substantial concentration risk posed by these Mag 7 stocks within the index.

Nasdaq Daily Price Chart

image1.png

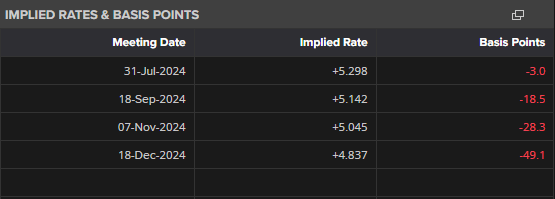
The United States dollar is maintaining a steady course in early trading, with a scarcity of high-impact data or events this week to provide directional guidance. US Treasury yields persist at or slightly above their recent multi-week lows, while expectations for US interest rate cuts remain largely unchanged. The market currently anticipates the first reduction in November, although a move at the September meeting would not come as a surprise. Furthermore, an additional rate cut is expected by the end of the year.

image2.png

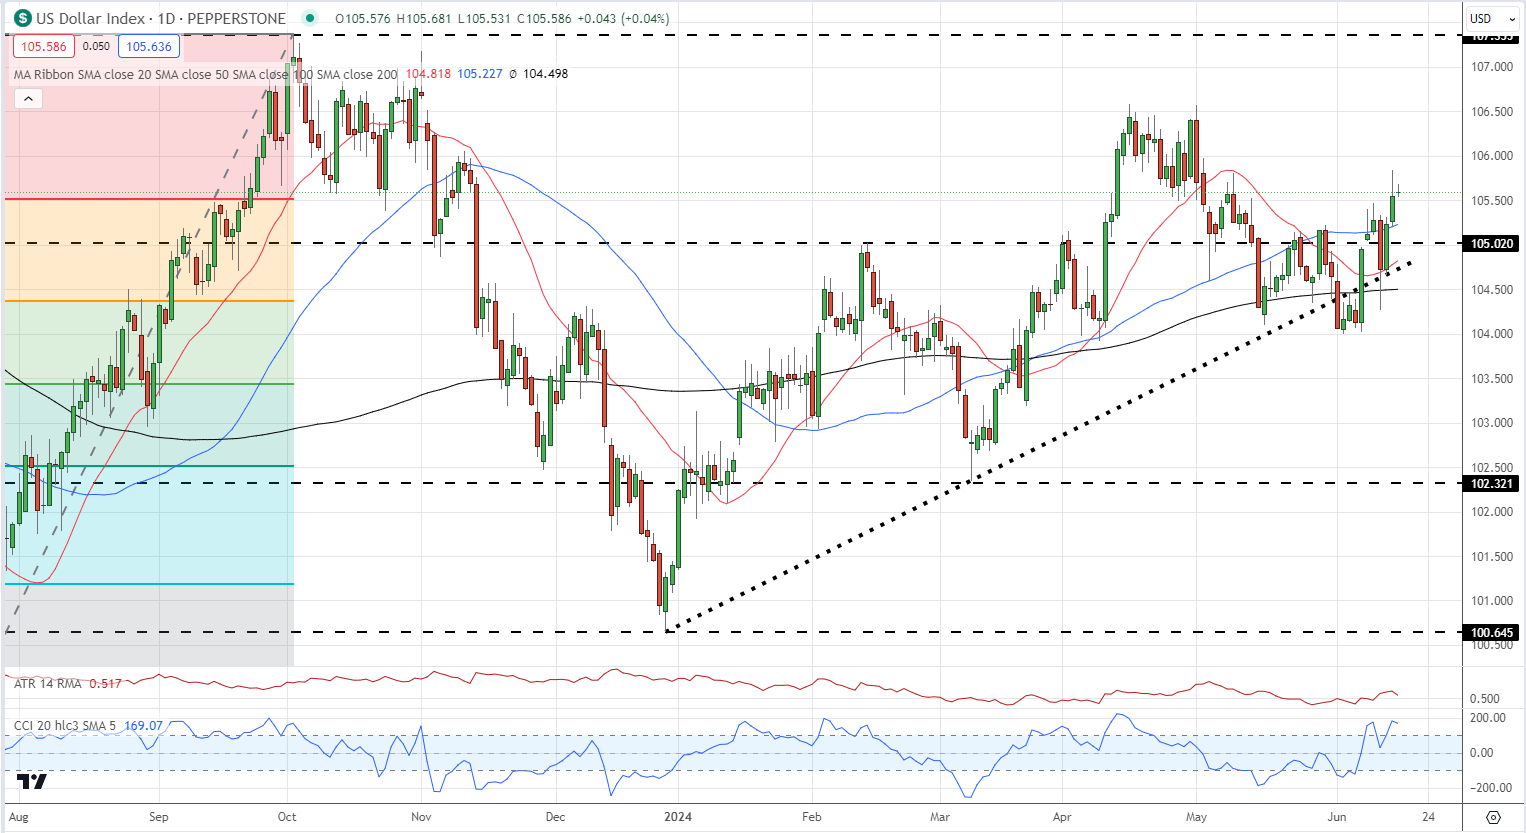
The US dollar index is trading around 105.60 and is consolidating its recent move higher. The greenback is back above all three simple moving averages, a bullish signal, but looks overbought using the CCI indicator.

USD Daily Price Chart

image3.png

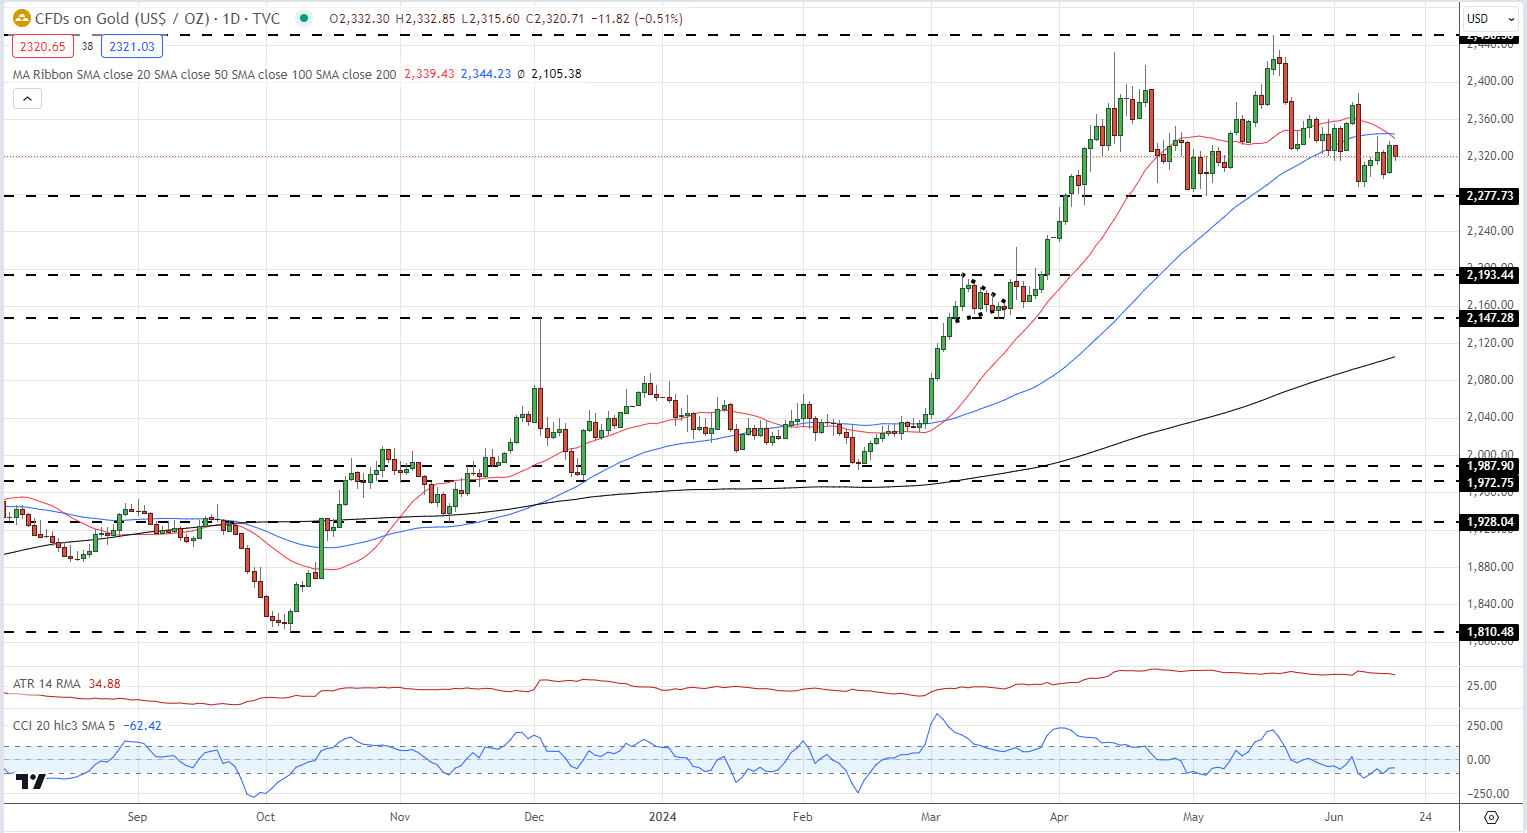
Gold is consolidating its recent gains and remains within a multi-week range. The 20- and 50-day simple moving averages are currently acting as short-term resistance, and these need to be broken and opened above to keep the precious metal moving higher. Support just below $2,280/oz. should hold in the short term.

Gold Daily Price Chart

image4.png

Retail trader data shows 56.86% of traders are net-long with the ratio of traders long to short at 1.32 to 1.The number of traders net-long is 1.99% higher than yesterday and 22.10% lower than last week, while the number of traders net-short is 0.30% higher than yesterday and 33.70% higher than last week.

We typically take a contrarian view to crowd sentiment, and the fact traders are net-long suggests Gold prices may continue to fall. Positioning is more net-long than yesterday but less net-long from last week. The combination of current sentiment and recent changes gives us a further mixed Gold trading bias.

FOMC Roundup: Fed Reconsiders Rate Cuts as Inflation Forecast Drifts Higher

FOMC Roundup: Fed Reconsiders Rate Cuts as Inflation Forecast Drifts Higher

The Fed Forced to Trim Rate Cut Bets due to Hotter Inflation Profile

Federal reserve members were allowed the opportunity to revise their individual interest rate outlooks after May’s inflation data was released just hours before the two-day meeting was due to conclude on Wednesday.

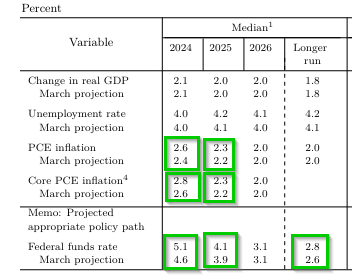
In the end, officials stepped back from their March projections where three rate cuts were deemed appropriate for this year; now opting for just the single 25 basis point cut for 2024. The decision was largely influenced by a series of stubborn inflation prints which recently showed signs of ‘modest’ progress but ultimately forced the Fed to adopt a more conservative stance, being prepared to maintain interest rates at current, restrictive levels.

Growth and unemployment forecasts remained the same for this year but the labour market is expected to ease slightly by the end of 2025. The big movers included headline and core PCE data, rising this year and next, with the Fed funds rate also expected to be firmer over the same horizon.

Summary of Economic Projections (June 2024)

image1.png

Source: US Federal Reserve Bank, prepared by Richard Snow

USD Reclaims Some Lost Ground on Hawkish Forecasts

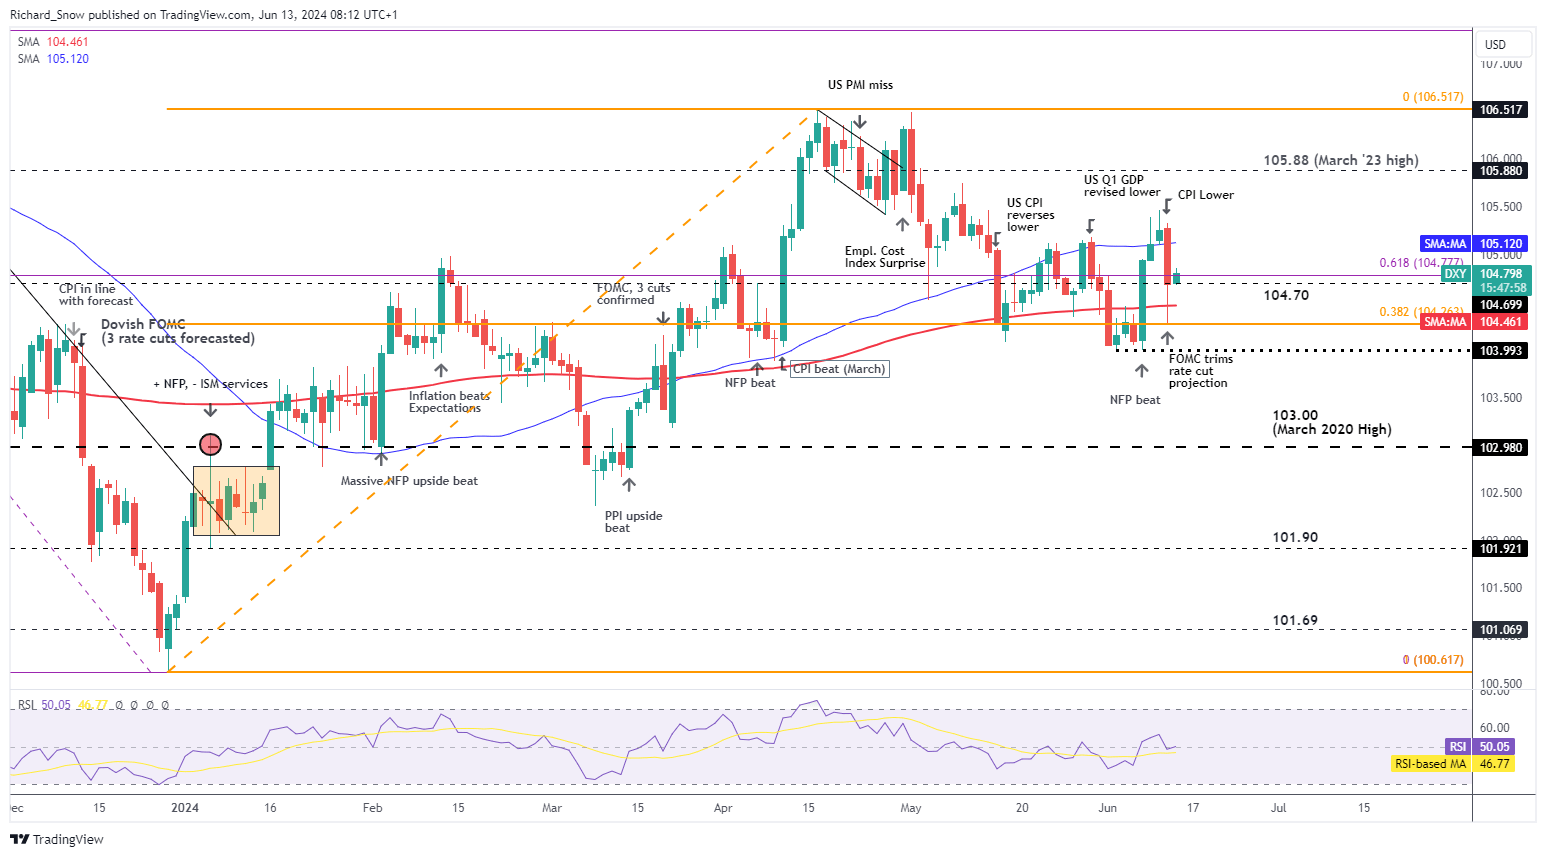
The hawkish forecasts helped the dollar partially recover losses from the earlier, softer CPI print that sent the greenback notably lower. Today the dollar appears to continue the bullish momentum from late in the day yesterday but PPI data this afternoon could bring the focus back to an inflation profile that is evolving in a more favourable manner which could cap USD upside if PPI comes in below the consensus number of 0.1% which is already low as it is.

Markets brought a second rate cut back onto the table after the CPI print yesterday but that was thrown into doubt after the Fed projections where it remains a strong possibility but Is no longer fully priced in.

Dollar bulls will be encouraged by a vulnerable euro, which sold off after the French President Emmanual Macron announced a snap election scheduled for the end of this month. This theme may re-emerge once the CPI data appears in the rear-view mirror and we get closer to the election.

US Dollar Basket (DXY)

image2.png

If you’re puzzled by trading losses, why not take a step in the right direction? Download our guide, “Traits of Successful Traders,” and gain valuable insights to steer clear of common pitfalls

US Equities Rally on Lower Yields, USD Despite the Hotter Inflation Outlook

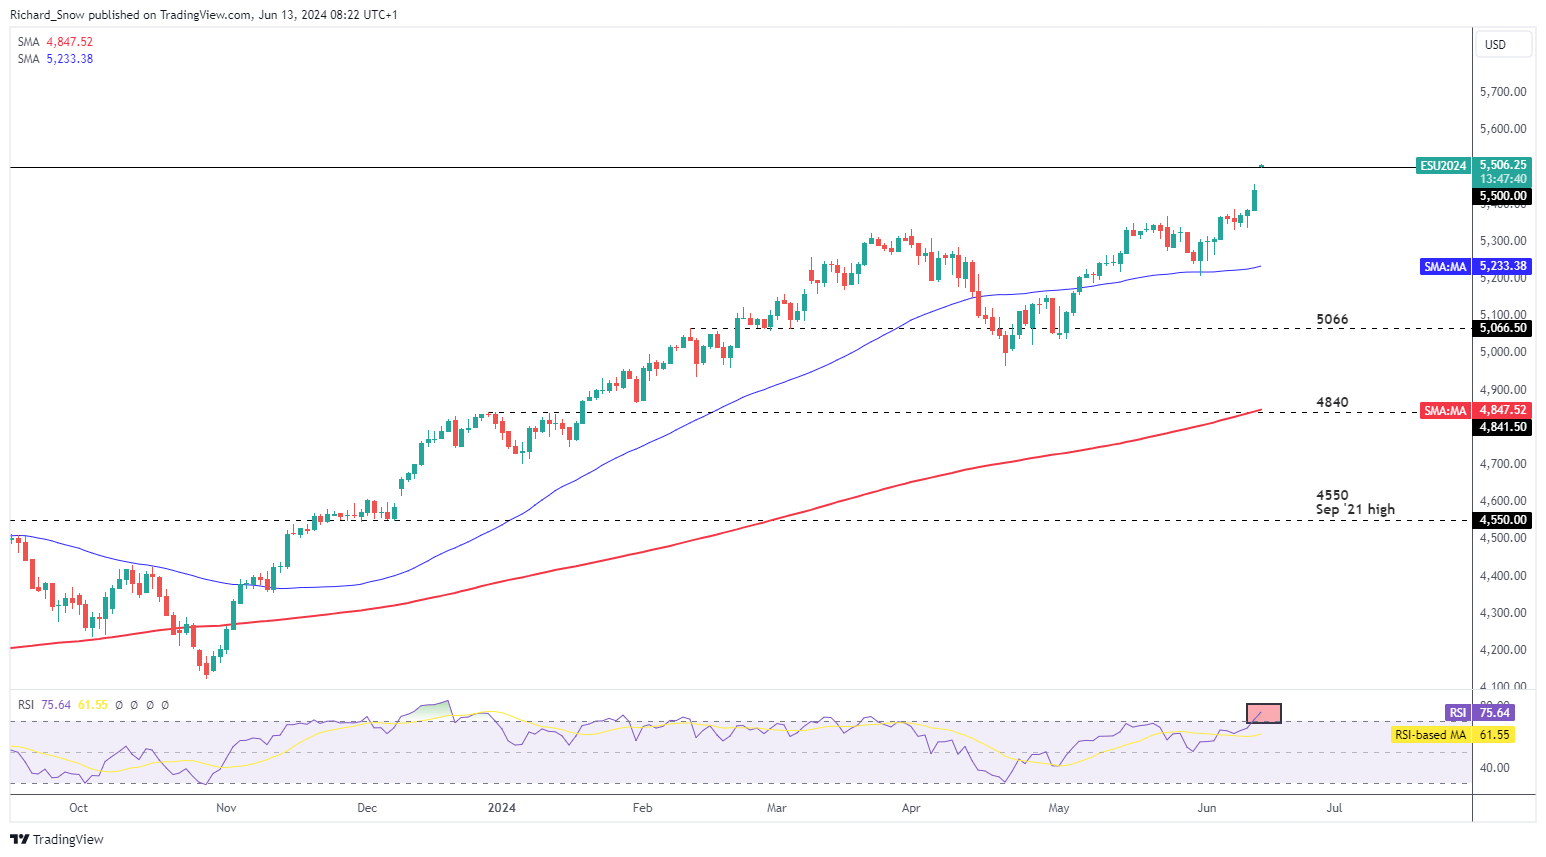
Stocks rallied on the softer inflation print and appear undeterred by the Fed’s hotter inflation outlook. Stocks tend to do well when the dollar and US Treasury yields sink. This effect has been amplified by the fact markets remain hopeful of that second rate cut which remains a strong possibility.

Yesterday, the 5,500 level was identified as upside resistance, a level that is expected to be tested or even breached at the open today. The futures market anticipate a gap higher at the start of trading in New York at 09:30 AM (Eastern Time).

S&P 500 E-Mini Futures (ES1!) Daily Chart

image3.png

Curious to learn how S&P 500 positioning can affect asset prices? Our sentiment guide holds the insights—download it now!

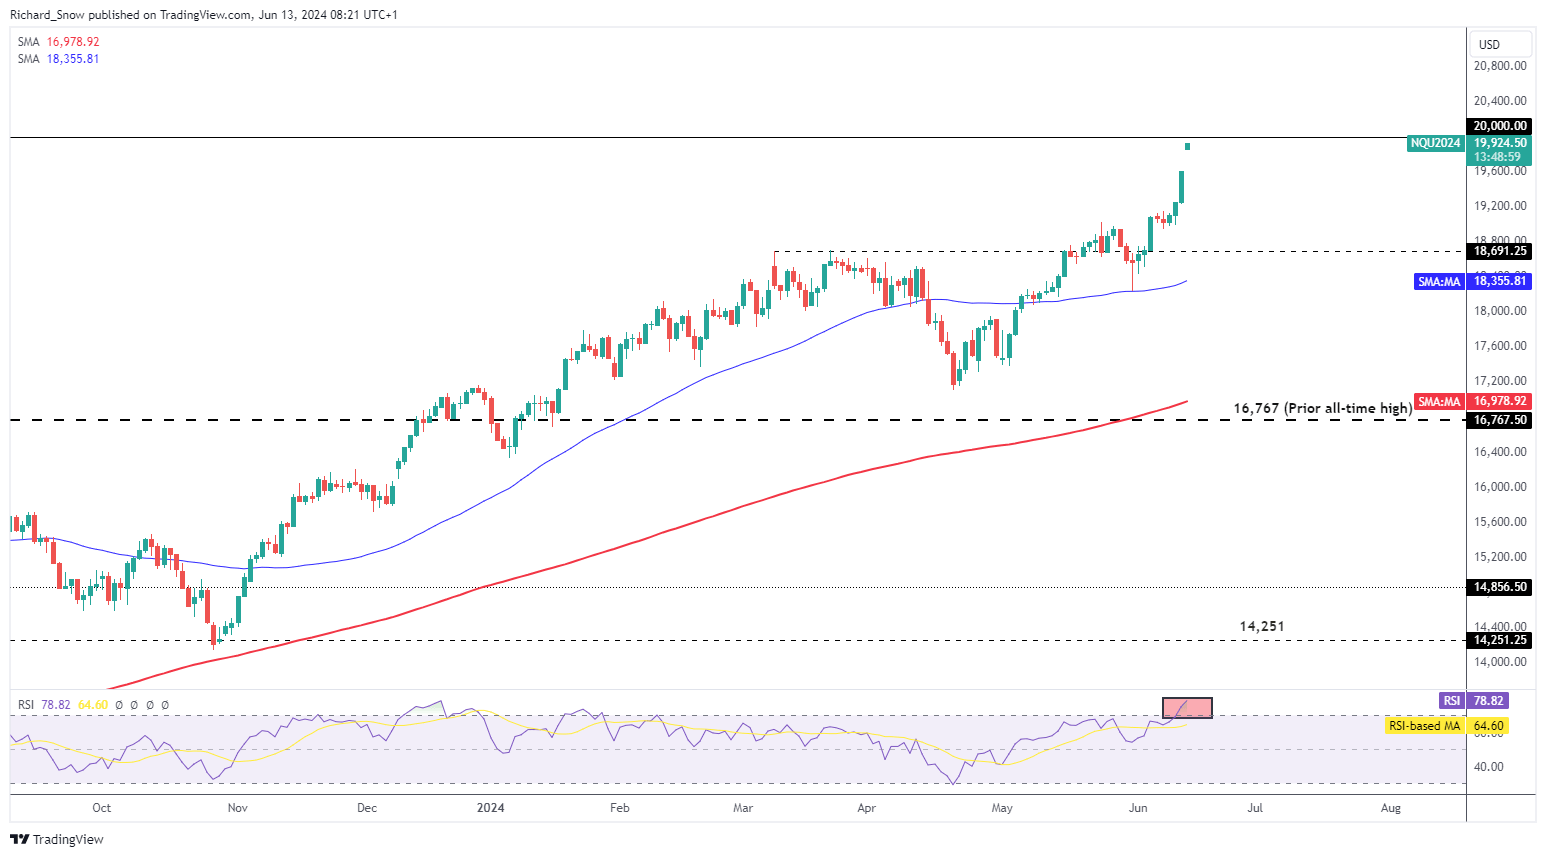
The Nasdaq is also expected to gap higher at the open today, with the continuous futures falling just shy of the psychological 20,000 level. Something to be wary of is the current overbought nature of the advance heading into the last two sessions of the week.

Nasdaq E-Mini Futures (NQ1!) Daily Chart

image4.png


A Guide to Support and Resistance Trading

A Guide to Support and Resistance Trading

Price bouncing between support and resistance

Learn how to trade using support and resistance levels

Support and resistance is a powerful pillar in trading and most strategies have some type of support/resistance (S/R) analysis built into them. Support and resistance tends to develop around key areas that price has regularly approached and rebounded thereafter. This article explains what support and resistance is and covers top support and resistance trading strategies.

What is Support and Resistance?

Support and resistance is one of the most widely followed technical analysis techniques in the financial markets. It is a simple method to analyze a chart quickly to determine three points of interest to a trader:

  • The direction of the market
  • Timing an entry in the market
  • Establishing points to exit the market at either a profit of loss

If a trader can answer the three items above, then they essentially have a trading idea. Identifying levels of support and resistance on a chart can answer those questions for the trader.

Support

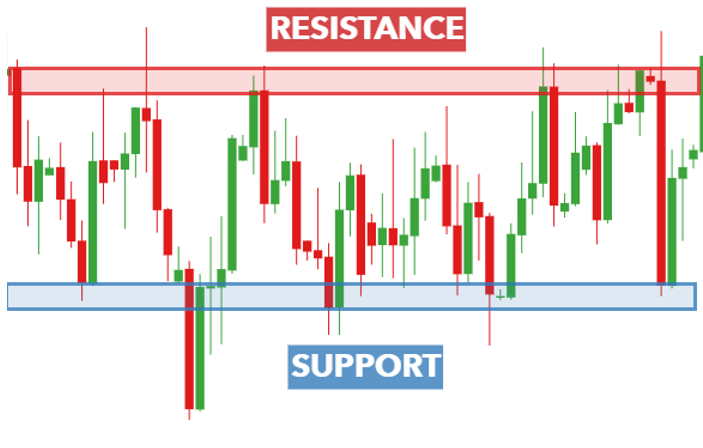
Support is an area on a chart that price has dropped to but struggled to break below. The diagram above shows how price drops down to the area of support and subsequently ‘bounces’ sharply from this level.

In theory, support is the price level at which demand (buying power) is strong enough to prevent the price from declining further. The rationale is that, as the price gets closer and closer to support, and becomes cheaper in the process, buyers see a better deal, and are more likely to buy. Sellers become less likely to sell, since they are getting a worse deal. In that scenario, demand (buyers) will overcome supply (sellers) and that will prohibit price from falling below support.

Resistance

Resistance is an area on a chart that price has risen to but struggled to break above. The diagram above shows how price rises up to the area of resistance and subsequently “bounces” sharply from this level.

Resistance is the price level at which supply (selling power) is strong enough to prevent the price from rising further. The rationale behind this is that as the price gets closer and closer to resistance, and becomes more expensive in the process, sellers are more likely to sell and buyers become less likely to buy. In that scenario, supply (sellers) will overcome demand (buyers) and that will prohibit price from going above resistance.

Top 4 Support and Resistance Trading Strategies

Below are four top strategies for trading with support and resistance:

1) Range trading

Range trading takes place in the space between the support and resistance as traders aim to buy at support and sell at resistance. Think of the area between support and resistance as being a room. Support is the floor and resistance the ceiling. Ranges tend to appear in sideways trading markets where there is no clear indication of a trend.

Pro Tip – Levels of support and resistance are not always perfect lines. Sometimes price will bounce off a particular area, rather than a perfect straight line.

Traders need to identify a trading range and therefore, need to identify areas of support and resistance. The area of support and resistance can be identified and is shown in the chart below:

EURUSD support and resistance when trading in a range

When the market is range-bound, traders tend to look for long entries when price bounces off support and short entries when price bounces off resistance.

It is clear to see that price has not always respected the bounds of support and resistance which is why traders should consider setting stops below support when long, and above resistance when going short.

When price does break out of the defined range, this can either be due to a breakout or a false breakout, also known as a “fakeout”. It is essential to adopt sound risk management to limit downside risk when markets breakout of the trading range.

2) Breakout strategy (pullback)

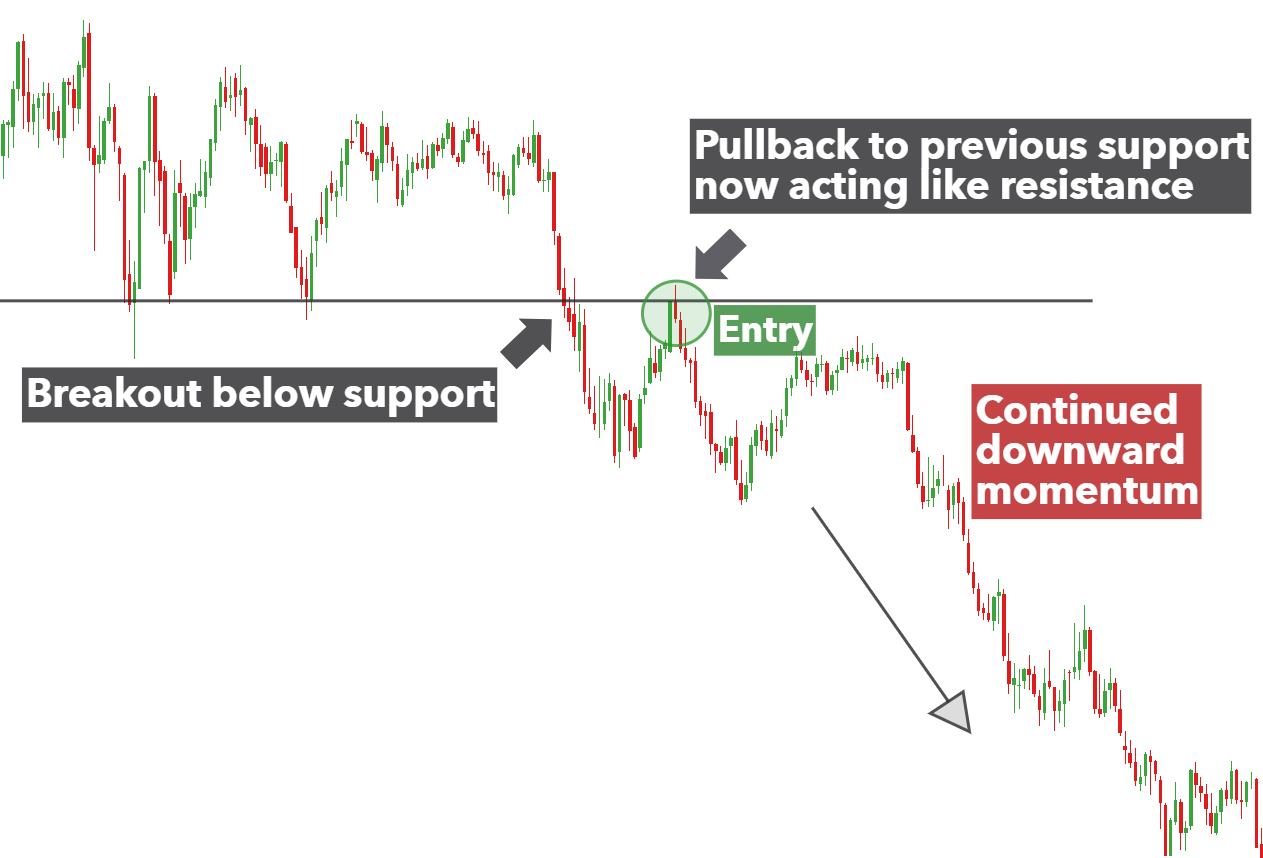
It is often the case that after a period of directional uncertainty that price will breakout and begin trending. Traders often look for such breakouts below support or above resistance in order to capitalize on further increasing momentum in one direction. If this momentum is strong enough it will have the potential to start a new trend.

However, in an attempt to avoid falling into the trap of trading the false breakout, top traders tend to wait for a pullback (towards support or resistance) before committing to a trade.

For example, the chart below shows a strong level of support before sellers pushed the price down below support. Many traders might get carried away and rush to place a short trade prematurely. Instead, traders should wait for the response in the market (buyers attempting to gain control) to break down before executing a short trade.

In the below scenario, traders should wait for the market to continue moving down, after the pullback, before looking for entry points.

AUDUSD pullback towards support

3) Trendline strategy

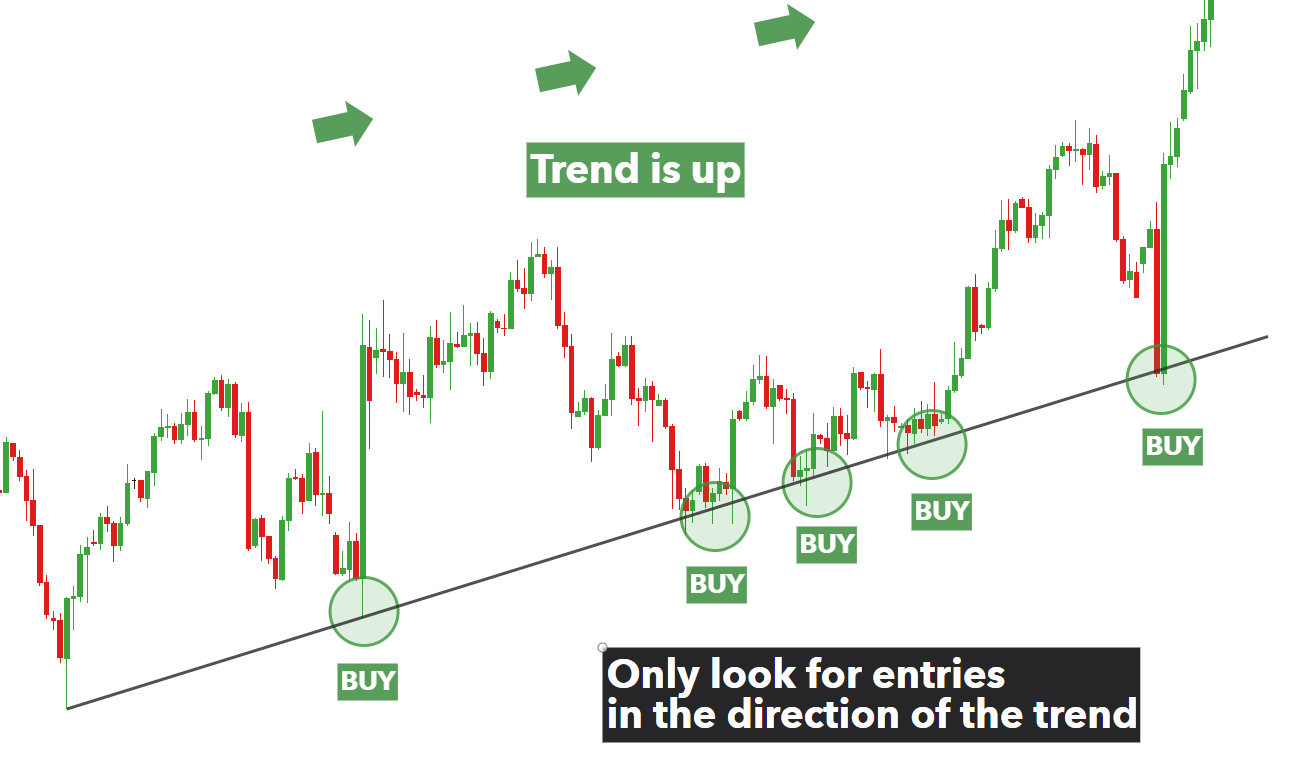
The trendline strategy utilizes the trendline as either support or resistance. Simply draw a line connecting two or more highs in a downtrend, or two or more lows in an uptrend. In a strong trend, price will bounce off the trendline and continue to move in the direction of the trend. Therefore, traders should only be looking for entries in the direction of the trend for higher probability trades.

using trendline as support in US dollar basket up trend.

4) Using Moving averages as support and resistance

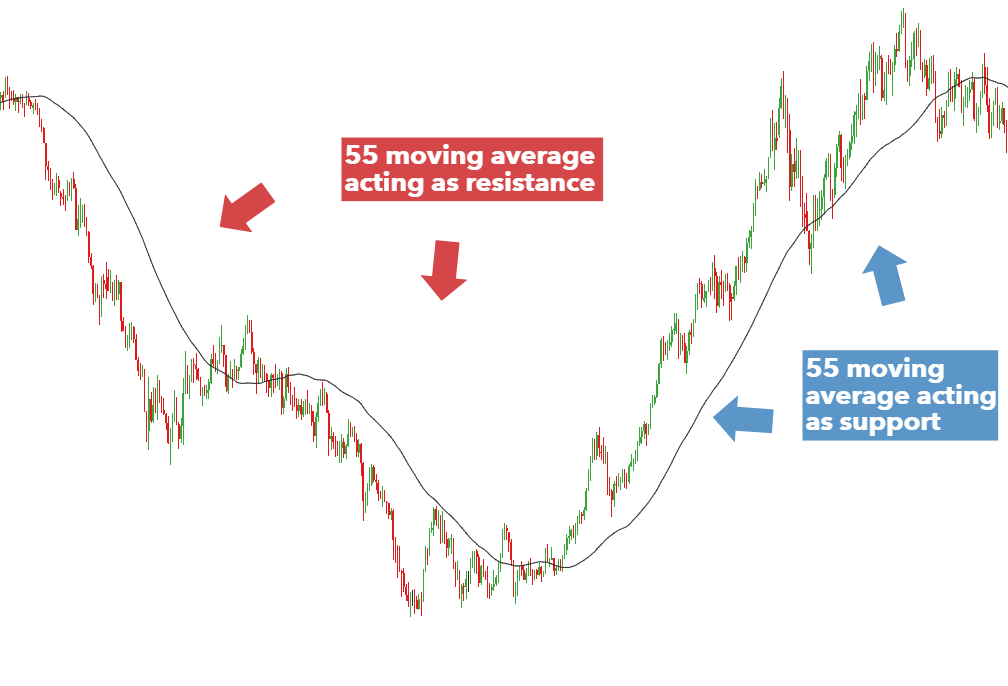
Moving averages can double up as dynamic support and resistance. Popular moving averages to include are the 20 and 50 period moving averages, which can be altered slightly to 21 and 55 period moving averages to make use of Fibonacci numbers. It is not uncommon for traders to incorporate the 100 and 200 MAs and ultimately, it is up to the trader to find a setting that they are comfortable with.

From the chart below, it is clear to see that the 55 MA initially tracks above the market as a line of resistance. The market then bottoms and reverses and the 55 MA then becomes the dynamic level of support. Traders can use these trendlines to make informed decisions about markets likely to continue trending and those susceptible to a breakout.

NZDUSD moving average acting as support and resistance

Support and Resistance Trading Key Takeaways

  • Support and resistance is a powerful pillar in trading and most strategies have some type of support/resistance analysis built into them.
  • Support and resistance strategies can either be based on price respecting these levels (range bound strategy) or anticipating the break of support and resistance (Breakout and pullback strategies).
  • Price will not respect support and resistance forever. Bearing this in mind, traders need to adopt sound risk management to limit losses if there is a breakout.
Forex Trading Journal: A How-To and other Forex Trading Tips

Forex Trading Journal: A How-To and other Forex Trading Tips

A forex trading journal is a log of your trades that can help you refine your strategies based on learning from previous experiences. Just as a business owner tracks inventory, a trader should also keep up with their closed positions.

While keeping a trading journal may be difficult at first, recording your trades can help answer some critical questions about your trading techniques. It can increase the consistency of your trading, keep you accountable, and improve your technique overall. In this piece we will explore what you need to know about journaling, providing the following:

  • A forex trading journal Excel template
  • Tips on finding the journaling method that suits you
  • Tips on the ideal forex trading workflow.

Forex Trading Journal Excel

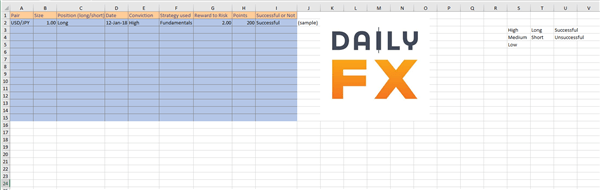
Screenshot showing a forex trading journal template

As in the forex trading journal Excel example above, your journal might contain information such as the currency pair traded, size of the trade, whether your position is long or short, the date of the trade, your conviction level, whether you’ve used a fundamental or technical strategy, the reward to risk ratio, points movement, and whether the trade was successful or not.

You may also want to include details such as the entry price, stop price and limit price, as well as lots traded. The more data you keep, the easier it will be to assess your past trades at a later date.

Also, be sure to include space to add notes in your journal. Traders using multiple entry techniques will want to track things such as chart time frames, indicators used, market conditions (range, trend, breakout) and any other information that factors into a trading decision.

Through journals such as the one above, over time the trader will be able to identify characteristics of winning or losing trades.

The Basics of Technical Analysis

The Basics of Technical Analysis

An Introduction to Technical Analysis

Technical analysis is becoming an increasingly popular approach to trading, thanks in part to the advancement in charting packages and trading platforms. However, for a novice trader, understanding technical analysis – and how it can help predict trends in the market – can be daunting and challenging.

Technical analysis in trading

Technical analysis is the study of price movements in a market, whereby traders make use of historic chart patterns and indicators to predict future trends in the market. It is a visual representation of the past and present performance of a market and allows the trader to use this information in the form of price action, indicators and patterns to guide and inform future trends before entering a trade.

This technical analysis beginners guide will introduce you to the basics of this trading approach, and how it can be used to trade the financial markets.

Understanding Technical Analysis

Technical analysis involves the interpretation of patterns from charts. Trader’s make use of historic data, based primarily on price and volume and use this information to identify trading opportunities based on common patterns in the market. Different indicators are applied to charts to determine entry and exit points for traders to maximize a trades potential at good risk-reward ratios.

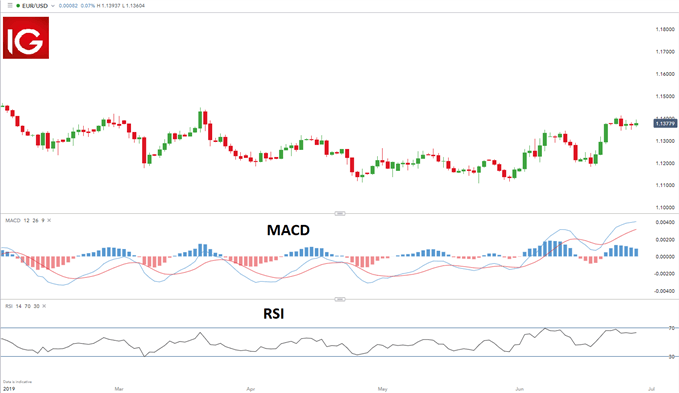
The below chart is an example of a chart with the use of the MACD and RSI indicator.

EUR/USD chart with indicators

While advocates of fundamental analysis believe that economic factors are the main contributors to movements in the markets, technical analysis traders maintain that past trends can assist in predicting future price movements. Although these trading styles can vary, understanding the differences between fundamental and technical analysis – and how to combine them – can be extremely beneficial.

How Technical Analysis can help traders

Many traders have found technical analysis to be a useful tool for risk-management, which can be a key stumbling block. Once a trader understands the concepts and principles of technical analysis, it can be applied to any market, making it a flexible analytical tool. Where fundamental analysis looks to identify intrinsic value in a market, technical analysis looks to identify trends, which conveniently can be caused by the underlying fundamentals.

Using Charts in Technical Analysis

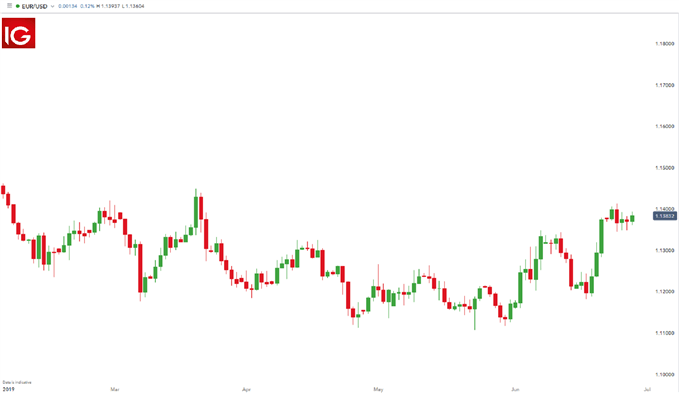
The below chart is an example of a candlestick chart for the EUR/USD currency pair.

EUR/USD candlestick chart

Charts are key to technical analysis. This is because the most important measure of a market’s past and current performance is the price itself; this is the starting point when delving into analyzing the potential of a trade. Price action can be represented on a chart as this is the clearest indication of what the price is doing.

Charts assist in determining the overall trend, whether there’s an upward or downward trend, either over the long or short term or to identify range bound conditions. The most common types of technical analysis charts are line charts, bar charts and candlestick charts.

When using a bar or candlestick chart each period will give the technical analyst information on the price from where it opened, the high or low of the period as well as the close. Candlestick analysis is especially useful as the patterns and relationship within them can assist in making forecasts about the future direction of the price.

Once a trader has mastered the basics of charting, they can then make use of indicators to assist in determining the trend.

Technical Analysis Indicators

Indicators are used by technical traders when looking for opportunities in the market. Although many indicators exist, traders often make use of volume and priced-based indicators. These assist in determining where the levels of support and resistance are, how often they are maintained or breached as well ascertaining the length of a trend.

A trader can view the price or any other indicator using multiple time frame analysis, ranging from one second to a month which gives the trader a different perspective of the price action.

The more popular indicators for technical analysis include:

The EUR/USD chart below shows how to make use of different indicators.

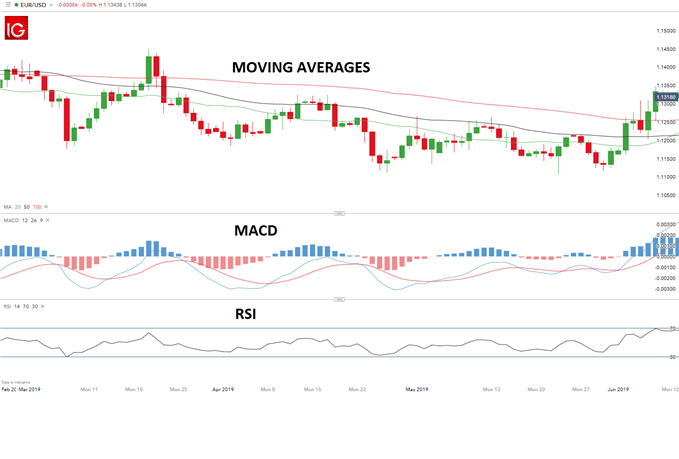
Moving averages and MACD are often used to identify trends in the market while the RSI is typically used to determine possible entry and exit points. Indicators assist traders in analyzing the market, validating trade set ups and determining entry points.

Technical analysis basics using indicators

Short-term analysis for oil, gold, and EURUSD

Short-term analysis for oil, gold, and EURUSD

I welcome my fellow traders! I have made a price forecast for the USCrude, XAUUSD, and EURUSD using a combination of margin zones methodology and technical analysis. Based on the market analysis, I suggest entry signals for intraday traders.
The US dollar weakened after the US Federal Reserve’s interest rate decision.
Oil price forecast for today: USCrude analysis
Oil’s short-term uptrend continued yesterday, but the price started a correction at the close of the US trading session. If the correction continues today, the support (A) 75.96 – 75.66 can be tested. After the price tests this support area, consider long… Read full author’s opinion and review in blog of #LiteFinance https://www.litefinance.org/…/short-term-analysis…/…
Short-term analysis for BTCUSD, XRPUSD, and ETHUSD

Short-term analysis for BTCUSD, XRPUSD, and ETHUSD

Dear readers,
I’ve prepared a short-term forecast for Bitcoin, Ripple, and Ethereum based on the Elliott wave analysis.
Elliott Wave analysis for Bitcoin
The BTCUSD cryptocurrency pair continues forming the final part of a bullish impulse, wave [5]. Its first element, subwave (1), is currently unfolding. Correction 4, which includes subwaves [W]-[X]-[Y], is likely completed as part of subwave (1). The price is expected to rise in subwave 5, probably to the high of 71827.95 marked by subwave [X].
Trading plan for BTCUSD for today:
Buy 67485.82, Take profit: 71827.95
Elliott Wave analysis for Ripple
The pair’s bullish trend continues in… Read full author’s opinion and review in blog of #LiteFinance https://www.litefinance.org/…/short-term-analysis…/…
GOODNEWS: MT4 account servers to be renamed

GOODNEWS: MT4 account servers to be renamed

MT4 account servers to be renamed

Dear clients,

Please be aware that the MT4 account servers specified in the table below will be renamed on Saturday, 15.06.2024, to optimize trading processes.

Old server name
New server name

LiteFinance-ECN.com
LiteFinanceVC-Live-02

LiteFinance-ECN2.com
LiteFinanceVC-Live-03

LiteFinance-ECN3.com
LiteFinanceVC-Live-04

LiteFinance-Classic.com
LiteFinanceVC-Live-05

LiteFinance-Classic2.com
LiteFinanceVC-Live-06

LiteFinance-Classic3.com
LiteFinanceVC-Live-07

LiteFinance-Cent.com
LiteFinanceVC-Live-08

LiteFinance-Cent2.com
LiteFinanceVC-Live-09

LiteFinance-Demo.com
LiteFinanceVC-Demo

LiteFinance Web platform and Mobile trading app

You don’t have to do anything if you use LiteFinance’s online platform at my.litefinance.org.

MT4 desktop version for Windows

In the desktop version of the MetaTrader4 trading platform for Windows, the server name is usually changed automatically, and no errors occur when reconnecting. Simply… Read more https://www.litefinance.org/company/detail/news/104383/…

See less