Pennant Patterns: Trading Bearish & Bullish Pennants

Pennant Patterns: Trading Bearish & Bullish Pennants

What is a Pennant Pattern?

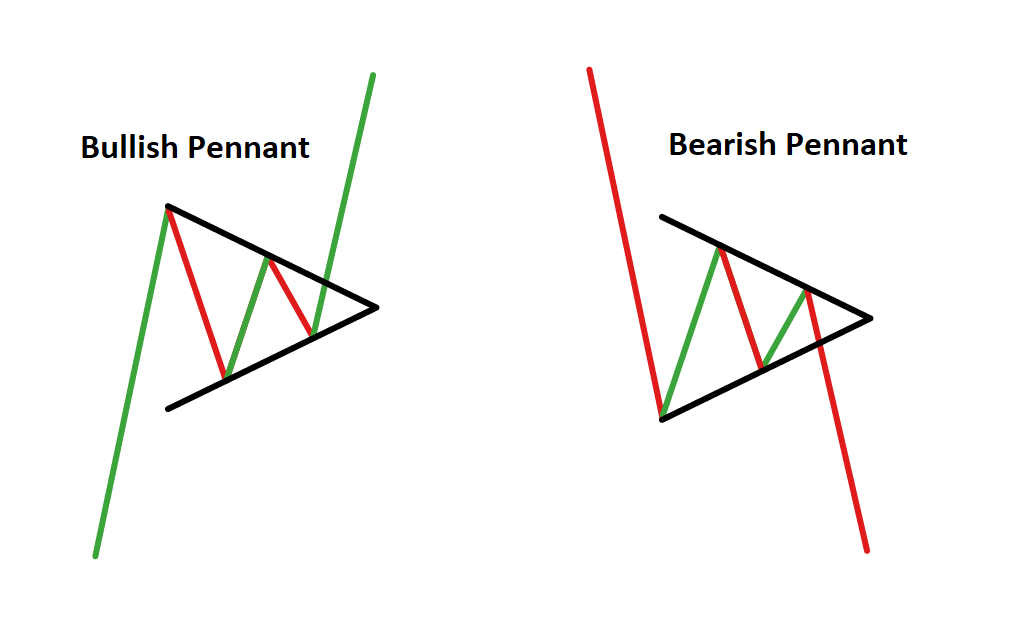
A Pennant pattern is a continuation chart pattern, seen when a security experiences a large upward or downward movement, followed by a brief consolidation, before continuing to move in the same direction. The pattern looks like a small symmetrical triangle called a Pennant, which is made up of numerous forex candlesticks. Depending on the direction of the movement, Pennant patterns are usually described as being bearish or bullish.

Bullish Pennant and Bearish Pennant patterns

Key characteristics of a Pennant pattern

When looking at a Pennant continuation pattern, you will see the following:

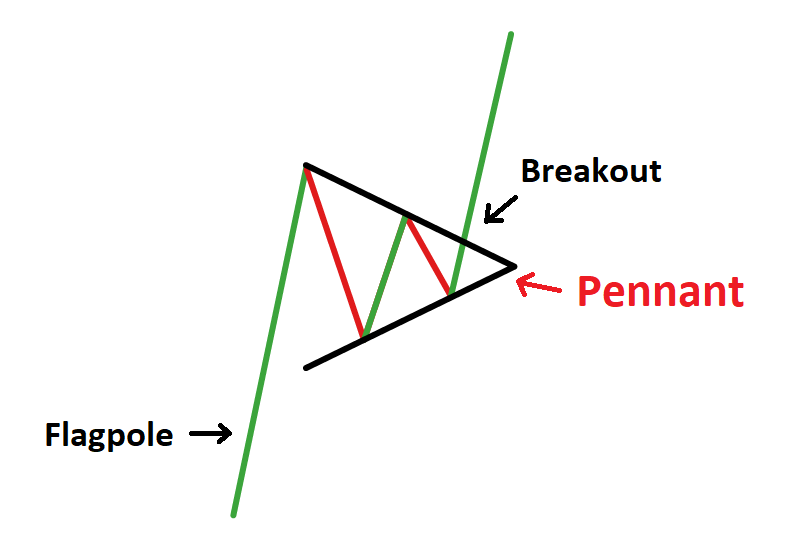
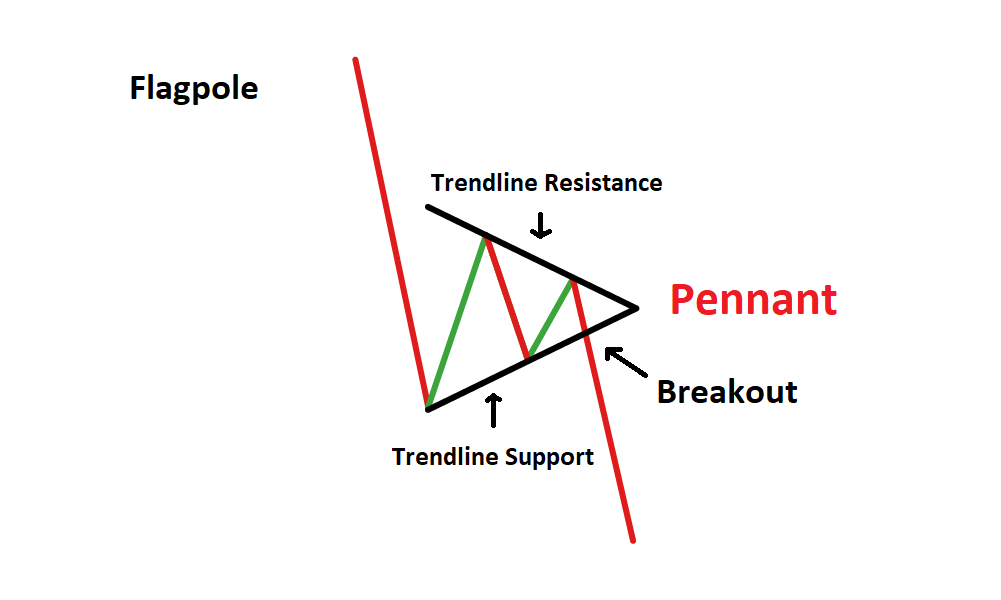
  • A flagpole: A Pennant pattern always begins with a flagpole, which differentiates it from other types of patterns (such as the symmetrical triangle). The flagpole is the initial strong move preceding the symmetrical triangle.
  • Breakout levels: There will be two breakouts, one at the end of the flagpole, and one after the consolidation period, where the upward or downward trend continues
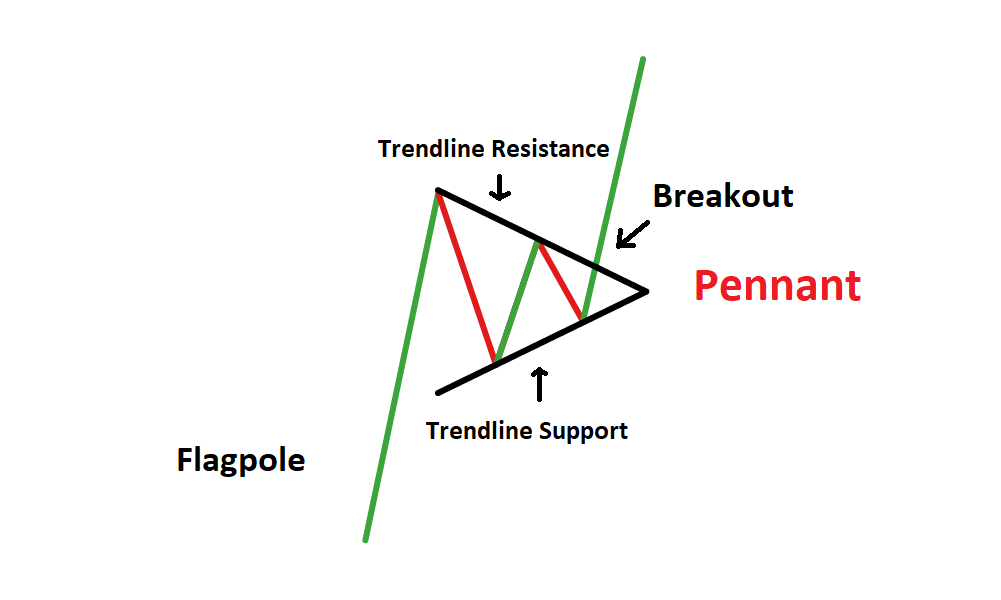
  • The Pennant itself: The Pennant is the triangular pattern formed when the market consolidates, between the flagpole and the breakout. The two converging trendlines form the triangle – the Pennant.

These characteristics can be seen below, with respect to the Bullish Pennant Pattern.

Bullish Pennant explained

Bullish Pennants

Bullish Pennants are continuation candlestick patterns that occur in strong uptrends. The Pennant is formed from an upward flagpole, a consolidation period and then the continuation of the uptrend after a breakout. Traders look for a break above the Pennant to take advantage of the renewed bullish momentum.

Bullish Pennant Pattern

Bearish Pennants

Bearish Pennants are simply the opposite of the Bullish Pennant. Bearish Pennants are continuation patterns that occur in strong downtrends. They always start with a flagpole – a steep drop in price, followed by a pause in the downward movement. This pause forms a triangular shape, known as the Pennant. There is then a breakout, and the downward movement continues. Traders look to enter short trades on a break below the pennant.

Bearish Pennant pattern

Knowing the difference between Pennant patterns and triangle patterns

Pennant patterns are very similar to triangle patterns, but there are some important differences between a forex Pennant and a forex triangle that should be acknowledged in order to trade either pattern successfully.

These are the key differences to note:

  • A Pennant pattern has to be preceded by a strong up or down move that resembles a flagpole. If there isn’t a flagpole, then it’s a triangle and not a Pennant.
  • A Pennant tends to form a shallow retracement (typically less than 38% of the flagpole). A deep retracement is indicative of a triangle rather than a Pennant.
  • A Pennant is characterized by the continuation of the upward or downward trend.
  • A Pennant is a short-term pattern that is usually completed within one to three weeks. A triangle pattern usually takes much longer to form.

How to Trade Bullish and Bearish Pennants

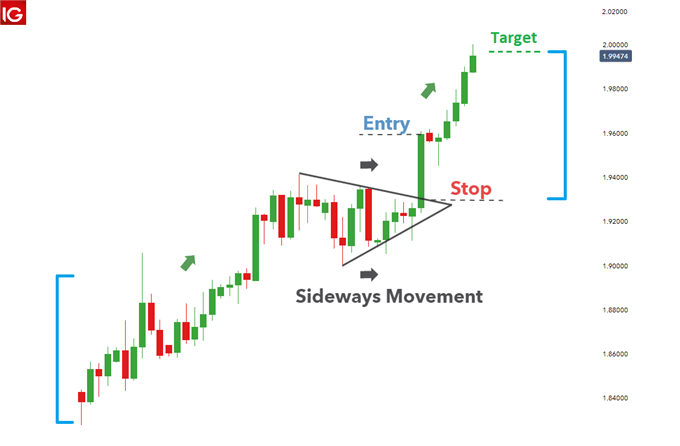
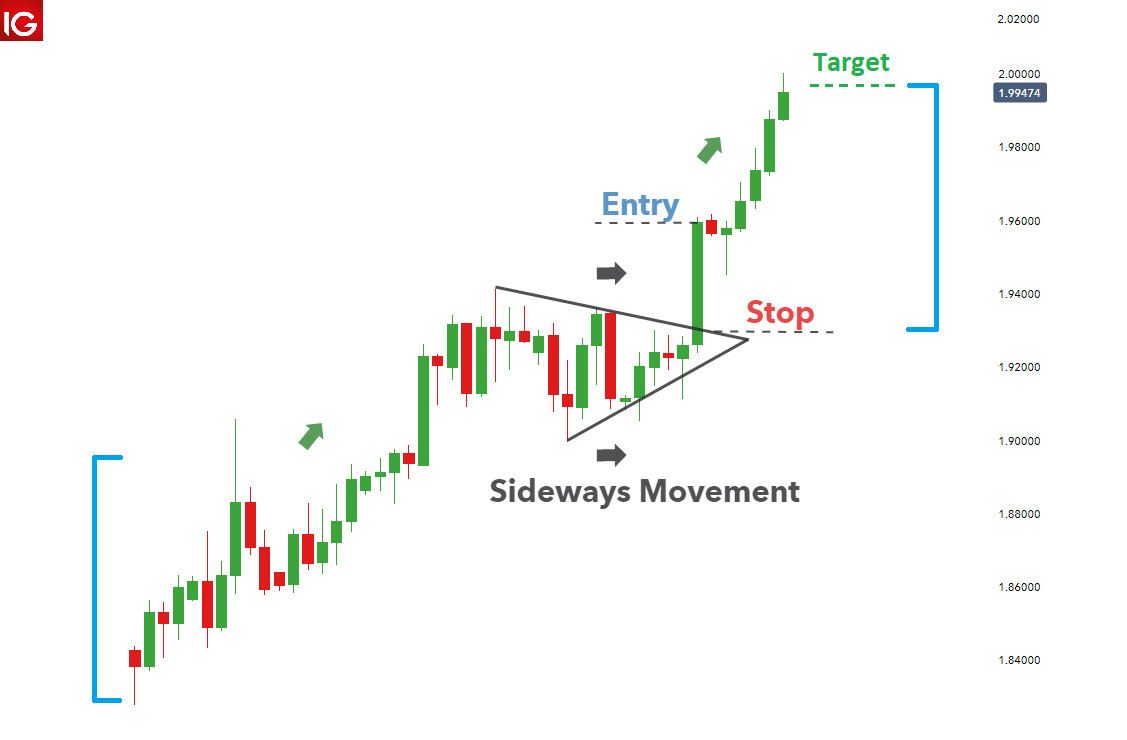
When trading, the same approach can be applied to both the Bullish and Bearish Pennant patterns however, the Bullish Pennant will have a long bias and the Bearish Pennant, a short bias. The example below demonstrates how to trade a Bullish Pennant appearing in GBP/NZD.

Traders should look to enter the trade on confirmation of the breakout after a sudden, sharp move in price. The pennant, after a sharp move in price, indicates that there is likely to be a breakout and continuation in the direction of the initial move.

A candlestick close above the pennant provides the entry point. In this example the break was rather significant and added to the likelihood of a continued move to the upside.

A stop loss can be placed at the low of the breakout candle, seeing that it was quite a big move or, for more conservative traders, a stop can be placed beneath the pennant to limit downside risk. This usually offers an acceptable level of protection for traders.

Keep in mind that the markets don’t always move in the way you expect which is why traders should always adopt prudent risk management. To account for this, only ever trade with capital that you can afford to lose.

To set target levels, traders can measure the distance from the beginning of the flagpole up to the Pennant, then duplicate this distance from the price break out following the Pennant.

GBP/NZD Bullish Pennant Pattern example

Further Reading on Forex Trading Patterns

How well do you know your forex trading patterns? Take our forex patterns quiz to test your knowledge, and explore our articles on candlesticks:

Engulfing Candle Patterns & How to Trade Them

Engulfing Candle Patterns & How to Trade Them

What is an Engulfing Candlestick?

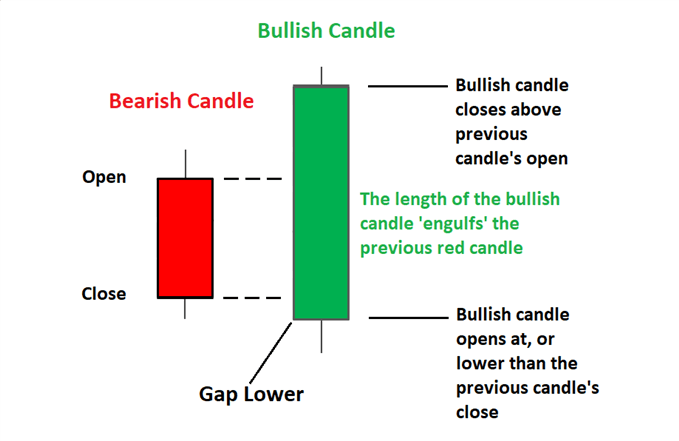
Engulfing candles tend to signal a reversal of the current trend in the market. This specific pattern involves two candles with the latter candle ‘engulfing’ the entire body of the candle before it. The engulfing candle can be bullish or bearish depending on where it forms in relation to the existing trend. The image below presents the bullish engulfing candle.

bullish engulfing candle at the bottom of a downtrend in forex suggests potential reversal

Types of Forex Engulfing Patterns

There are two engulfing candle patterns: bullish engulfing pattern and the bearish engulfing candle.

1) Bullish engulfing pattern

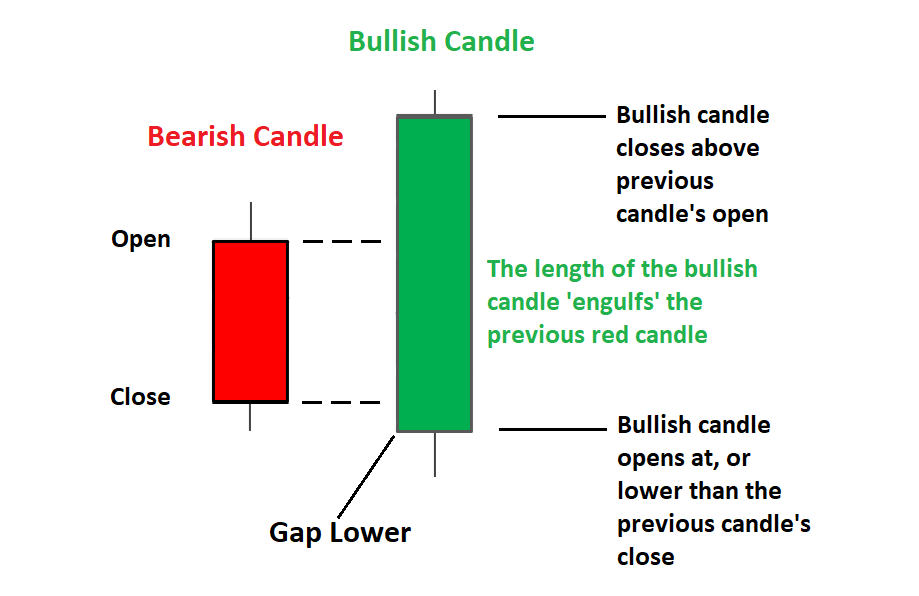
The bullish engulfing candle provides the strongest signal when appearing at the bottom of a downtrend and indicates a surge in buying pressure. The bullish engulfing pattern often triggers a reversal of an existing trend as more buyers enter the market and drive prices up further. The pattern involves two candles with the second candle completely engulfing the ‘body’ of the previous red candle.

Interpretation: Price action must show a clear downtrend when the bullish pattern appears. The large bullish candle shows that buyers are piling into the market aggressively and this provides the initial bias for further upward momentum. Traders will then look for confirmation that the trend is indeed turning around by making use of indicators, key levels of support and resistance and subsequent price action after the engulfing pattern.

bullish engulfing pattern appearing at the bottom of a downtrend

2) Bearish engulfing pattern

The bearish engulfing pattern is simply the opposite of the bullish pattern. It provides the strongest signal when appearing at the top of an uptrend and indicates a surge in selling pressure. The bearish engulfing candle often triggers a reversal of an existing trend as more sellers enter the market and drive prices down further. The pattern involves two candles with the second candle completely engulfing the ‘body’ of the previous green candle.

Interpretation: Price action must show a clear uptrend when the bearish pattern appears. The large bearish candle shows that sellers are piling into the market aggressively and this provides the initial bias for further downward momentum. Traders will then look for confirmation that the trend is indeed turning around by making use of indicators, levels of support and resistance, and subsequent price action that occurs after the engulfing pattern.

Bearish engulfing pattern appearing near the top of an uptrend

Why are Engulfing Candles Important for Traders?

Engulfing candles assist traders to spot reversals, indicate a strengthening trend, and assist traders with an exit signal:

  1. Reversals: Spotting reversals are self-explanatory – it allows the trader to enter a trade at the best possible level and ride the trend to completion.
  2. Trend continuation: Traders can look to the engulfing pattern to support the continuation of the existing trend, for example, spotting a bullish engulfing pattern during an uptrend provides more conviction that the trend will continue.
  3. Exit strategy: The pattern can also be used as a signal to exit an existing trade if the trader holds a position in the existing trend which is coming to an end.

A limitation of the engulfing candle can arise when the pattern turns out to be more of a retracement than a definite change in direction, but traders can look for subsequent price action to reduce the likelihood of this undesirable outcome.

Engulfing Candle Trading Strategies

Using the Engulfing Candle Reversal Strategy

Traders can look to trade the bearish engulfing pattern by waiting for confirmation of the move by observing subsequent price action or to wait for a pullback before initiating a trade.

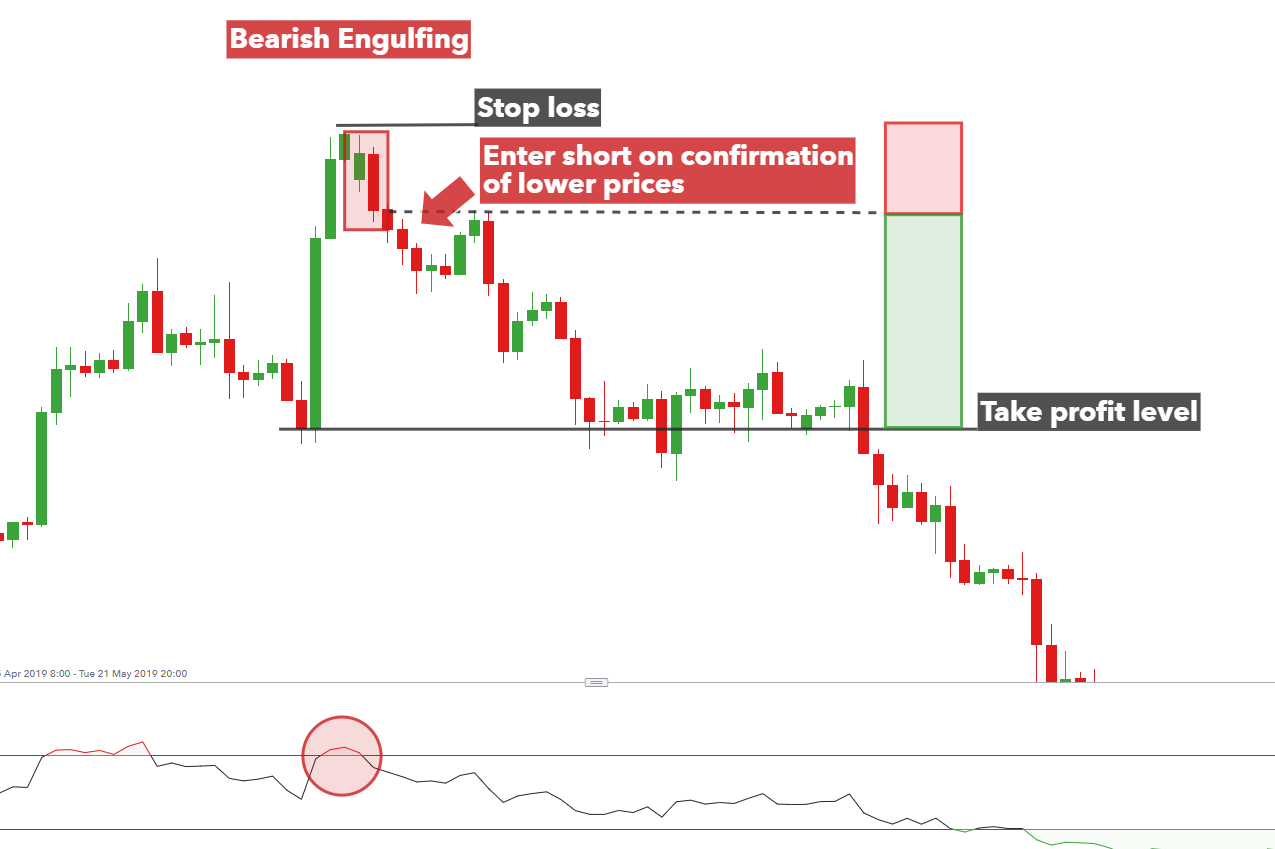
See below for guidance on how to trade the engulfing candlestick pattern observed on the GBP/USD four-hour chart.

GBPUSD 4 hour chart showing how to trade the bearish engulfing candle pattern

  1. Entry: Look for a successful close below the low of the bearish engulfing candle. Alternatively, traders can look for a momentary retracement (towards the dotted line) before entering a short trade.
  2. Stop: Stops can be placed above the swing high where the bearish engulfing pattern occurs.
  3. Target / take profit level: The target can set at a previous level of support while ensuring a positive risk to reward ratio. The risk to reward ratio is depicted by the green and red rectangles.

Using the Engulfing Candle When Trend Trading

Engulfing candles don’t always have to appear at the end of a trend. When viewed within a strong trend, traders can glean information from the candle pattern pointing towards continued momentum in the direction of the existing trend.

For example, the below chart shows a strong uptrend in the S&P 500 with the appearance of multiple engulfing patterns (in the direction of the trend) adding more conviction to long trades. Traders can enter a long trade after observing a close above the bullish candle.

Furthermore, this example includes the presence of a bearish engulfing pattern (red rectangle) that appeared at the top of the trend, signaling a potential reversal. However, subsequent price action did not validate this move as successive candles failed to close below the low of the bearish engulfing candle and the market continued higher – thus underscoring the importance of validating the pattern.

bullish engulfing candles adding to the upward bias

Top 10 Trading Myths: Guest Commentary

Top 10 Trading Myths: Guest Commentary

Debunking top trading myths with Dr. Gary Dayton from Trading Psychology Edge

Knowing the difference between common trading myths and the reality is essential to long-term success. In this article, guest editor, Dr Gary Dayton explores the top 10 trading myths to be aware of. Notably, these myths are closely linked to trading psychology, which goes hand in hand with a successful trading career.

1. People are born traders. While it is true that certain personal characteristics make it easier to trade, no one is born a trader. One of the main themes of the Market Wizards books written by Jack Schwager is that almost none of the market wizards was successful from the start. They all worked hard at it.

2. You have to have a high IQ to trade. Just not true. In some ways, an above average IQ may be a hindrance. Trading is a human performance activity where strong intellectual abilities are unnecessary.

3. Top traders are successful because they have the “right trading personality.” There is no such thing as the “right trading personality.” Researches have been unable to find a strong correlation between personality type and trading success. It is important, however, to understand your personal characteristics and how they may help and hinder your trading. Read more about types of trading styles for different personalities.

4. Trading is easy. It sure looks that way, doesn’t it? Just draw a few lines on the chart, watch your indicators, and follow the price bars. The truth is that trading is a difficult business to master. It involves different skill sets and abilities from what are needed in most other professions and careers. The trader must understand his or her personal strengths and limitations and develop specific skills to deal with the mental and emotional demands of trading. The later skills are the most difficult to develop and the most overlooked.

5. You must be tough, hard charging, and fearless to be successful. That’s more media hype than anything else. It glorifies a strong ego, which is a detriment in trading. The most successful traders I know quietly do their research, study the charts, and patiently wait for the right moment. They strive to keep their ego out of their trading.

6. You must trade without emotions. If you are human, that’s impossible. More importantly, when you understand your emotions you will realize they are assets, not liabilities. The real keys are:

  1. To be aware of how your emotions interact with and influence your trading, and
  2. To develop the skills needed to trade with them.

7. Top traders are usually right about the market. Top traders have many, many scratch and losing trades. Top traders are at the top because they exercise good risk control, limit the amount of loss from any given trade, and have developed a psychological edge that allows them to be unfazed by small losing trades. Most of their trading consists of modest profits and very small losses. When conditions are right, they step up size and let the profitable trades run.

8. Paper trading is useless – it’s not a real trade without money behind it. If you aren’t paper trading, you are doing yourself a disservice. You should always be paper trading your trading ideas. Why limit your education and experience by the amount of capital you have? Paper trading keeps you sharp; you learn the conditions under which your trading ideas work best. Where else can you get such vital education at so little cost?

9. Master the technical skills and you will be successful. This is where most traders spend the vast majority of their time, but it’s only part of the picture. You also have to learn important performance skills. Traders should spend as much-if not more-time learning to develop their psychological edge as they do in developing their technical trading edge.

10. Trading is stressful. It certainly can be stressful, and it certainly is stressful for many. It doesn’t have to be. Successful traders have a certain mindset. They put little importance on any given trade. Their focus is on the long haul. They know that if they attend to the aspects of trading that are within their control (i.e., trade selection, entry, risk control, and trade management) the profits will take care of themselves.

Solana Price Analysis: SOL Traders Could Earn 80% Profits from Ethereum ETFs Launch

Solana Price Analysis: SOL Traders Could Earn 80% Profits from Ethereum ETFs Launch

Solana price has consolidated above the $130 territory in the last 48 hour. Having cornered over 30% of the total funds flowing out of the Ethereum network, SOL is well poised to benefit from the impending spot ETH ETF launch.

SOL DeFi Ecosystem Well-Positioned to Benefit from Ethereum ETF Inflows

Since Solana launched in 2020, a handful of breakout projects have threatened to snatch the “Ethereum-killer” title.

Trading Derivatives carries a high level of risk to your capital and you should only trade with money you can afford to lose. Trading Derivatives may not be suitable for all investors, so please ensure that you fully understand the risks involved, and seek independent advice if necessary. A Product Disclosure Statement (PDS) can be obtained either from this website or on request from our offices and should be considered before entering into a transaction with us. Raw Spread accounts offer spread

But, 4 years on, thanks to a superior tech stack, efficient DeFi ecosystem, and burgeoning global meme community, Solana has emerged as the most sought-after cryptocurrency network for decentralized finance transactions behind Ethereum.

Solana TVL vs. NON-EVM Chains | June 17, 2024 | Source: DeFillama

In affirmation of this stance, the DeFiLlama chart above shows how Solana has cornered 42.6% of the Non-Ethereum based (Non-EVM) DeFi market, with an active Total Value Locked (TVL) of $4.12 billion.

But looking ahead, Solana appears perfectly poised to widen this gap when Ethereum ETFs officially launch in the next couple of weeks.

The current on-chain data trends from Wormhole, Ethereum’s largest cross-chain bridge, show that Solana remains the leading destination for ETH investors looking to migrate their assets for multi-chain transactions and profit optimization.

Ethereum investors have bridged assets worth $3.09 billion over the past year. As illustrated in the snapshot above, the Solana DeFi ecosystem has attracted more than $951.7 million, accounting for 30.9% of the total funds flowing out of the Ethereum ecosystem.

Cross-chain Fund-flows from Ethereum to Solana - June 2023 to June 2024 | Source: Wormhole

Cross-chain Fund-flows from Ethereum to Solana – June 2023 to June 2024 | Source: WormholeThe impending launch of Ethereum ETFs is set to propel the funds flowing into the Solana DeFi ecosystem even higher in the coming months.

Bitcoin ETFs have accumulated nearly $60 billion worth of BTC within 6 months post-launch. Based on conservative estimates, Ethereum ETFs are likely to attract approximately 50% of that amount within the same timeframe. That figure could even be higher than $30 billion due to asset re-hypothecation and passive income opportunities presented by the Proof-of-Stake consensus.

Taking a cue from the chart above, having attracted 30.85% of all bridged outflows from Ethereum in the past year, Solana is well-positioned to pull a sizeable amount of the potential spot ETH ETF fund inflows in the coming months.

If the inflows into the Solana DeFi ecosystem surge as predicted, invariably, SOL price is poised to experience considerable upside.

Solana Price Forecast: Bulls to Halt Further Downswings below $130

Solana is currently trading at approximately $102.74, experiencing a modest gain of 1.62% within the daily timeframe on June 23.

The price action shows SOL fluctuating within a descending triangle pattern, bounded by downward-sloping resistance and horizontal support. This pattern typically signals bearish continuation, but the strong defence of the 200-day SMA adds a layer of complexity to that outlook.

Solana price forecast | SOL/USD 

Solana price forecast | SOL/USDThe resilience at the 200-day SMA suggests a possible rebound if buying pressure continues to sustain above this level. Conversely, a break below could trigger further downside, potentially targeting lower support zones around $100. Key resistance levels to watch include $142.50 and $159.14, which could act as barriers to any upward movement.

Investors should closely monitor these technical indicators, as a decisive move in either direction could set the tone for SOL’s mid-term price trajectory. The interplay between the 50-day and 200-day SMAs, along with the significant horizontal levels, will be crucial in determining the next major trend for Solana.

PCE Data, Earnings Reports to Shape Economic Policies

PCE Data, Earnings Reports to Shape Economic Policies

PCE Inflation Data in Focus as Nvidia Hosts Shareholder Meeting

Investors await the Personal Consumption Expenditures (PCE) index on Friday, hoping for signs of easing inflation that might prompt the Federal Reserve to cut interest rates. This week’s corporate updates feature Nvidia’s shareholder meeting, Micron Technology’s earnings, and reports from Nike, FedEx, and Walgreens. These events provide insights into inflation trends and the AI market, with significant implications for market sentiment and future economic policies.

Daily Apple Inc

EU Says Apple Breaches New Tech Rules, Opens Further Probe

EU regulators found Apple in violation of the Digital Markets Act (DMA) for restricting App Store developers from directing users to alternative purchasing channels. The European Commission also initiated a new investigation into Apple’s contractual terms with developers. The DMA, implemented to limit Big Tech’s power, prohibits blocking businesses from informing users about cheaper options outside of app stores. Apple’s steering system is criticized for imposing excessive restrictions and fees on developers.

Experts trade the markets with IC Markets

Trading Derivatives carries a high level of risk to your capital and you should only trade with money you can afford to lose. Trading Derivatives may not be suitable for all investors, so please ensure that you fully understand the risks involved, and seek independent advice if necessary. A Product Disclosure Statement (PDS) can be obtained either from this website or on request from our offices and should be considered before entering into a transaction with us. Raw Spread accounts offer spread

Stock Futures Mixed as Market Nears Record Highs

Stock futures were mixed Monday as the market nears the end of June and the first half of 2024 at near record highs. The S&P 500 hit an intraday record last Thursday, gaining 0.6% for its eighth positive week in nine. Nvidia, a market heavyweight, saw a 4% drop last week after back-to-back declines over 3%. Analysts caution that Nvidia’s rapid rise may face hurdles, despite strong fundamentals. AI enthusiasm continues to drive market gains this year.

Gold Edges Up, Oil Prices Dip Amid Stronger Dollar

Gold prices rose 0.2% on Monday, reaching $2,325.53 per ounce, as falling Treasury yields made bullion more attractive. Investors await U.S. inflation data and Federal Reserve comments for rate cut signals. Meanwhile, oil prices fell for a second session, with Brent crude down 0.5% to $84.84 per barrel and West Texas Intermediate crude down 0.5% to $80.34. A stronger dollar pressured commodities, although last week saw gains due to rising U.S. demand and geopolitical tensions.

Major Cryptos Slide as Bitcoin Drops 3%, $150M in Longs Liquidated

Major cryptocurrencies fell up to 7.5% in 24 hours, with Bitcoin dropping 3%, leading to over $150 million in liquidated bullish bets. Ether, Cardano’s ADA, and BNB also experienced losses, while Solana’s SOL dropped 7%. Dogecoin and Shiba Inu fell nearly 5%. The CoinDesk 20 index fell over 4%. Contributing factors included large Bitcoin miner sales and the German government’s movement of substantial BTC amounts to exchanges, causing market jitters.

Gold (XAU/USD) & Silver (XAG/USD) – Retail Sentiment Analysis Update

Gold (XAU/USD) & Silver (XAG/USD) – Retail Sentiment Analysis Update

Gold (XAU/USD) Latest:

Recent IG retail trader data reveals a significant bullish sentiment towards gold, with 63.96% of traders holding net-long positions. The long-to-short ratio is 1.77 to 1, indicating a clear preference for long positions. However, this overwhelming bullish sentiment may paradoxically signal potential downward pressure on gold prices.

Compared to yesterday, net-long traders have increased by 2.36%, while net-short positions have decreased slightly by 0.47%. The weekly trend is even more pronounced, with net-long positions up 11.72% and net-short positions down 18.12%.

Given our contrarian approach to market sentiment, this data suggests gold prices may continue to decline. The combination of current positioning and recent shifts strengthens our bearish outlook on gold.

Gold Daily Price Chart

image1.png

Silver (XAG/USD) Latest:

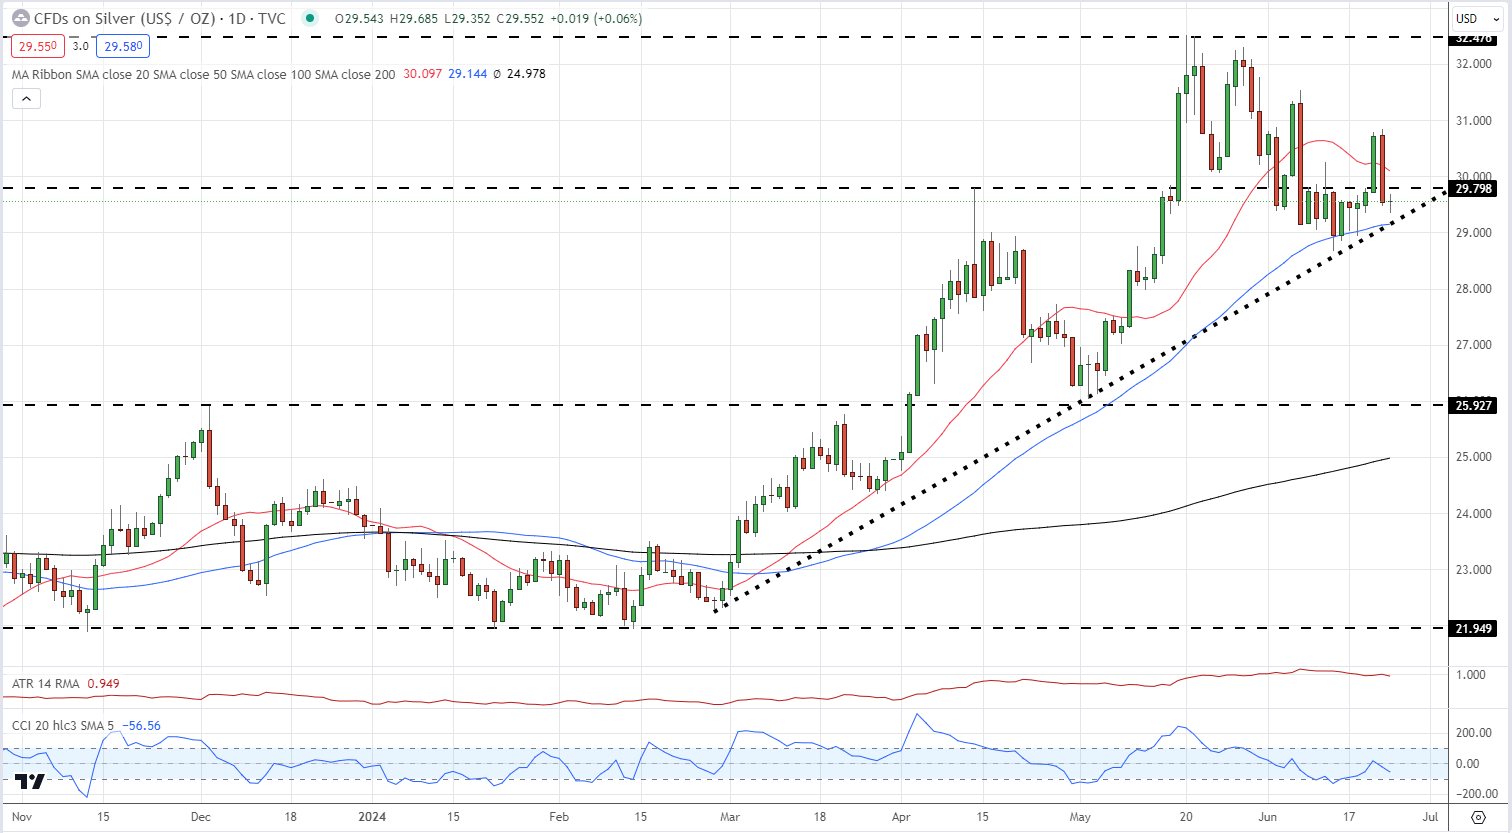
IG retail trader data reveals an overwhelming bullish sentiment towards silver, with 84.00% of traders holding net-long positions. The long-to-short ratio stands at a remarkable 5.25 to 1, indicating a significant imbalance in market positioning.

Compared to yesterday, net-long traders have increased by 1.46%, while net-short positions have decreased by 3.06%. The weekly trend is even more pronounced, with net-long positions up 3.61% and net-short positions down 25.24%.

Adopting a contrarian view to crowd sentiment, this extreme bullish positioning suggests silver prices may face downward pressure. Combining current sentiment and recent shifts strengthens our bearish outlook on silver.

Silver Daily Price Chart

image2.png


Markets Week Ahead: US Data, Nasdaq 100, US Dollar and Gold

Markets Week Ahead: US Data, Nasdaq 100, US Dollar and Gold

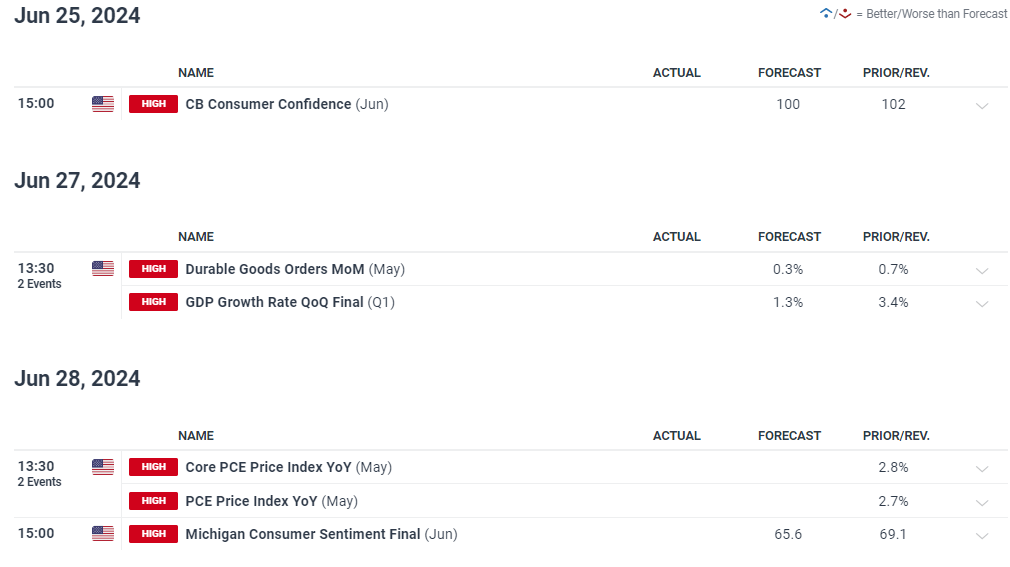
Financial markets may see renewed volatility next week on the back of some notable US economic data releases. While CB consumer confidence, durable goods, and Michigan consumer confidence are potential market movers, Wednesday’s final US Q1 GDP report and Friday’s US core PCE release are next week’s heavy hitters. The latter has recently stalled around 2.8%, well above the Fed’s 2% target, and another unchanged print will increase pressure on the Federal Reserve to leave rates untouched for longer.

image1.png

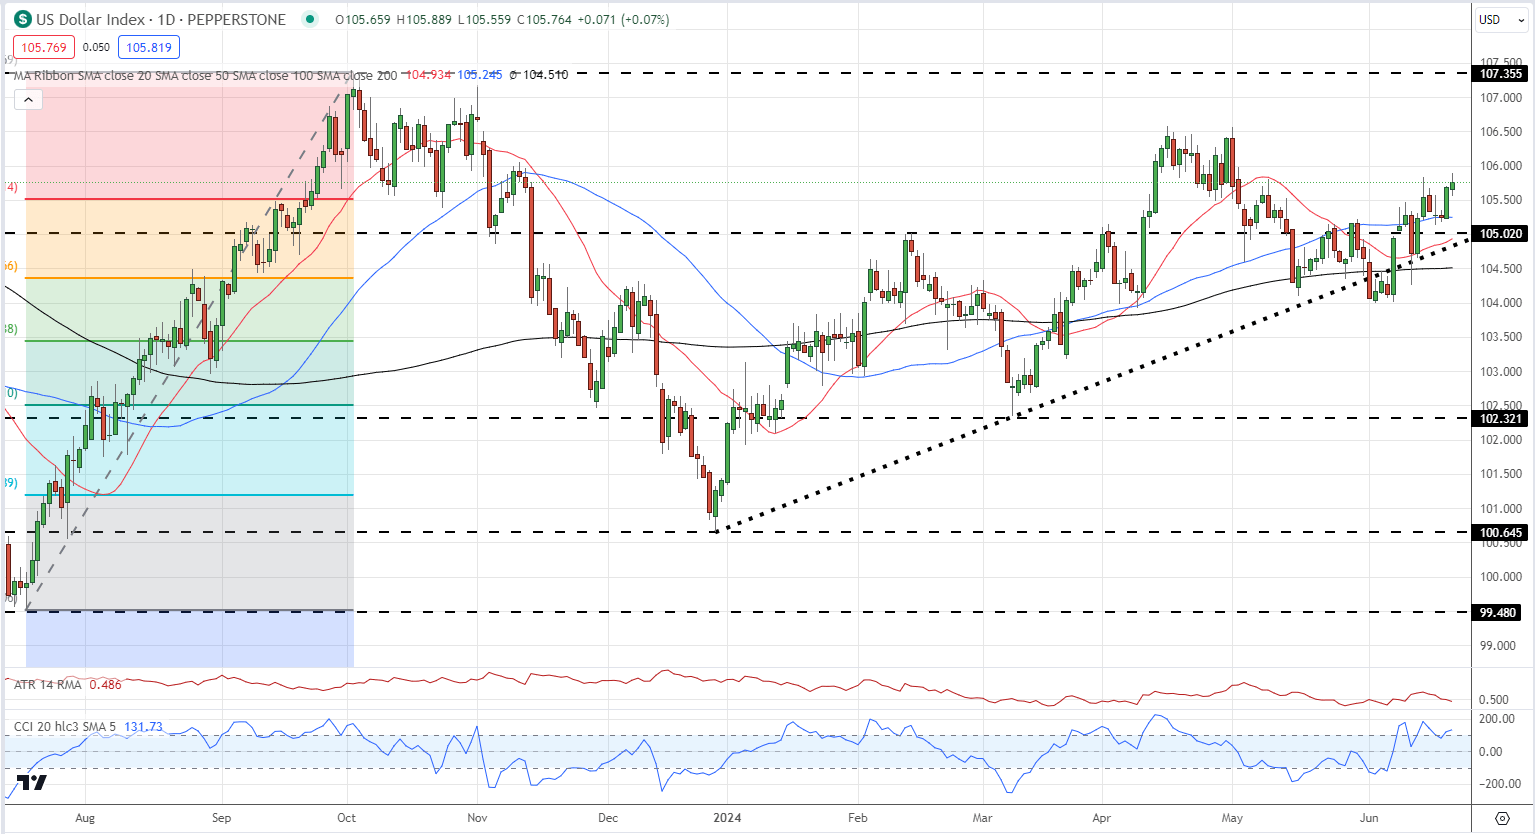
The US dollar continues to move higher with the DXY boosted by weakness in the Euro, British Pound, and Japanese Yen. This year’s series of higher lows and higher highs remains in place and the index is closing in the recent double high around 106.60. To break above this multi-month high, the US dollar is going to have to make the running and not rely on weakness in other G7 currencies.

US Dollar Index Daily Chart

image2.png

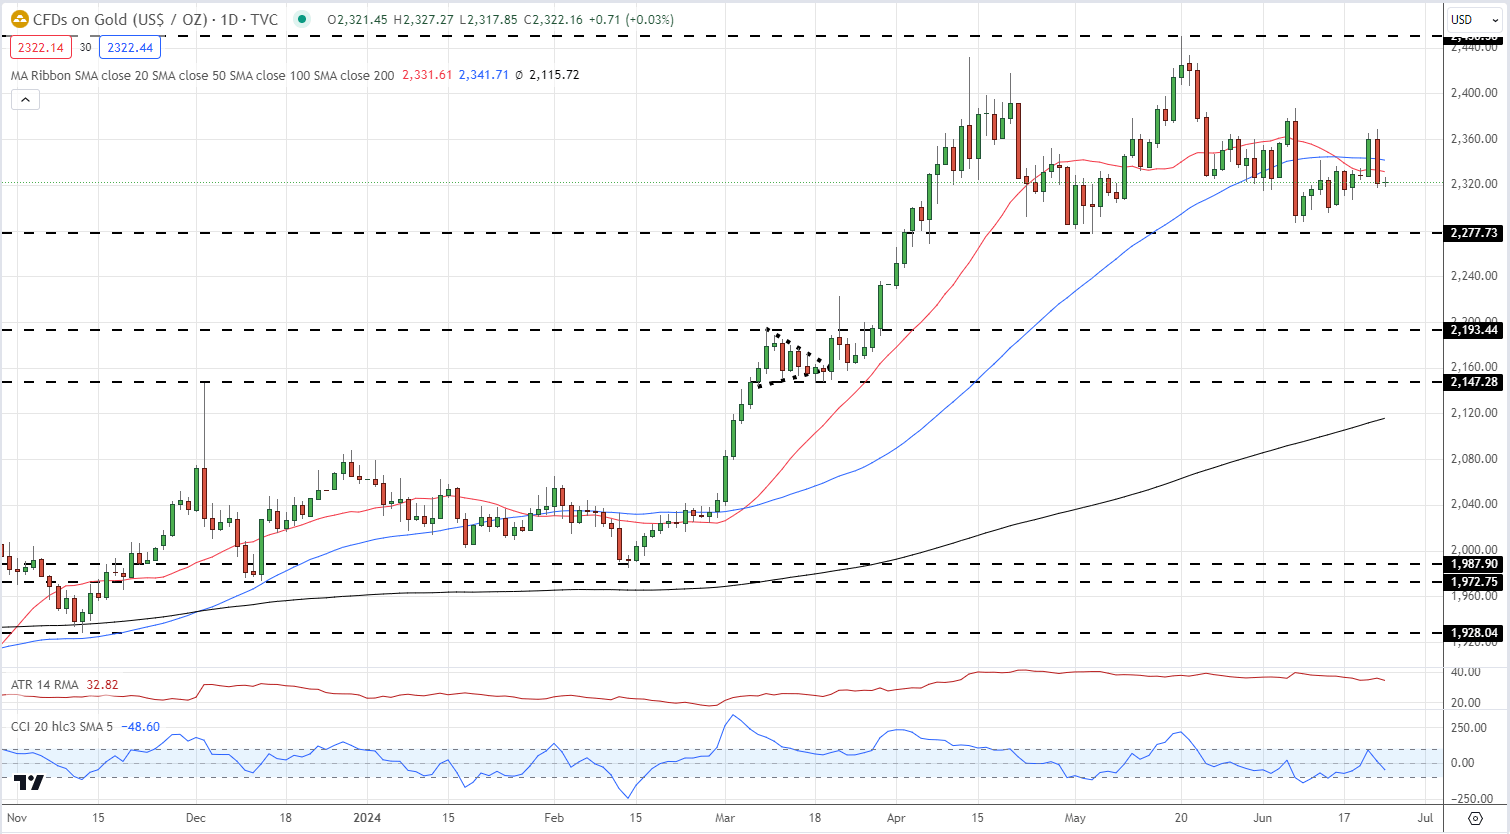
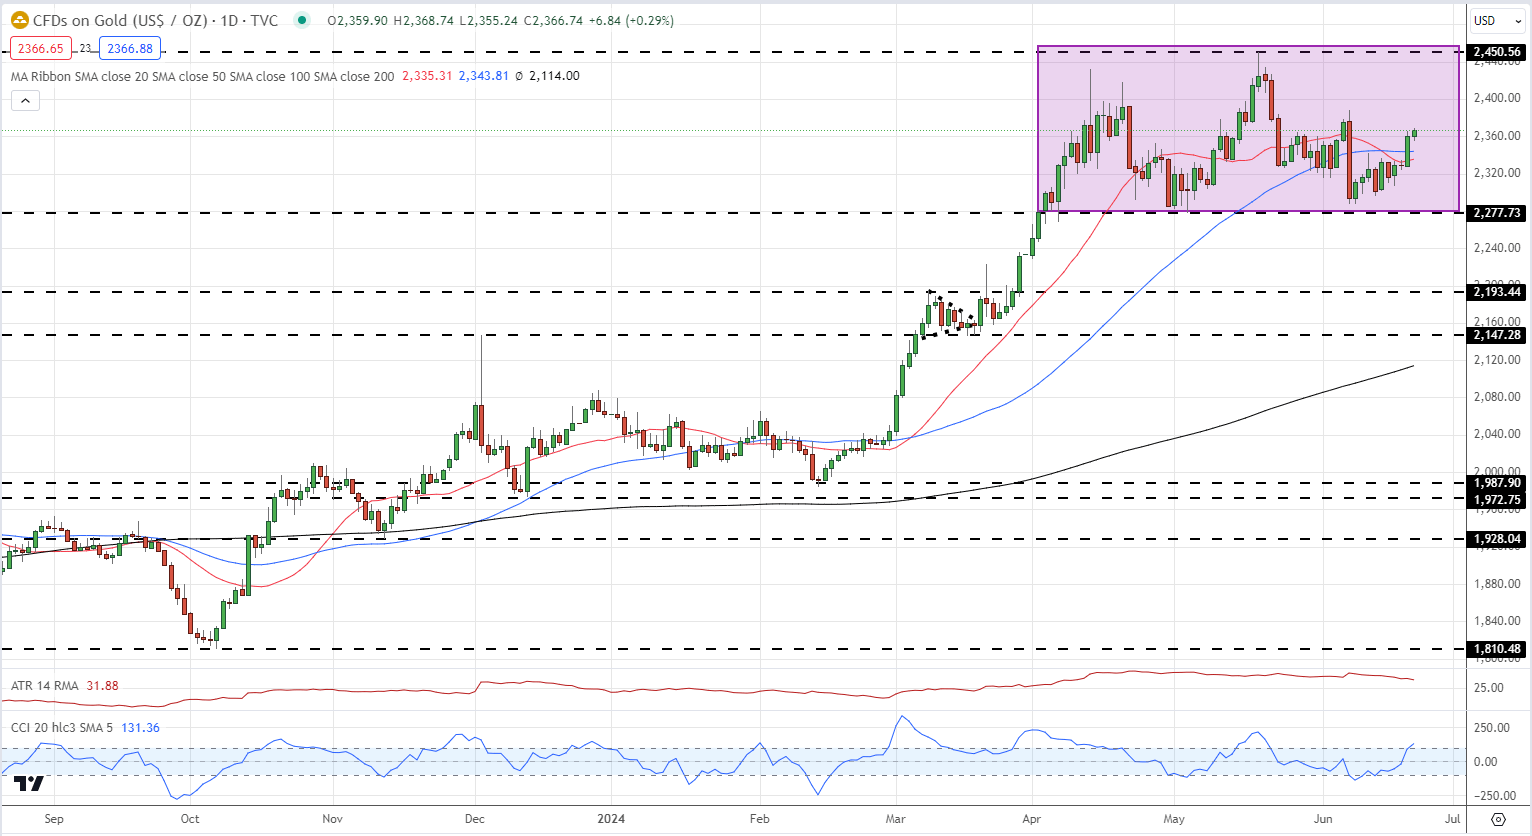
Gold remains in a multi-week sideways range, pushing back towards resistance despite a stronger US dollar. The precious metal is back above all three simple moving averages and looks set to test $2,400/oz. next week.

Gold Daily Price Chart

image3.png

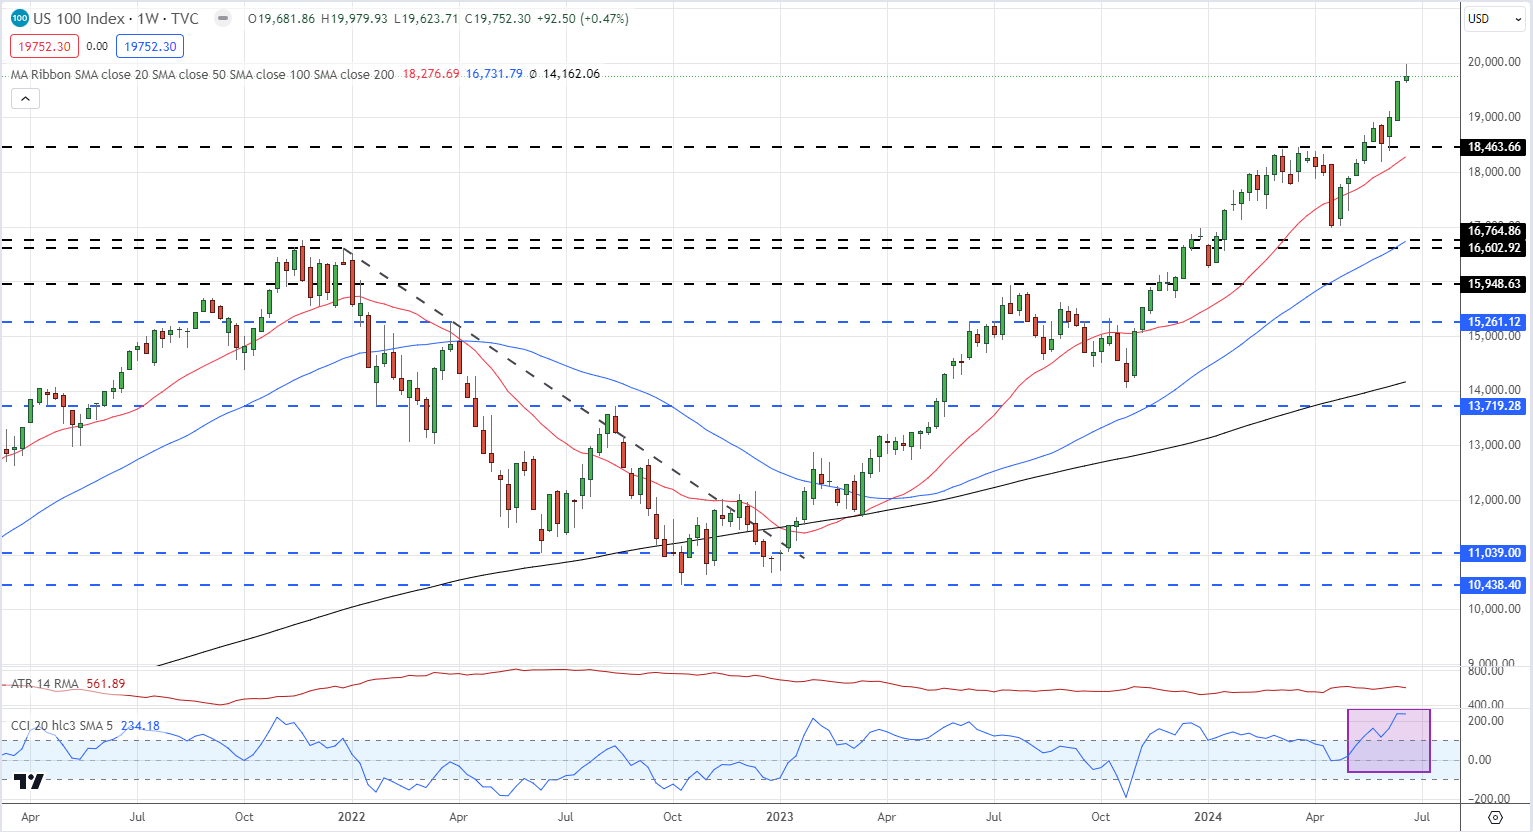
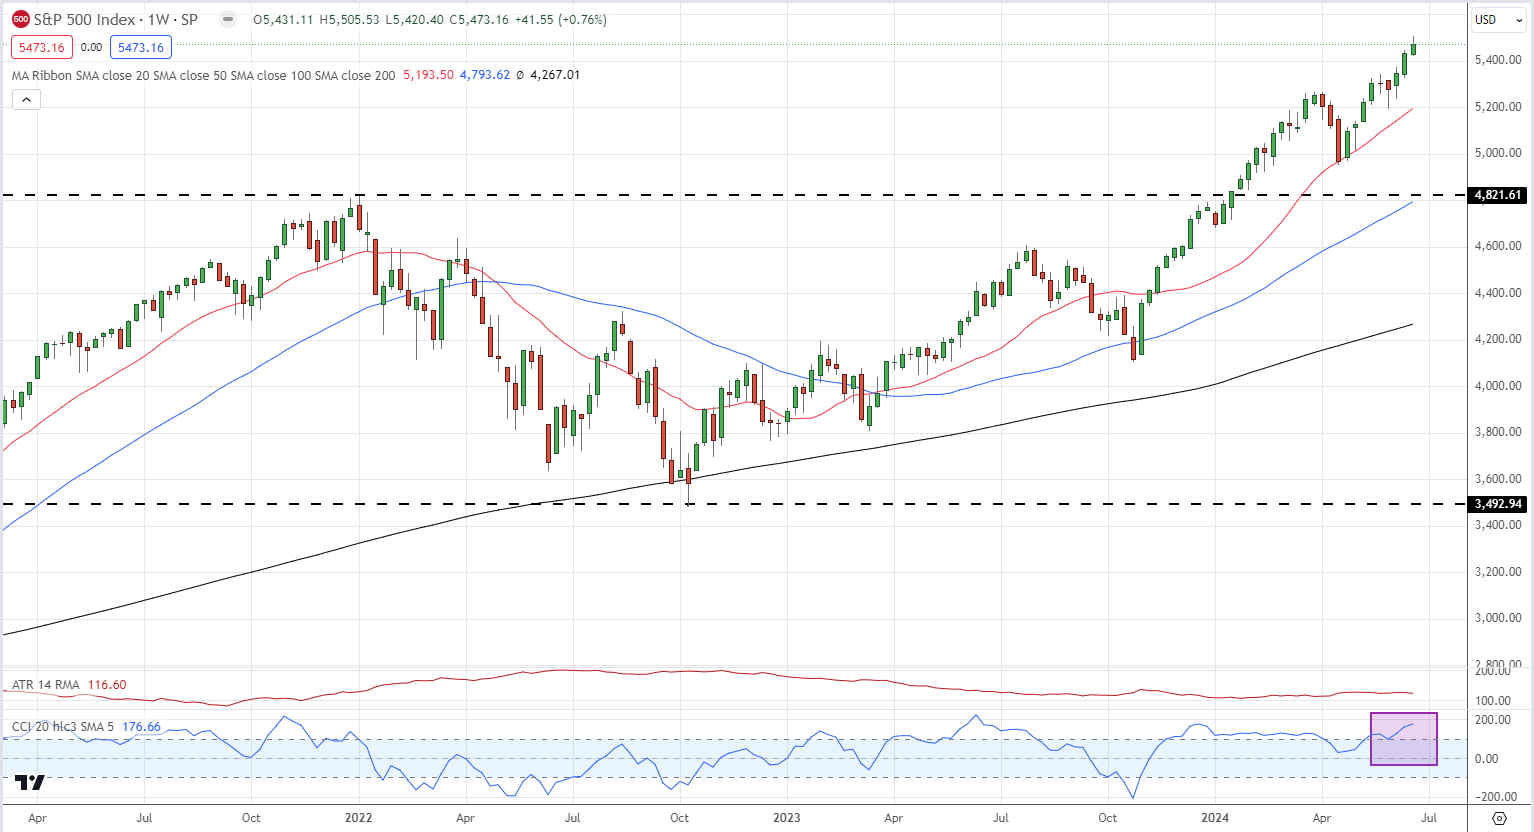
The Nasdaq 100 and S&P 500 have been posting fresh highs on a regular basis, powered by tech giants including Nvidia, Apple, and Microsoft. These three companies alone account for roughly 26% of the Nasdaq’s market capitalization and 21% of the S&P 500. Market concentration is not new but buyers should be aware of the risk involved when indices are driven by a very small number of stocks. The Nasdaq 100 and the S&P500 both look heavily overbought (CCI indicator) as the market starts to prepare for the next US earnings season.

Nasdaq 100 Daily Chart

image4.png

S&P 500 Daily Chart

image5.png

Pivot Point Strategies for Forex Traders

Pivot Point Strategies for Forex Traders

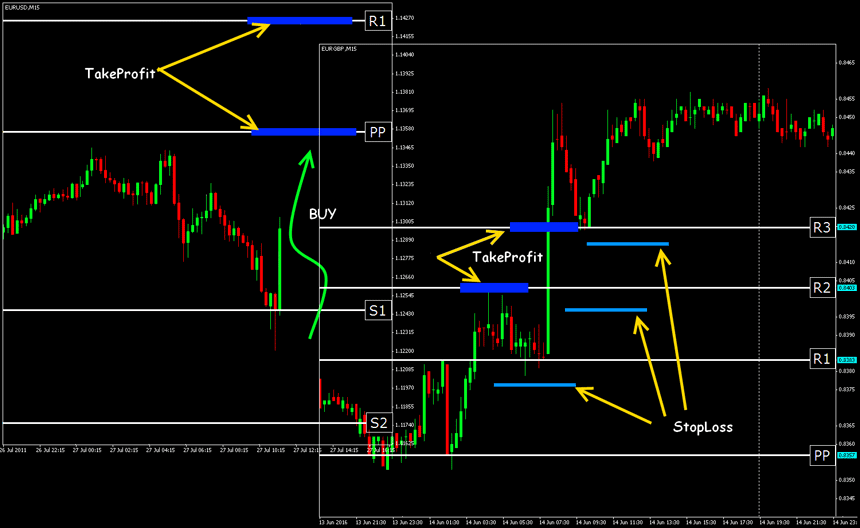
A forex pivot point strategy could very well be a trader’s best friend as far as identifying levels to develop a bias, place stops and identify potential profit targets for a trade.

Pivot points have been a go-to for traders for decades. The basis of pivot points is such that price will often move relative to a previous limit, and unless an outside force causes the price to do so, price should stop near a prior extreme. Pivot point trading strategies vary which makes it a versatile tool for forex traders.

Keep reading to learn more about:

  • Defining the pivot point
  • How to calculate pivot points
  • Using pivot points in forex trading
  • Pivot point trading strategies
  • Difference between pivot points and Fibonacci retracements

What is a pivot point?

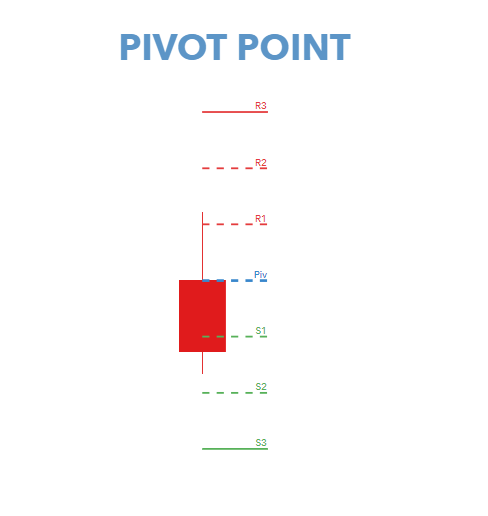
A pivot point is a is a technical indicator used by forex traders as a price level gauge for potential future market movements. The pivot point indicator is used to determine trend bias as well as levels of support and resistance, which in turn can be used as profit targets, stop losses, entries and exits.

Pivot point example:

pivot point indicator

How to calculate pivot points

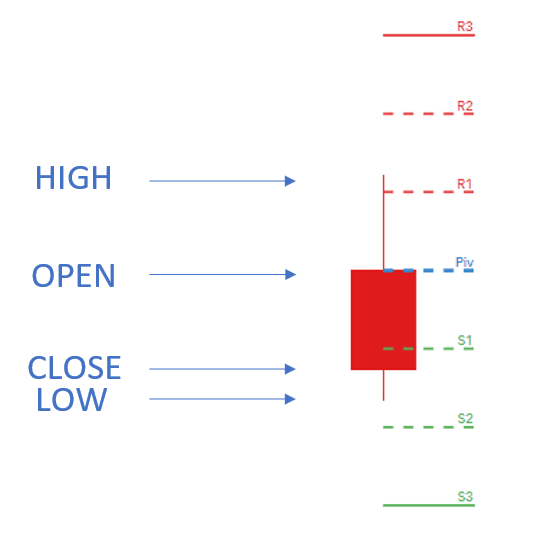
The calculation for the most basic flavor of pivot points, known as ‘floor-trader pivots,’ along with their support and resistance levels:

Pivot point formula

Pivot point (PP) = (High + Low + Close) / 3

First resistance (R1) = (2 x PP) – Low

First support (S1) = (2 x PP) – High

Second resistance (R2) = PP + (High – Low)

Second support (S2) = PP – (High – Low)

Third resistance (R3) = High + 2 (PP – Low)

Third support (S3) = Low – 2 (High – PP)

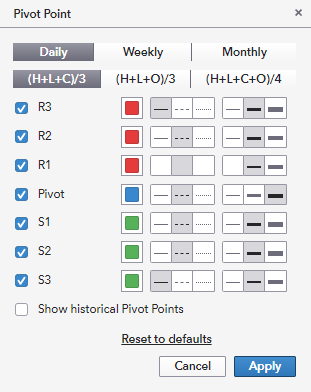
There are other ways to calculate the pivot point, which is available on most trading platforms and can be extended through different time frames. The support and resistance levels will be calculated as above. Below is an example of what is offered on the IG trading platform for daily pivots. The same calculation can be made for weekly or monthly pivots too:

pivot point calculation

How did the pivot point calculation come about?

Up until recently, computers were not available on a mass scale. Therefore, market makers and floor traders needed a way of determining whether price was ‘cheap’ or ‘expensive’ on a relative basis. From a simple mathematical calculation, pivot points were born.

Traders simply took the high, low, and closing price from the previous period and divided by three to find the ‘pivot.’ From this pivot, traders would then base their calculations for three support, and three resistance levels.

pivot point formula

How to use pivot points in forex trading

Pivot points are used by forex traders in line with traditional support and resistance trading techniques. Price tends to respect these levels as they do with support and resistance. Pivot point price levels are recurrently tested which further substantiates these levels.

Traders frequently use additional validation tools such as indicators, candlestick patterns, oscillators, fundamentals and price action to use in conjunction with the pivot to make trade decisions in the forex market.

There are a few basic guidelines to follow when trading with pivot points:

  1. Price above pivot = bullish bias
  2. Price below pivot = bearish bias
  3. Longer period pivot points are more dependable due to increased data set
  4. Support and resistance levels are extensions of the pivot which can be used as supplementary key price levels

Pivot Point trading strategies

1. Pivot point swing trading

For traders who prefer the medium to longer-term trades, swing trading with the pivot point is possible by using weekly/monthly time frames.

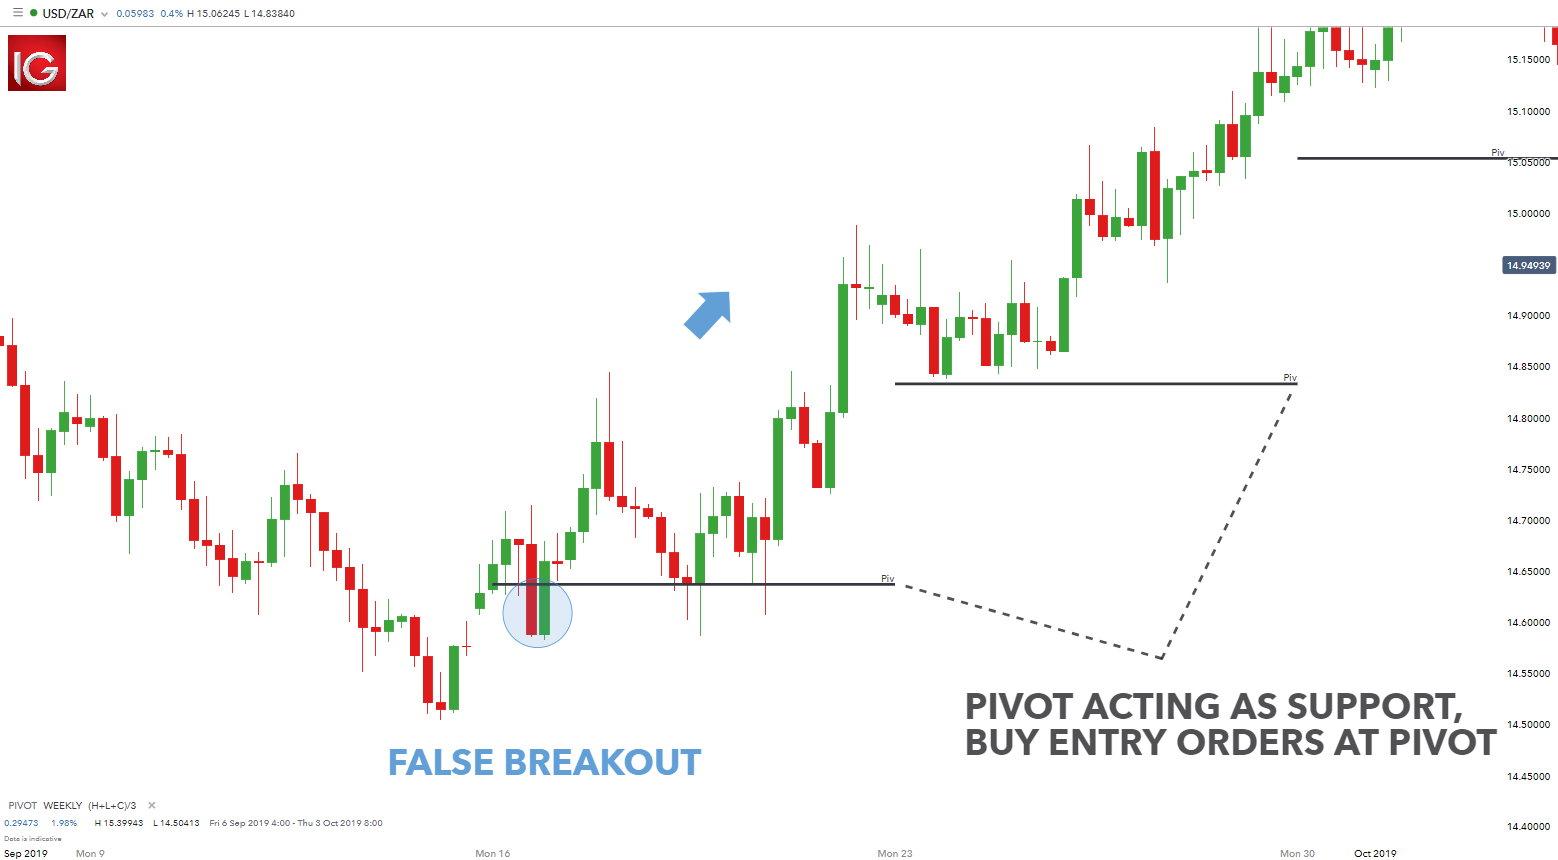
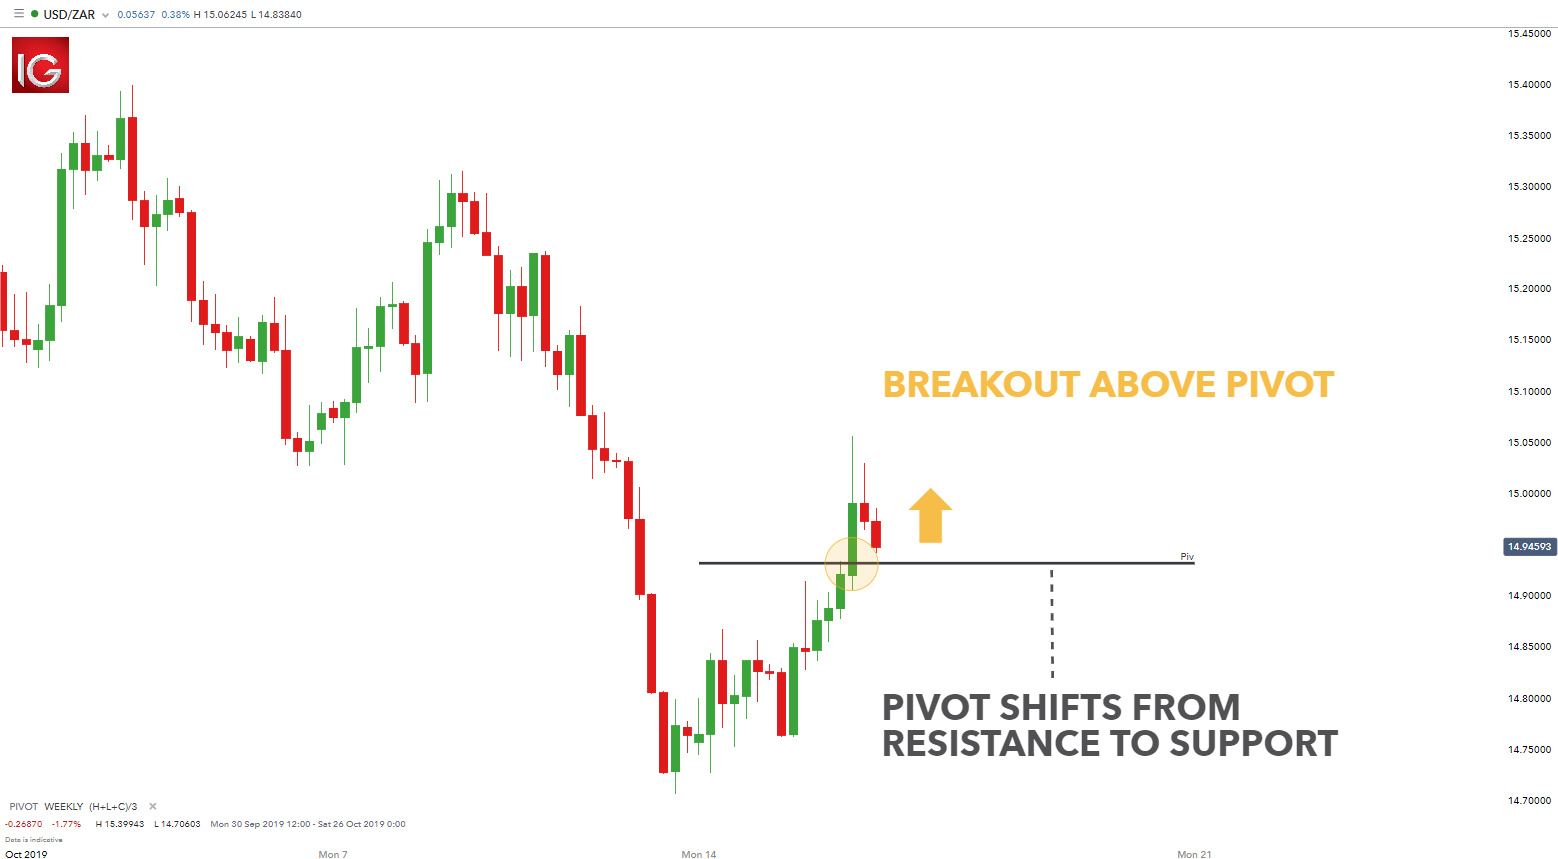
The chart below depicts a weekly chart with the addition of the pivot point only (this can be edited by changing the pivot settings on the platform). It is clear there has been a trend reversal to the upside which is evident after the price breaks through the previous pivot resistance.

Now acting as a support level, forex traders can place long entry orders at the pivot price. There is a false breakout (blue circle) but after this, there is substantial upside which could be exploited. The pivot levels won’t always contain the price, but it does offer a price level to maintain the directional bias. This would be a lengthier time horizon which would be ideal for swing traders.

USD/ZAR weekly chart

swing trading with pivot points

2. Pivot point breakout strategy

Many traders attempt to focus their trading activity to the more volatile periods in the market when the potential for large moves may be elevated.

Traders may attempt to look at breaks of each support or resistance level as an opportunity to enter a trade in a fast-moving market. This can be particularly relevant for longer-term pivot levels, with focus being paid to the weekly and monthly pivot points. The charts below will show how a trader can set up a pivot point breakout strategy using firstly the pivot alone as an indication as well as the more complex support and resistance levels.

The chart below shows a pivot point with support and resistance levels excluded. In this example, the pivot indicator is based over a weekly period which provides traders with an extended data set for a more reliable key level. The pivot is used as a key price level, which was initially respected a few candles prior to the breakout. Once the breakout occurs, traders can then look to enter into a long trade as price above the pivot signals a bullish bias.

USD/ZAR four-hour chart

pivot point breakout strategy

What’s the difference between pivot points and Fibonacci retracements/extensions?

Both pivot points and Fibonacci retracements/extensions present traders with hidden levels of support and resistance. However, there are some significant differences:

Pivot points Fibonacci retracements/extensions
Calculated as the average of the previous periods high, low and close Based on fixed ratios as a result of the Fibonacci sequence
Based on previous period price extremes Based on previous waves price extreme
Top 8 Forex Trading Strategies and their Pros and Cons

Top 8 Forex Trading Strategies and their Pros and Cons

Main talking points:

  • What is a Forex Trading Strategy?
  • Forex Strategies: A Top-level Overview
  • Price Action Trading
  • Range Trading Strategy
  • Trend Trading Strategy
  • Position Trading
  • Day Trading Strategy
  • Forex Scalping Strategy
  • Swing Trading
  • Carry Trade Strategy

What is a Forex Trading Strategy?

A forex trading strategy defines a system that a forex trader uses to determine when to buy or sell a currency pair. There are various forex strategies that traders can use including technical analysis or fundamental analysis. A good forex trading strategy allows for a trader to analyse the market and confidently execute trades with sound risk management techniques.

Forex Strategies: A Top-level Overview

Forex strategies can be divided into a distinct organisational structure which can assist traders in locating the most applicable strategy. The diagram below illustrates how each strategy falls into the overall structure and the relationship between the forex strategies.
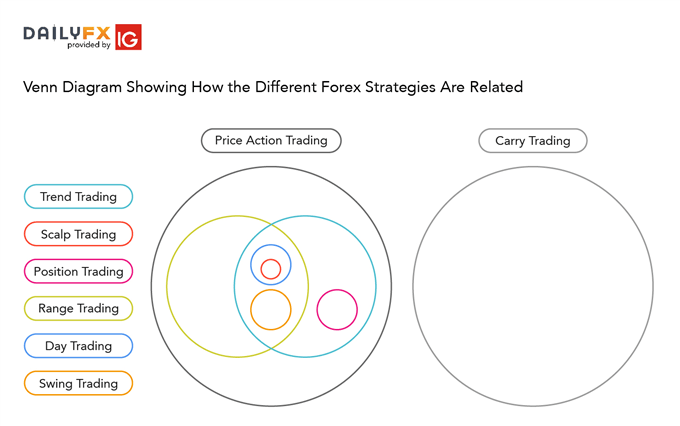
relationship between different forex strategies

Forex Trading Strategies That Work

Forex trading requires putting together multiple factors to formulate a trading strategy that works for you. There are countless strategies that can be followed, however, understanding and being comfortable with the strategy is essential. Every trader has unique goals and resources, which must be taken into consideration when selecting the suitable strategy.

There are three criteria traders can use to compare different strategies on their suitability:

  1. Time resource required
  2. Frequency of trading opportunities
  3. Typical distance to target

To easily compare the forex strategies on the three criteria, we’ve laid them out in a bubble chart. On the vertical axis is ‘Risk-Reward Ratio’ with strategies at the top of the graph having higher reward for the risk taken on each trade. Position trading typically is the strategy with the highest risk reward ratio. On the horizontal axis is time investment that represents how much time is required to actively monitor the trades. The strategy that demands the most in terms of your time resource is scalp trading due to the high frequency of trades being placed on a regular basis.
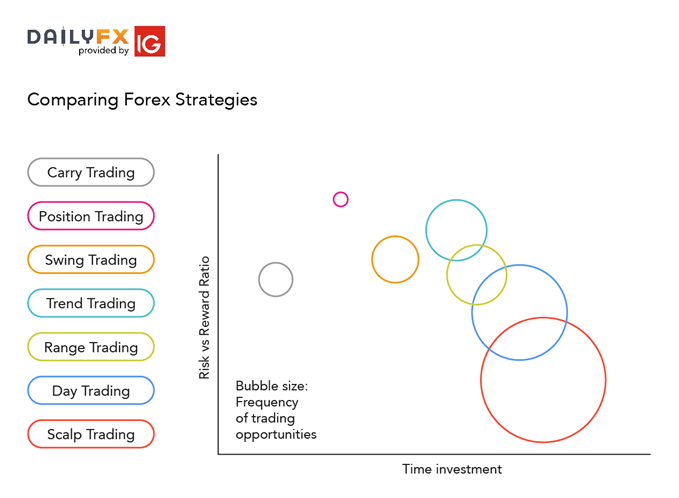
comparing forex strategies

1. Price Action Trading

Price action trading involves the study of historical prices to formulate technical trading strategies. Price action can be used as a stand-alone technique or in conjunction with an indicator. Fundamentals are seldom used; however, it is not unheard of to incorporate economic events as a substantiating factor. There are several other strategies that fall within the price action bracket as outlined above.

Length of trade:

Price action trading can be utilised over varying time periods (long, medium and short-term). The ability to use multiple time frames for analysis makes price action trading valued by many traders.

Entry/Exit points:

There are many methods to determine support/resistance levels which are generally used as entry/exit points:

Within price action, there is range, trend, day, scalping, swing and position trading. These strategies adhere to different forms of trading requirements which will be outlined in detail below. The examples show varying techniques to trade these strategies to show just how diverse trading can be, along with a variety of bespoke options for traders to choose from.

2. Range Trading Strategy

Range trading includes identifying support and resistance points whereby traders will place trades around these key levels. This strategy works well in market without significant volatility and no discernible trend. Technical analysis is the primary tool used with this strategy.

Length of trade:

There is no set length per trade as range bound strategies can work for any time frame. Managing risk is an integral part of this method as breakouts can occur. Consequently, a range trader would like to close any current range bound positions.

Entry/Exit points:

Oscillators are most commonly used as timing tools. Relative Strength Index (RSI), Commodity Channel Index (CCI) and stochastics are a few of the more popular oscillators. Price action is sometimes used in conjunction with oscillators to further validate range bound signals or breakouts.

Example 1: USD/JPY Range Trading

range trading USD/JPY

USD/JPY has been exhibiting a prolonged range bound price level over the past few years. The chart above illustrates a clear support and resistance band which traders use as entry/exit points. The RSI oscillator demonstrates timing of entry/exit points as highlighted by the shaded blue and red boxes – blue: overbought and red: oversold.

Range trading can result in fruitful risk-reward ratios however, this comes along with lengthy time investment per trade. Use the pros and cons below to align your goals as a trader and how much resources you have.

Pros:

  • Substantial number of trading opportunities
  • Favourable risk-to reward ratio

Cons:

  • Requires lengthy periods of time investment
  • Entails strong appreciation of technical analysis

3. Trend Trading Strategy

Trend trading is a simple forex strategy used by many traders of all experience levels. Trend trading attempts to yield positive returns by exploiting a markets directional momentum.

Length of trade:

Trend trading generally takes place over the medium to long-term time horizon as trends themselves fluctuate in length. As with price action, multiple time frame analysis can be adopted in trend trading.

Entry/Exit points:

Entry points are usually designated by an oscillator (RSI, CCI etc) and exit points are calculated based on a positive risk-reward ratio. Using stop level distances, traders can either equal that distance or exceed it to maintain a positive risk-reward ratio e.g. If the stop level was placed 50 pips away, the take profit level wold be set at 50 pips or more away from the entry point.

Example 2: Identifying the Trend

trend trading EUR/USD

In the simple example above, EUR/USD exhibits an upward trend validated by higher highs and higher lows. The opposite would be true for a downward trend.

EUR/USD Trading the Trend

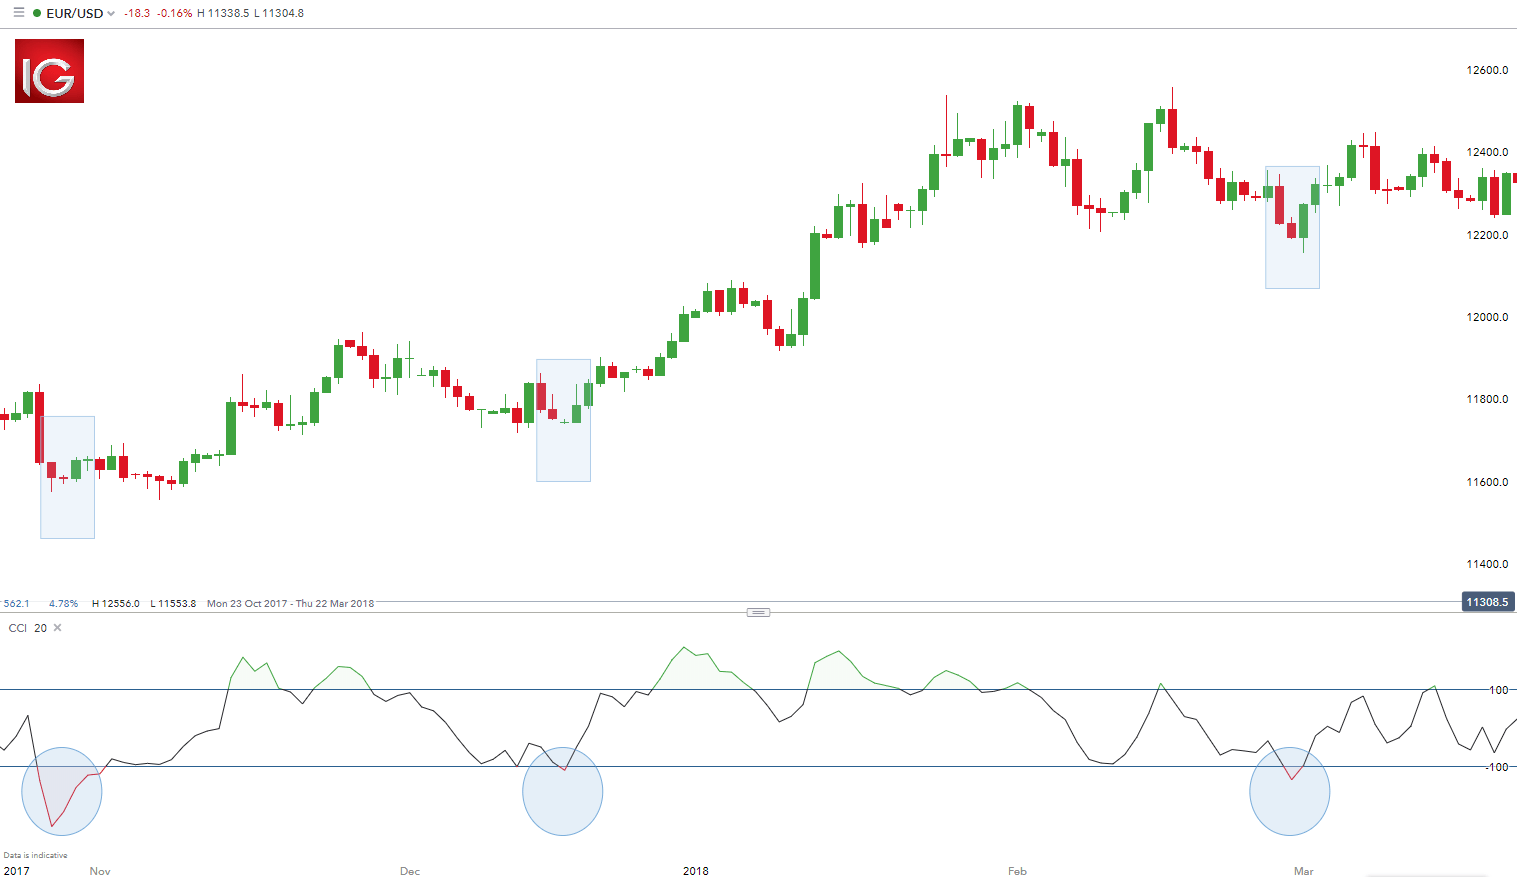
trend trading EUR/USD with CCI

When you see a strong trend in the market, trade it in the direction of the trend. For example, the strong uptrend in EUR/USD above.

Using the (CCI) as a tool to time entries, notice how each time CCI dipped below -100 (highlighted in blue), prices responded with a rally. Not all trades will work out this way, but because the trend is being followed, each dip caused more buyers to come into the market and push prices higher. In conclusion, identifying a strong trend is important for a fruitful trend trading strategy.

Trend trading can be reasonably labour intensive with many variables to consider. The list of pros and cons may assist you in identifying if trend trading is for you.

Pros:

  • Substantial number of trading opportunities
  • Favourable risk-to reward ratio

Cons:

  • Requires lengthy periods of time investment
  • Entails strong appreciation of technical analysis

4. Position Trading

Position trading is a long-term strategy primarily focused on fundamental factors however, technical methods can be used such as Elliot Wave Theory. Smaller more minor market fluctuations are not considered in this strategy as they do not affect the broader market picture. This strategy can be employed on all markets from stocks to forex.

Length of trade:

As mentioned above, position trades have a long-term outlook (weeks, months or even years!) reserved for the more persevering trader. Understanding how economic factors affect markets or thorough technical predispositions, is essential in forecasting trade ideas.

Entry/Exit points:

Key levels on longer time frame charts (weekly/monthly) hold valuable information for position traders due to the comprehensive view of the market. Entry and exit points can be judged using technical analysis as per the other strategies.

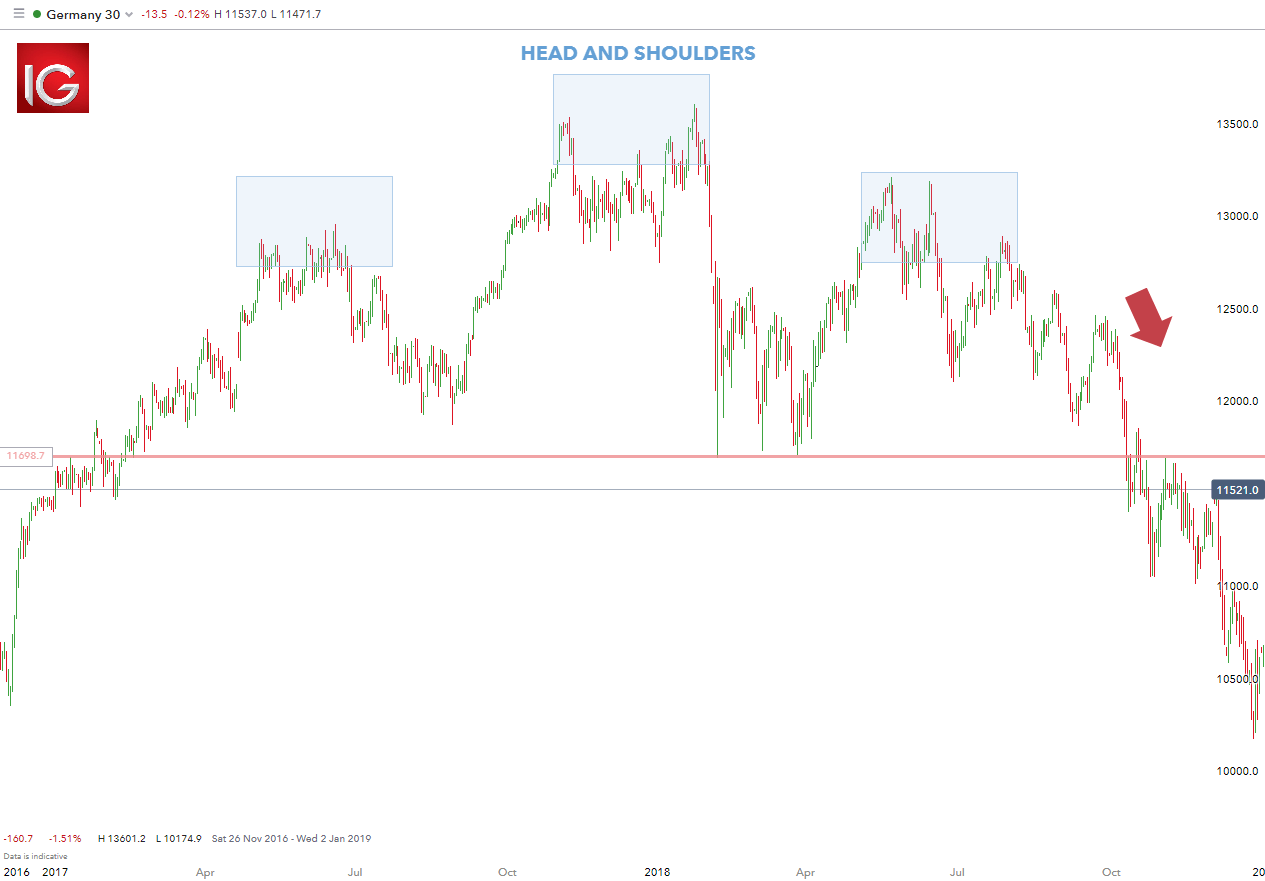
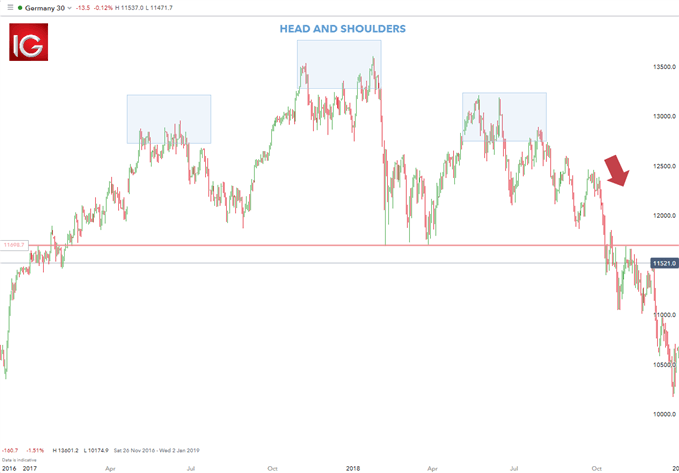
Example 3: Germany 30 (DAX) Position Trading
position trading DAX

The Germany 30 chart above depicts an approximate two year head and shoulders pattern, which aligns with a probable fall below the neckline (horizontal red line) subsequent to the right-hand shoulder. In this selected example, the downward fall of the Germany 30 played out as planned technically as well as fundamentally. Towards the end of 2018, Germany went through a technical recession along with the US/China trade war hurting the automotive industry. Brexit negotiations did not help matters as the possibility of the UK leaving the EU would most likely negatively impact the German economy as well. In this case, understanding technical patterns as well as having strong fundamental foundations allowed for combining technical and fundamental analysis to structure a strong trade idea.

List of Pros and Cons based on your goals as a trader and how much resources you have.

Pros:

  • Requires minimal time investment
  • Highly positive risk-to reward ratio

Cons:

  • Very few trading opportunities
  • Entails strong appreciation of technical and fundamental analysis

5. Day Trading Strategy

Day trading is a strategy designed to trade financial instruments within the same trading day. That is, all positions are closed before market close. This can be a single trade or multiple trades throughout the day.

Length of trade:

Trade times range from very short-term (matter of minutes) or short-term (hours), as long as the trade is opened and closed within the trading day.

Entry/Exit points:

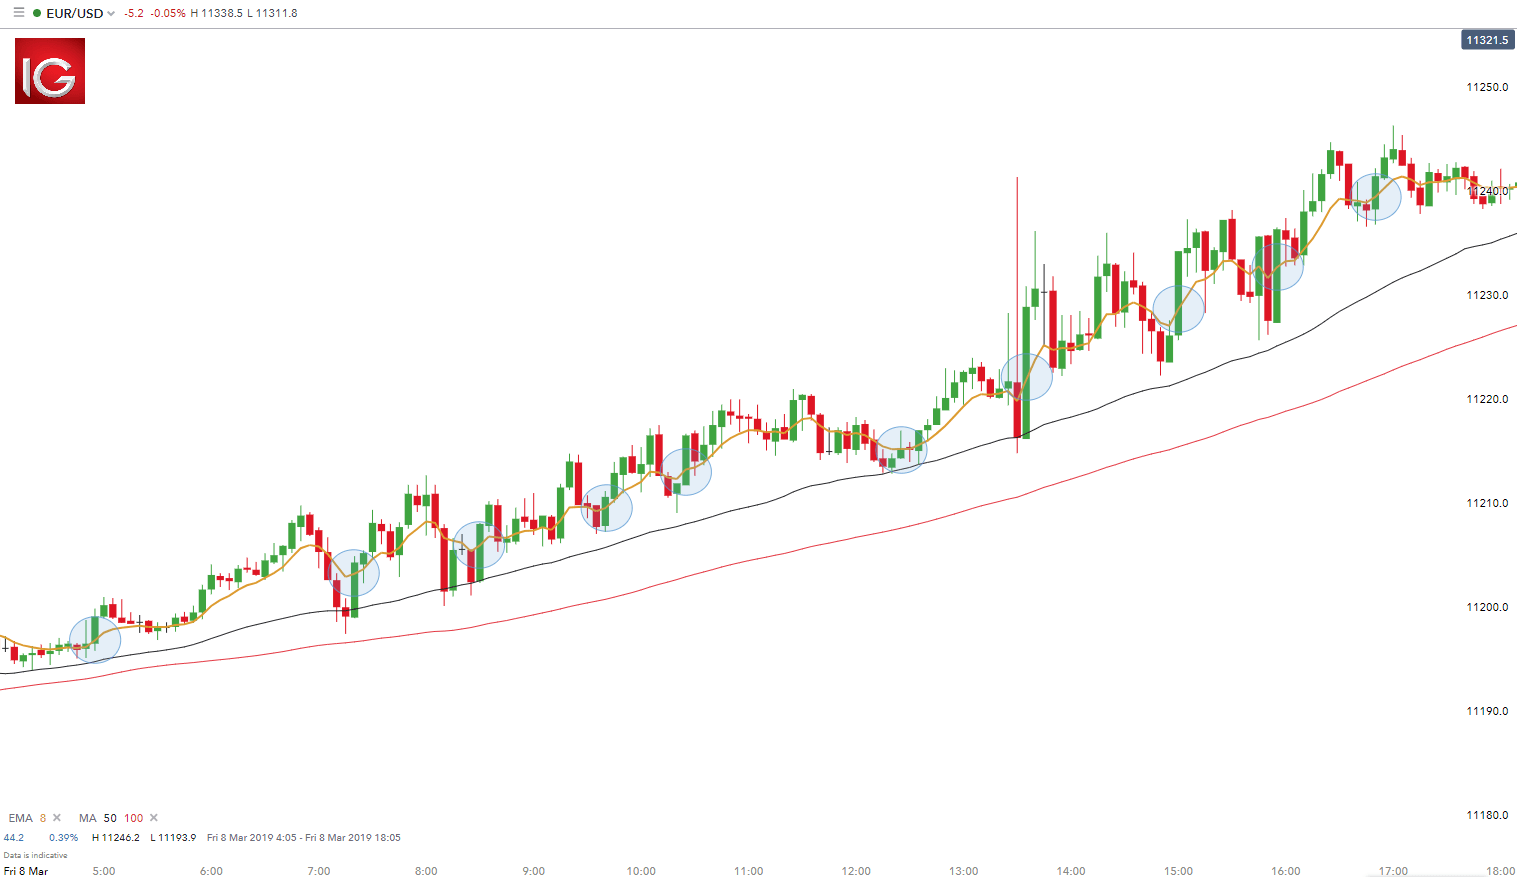
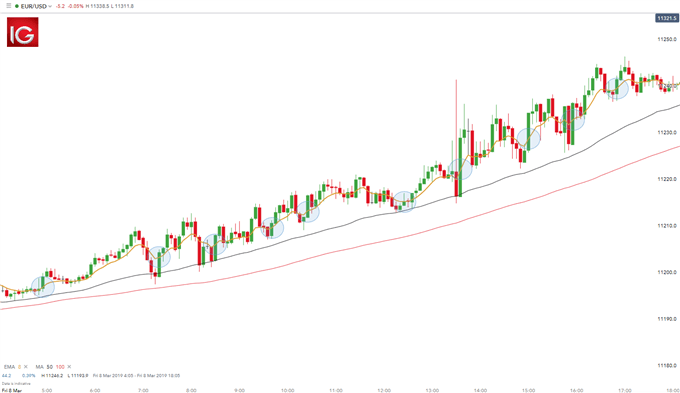
Traders in the example below will look to enter positions at the when the price breaks through the 8 period EMA in the direction of the trend (blue circle) and exit using a 1:1 risk-reward ratio.

Example 4: EUR/USD Day Trading
day trading EUR/USD

The chart above shows a representative day trading setup using moving averages to identify the trend which is long in this case as the price is above the MA lines (red and black). Entry positions are highlighted in blue with stop levels placed at the previous price break. Take profit levels will equate to the stop distance in the direction of the trend.

The pros and cons listed below should be considered before pursuing this strategy. Day trading involves much time and effort for little reward, as seen from the EUR/USD example above.

Pros:

  • Substantial number of trading opportunities
  • Median risk-to reward ratio

Cons:

  • Requires lengthy periods of time investment
  • Entails strong appreciation of technical analysis

6. Forex Scalping Strategy

Scalping in forex is a common term used to describe the process of taking small profits on a frequent basis. This is achieved by opening and closing multiple positions throughout the day. This can be done manually or via an algorithm which uses predefined guidelines as to when/where to enter and exit positions. The most liquid forex pairs are preferred as spreads are generally tighter, making the short-term nature of the strategy fitting.

Length of trade:

Scalping entails short-term trades with minimal return, usually operating on smaller time frame charts (30 min – 1min).

Entry/Exit points:

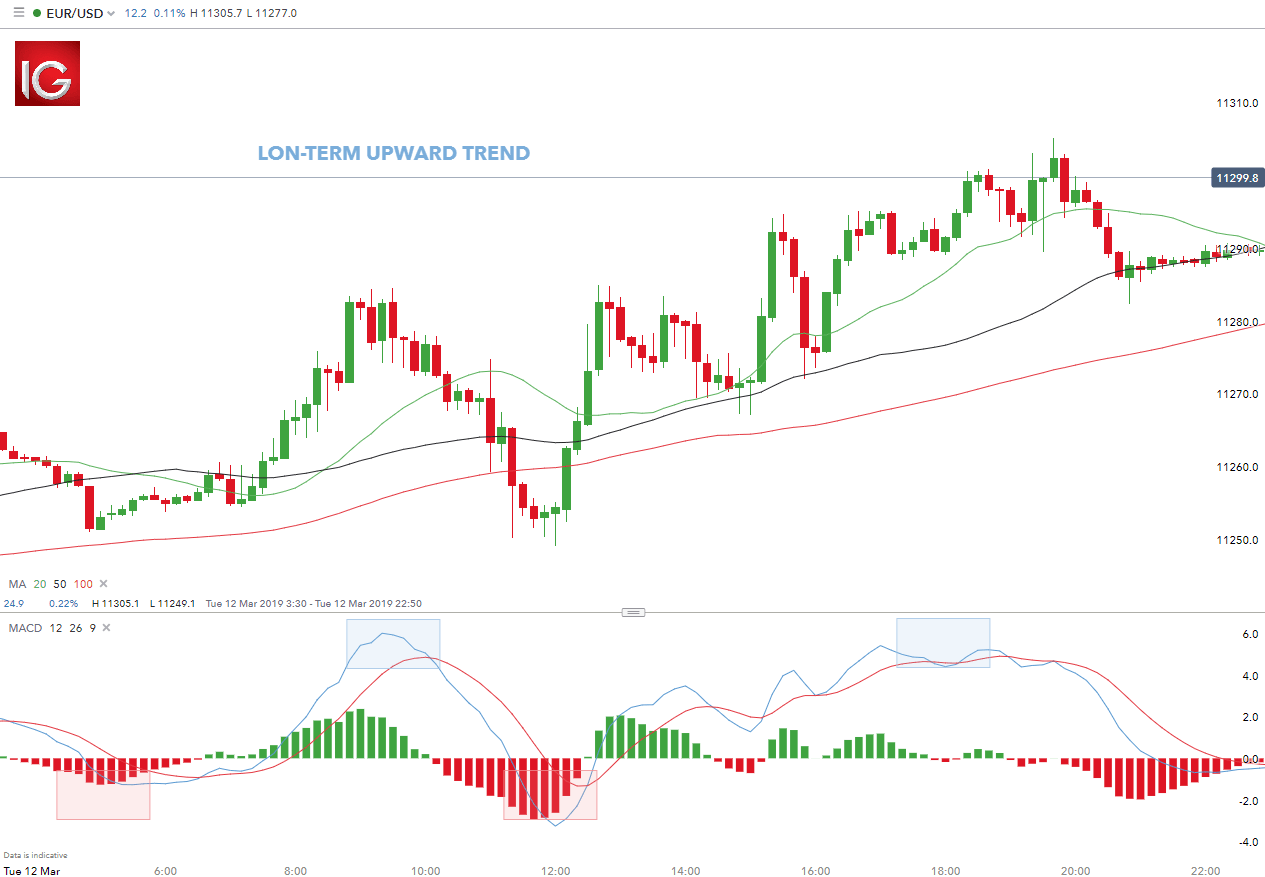
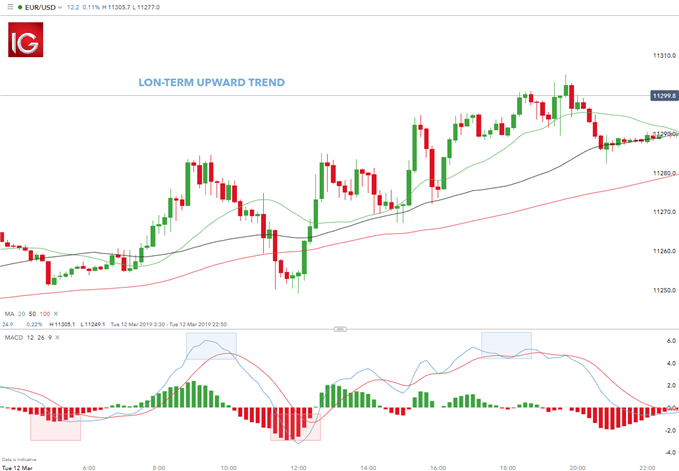
Like most technical strategies, identifying the trend is step 1. Many scalpers use indicators such as the moving average to verify the trend. Using these key levels of the trend on longer time frames allows the trader to see the bigger picture. These levels will create support and resistance bands. Scalping within this band can then be attempted on smaller time frames using oscillators such as the RSI. Stops are placed a few pips away to avoid large movements against the trade. The MACD indicator is another useful tool that can be exercised by the trader to enter/exit trades.

Example 5: EUR/USD Scalping Strategy
scalp trading EUR/USD

The EUR/USD 10 minute above shows a typical example of a scalping strategy. The long-term trend is confirmed by the moving average (price above 200 MA). The smaller time frame is then used to target entry/exit points. Timing of entry points are featured by the red rectangle in the bias of the trader (long). Traders can also close long positions using the MACD when the MACD (blue line) crosses over the signal line (red line) highlighted by the blue rectangles.

Traders use the same theory to set up their algorithms however, without the manual execution of the trader.

With this practical scalp trading example above, use the list of pros and cons below to select an appropriate trading strategy that best suits you.

Pros:

  • Greatest number of trading opportunities from all forex strategies

Cons:

  • Requires lengthy periods of time investment
  • Entails strong appreciation of technical analysis
  • Lowest risk-to reward ratio

7. Swing Trading

Swing trading is a speculative strategy whereby traders look to take advantage of rang bound as well as trending markets. By picking ‘tops’ and ‘bottoms’, traders can enter long and short positions accordingly.

Length of trade:

Swing trades are considered medium-term as positions are generally held anywhere between a few hours to a few days. Longer-term trends are favoured as traders can capitalise on the trend at multiple points along the trend.

Entry/Exit points:

Much like the range bound strategy, oscillators and indicators can be used to select optimal entry/exit positions and times. The only difference being that swing trading applies to both trending and range bound markets.

Example 6: GBP/USD Swing Trading Strategy
swing trading GBP/USD

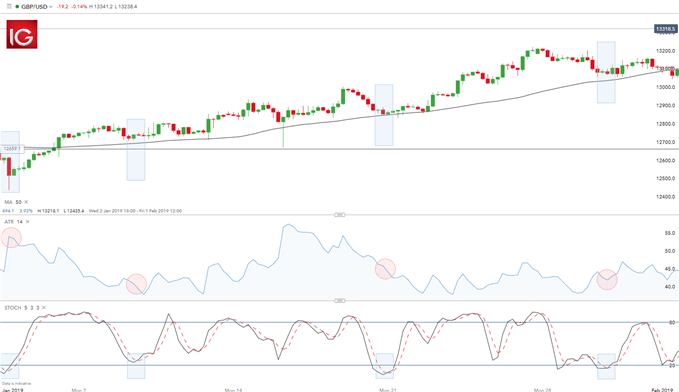
A combination of the stochastic oscillator, ATR indicator and the moving average was used in the example above to illustrate a typical swing trading strategy. The upward trend was initially identified using the 50-day moving average (price above MA line). In the case of an uptrend, traders will look to enter long positions with the old adage of ‘buy low, sell high’.

Stochastics are then used to identify entry points by looking for oversold signals highlighted by the blue rectangles on the stochastic and chart. Risk management is the final step whereby the ATR gives an indication of stop levels. The ATR figure is highlighted by the red circles. This figure represents the approximate number of pips away the stop level should be set. For example, if the ATR reads 41.8 (reflected in the last ATR reading) the trader would look to place the stop 41.8 pips away from entry. At DailyFX, we recommend trading with a positive risk-reward ratio at a minimum of 1:2. This would mean setting a take profit level (limit) at least 83.6 (41.8 x 2) pips away or further.

After seeing an example of swing trading in action, consider the following list of pros and cons to determine if this strategy would suit your trading style.

Pros:

  • Substantial number of trading opportunities
  • Median risk-to reward ratio

Cons:

  • Entails strong appreciation of technical analysis
  • Still requires extensive time investment

8. Carry Trade Strategy

Carry trades include borrowing one currency at lower rate, followed by investing in another currency at a higher yielding rate. This will ultimately result in a positive carry of the trade. This strategy is primarily used in the forex market.

Length of trade:

Carry trades are dependent on interest rate fluctuations between the associated currencies therefore, length of trade supports the medium to long-term (weeks, months and possibly years).

Entry/Exit points:

Strong trending markets work best for carry trades as the strategy involves a lengthier time horizon. Confirmation of the trend should be the first step prior to placing the trade (higher highs and higher lows and vice versa) – refer to Example 1 above. There are two aspects to a carry trade namely, exchange rate risk and interest rate risk. Accordingly, the best time to open the positions is at the start of a trend to capitalise fully on the exchange rate fluctuation. Regarding the interest rate component, this will remain the same regardless of the trend as the trader will still receive the interest rate differential if the first named currency has a higher interest rate against the second named currency e.g. AUD/JPY.

Could carry trading work for you? Consider the following pros and cons and see if it is a forex strategy that suits your trading style.

Pros:

  • Little time investment needed
  • Median risk-to reward ratio

Cons:

  • Entails strong appreciation of forex market
  • Infrequent trading opportunities

Forex Strategies: A Summary

This article outlines 8 types of forex strategies with practical trading examples. When considering a trading strategy to pursue, it can be useful to compare how much time investment is required behind the monitor, the risk-reward ratio and regularity of total trading opportunities. Each trading strategy will appeal to different traders depending on personal attributes. Matching trading personality with the appropriate strategy will ultimately allow traders to take the first step in the right direction.

Enhance your forex trading

Japanese CPI Data Mixed as Yen Continues Steady Decline

Japanese CPI Data Mixed as Yen Continues Steady Decline

Japanese CPI Mostly Positive for the Bank of Japan

12-month Japanese CPI for May came in above the prior 2.5%, at 2.8% while core CPI (CPI excluding fresh food) narrowly missed expectations of 2.6% to print at 2.5%. The measure that excludes fresh food an energy, known as ‘core core inflation’, saw a decline from 2.4% to 2.1%.

The Bank of Japan (BoJ) still requires convincing to hike rates again this year after calling for a virtuous relationship between inflation and wages. Demand-driven inflation as opposed to supply-led price pressures is also a key differentiator when it comes to BoJ thinking around inflation. The drop in ‘core core’ suggests non-volatile measures of inflation are losing momentum at a time when the local economy appears to be contracting (Q1 GDP measured -0.5% on a quarter-on-quarter basis). Thus the BoJ will require more data before gaining the necessary confidence to hike the interest rate again.

Learn how to prepare for high impact economic data or events with this easy to implement approach:

The Yen Continues its Steady Decline to Levels Last Seen Before April’s FX Intervention

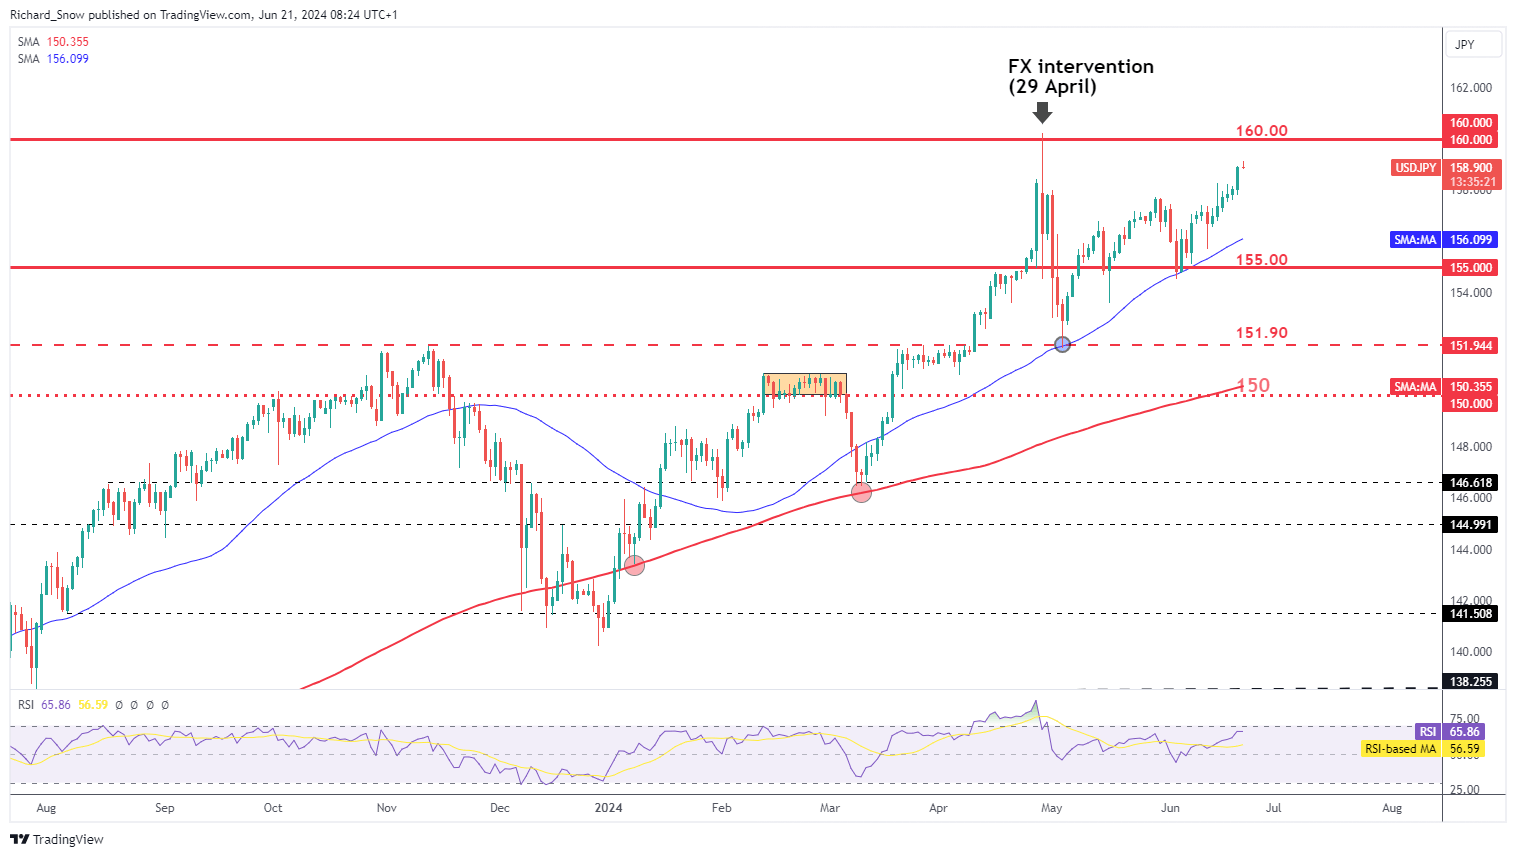
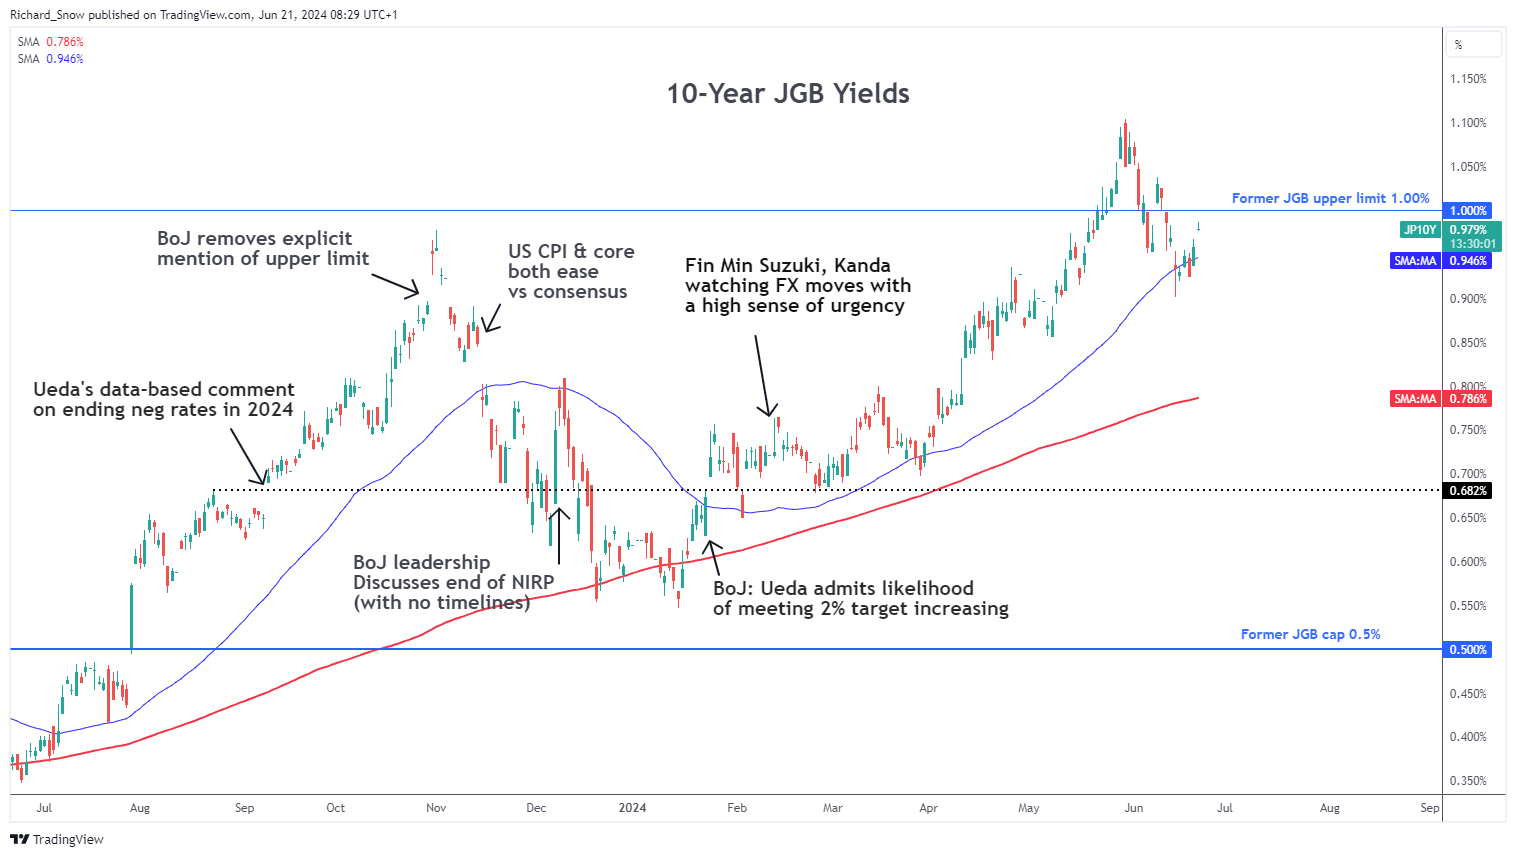
USD/JPY appears to be on a set course towards 160 as the yen continues to weaken. Bond yields have not exactly helped the yen but rising yields over the last two trading sessions now sees the 10-year Japanese government bond yield heading back towards 1%.
While the dollar, measured by the US dollar basket has fluctuated up and down, USD/JPY has been a one-way trade. The threat of intervention is back on the table after Fiji reported that Japan’s top currency official stated there is no limit for reserves in currency intervention and also repeated that officials are monitoring the situation closely.

USD/JPY Daily Chart

The 10-year JGB appears to be heading back towards the 1% mark – but this has done very little, if anything, to halt yen declines.

10-year Japanese Government Bond Yield