US Oil, Gold, DAX 40 Sentiment Updates

US Oil, Gold, DAX 40 Sentiment Updates

US Crude Oil

US Crude Oil sentiment analysis reveals a predominantly bullish retail trader positioning, with 56.14% net-long. The long-to-short ratio stands at 1.28:1. Technical indicators suggest a potential bearish reversal, as increased long positions often precede price declines. Recent changes show a slight decrease in net-long positions day-over-day but an increase week-over-week. This mixed signal strengthens the bearish bias from a contrarian viewpoint.

image1.png

Gold

Gold sentiment analysis reveals a slight bullish bias in retail trader positioning, with 54.39% net-long. The long-to-short ratio stands at 1.19:1. Technical indicators suggest a potential bullish reversal, despite the overall net-long positioning. Recent changes show a significant decrease in net-long positions both day-over-day (-4.97%) and week-over-week (-18.36%), while net-short positions have increased substantially (7.48% daily, 27.08% weekly). This rapid shift in positioning strengthens the case for a possible upward price movement, contrary to the typical contrarian view.

image2.png

DAX 40

Retail trader data for Germany 40 shows a significant imbalance, with 29% of traders holding long positions and 71% holding short positions. This creates a short-to-long ratio of 2.45 to 1. Historically, such extreme positioning often precedes price movements in the opposite direction, suggesting a potential upside for Germany 40. The recent trend of increasing short positions and decreasing long positions further strengthens this contrarian bullish outlook.

image3.png

British Pound (GBP), FTSE 100 Steady as the UK Goes to the Polls

British Pound (GBP), FTSE 100 Steady as the UK Goes to the Polls

Labour leader Sir Keir Starmer is set to be handed the keys to No.10 tomorrow with his party forecast to win the general election by a substantial margin. The latest YouGov MRP poll forecasts Labour winning 431 seats, the Conservative Party 102 seats, with the Liberal Democrats in third place with 72 seats. According to YouGov there are 89 seats where the two top parties are within 5% of each other,

‘What does this mean in practice? Our range for the number of Conservative seats is between 78 and 129 seats, while our range for the Liberal Democrats is between 57 and 87. That means at one end of the realistic possibilities is that we wake up on Friday to find Ed Davey (Liberal Democrats) is Leader of the Opposition. At the other end of possibilities is that the Tories are in a secure second place. The most likely outcome is the Conservatives just over 100 seats, the Liberal Democrats on around 72.’

The polling stations will close tonight at 22:00 UK and counting begins immediately. The BBC estimates that the first seats will be declared around 23:00 UK with the vast majority of seats declared by 06:00 UK on Friday.

Sterling remains rangebound going into the election and will remain that way until the result is known. GBP/USD is trading on either side of 1.2750, boosted in part by a weaker US dollar. Wednesday’s US ISM report showed the economy contracting for the second time in the last three months, while the Business Activity Index slumped to 49.6 from 61.2, the first month of contraction since May 2020.

image1.pngimage2.png

US markets are closed today for Independence Day, while tomorrow sees the latest US Jobs Report released at 13:30 UK.

GBP/USD Daily Price Chart

image3.png

The FTSE 100 is trading marginally higher in early turnover after both the Nasdaq 100 and the S&P posted fresh record highs overnight.

FTSE 100 Daily Price Chart

image4.png

Retail trader data shows 44.15% of traders are net-long with the ratio of traders short to long at 1.26 to 1.The number of traders net-long is 15.38% lower than yesterday and 0.96% lower from last week, while the number of traders net-short is 12.02% higher than yesterday and 4.80% lower from last week.

We typically take a contrarian view to crowd sentiment, and the fact traders are net-short suggests FTSE 100 prices may continue to rise. Positioning is more net-short than yesterday but less net-short from last week. The combination of current sentiment and recent changes gives us a further mixed FTSE 100 trading bias.

Top 10 Trading Myths: Guest Commentary

Top 10 Trading Myths: Guest Commentary

Debunking top trading myths with Dr. Gary Dayton from Trading Psychology Edge

Knowing the difference between common trading myths and the reality is essential to long-term success. In this article, guest editor, Dr Gary Dayton explores the top 10 trading myths to be aware of. Notably, these myths are closely linked to trading psychology, which goes hand in hand with a successful trading career.

1. People are born traders. While it is true that certain personal characteristics make it easier to trade, no one is born a trader. One of the main themes of the Market Wizards books written by Jack Schwager is that almost none of the market wizards was successful from the start. They all worked hard at it.

2. You have to have a high IQ to trade. Just not true. In some ways, an above average IQ may be a hindrance. Trading is a human performance activity where strong intellectual abilities are unnecessary.

3. Top traders are successful because they have the “right trading personality.” There is no such thing as the “right trading personality.” Researches have been unable to find a strong correlation between personality type and trading success. It is important, however, to understand your personal characteristics and how they may help and hinder your trading. Read more about types of trading styles for different personalities.

4. Trading is easy. It sure looks that way, doesn’t it? Just draw a few lines on the chart, watch your indicators, and follow the price bars. The truth is that trading is a difficult business to master. It involves different skill sets and abilities from what are needed in most other professions and careers. The trader must understand his or her personal strengths and limitations and develop specific skills to deal with the mental and emotional demands of trading. The later skills are the most difficult to develop and the most overlooked.

5. You must be tough, hard charging, and fearless to be successful. That’s more media hype than anything else. It glorifies a strong ego, which is a detriment in trading. The most successful traders I know quietly do their research, study the charts, and patiently wait for the right moment. They strive to keep their ego out of their trading.

6. You must trade without emotions. If you are human, that’s impossible. More importantly, when you understand your emotions you will realize they are assets, not liabilities. The real keys are:

  1. To be aware of how your emotions interact with and influence your trading, and
  2. To develop the skills needed to trade with them.

7. Top traders are usually right about the market. Top traders have many, many scratch and losing trades. Top traders are at the top because they exercise good risk control, limit the amount of loss from any given trade, and have developed a psychological edge that allows them to be unfazed by small losing trades. Most of their trading consists of modest profits and very small losses. When conditions are right, they step up size and let the profitable trades run.

8. Paper trading is useless – it’s not a real trade without money behind it. If you aren’t paper trading, you are doing yourself a disservice. You should always be paper trading your trading ideas. Why limit your education and experience by the amount of capital you have? Paper trading keeps you sharp; you learn the conditions under which your trading ideas work best. Where else can you get such vital education at so little cost?

9. Master the technical skills and you will be successful. This is where most traders spend the vast majority of their time, but it’s only part of the picture. You also have to learn important performance skills. Traders should spend as much-if not more-time learning to develop their psychological edge as they do in developing their technical trading edge.

10. Trading is stressful. It certainly can be stressful, and it certainly is stressful for many. It doesn’t have to be. Successful traders have a certain mindset. They put little importance on any given trade. Their focus is on the long haul. They know that if they attend to the aspects of trading that are within their control (i.e., trade selection, entry, risk control, and trade management) the profits will take care of themselves.

How to Manage the Emotions of Trading

How to Manage the Emotions of Trading

Knowing how to control emotions while trading can prove to be the difference between success and failure. Your mental state has a significant impact on the decisions you make, particularly if you are new to trading, and keeping a calm demeanor is important for consistent trading. In this piece, we explore the importance of day trading psychology, for both beginner and more experienced traders and give some pointers on how to trade without emotions.

The Importance of Controlling Emotions While Trading

The importance of day trading emotional control cannot be overstated.

Imagine you’ve just taken a trade ahead of Non-Farm Payrolls (NFP) with the expectation that if the reported number is higher than forecasts, you will see the price of EUR/USD increase quickly, enabling you to make a hefty short-term profit.

NFP comes, and just as you had hoped, the number beats forecasts. But for some reason, the price goes down!

You think back to all the analysis you had done, all the reasons that EUR/USD should be going up – and the more you think, the further the price falls.

As you see the red stacking up on your losing position, emotions begin to take over – this is the ‘Fight or Flight’ instinct. This impulse can often prevent us from accomplishing our goals and, for traders, this issue can be very problematic, leading to knee-jerk reactions.

Professional traders don’t want to take the chance that a rash decision will damage their account – they want to make sure that one knee-jerk reaction doesn’t ruin their entire career. It can take a lot of practice, and many trades, to learn how to minimize emotional trading.

The 3 Most Common Emotions Traders Experience

Some of the most common emotions traders experience include fear, nervousness, conviction, excitement, greed and overconfidence.

Fear/Nervousness

A common cause of fear is trading too big. Trading with improper size magnifies volatility unnecessarily and causes you to make mistakes you normally wouldn’t make if you weren’t under the stress of risking larger losses than normal.

Another culprit for fear (or nervousness) is you are in the ‘wrong’ trade, meaning one that doesn’t fit your trading plan.

Conviction/Excitement

Conviction and excitement are key emotions you’ll want to feed off, and you should feel these in every trade you enter. Conviction is the final piece of any good trade, and if you don’t have a level of excitement or conviction then there is a good chance you are not in the ‘right’ trade for you.

By ‘right’ we mean the correct trade according to your trading plan. Good trades can be losers just as bad trades can be winners. The idea is to keep yourself winning and losing on only good trades. Making sure you have conviction on a trade will help ensure this.

Greed/Overconfidence

If you find yourself only wanting to take trades that you deem as possible big winners, you could be getting greedy. Your greed may have been the result of doing well, but if you aren’t careful you may slip and end up in a drawdown.

Always check that you are using proper trade mechanics (i.e. sticking to stops, targets, good risk/management, and good trade set-ups). Sloppy trading as a result of overconfidence can end a strong run.

How to Read a Candlestick Chart

How to Read a Candlestick Chart

What is a candlestick chart?

A candlestick chart is simply a chart composed of individual candles, which traders use to understand price action. Candlestick price action involves pinpointing where the price opened for a period, where the price closed for a period, as well as the price highs and lows for a specific period.

Price action can give traders of all financial markets clues to trend and reversals. For example, groups of candlesticks can form patterns which occur throughout forex charts that could indicate reversals or continuation of trends. Candlesticks can also form individual formations which could indicate buy or sell entries in the market.

The period that each candle depicts depends on the time-frame chosen by the trader. A popular time-frame is the daily time-frame, so the candle will depict the open, close, and high and low for the day. The different components of a candle can help you forecast where the price might go, for instance if a candle closes far below its open it may indicate further price declines.

Boost your chart patterns expertise with our interactive quiz!

Our Forex Trading Patterns Quiz will test your knowledge of some of the most important trading patterns. Take the test today by clicking on the link and raise your technical analysis game!

Interpreting a candle on a candlestick chart

The image below represents the design of a typical candlestick. There are three specific points (open, close, wicks) used in the creation of a price candle. The first points to consider are the candles’ open and close prices. These points identify where the price of an asset begins and concludes for a selected period and will construct the body of a candle. Each candle depicts the price movement for a certain period that you choose when you look at the chart. If you are looking at a daily chart each individual candle will display the open, close, upper and lower wick of that day.
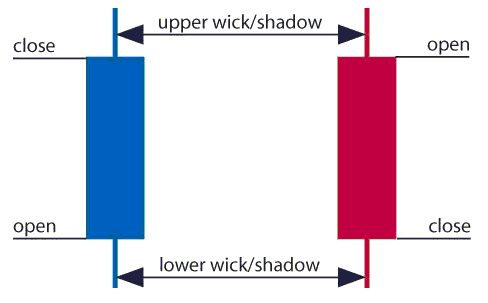
A red and a blue candlestick with open and close wicks

Open price:

The open price depicts the first price traded during the formation of the new candle. If the price starts to trend upwards the candle will turn green/blue (colors vary depending on chart settings). If the price declines the candle will turn red.

High Price:

The top of the upper wick/shadow indicates the highest price traded during the period. If there is no upper wick/shadow it means that the open price or the close price was the highest price traded.

Low Price:

The lowest price traded is the either the price at the bottom of the lower wick/shadow and if there is no lower wick/shadow then the lowest price traded is the same as the close price or open price in a bullish candle.

Close Price:

The close price is the last price traded during the period of the candle formation. If the close price is below the open price the candle will turn red as a default in most charting packages. If the close price is above the open price the candle will be green/blue (also depends on the chart settings).

The Wick:

The next important element of a candlestick is the wick, which is also referred to as a ‘shadow’. These points are vital as they show the extremes in price for a specific charting period. The wicks are quickly identifiable as they are visually thinner than the body of the candlestick. This is where the strength of candlesticks becomes apparent. Candlesticks can help traders keep our eye on market momentum and away from the static of price extremes.

Direction:

The direction of the price is indicated by the color of the candlestick. If the price of the candle is closing above the opening price of the candle, then the price is moving upwards and the candle would be green (the color of the candle depends on the chart settings). If the candle is red, then the price closed below the open.

Range:

The difference between the highest and lowest price of a candle is its range. You can calculate this by taking the price at the top of the upper wick and subtracting it from the price at the bottom of the lower wick. (Range = highest point – lowest point).

Having this knowledge of a candle, and what the points indicate, means traders using a candlestick chart have a clear advantage when it comes to distinguishing trendlines, price patterns and Elliot waves.

Bar Chart vs Candlestick Chart

As you can see from the image below, candlestick charts offer a distinct advantage over bar charts. Bar charts are not as visual as candle charts and nor are the candle formations or price patterns. Also, the bars on the bar chart make it difficult to visualize which direction the price moved.
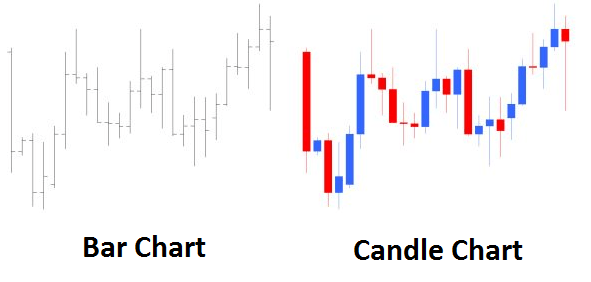
Difference between bar chart and candle chart

How to read a candlestick chart

There are various ways to use and read a candlestick chart. Candlestick chart analysis depends on your preferred trading strategy and time-frame. Some strategies attempt to take advantage of candle formations while others attempt to recognize price patterns.

Interpreting single candle formations

Individual candlesticks can offer a lot of insight into current market sentiment. Candlesticks like the Hammer, shooting star, and hanging man, offer clues as to changing momentum and potentially where the market prices maytrend.

As you can see from the image below the Hammer candlestick formation sometimes indicates a reversal in trend. The hammer candle formation has a long lower wick with a small body. Its closing pricing is above its opening price. The intuition behind the hammer formation is simple, price tried to decline but buyers entered the market pushing the price up. It is a bullish signal to enter the market, tighten stop-losses or close out a short position.

Traders can take advantage of hammer formations by executing a long trade once the hammer candle has closed. Hammer candles are advantageous because traders can implement ‘tight’ stop-losses (stop-losses that risk a small amount of pips). Take-profits should be placed in such a way as to ensure a positive risk-reward ratio. So, the take-profit is larger than the stop-loss.
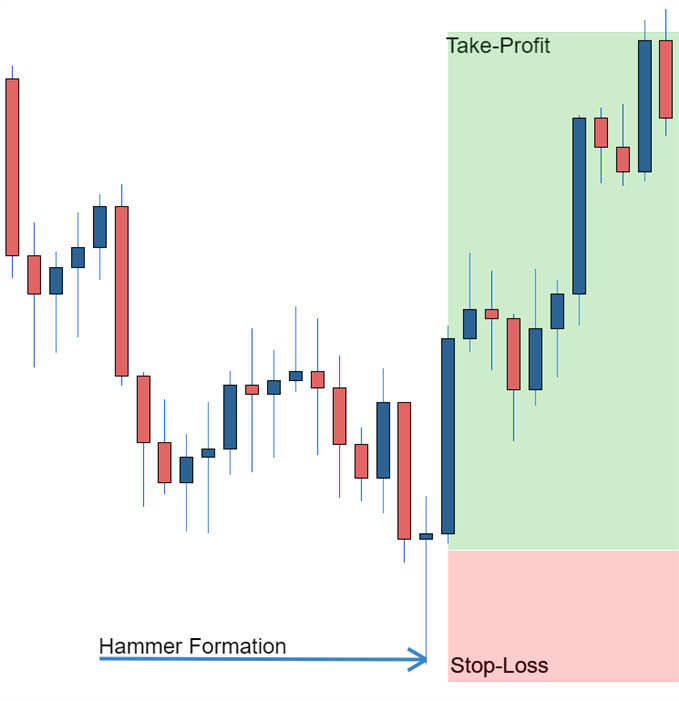
Hammer formation showing stop loss

Recognizing price patterns in multiple candles

Candlestick charts help traders recognize price patterns that occur in the charts. By recognizing these price patterns, like the bullish engulfing pattern or triangle patterns you can take advantage of them by using them as entries into or exit signals out the market.

For example, in the image below we have the bullish engulfing price pattern. The bullish engulfing is a combination of a red candle and a blue candle that ‘engulfs’ the entire red candle. It is an indication that it could be the end of a currency pairs established weakness. A trader would take advantage of this by entering a long position after the blue candle closes. Remember, the price pattern only forms once the second candle closes.

As with the hammer formation, a trader would place a stop loss below the bullish engulfing pattern, ensuring a tight stop loss. The trader would then set a take-profit. For more forex candlestick charts check our forex candlesticks guide where we go in depth into the advantages of candlestick charts as well as the strategies that can be implemented using them.
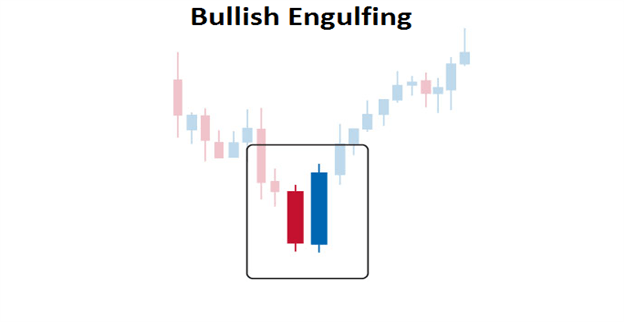

Bullish engulfing pattern

British Pound Sentiment Latest – GBP/USD and EUR/GBP

British Pound Sentiment Latest – GBP/USD and EUR/GBP

GBP/USD retail trader data indicates a net-long position of 43.40%, with a short-to-long ratio of 1.30 to 1. Net-long traders have decreased by 18.07% since yesterday and 0.62% from last week. Conversely, net-short traders have increased by 23.53% since yesterday but declined by 2.02% from last week.

Our analysis typically adopts a contrarian stance to crowd sentiment. The current net-short position suggests a potential continued rise in GBP/USD prices. The positioning is more net-short than yesterday but less net-short compared to last week. This combination of current sentiment and recent shifts results in a mixed GBP/USD trading outlook

GBP/USD Daily Price Chart

image1.png

EUR/GBP retail trader data indicates a net-long position of 62.78%, with a long-to-short ratio of 1.69 to 1. Net-long traders have increased by 3.38% since yesterday but decreased by 21.19% from last week. Conversely, net-short traders have declined by 5.22% since yesterday but risen by 26.88% from last week. We typically adopt a contrarian stance to crowd sentiment. The current net-long position suggests a potential continued decline in EUR/GBP prices.

The positioning is more net-long than yesterday but less net-long compared to last week. This combination of current sentiment and recent shifts results in a mixed EUR/GBP trading outlook.

EUR/GBP Daily Price Chart

image2.png

What is your view on the British Pound – bullish or bearish?? You can let us know via the form at the end of this piece

How to Trade Reversals with the Hanging Man Pattern

How to Trade Reversals with the Hanging Man Pattern

What is the Hanging Man?

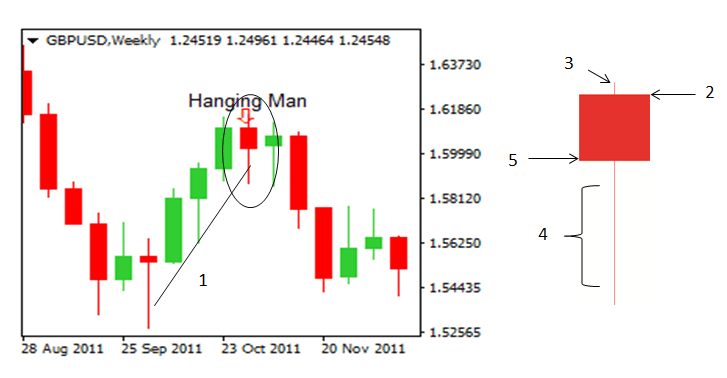
A hanging man candle (aptly named) is a candlestick formation that reveals a sharp increase in selling pressure at the height of an existing uptrend. This is generally brought about by many market participants believing the market has reached its highest level resulting in the ‘bears’ outweighing the ‘bulls’. This can be observed in the GBPUSD chart below where it is clear to see the red candle appearing at the top of the upward trend as a result of mass selling pressure.

GBP/USD HANGING MAN CANDLESTICK

Hanging man candlestick pattern, at times, can signal reversals in the market

Characteristics of the Hanging Man candle

The hanging man candle is characterized by having a small real body, little or no upper shadow (wick) and a lower shadow at least twice the length of the body.

  1. Upward trend: The hanging man can only be identified as such once it has formed at the top of an uptrend.
  2. Opening level: The hanging man candle can either be a green candle (bullish), or a red candle (bearish) although, the bearish candle provides a better indication of a weakening market.
  3. Upper shadow: A small upper shadow indicates that there was an attempt to maintain the current uptrend before the significant drop in the price of the Pound Sterling.
  4. Long lower shadow: This is probably one of the most insightful observations on the candle, depicting a significant sell off before the bulls tried to regains some ground forcing the closing price to end up somewhat closer to opening levels but still down for the period.
  5. Closing level: In this case the closing level was below the opening level and therefore, confirms that this is a bearish hanging man candle.

Identifying hanging man candlestick trading signals

The hanging man candlestick can be used to identify a short trade (bearish view of the market) as the long shadow indicates massive selling. The true test of the legitimacy of the hanging man candlestick is often revealed in subsequent activity on the chart. If the following candle moves further down and breaks below the short term upward trend line, this can be seen as a continuation of the downward long term trend. Another possible entry level could be to enter the trade once the market has moved past the low of the hanging man candle.

Trading the Hanging Man?

It is important to view the hanging man candle formation in relation to the long term trend. The best way to do this is to make use of multiple time frame analysis. Start off by viewing the market using a longer time frame chart like the daily or weekly time frame to observe the direction the market is tending to in the long term. Then, zoom-in using a smaller time frame chart (4 hour or 2 hour) to analyze the ideal entry point for your trade.

Step 1: Identify the long term trend

View the chart on a longer time frame (perhaps a daily chart) to get an idea of the direction the market is heading. You do not want to place a trade in the opposite direction of the long term trend.

Step 2: Spotting your ideal entry point

Making use of a shorter time frame chart (4 hour chart), identify the ideal entry point. The hanging man candle formation provides us with a signal for a short trade.

Step 3: Make use of supporting indicators

Does the RSI confirm that the market has turned and now in a downward trend? Has the 20 SMA line crossed over the 50 SMA line? Does the hanging man candlestick appear near the top of the short term uptrend? Is a relevant Fibonacci retracement level nearby?

Step 4: Place your trade

Look for an entry point at the low of the hanging man candlestick. If your bearish view of the market is correct, you will see subsequent price action moving down – providing you with an indication to place your short trade.

Step 5: Risk management

Be sure to place your trade in accordance with your position sizing strategy. Consider how much of your total account value you are prepared to risk at any point in time and do not deviate from this. At DailyFX, we talk about risking less than 5% on all open trades. In addition, ensure that you place your stop at the high of the hanging man candle formation.

Step 6: When to close out of the trade?

Whenever entering a trade it is always best to have at least a 1:2 Risk-to-Reward ratio. You are risking half of what you intend to gain. This means that the distance from your entry level to your take profit level should be twice the distance from your entry level to your stop loss level. Applying this simple technique will mean that even if you only get half of your trades correct, you will still have a positive trading account. We talk about these trading insights in our Traits of Successful Traders research.

GBP/USD DAILY PRICE CHART (DOWNTREND)

GBP/USD daily chart showing a downtrend in price

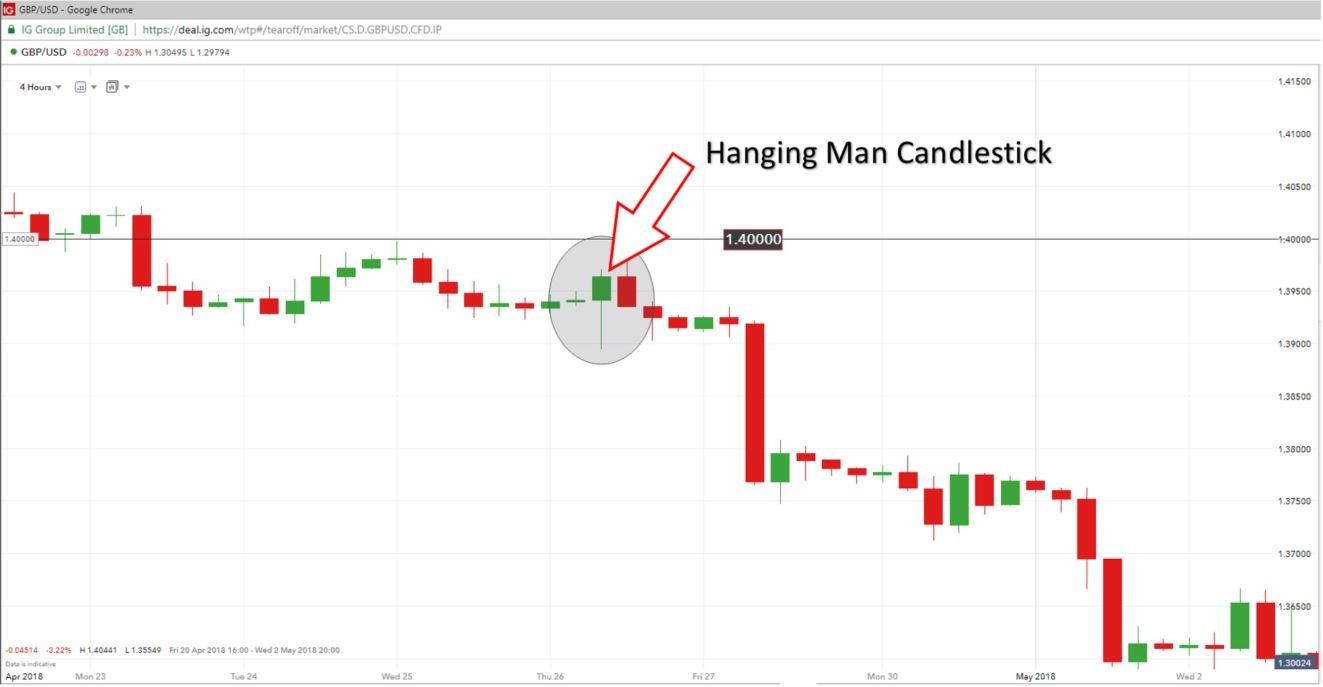
Zooming in a little further making use of the shorter, 4 hour chart (below), you will be better equipped to spot the ideal opportunity to enter the trade.

GBP/USD (4 HOUR)HANGING MAN CANDLE

hanging man reversal pattern appears within the context of a larger downtrend

On the 4 hour chart you will see that the previous level of support 1.40000, now acting as a level of resistance. The hanging man candle appears near the peak of the short term uptrend, below the new level of resistance. At this point, we are on the lookout for a reversing market to the downside. Eventually, price breaks below the low of the hanging man delivering an entry signal to short. Stops can be placed at the level of resistance (1.40000) for risk management purposes should the market move against you.

Confirmation of the sell signal:

  1. Long term downward trending market
  2. Hanging man candle appearing near the peak of the short term uptrend
  3. Hanging man appearing near a significant level of support/resistance
  4. Subsequent candles moving lower (lower highs & lower lows)
The Head and Shoulders Pattern: A Trader’s Guide

The Head and Shoulders Pattern: A Trader’s Guide

Head and Shoulders Chart Pattern: Main Talking Points

  • What is a Head and Shoulders pattern?
  • What is the Inverse Head and Shoulders pattern?
  • How to identify Head and Shoulders patterns on forex and stock charts
  • Advantages and limitations of the Head and Shoulders pattern

What is the Head and Shoulders Pattern?

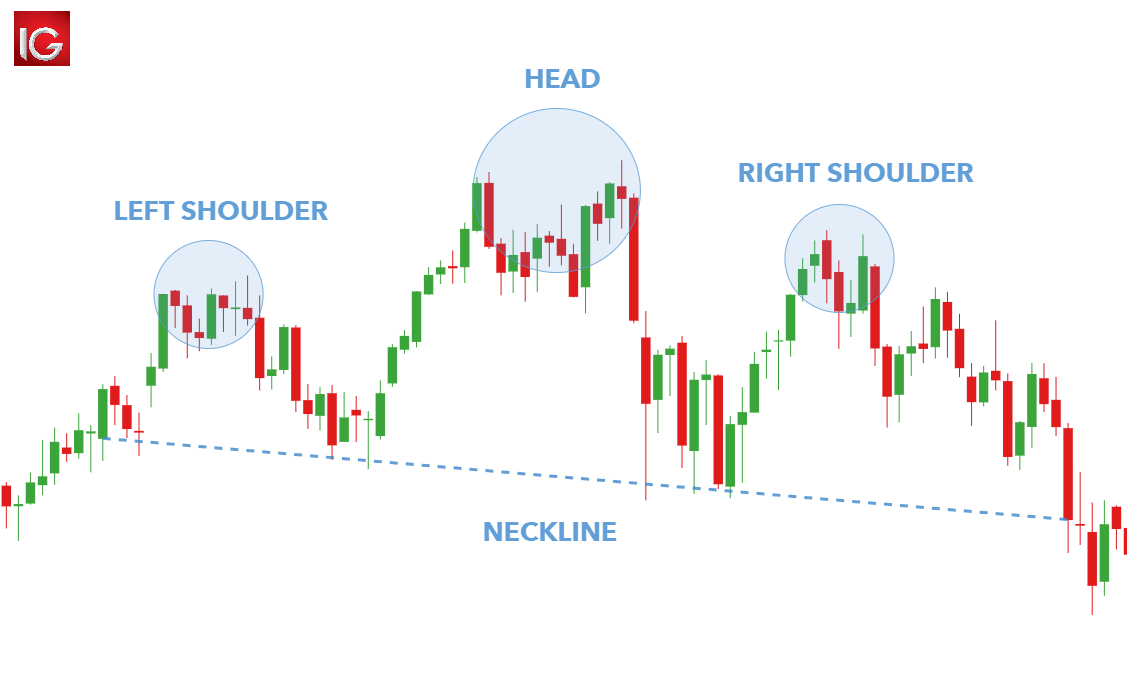
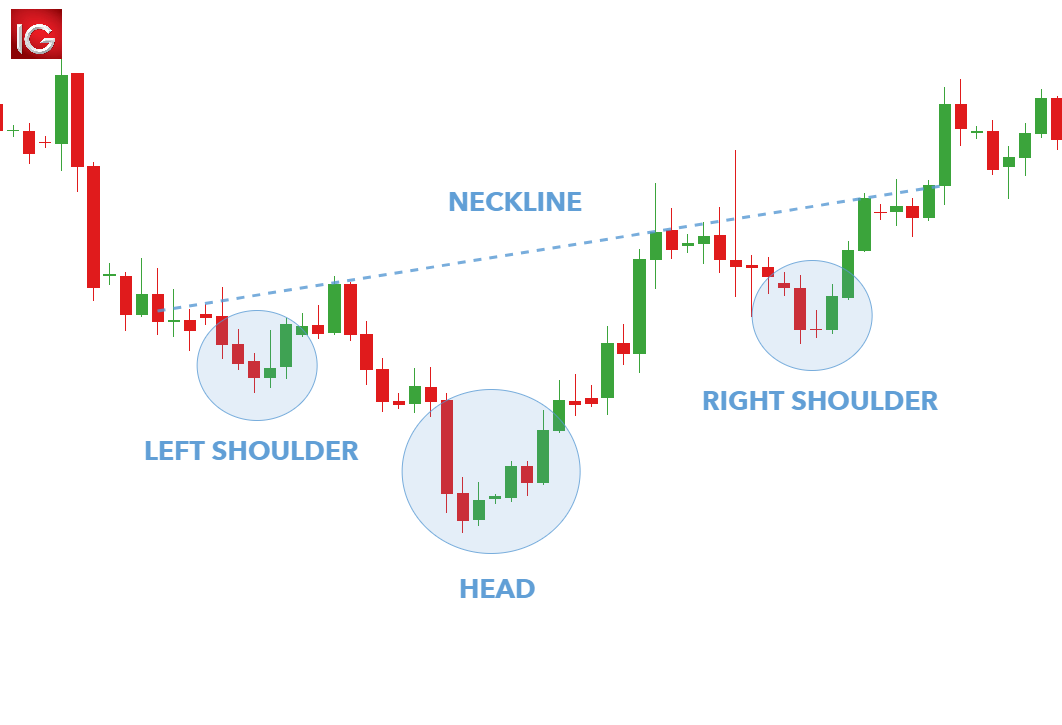
The Head and Shoulders chart pattern is a price reversal pattern that helps traders identify when a reversal may be underway after a trend has exhausted itself. This reversal signals the end of an uptrend. The Head and Shoulders pattern has a distinctive appearance resembling its namesake which includes a distinct ‘left shoulder’, ‘head’, ‘right shoulder’ and ‘neckline’ formation (see image below).

head and shoulders chart pattern

What is the Inverse Head and Shoulders Pattern?

The Inverse Head and Shoulders (informally known as the ‘Reverse Head and Shoulders pattern) resembles the same structure as the standard foration but reversed. The Inverse Head and Shoulders is observable in a downtrend (see image below) and indicates a reversal of a downtrend as higher lows are created.

inverse head and shoulders chart pattern

How to identify Head and Shoulders Patterns on Forex & Stock Charts

Recognizing the Head and Shoulders pattern on both forex and stock charts entail the exact same actions; making it a versatile tool to include in any trading strategy. The following list gives a simple breakdown of the key action points when identifying this pattern:

  1. Identify the overall market trend using price action and technical indicators (preceding uptrend)
  2. Isolate the Head and Shoulders chart construction
  3. The distance between the ‘Head’ and ‘Shoulders’ should be as close to equidistant as possible
  4. Delineate the neckline at the low point between both ‘shoulders’ – preferably horizontal but not obligatory

These steps are applicable to identifying both the standard and reverse head and shoulders patterns.

How to Trade the Head and Shoulders Pattern

Once a trader knows how to identify the standard and inverse head and shoulders patterns, it’s relatively easy to apply it to technical analysis in both forex and equity markets.

Trading stocks with the Head and Shoulders pattern

trading the head and shoulders pattern

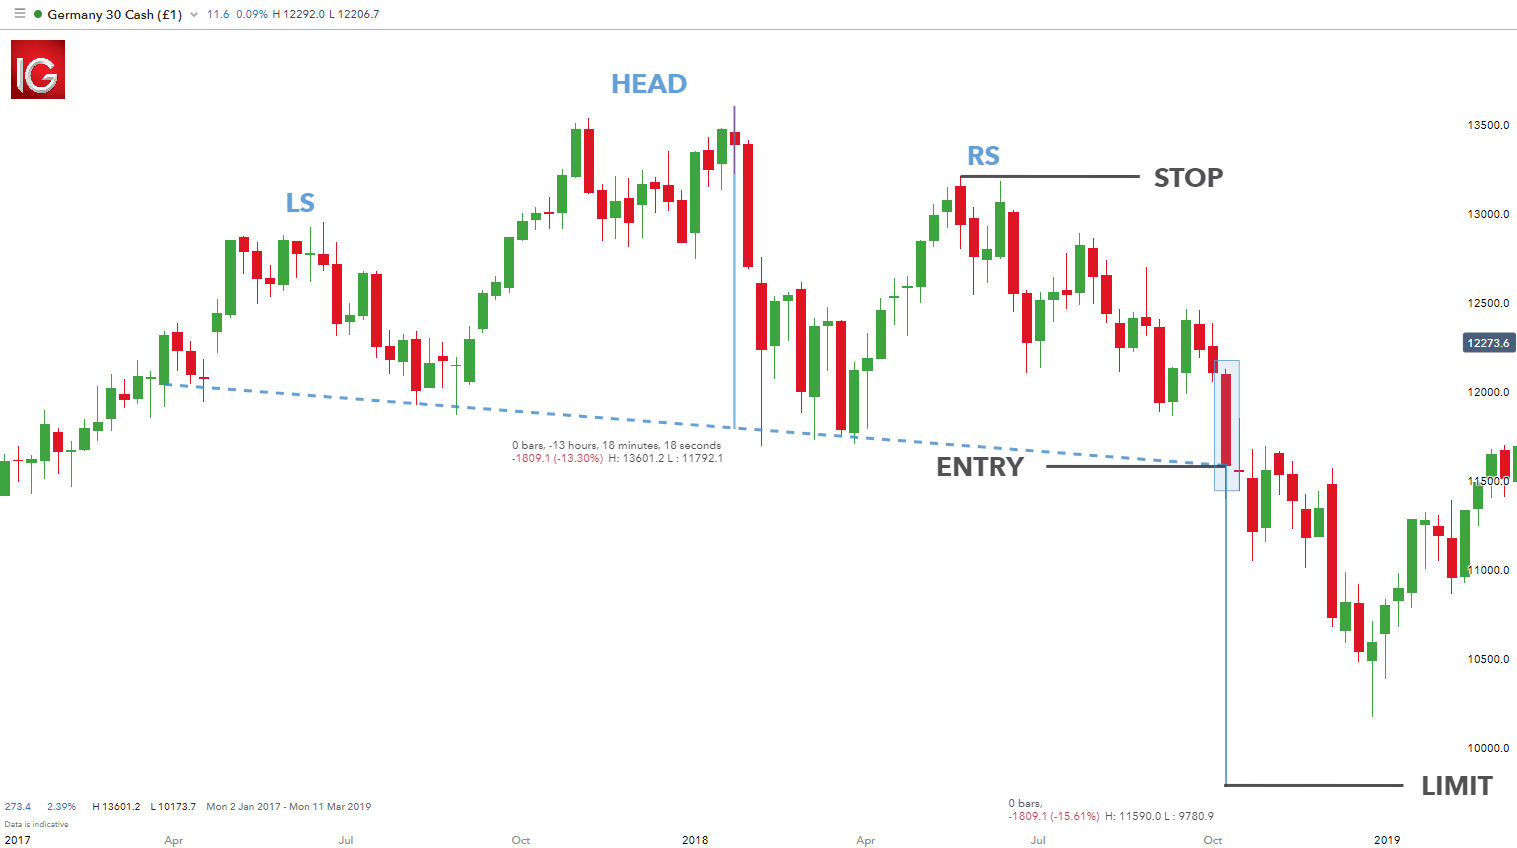
The chart above shows a Head and Shoulders pattern on the Germany 30 (DAX 30) stock index. The formation of the pattern is clear with the neckline highlighted by the dashed blue horizontal line. Traders will look to enter a short trade after a confirmation close below the neckline as seen by the ‘ENTRY’ label on the chart or the pip movement below the neckline. Some traders employ the ‘two-day’ close rule which necessitates a second confirmation candle closing below the neckline before opening the short trade. Trading on the pip break below the neckline allows traders to benefit from the full move down however, this tactic is riskier in that the breakout below the neckline has not been confirmed by a candle close.

There is a general rule of thumb to designate stop and limit levels. Taking the high point off the ‘right shoulder’ will specify the stop level whilst the vertical distance between the neckline and high of the ‘head’ will approximate the limit distance – 1832.8 pips in this case. The risk-reward ratio on this trade is roughly 1:1.2 which is still within the DailyFX recommended risk management parameters.

Trading forex with the Inverse Head and Shoulders pattern

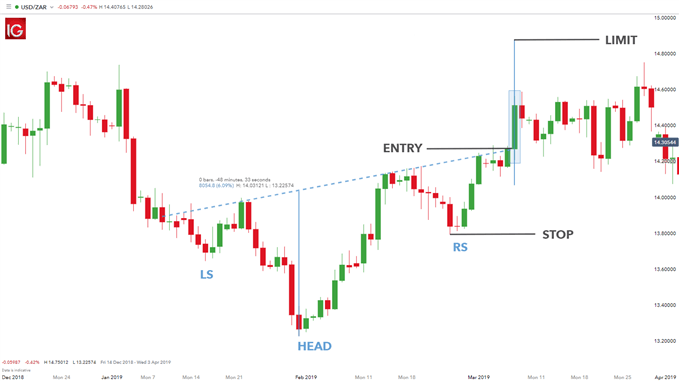
trading the inverse head and shoulders pattern

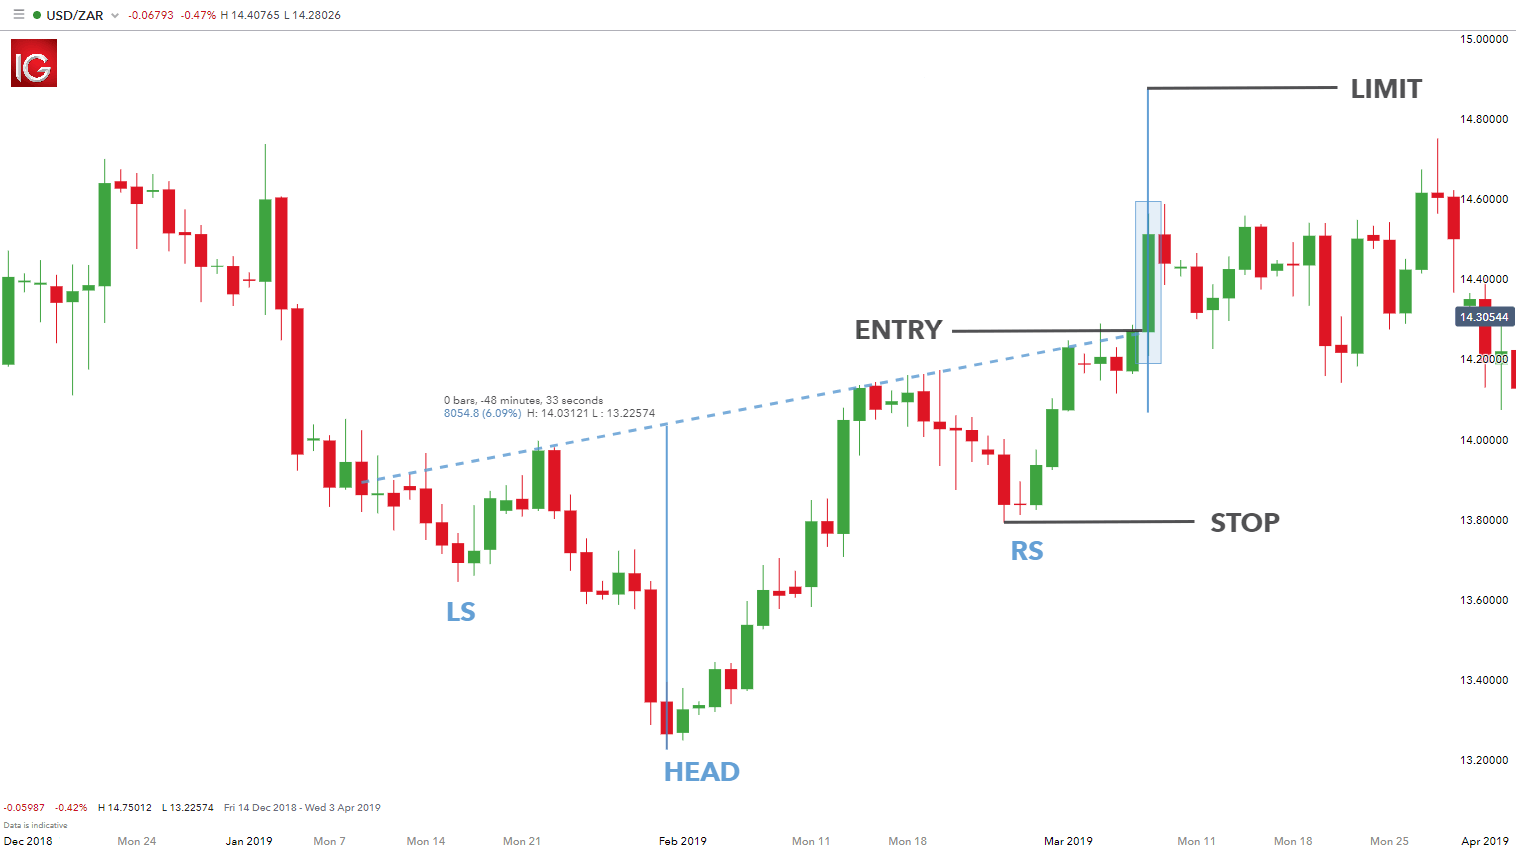
The Inverse Head and Shoulder pattern on the USD/ZAR forex pair above shows an asymmetrical structure which is quite common in most formations. The neckline is slightly skewed, however still maintaining the integrity of the pattern.

The long entry level is highlighted by the neckline break or the price candle close above the neckline. The stop distance is taken from the low from the ‘right shoulder’ whilst the limit distance is calculated by measuring the distance from the ‘head’ low to the neckline.

Trading with the Cup and Handle Pattern

Trading with the Cup and Handle Pattern

What is a cup and handle pattern and how does it work?

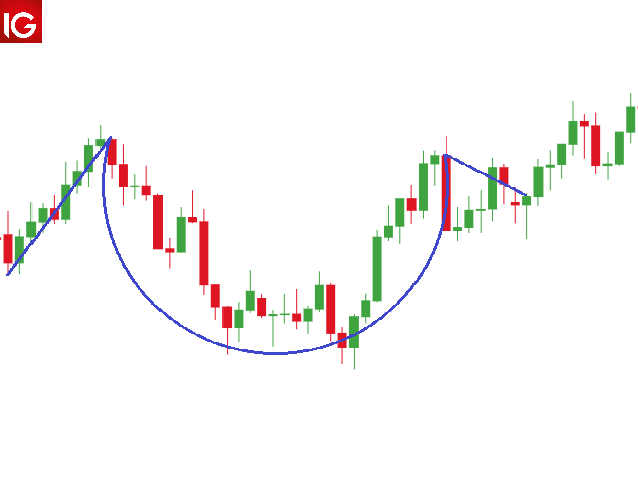
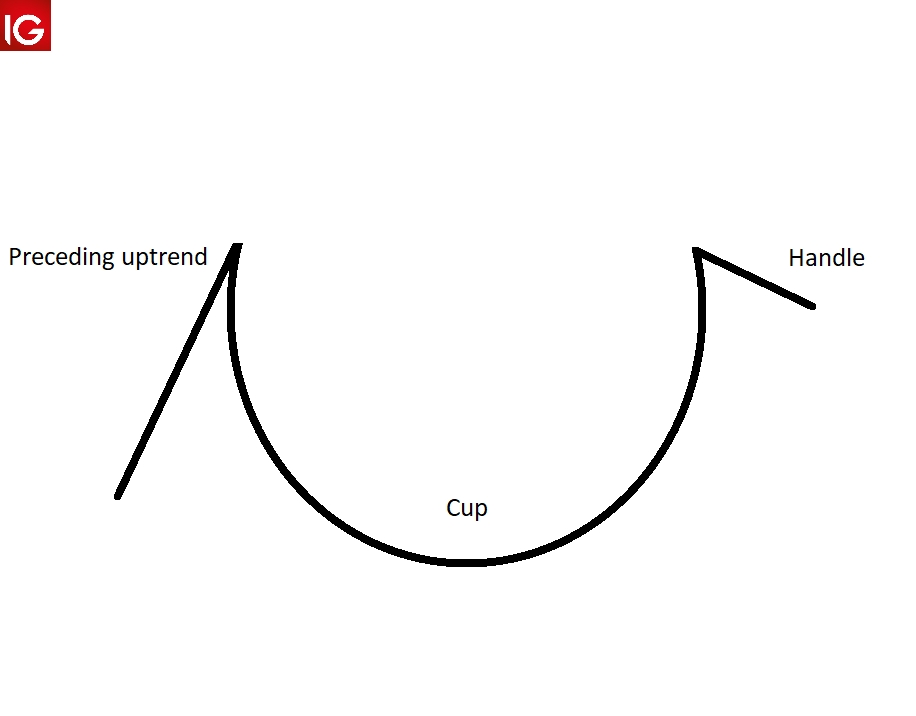
The cup and handle pattern is a continuation pattern that occurs after a preceding bullish or bearish trend. This formation provides traders with some distinctive features. The ‘cup and handle’ term translates to the bar chart pattern. The cup presents as a bowl shape whilst the handle is depicted as a downward slanting period of consolidation.

cup and handle pattern

How to identify a Cup and Handle Pattern

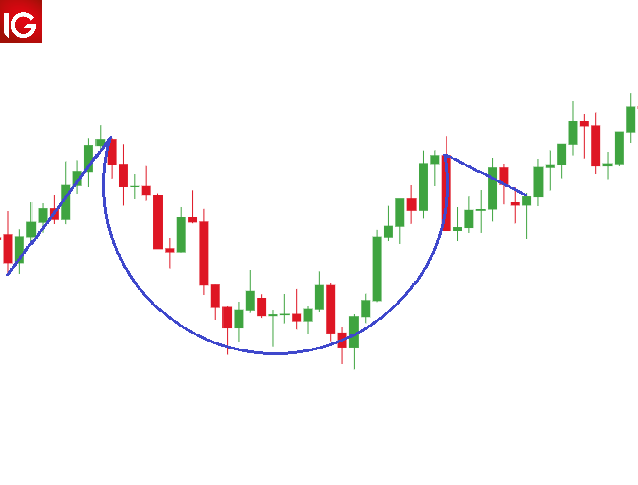
The cup and handle pattern is slightly more complex as opposed to other chart patterns which can be tricky for some traders to identify. The steps below outline a simple guide to identify the cup and handle chart pattern successfully:

  1. The cup and handle pattern is considered to be a bullish continuation pattern therefore, identifying a prior uptrend is essential. This can be done using price action techniques or technical indicators such as the moving average.
  2. The cup should form more of a ‘U’ shape as opposed to a ‘V’ with the high points on either side of the cup being approximately even.
  3. The handle resembles a consolidation generally in the form of a flag or pennant pattern. This should be downward sloping but does consolidate sideways in some instances similar to a rectangle pattern.
  4. The breakout signal can occur in different ways depending on the trader’s preference. Some trader’s look at the resistance level taken from the horizontal between the highs of the cup. Once this breaks that level, entry will be confirmed. Other traders use a break of the handle trendline as a long entry point.

identifying the cup and handle pattern

How to trade with the Cup and Handle Pattern

Trading with the cup and handle pattern differs slightly when using it to trade forex and equities. The volume function is often used in stock trading as a spike in volume indicates the breakout which confirms the entry signal.

Forex trading does not normally use this function, and instead involves other more conventional breakout confirmation methods such as breaks above resistance. The rest of the process is the same when trading the cup and handle pattern.

1) Trading stocks with the cup and handle pattern

Wynn Resorts Ltd example:

trading cup and handle stocks

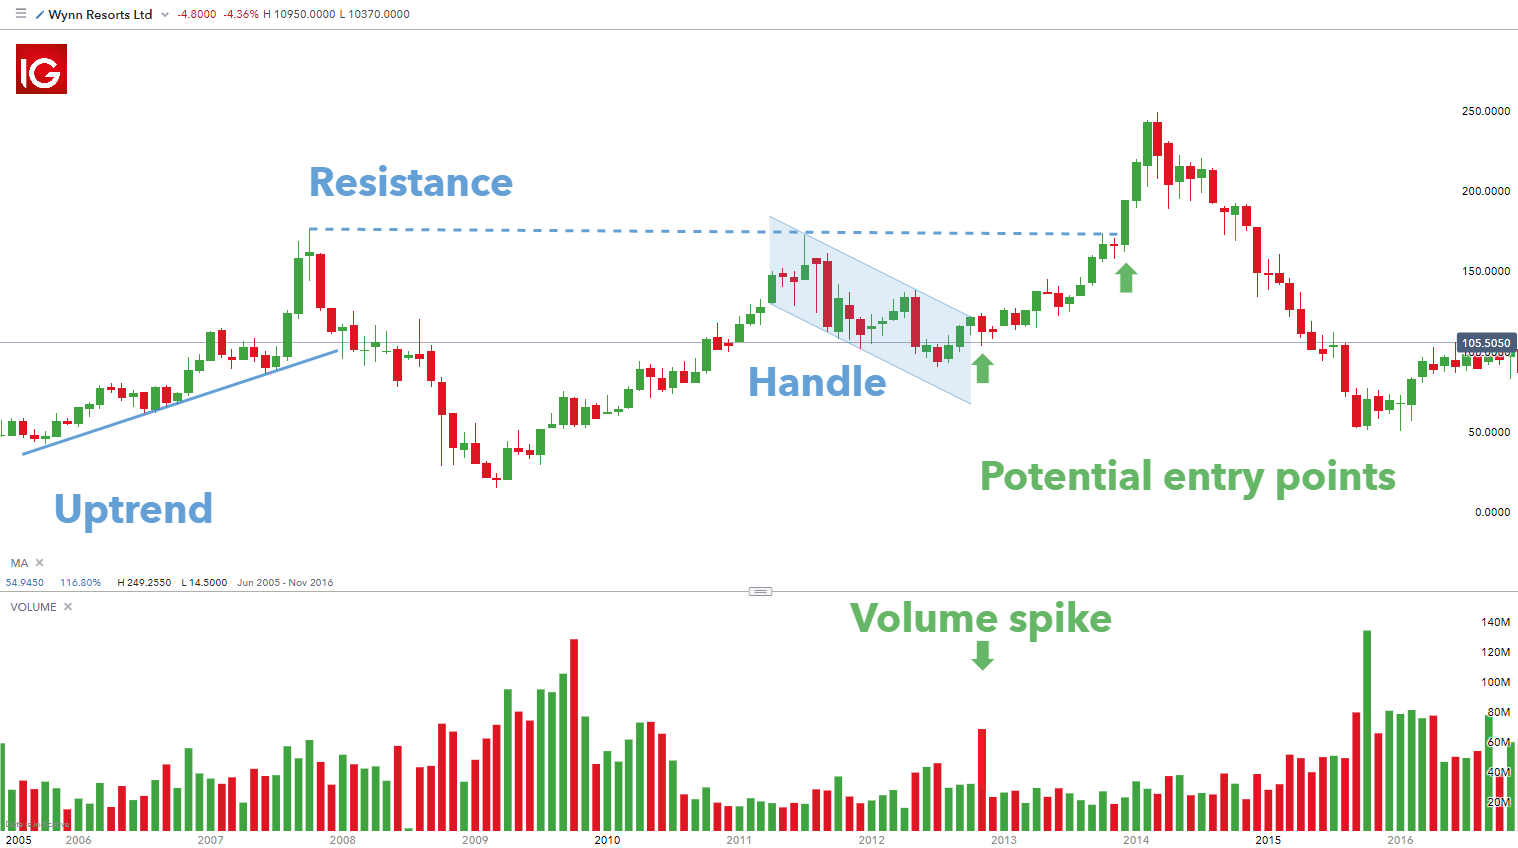
The image above is a monthly chart of the popular hotel and casino company Wynn Resorts Ltd. The chart exhibits a cup and handle formation with a clear prior uptrend as marked by the trendline showing higher highs and higher lows. A moving average may also be used instead to confirm the uptrend.

The chart shows two potential entry points denoted by the green arrows. The first entry takes place on the breakout above the upper end of the price channel akin to a bullish flag with a spike in volume as verification of the move up. The second entry uses the resistance level between the highs on either side of the cup as a key price level. Once this is broken, traders can look to go long. This method is less aggressive, but the patience of additional confirmation can shield against a false breakout with regards to the handle channel.

Stop levels are often taken from the low of the handle. This can then be projected by a factor of two to arrive at a take profit (limit) with a ratio of 1:2 risk-reward ratio. Other traders prefer Fibonacci extensions as a gauge for limit levels. This choice comes down to trader preference.

2) Trading forex with the cup and handle pattern

EUR/USD example:

trading cup and handle forex

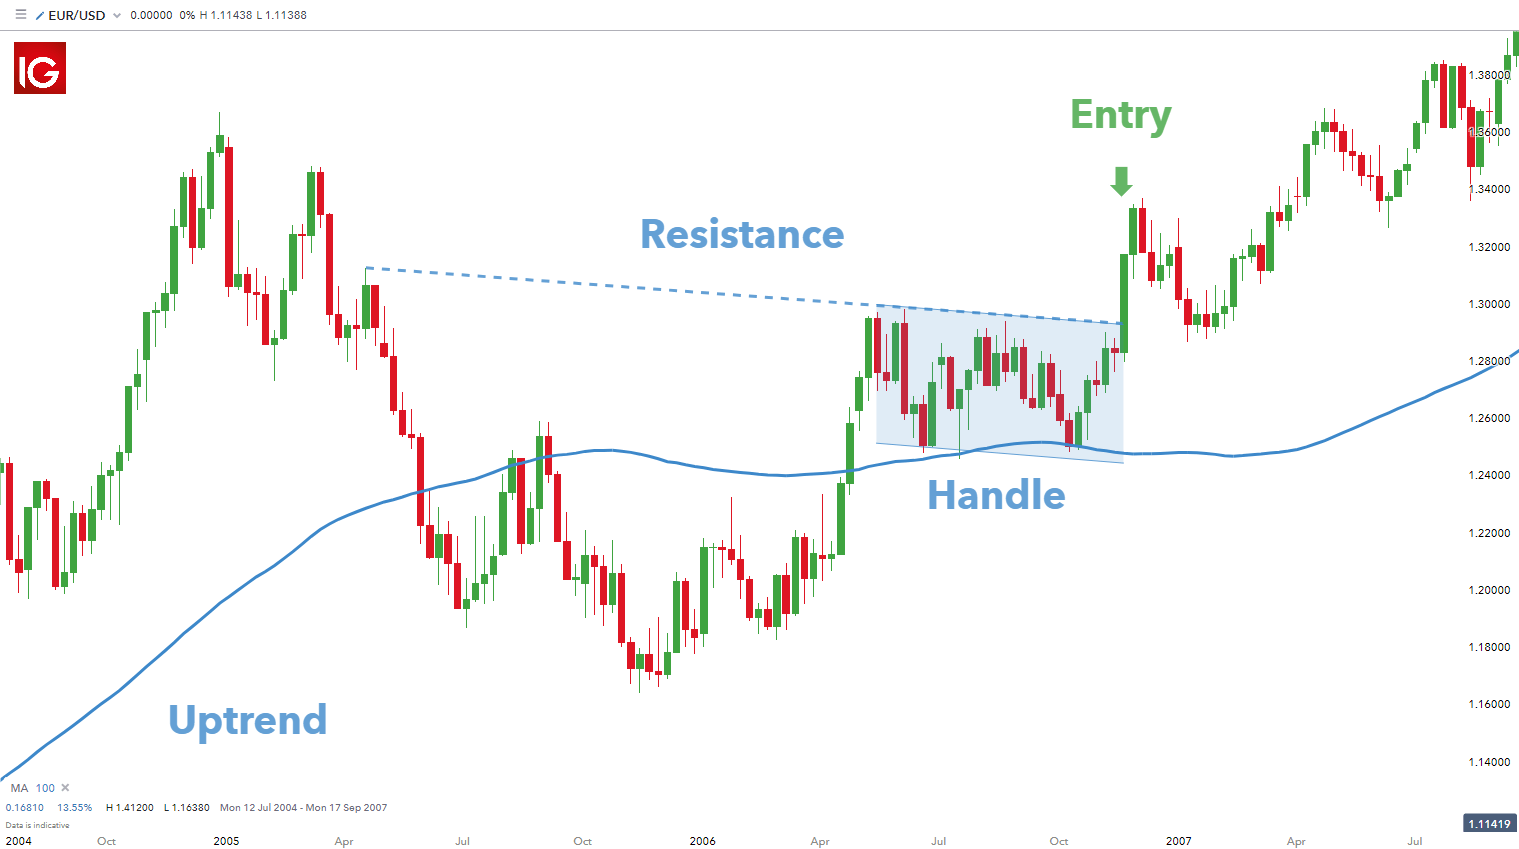
The cup and handle formation on the weekly EUR/USD chart above displays a potential buy opportunity. In this example the moving average is used to determine the former upward trend (price above the 100-day moving average).

This chart is unique in that the resistance line between the highs on either side of the cup and the handle price channel coincide. This gives the trader one entry point as a break above these two resistance points will be the same. The stop and limit points will be determined in the same manner as mentioned in the stock example. The only difference on this forex chart is the absence of the volume tool.

US Dollar Sentiment Latest – EUR/USD, USD/JPY, and GBP/USD

US Dollar Sentiment Latest – EUR/USD, USD/JPY, and GBP/USD

EUR/USD – Bearish Outlook Reinforced

Recent retail trading data indicates that 57.14% of traders have taken long positions on EUR/USD, with a ratio of 1.33 long traders for every short trader. The number of long positions has increased by 26.08% since yesterday and 6.42% since last week. Conversely, short positions have decreased by 18.26% since yesterday and 15.81% since last week. Given our contrarian approach to market sentiment, this predominance of long positions suggests a potential continued decline in EUR/USD prices. The combination of current sentiment and recent shifts strengthens our bearish outlook on EUR/USD.

EUR/USD Daily Price Chart

image1.png

USD/JPY – Shifting Towards Lower Prices?

Analysis of retail trader behavior reveals that only 18.06% of traders are net-long on USD/JPY, with short positions exceeding long positions at a ratio of 4.54 to 1. We’ve observed increases in both net-long positions (up 7.83% since yesterday and 16.31% week-over-week) and net-short positions (up 1.25% since yesterday and 7.93% week-over-week). Our contrarian strategy usually views net-short sentiment as bullish for USD/JPY. However, the recent decrease in net short positioning relative to long positioning suggests a potential shift. This change in sentiment patterns may indicate an impending downward reversal in USD/JPY prices, despite the overall net-short market position

USD/JPY Daily Price Chart

image2.png

GBP/USD – Stronger Bearish Outlook

Recent retail trading data indicates that 53.98% of traders have taken long positions on GBP/USD, with long traders outnumbering short traders by a ratio of 1.17 to 1. The number of long positions has increased by 12.28% since yesterday and 21.58% over the past week. Conversely, short positions have decreased by 5.48% since yesterday and 18.64% over the week. Given our contrarian approach to market sentiment, this predominance of long positions suggests a potential continued decline in GBP/USD prices. The current sentiment, combined with recent position changes, strengthens our bearish outlook on GBP/USD.

GBP/USD Daily Price Chart

image3.png