British Pound Latest – UK GDP Beats Estimates, Rate Cut Expectations Trimmed

British Pound Latest – UK GDP Beats Estimates, Rate Cut Expectations Trimmed

According to the Office for National Statistics (ONS),

‘Real gross domestic product (GDP) is estimated to have grown by 0.9% in the three months to May 2024, compared with the three months to February 2024. This is the strongest three-monthly growth since January 2022. Services output was the main contributor, with a growth of 1.1% in this period, while production output showed no growth and construction fell by 0.7%. Monthly real GDP is estimated to have grown by 0.4% in May 2024, after showing no growth in April 2024 (unrevised from our last publication).’

ONS – GDP Monthly Estimate – May 2024

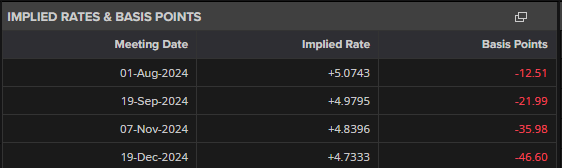
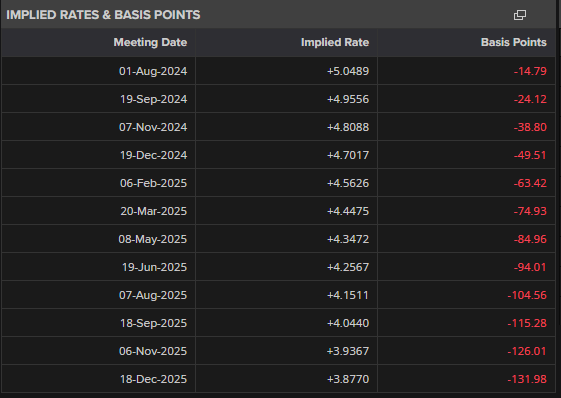
Today’s strong GDP data trimmed UK rate cut expectations by 3-4 basis points but market pricing still shows just under 47 basis points of rate cuts this year with the September 19th meeting heavily favored for the first 25 basis point move.

image2.png

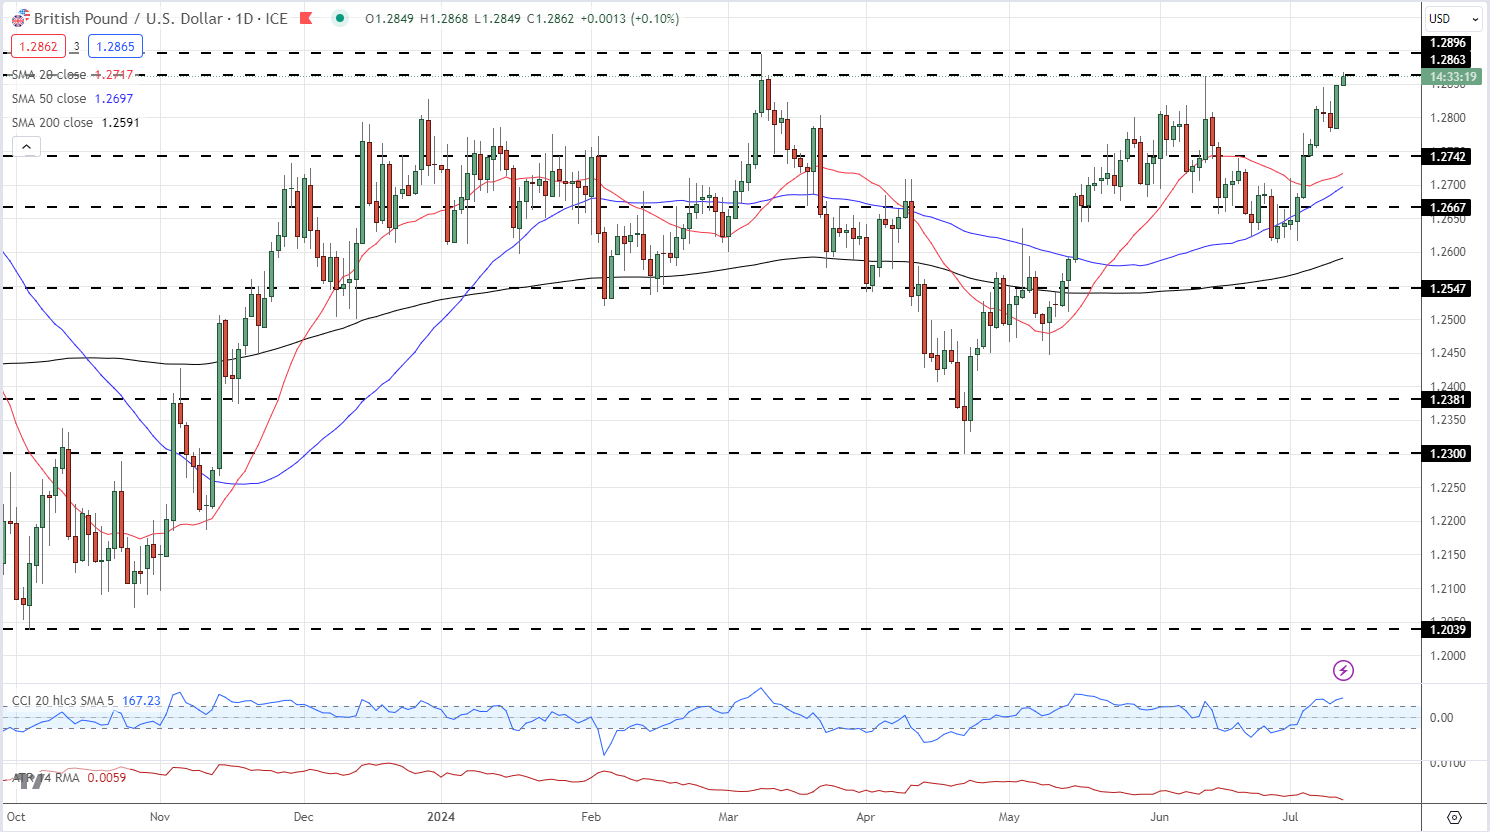
GBP/USD posted a multi-week high of 1.2668 after the release, and now eyes the early March high of 1.2896.

GBP/USD Daily Chart

image3.png

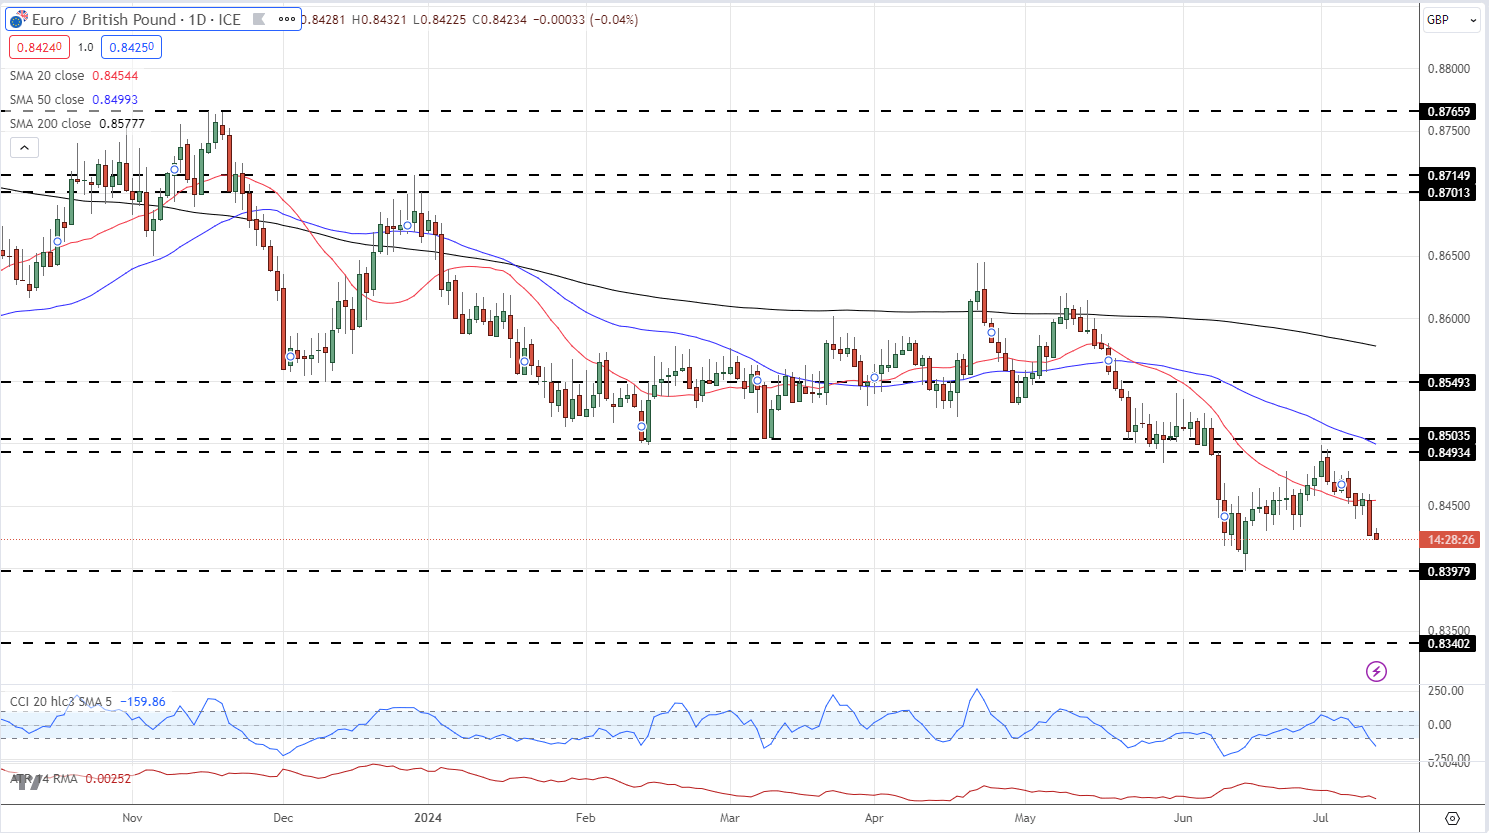
EUR/GBP continues its recent move lower and is set to test the June 14 low at 0.8397. A break below here would see EUR/GBP back at levels last seen in August 2022 and would leave 0.8340 vulnerable.

EUR/GBP Daily Chart

image4.png

IG Retail trader data shows 69.80% of traders are net-long with the ratio of traders long to short at 2.31 to 1.The number of traders net-long is 8.11% higher than yesterday and 11.58% higher than last week, while the number of traders net-short is 12.50% lower than yesterday and 9.26% lower than last week.

We typically take a contrarian view to crowd sentiment, and the fact traders are net-long suggests EUR/GBPprices may continue to fall. Traders are further net-long than yesterday and last week, and the combination of current sentiment and recent changes gives us a stronger EUR/GBP-bearish contrarian trading bias.

Trading Journal: What it is and How to Create One

Trading Journal: What it is and How to Create One

What is a trading journal?

A trading journal is a log that you can use to record your trades. Traders use a trading journal to reflect upon previous trades so that they may evaluate themselves, and you should too! You can use journals to evaluate where you can improve your trading. They are a useful form of record keeping.

Why trading journals are useful

Main reasons to keep a trading journal include:

  • They help you identify weak points and strong points in your style.
  • Journals could increase trading consistency.
  • The journal could keep you accountable.
  • The journal can help you choose your best trading strategy.

Keeping a journal is a simple yet extremely effective way to improve a trading plan. A trading plan is a set of rules and guidelines you will follow that includes strategy, risk management, and trader psychology.

How to create a trading journal

Creating a trading journal is simple and you can tailor one to your specific trading goals and style. The following steps are a basic guide, which are explained in more depth below:

  1. Choose between a book or a spreadsheet. We recommend using a spreadsheet.
  2. Identify what information you would like to record. (Date of trade, underlying asset, position size etc.)
  3. Record your trades directly after you have finished placing your stop losses and take profits.
  4. After a designated period (daily/monthly/weekly) compile the data and reflect upon the trades.

Step 1: Choose a book or spreadsheet

We recommend using a spreadsheet because of the built-in analytical functions. These can help you reflect upon the trades as we explain in step 4.

Step 2: Identify the information to record

The standard format of a trading journal will include these main criteria:

Currency Pair Size Long/Short Date Conviction Strategy used Points Successful or not?
USD/JPY 1 lot Long 30 Jan 19 High Fundamentals 100 Successful

The standard format is an example of a simple trade journal. It can help you reflect on your trades, but with a few extra criteria we can enhance the journal so that it provides much more useful information.

Useful information to consider adding include:

Reason for trade: The reason could be due to technical or fundamental analysis or a combination of both. Once you have executed several trades you can reflect on this information to see if your reasons for trading are bearing tangible results. This could also help you determine which strategy works better for you – technical analysis or fundamental analysis.

Conviction: Conviction is how you feel about the trade. If you are making the trade based on a technical pattern and if the pattern ‘checks off’ several guidelines, then we can list the conviction as ‘high’. However, if the pattern or fundamental story isn’t really clean, then the conviction may be ‘medium’ or ‘low’ depending on the factors basing the trade. By writing down your conviction, you can calculate the amount of successful trades you have had with each rank of conviction. This could help you determine whether you should only trade when you are very convinced or not.

Other: You can put whatever you feel is necessary to record in your journal. Some traders add a criterion for how they feel emotionally when placing the trade. Anything you feel will help you, write down.

Step 3: Record the trades directly after the trade

Get into the habit of recording the details of the trade directly after the trade, while it is still fresh. This way you won’t have to remember what your reasons were for taking the trade. Make sure to do this only after placing your stop-loss and take-profit.

Step 4: Compile the data and reflect upon the trades

After a certain amount of time, preferably a few months so you have enough data, you can compile the data in your trade journal.

If you have a conviction criterion in your journal, tally up the amount of successful trades made when your conviction was high, medium, and low. Once you have this data you can make the decision of whether it is worth trading only when your conviction is high or not.

For example, if you maintained a high conviction in 10 trades and eight of them were successful trades (Take-profits were hit) that’s as 80% probability of success on your historical trades. If your conviction was low on 10 trades and only two were successful trades that’s a 20% probability of success. Therefore, you would conclude that it is only worth trading when your conviction is high.

You can do this will all the different types of criteria so that you can reflect on your trading and improve.

Trading Journal Template

Here is an example of a trading journal template that includes type of trading strategy used as a criterion.

Trading Journal Template

Having discussed the different criteria, you could include in your journal, the table above illustrates how you could organize all this information in a spreadsheet. You can download the template above for personal use from page five of our free building confidence in trading guide.

Trading Journals: A Summary

Having a trading journal should be one of the first steps traders implement when learning to trade. A journal is of utmost important to testing different strategies and finding which trading plans work for individual traders.

A trading journal is essential in testing whether a current trading strategy is working. To summarize:

  • Trading journals are there to log your trading activity.
  • They help traders test different trading plans and strategies.
  • Trading journals can also help traders pinpoint strengths and weaknesses in a trading style.
Trading with Confidence in the Forex Market

Trading with Confidence in the Forex Market

It goes without saying, but confidence is essential to trading or anything individuals set out to do. There are certain ways to approach building confidence, maintaining it, and making sure traders stay on track. Without confidence, traders can’t perform optimally. There are necessary steps to take to not only build confidence, but to maintain it as well. For traders to feel confident in forex trading, a suitable game plan is required.

Here are some pointers to help increase trading with confidence:

  • Know your trading style
  • Pin down a trading time-frame
  • Focus on few currency pairs
  • Calculate your risk tolerance
  • Focus on process not outcomes
  • When your trading confidence is hit, reflect and repair
  • Avoid trading overconfidence


Know Your Trading Style

The first of several facets to trading with confidence is having an analytical methodology and strategies which fit the trader’s personality. Each trader has a different view on how things work and what resonates when it comes to analysis. Having a firm understanding of what works is extremely important as well as being consistent in application. Whichever type of analysis is selected, traders should not overcomplicate matters by adding components which could lead to confusion. Simple and consistent application of indicators – support and resistance, trend-lines, Elliot wave theory will lead to traders trading with confidence.

Pin Down A Trading Time-Frame

Time frame filters down from the trading style or strategy employed by the trader. Different trading styles generally relate to specific time horizons. For example, a position trader will target long-term time frames for each trade. Time-frames completely depend on the trader’s mentality and the amount of time they can dedicate per day. 4-hour time frames can be a good place to start off as it avoids market noise and does not require constant monitoring. This comes back to sticking to a trading style which will prevent traders from jumping around between time frames.

Focus on a few currency pairs

Know the markets or currency pairs which are being traded as per the strategy. Keeping the pool of instruments/markets small is always a good idea. Not all asset classes or even instruments within an asset class move the same, they have their own characteristics. Knowing the behavior of this small universe of symbols will give you more confidence when trading.

Calculate Your Risk Tolerance

Trading with confidence has strong links to risk management and understanding tolerance for risk. This is perhaps the most important facet, as it keeps traders steered towards taking the proper amount of risk per trade to prevent traders overriding analysis with emotion based on a lack of acceptance of the risk per trade. Risk management trumps analysis.

Focus on Process Not Outcomes

Focusing on the process, not the results will allow traders to gain greater confidence whilst trading. This requires patience to refrain from primarily focusing on the end goal. One way to do this is to keep a checklist, whether on paper or mentally. This will help steer traders towards the trades which suit the trading plan and prevent traders from entering harmful trades. It also helps deviate focus on the profit/loss (result) and maintain objectivity. In addition to the above, focusing on process-orientated goals will aid traders in remaining organized in relation to the trading goals.

When Your Trading Confidence is Hit, Reflect and Repair

Drawdowns can take a trader out of the proper mindset to trade with confidence. In Paul’s video above, it was discussed how to handle a drawdown, which is an inevitable occurrence from time to time. The first step noted was to ‘get out of the fire’, and effectively hit the reset button. Secondly, review trades that were unsuccessful – market not conducive to trading style etc. It is important to note that the market is always right. Choosing not to trade is essentially a trade in itself. Once issues are identified, returning to the market slowly is a prudent approach until confidence is restored.

Avoid Trading Overconfidence

Handling periods of success and identifying when those periods might be drawing towards a pause is also key to maintaining confidence. Constantly reminding yourself to stay humble during times of success is paramount, if not, the market will make sure to humble you. Handling winning periods properly can be just as important as handling losing periods.

Trading Confidence: A Summary

This article has outlined several pointers that assist traders in building trading confidence. Traders need to recognize these different aspects of the trading process and should not disregard their impact. Controlling every aspect of the trading process is unrealistic, however making a concerted effort to manage the aspects you can control can provide you with a psychological advantage in the market.

The CPI and Forex: How CPI Data Affects Currency Prices

The CPI and Forex: How CPI Data Affects Currency Prices

What is CPI and why does it matter to forex traders?

The Consumer Price Index, better known by the acronym CPI, is an important economic indicator released on a regular basis by major economies to give a timely glimpse into current growth and inflation levels.

Inflation tracked through CPI looks specifically at purchasing power and the rise of prices of goods and services in an economy, which can be used to influence a nation’s monetary policy.

CPI is calculated by averaging price changes for each item in a predetermined basket of consumer goods, including food, energy, and also services such as medical care.

It is a useful indicator for forex traders due to its aforementioned effect on monetary policy and, in turn, interest rates, which have a direct impact on currency strength. The full utility of knowing how to interpret CPI as a forex trader will be explored below.

CPI release dates

CPI release dates usually occur every month, but in some countries, such as New Zealand and Australia, quarterly. Some nations also offer yearly results, such as Germany’s index. The US Bureau of Labor Statistics has reported the CPI monthly since 1913.

The following table shows a selection of major economies and information about their CPI releases.

Country/jurisdiction Compiling body Frequency of releases
Australia Australian Bureau of Statistics Quarterly
Canada Statistics Canada Monthly
China National Bureau of Statistics of China Monthly
Eurozone European Central Bank Twice monthly
Germany Federal Statistical Office of Germany Monthly, yearly
Italy Istat Monthly
India Ministry for Statistics and Programme Implementation Monthly
Japan Statistics Japan Monthly
UK Monetary Policy Committee Monthly
US US Bureau of Labor Statistics Monthly

Why forex traders should follow CPI data

Understanding CPI data is important to forex traders because it is a strong measure of inflation, which in turn has a significant influence on central bank monetary policy.

So how does CPI affect the economy? Often, higher inflation will translate to higher benchmark interest rates being set by policymakers, to help dampen the economy and subdue the inflationary trend. In turn, the higher a country’s interest rate, the more likely its currency will strengthen. Conversely, countries with lower interest rates often mean weaker currencies.

The release and revision of CPI figures can produce swings in a currency’s value against other currencies, meaning potentially favorable volatility from which skilled traders can benefit.

Also, CPI data is often recognized as a useful gauge of the effectiveness of the economic policy of governments in response to the condition of their domestic economy, a factor that forex traders can consider when assessing the likelihood of currency movements.

The CPI can also be used in conjunction with other indicators, such as the Producer Price Index, for forex traders to get a clearer picture of inflationary pressures.

What to consider when trading forex against CPI data

When using CPI data to influence forex trading decisions, traders should consider the market expectations for inflation and what is likely to happen to the currency if these expectations are met, or if they are missed.

Similar to any major release, it may be beneficial to avoid having an open position immediately before. Traders might consider waiting for several minutes after the release before looking for possible trades, since forex spreads could widen significantly right before and after the report.

Below is a chart displaying the monthly inflation rates for the US. For the latest month, expectations are set at 1.6% inflation compared to last year’s data. If CPI is released higher or lower than expectations this news event does have the ability to influence the market.
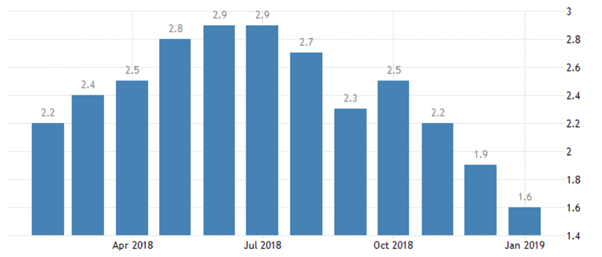
Chart to show US inflation levels in 2018/19. Source: TradingEconomics.com. US Bureau of Labor Statistics

One way the effects of CPI data can be interpreted is by monitoring the US Dollar Index, a 2018/19 example chart for which is below. If CPI is released away from expectations, it is reasonable to believe this may be the catalyst to drive the Index to fresh highs, or to rebound from resistance.

Since the Index is comprised of EUR/USD, USD/JPY, and GBP/USD, by watching the US Dollar we can get a full interpretation of the events outcome.
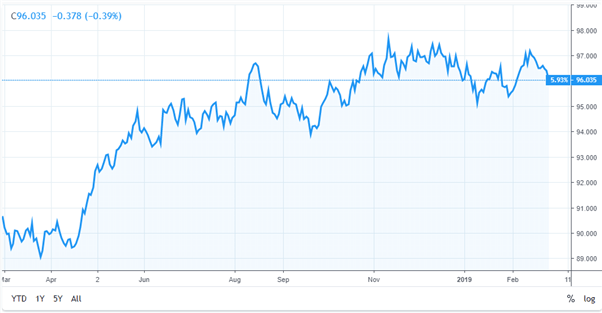
Chart to show movement in the US Dollar Index. Source: TradingView.com

As can be observed in the example above, as inflation rose during the first half of 2018, the US Dollar Index went up accordingly. But with US inflation drifting lower in the following months and with a missed target of 2%, this pushed US interest rate hikes off the agenda. As a result, the dollar struggled and weakened against a basket of other currencies.

Not every fundamental news release works out through price as expected.

Once the CPI data has been released and analyzed, traders should then look to see if the market price is moving through or rebounding off any areas of technical importance. This will help traders understand the short-term strength of the move and/or the strength of technical support or resistance levels, and help them make more informed trading decisions.

British Pound (GBP/USD) Latest – Cable Under Pressure as Gilt Yields Slide

British Pound (GBP/USD) Latest – Cable Under Pressure as Gilt Yields Slide

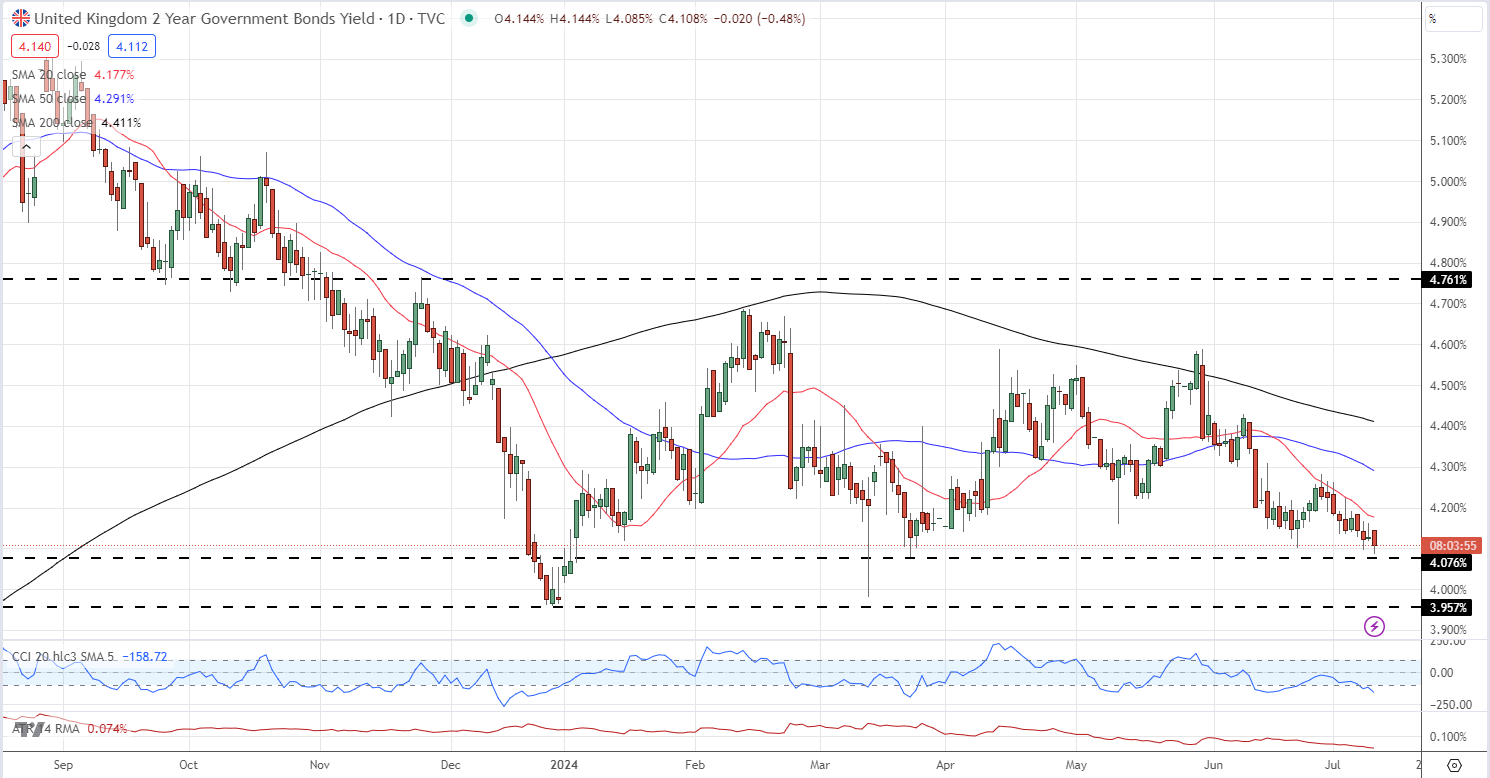
UK government borrowing costs are declining as investors anticipate lower interest rates. The 2-year gilt yield is approaching levels not seen in over three months, reflecting market expectations of two 25 basis point rate cuts this year. Investors are projecting the first reduction at the Bank of England’s September meeting. Additionally, the current political stability is contributing to downward pressure on gilt yields, despite long-term concerns about potentially increased borrowing under the new Labour government.

image1.png

A break and open below the March 22nd low at just under 4.08% should open the way for the 2-year gilt yield to test 4.0% and then 3.96%.

US 2-Year Gilt Yield

image2.png

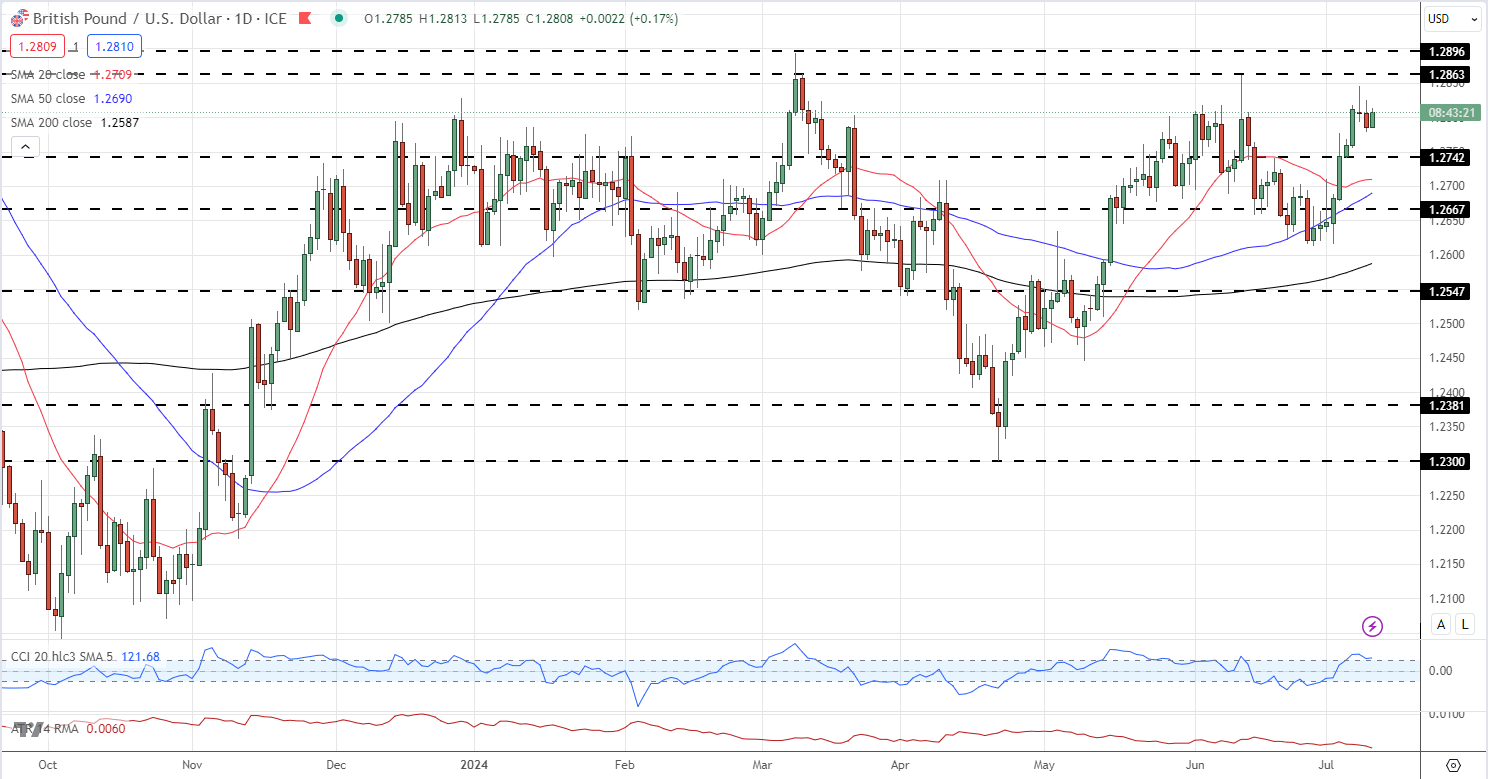
GBP/USD remains around the 1.2800-1.2850 area ahead of Thursday’s US CPI release. Cable tested, and quickly rejected the early June 1.2863 level on Monday and now needs a catalyst if it is to break higher. All three simple moving averages remain positive. Initial support is seen around 1.2750.

GBP/USD Daily Chart

image3.png

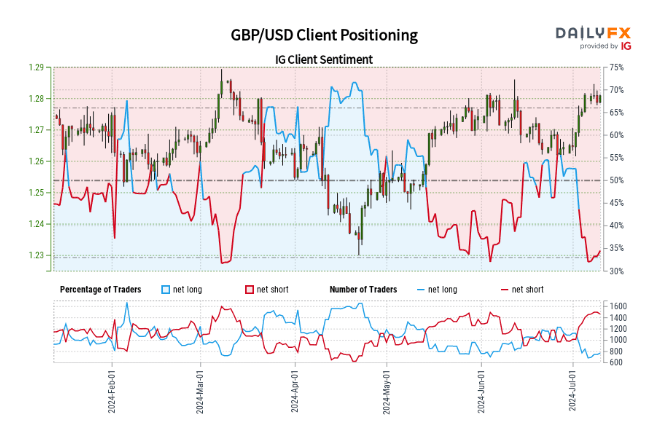
Retail trader data shows 34.93% of traders are net-long with the ratio of traders short to long at 1.86 to 1.The number of traders net-long is 2.01% higher than yesterday and 19.14% lower from last week, while the number of traders net-short is 3.39% lower than yesterday and 15.61% higher from last week.

We typically take a contrarian view to crowd sentiment, and the fact traders are net-short suggests GBP/USD prices may continue to rise. Positioning is less net-short than yesterday but more net-short from last week. The combination of current sentiment and recent changes gives us a further mixed GBP/USD trading bias.

image4.png

GBP/USD Bullish
The New York Session: Forex Trading Tips

The New York Session: Forex Trading Tips

What time does the New York Forex Session Open?

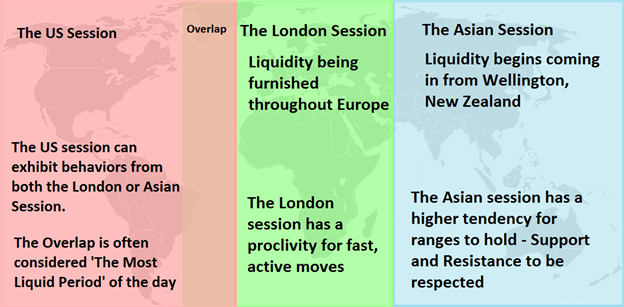
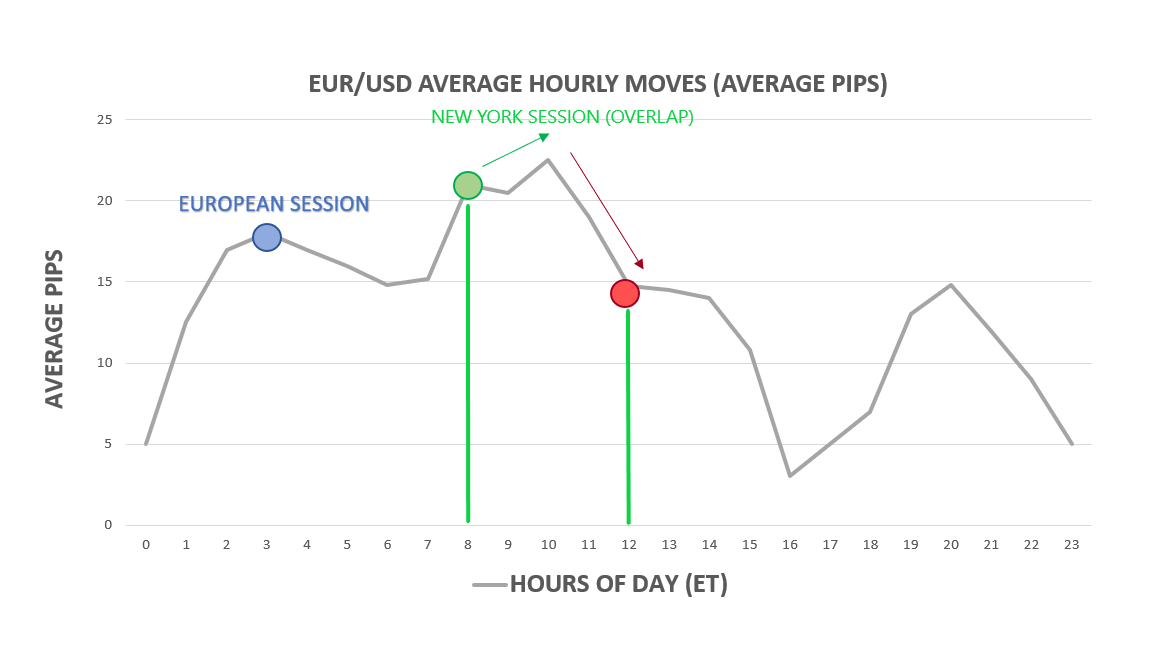
The New York forex session opens at 8:00 AM ET and closes at 5:00 PM ET. The ‘overlap’ occurs when the US Forex session overlaps with the London forex market session. The London Forex market session opens at 3:00 AM ET and closes at 12:00 PM ET, so the overlap occurs between 8:00 AM ET and 12:00 PM ET.

During this overlap, the US session could trade very much like the London session.

Forex market hours showing US Session and London Session overlap

The beginning of the New York session is normally more volatile than later in the day. There are different methods traders can use to trade differing levels of volatility.

New York Breakout Strategy: Trading the ‘Overlap’

The ‘overlap’ is when the London and US forex sessions literally overlap each other. These are the two largest market centers in the world, and during this four-hour period – large and fast moves can be seen during the overlap as a large amount of liquidity enters the market.

The image below shows how during the overlap (between the green lines) of the two biggest markets, average hourly moves in the EUR/USD reach highs.

Average hourly moves by hour of day in EUR/USD. US Forex market session

To trade the overlap, traders can use a break-out strategy which takes advantage of the increased volatility seen during the overlap.

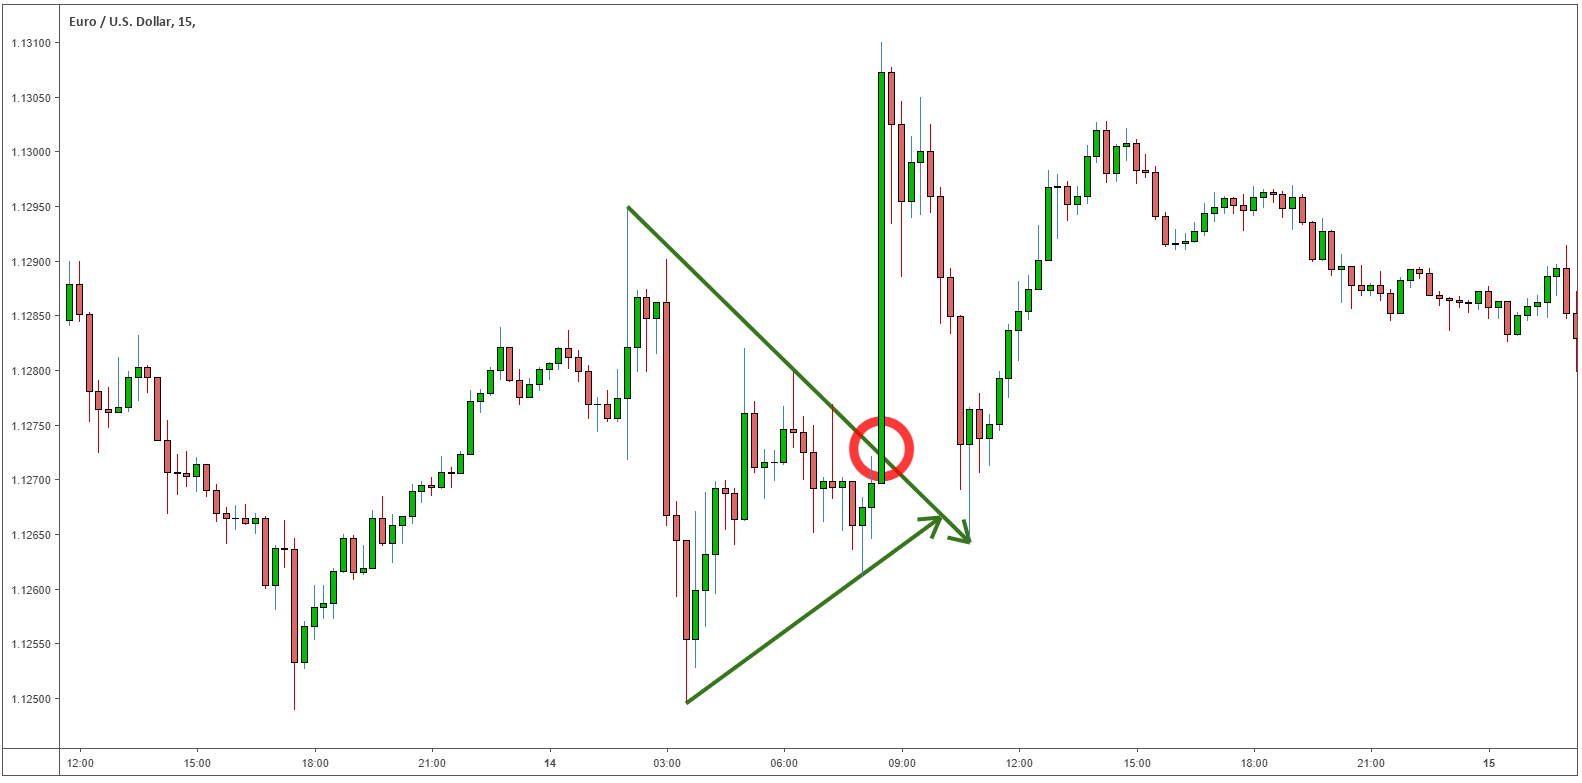
An example of the New York breakout strategy, using the EUR/USD, is shown below:

The EUR/USD formed a triangle-pattern which, during the overlap, the price of the EUR/USD broke out of. Once a trader has properly addressed risk management, the entry into the trade can be staged with any relevant mechanism of support and/or resistance.

EUR/USD New York Breakout Strategy

Trading the later part of the New York session

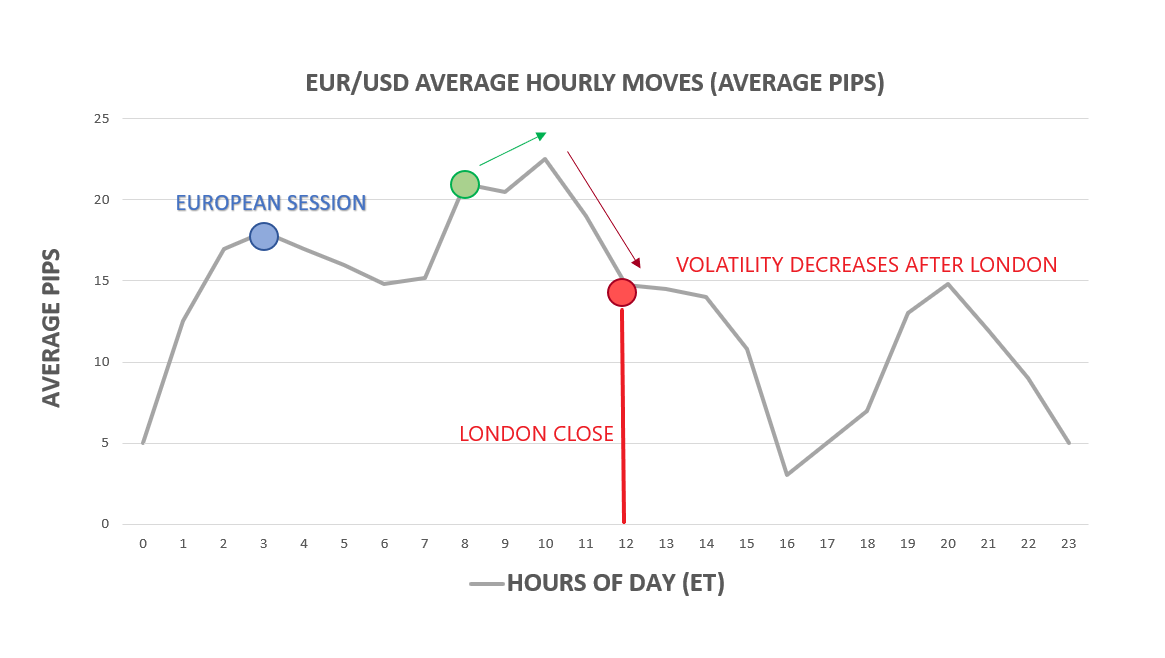
As London closes for the day, volatility will have a tendency to decrease drastically. From the same chart we looked at above, that showed the average hourly moves by hour of day in EUR/USD, we can see a markedly different tone in the average hourly move for the later portion of the US forex trading session:

Average hourly moves by hour of day in EUR/USD

As you can see, the later part of the New York session displays less volatility. Since the average hourly moves are smaller in the later stages of the New York session traders could use a different trading strategy, like a range trading strategy.

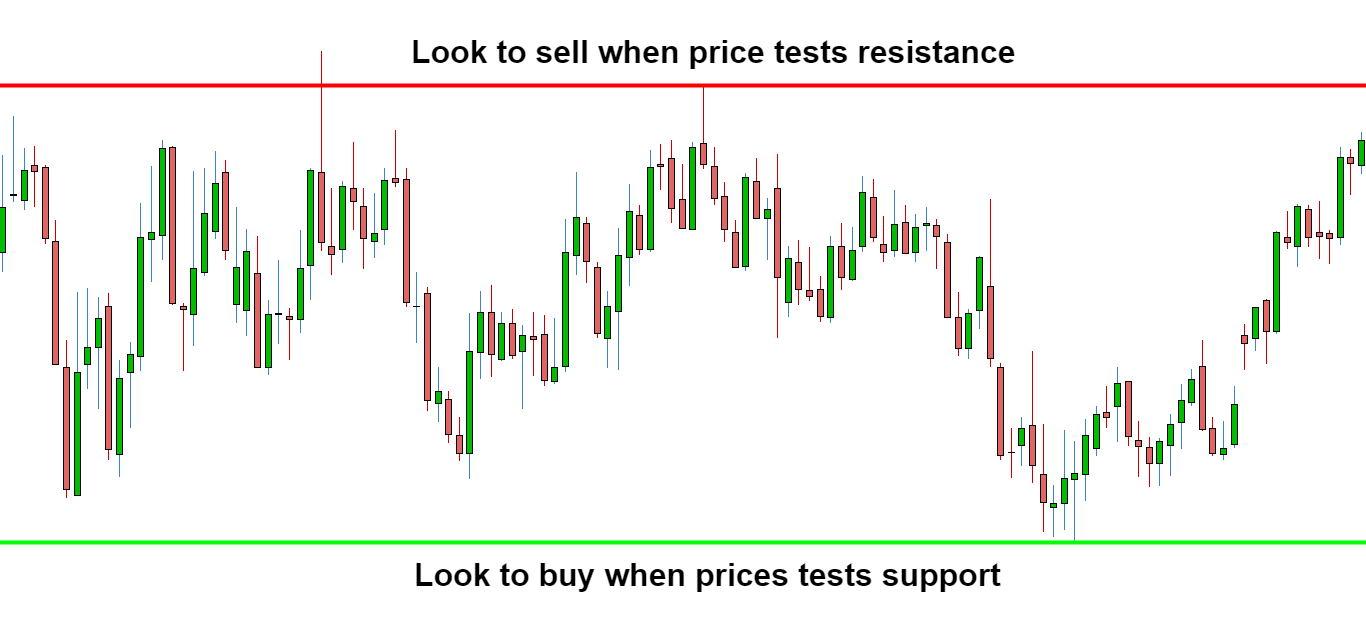
Using a range trading strategy trader take advantage of support and resistance levels. The chart below shows an example of a range trading strategy. When the price moves the upper bound (red line) traders will look to short the currency pair. When the price moves the lower bound (the green line) traders will look to buy the currency pair.

The logic behind using a range trading strategy is that as the volatility lowers, the levels of support and resistance may be harder to break and will therefore more likely hold- benefiting the range bound trading strategy.

Range bound trading strategy

Best FX pairs to trade during the New York session

The best forex pairs to trade during the New York session would be your majors, like EUR/USD, USD/JPY, GBP/USD, EUR/JPY, GBP/JPY, and USD/CHF. These pairs will be the most liquid during the US session, especially the EUR/USD during the overlap.

Each forex trading session has unique characteristics, the London forex trading session follows the New York session which is then followed by the Asia trading session.

The liquidity will lead to reduced spreads and therefore, lower trading costs. During the overlap, the combination of increased volatility and increased liquidity will be beneficial to most forex traders.

#AMWL 1-for-20 Reverse Stock Split

#AMWL 1-for-20 Reverse Stock Split

Dear clients,

We inform you about the upcoming changes in the parameters of the #AMWL trading instrument due to the forthcoming reverse split of Amwell shares.

Amwell is planning a 1-for-20 stock consolidation, a strategic move to comply with the New York Stock Exchange (NYSE). The stock consolidation, effective at the close of the trading session on July 10, 2024, is intended to increase Amwell’s stock price above the minimum average closing price of $1 set by the NYSE.

In this regard, the #AMWL share price at the time of the reverse split will be increased in proportion to the consolidation by 20 times.

If you have open positions in #AMWL, please keep in mind that:

  • The volume of open positions at the moment of reverse split will be reduced proportionally to the consolidation of shares by 20 times.
  • The entry price for open positions will be increased at the moment of reverse split proportionally to consolidation of shares by 20 times.
  • Stop Loss / Take Profit orders for open positions will be removed at the time of the reverse split.
  • All pending orders (Buy Limit, Sell Limit, Buy Stop, Sell Stop, Buy Stop Limit, and Sell Stop Limit) will be removed at the time of the reverse split.
  • Current open positions can be closed as usual without any additional restrictions.

Updated parameters for #AMWL shares will become effective at the market open on July 11, 2024.

Please take this information into consideration when making trading decisions and readjust your Expert Advisors if necessary.

If you have any questions, please contact LiteFinance’s client support via LiveChat.

Yours faithfully,

LiteFinance team

Australian Dollar – AUD/USD and AUD/JPY Latest Sentiment Analysis

Australian Dollar – AUD/USD and AUD/JPY Latest Sentiment Analysis

AUD/USD Retail Sentiment

image1.png

Recent retail trader data indicates a significant shift in market positioning for the AUD/USD currency pair. Currently, 42.16% of traders hold net-long positions, resulting in a short-to-long ratio of 1.37 to 1. This represents a 2.54% increase in net-long traders compared to yesterday, but an 8.16% decrease from last week. Conversely, the number of net-short traders has decreased by 1.41% since yesterday but surged by 25.16% compared to last week.

Our analysis typically adopts a contrarian approach to crowd sentiment. Given the current net-short trader positioning, this suggests potential upward movement for AUD/USD prices. However, the situation is nuanced. While positioning is less net-short than yesterday, it remains more net-short than last week. This combination of current sentiment and recent changes presents a mixed trading bias for AUD/USD.

AUD/USD Daily Chart

image2.png

AUD/JPY Retail Sentiment

image3.png

Recent retail trader data for AUD/JPY reveals significant market positioning shifts. Currently, 26.37% of traders hold net-long positions, resulting in a short-to-long ratio of 2.79 to 1. This represents a substantial 21.74% increase in net-long traders compared to yesterday and a remarkable 34.62% increase from last week. Conversely, net-short traders have decreased by 2.74% since yesterday and 1.26% compared to last week.

Our analysis typically adopts a contrarian approach to crowd sentiment. The current net-short trader positioning suggests potential upward movement for AUD/JPY prices. However, the situation is nuanced. Despite traders remaining net-short, they are less so than yesterday and last week. This recent shift in sentiment indicates that the current AUD/JPY price trend may soon reverse lower.

AUD/JPY Weekly Chart

image4.png

AUD/JPY Bearis
How to Use Bollinger Bands in Forex Trading

How to Use Bollinger Bands in Forex Trading

Bollinger Bands® are utilised by technical traders in all financial markets including forex. This article will introduce Bollinger Bands® and how they assist traders in technical analysis. It will also provide an overview of top strategies and tips for trading forex with Bollinger Bands® – including trading the trend and the Bollinger squeeze.

What are Bollinger Bands® and how to do they work?

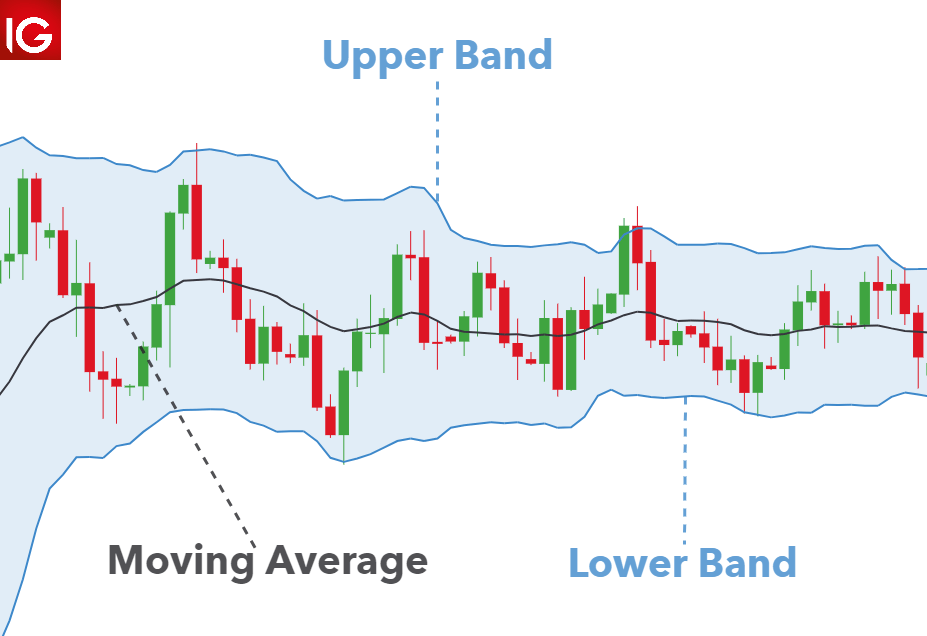
Bollinger Bands® are a versatile technical analysis indicator widely used among traders. John Bollinger first developed this indicator as a solution to find relative highs and lows in dynamic markets. The indicator itself is comprised of an upper band, lower band and moving average line.

The two trading bands are placed two standard deviations above and below the moving average (usually 20 periods). Using two standard deviations estimates that 95% of price data will be contained within the two bands.

bollinger band plotted around a 20-day moving average

As a rule of thumb, prices are deemed overbought on the upside when they touch the upper band and oversold on the downside when the reach the lower band.

As price oscillates between the indicators upper and lower extremes Bollinger Bands® become an excellent tool to gauge volatility. When bands contract there is less volatility in the market, which is a great indication to use a range bound strategy. Likewise, Bollinger Bands® will expand as the market becomes more volatile. At these times traders may employ a breakout or a trend-based strategy.

How to trade Forex with Bollinger Bands®

There are several different techniques involved in using Bollinger Bands® to trade the forex markets. The most popular are:

1) Using market trends: Traders can identify entry signals using the bands as a measure of support and resistance.

2) Bollinger Squeeze: Applying the volatility indications of the bands

1) Trading the trend

EUR/USD weekly chart

trading the trend with the Bollinger Band

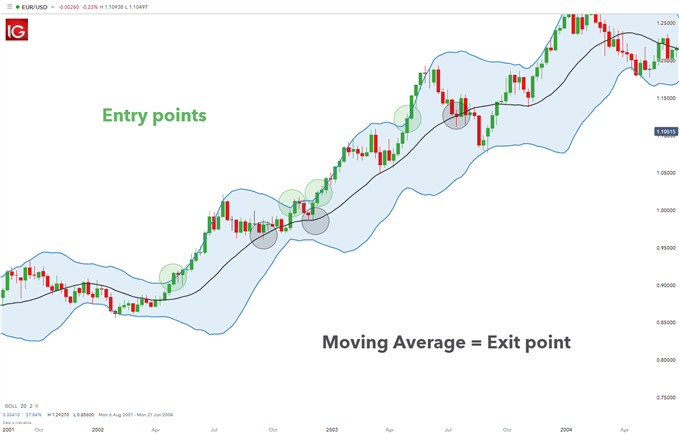
The chart above shows the EUR/USD chart in an uptrend – depicted by higher highs and higher lows. Using the Bollinger Band® indicator, the lower band is seen as a gauge of support. When price touches the lower band, traders use this as a signal to enter a long (buy) trade. This strategy works for both uptrends and downtrends. Take profit (limit) levels are generally taken from the upper and lower bands depending on trend. In this example, the upper band will be used as the take profit level.

In summary, trading the trend with Bollinger Bands® is relatively simple:

  • Identify the trend
  • Use upper and lower bands in conjunction with price movement to identify entry points
  • Use respective upper and lower band as target levels

2) Trading the Bollinger Band® Squeeze

EUR/USD weekly chart:

Bollinger Band squeeze

As mentioned previously, when the bands contract volatility is low and vice versa. The Bollinger squeeze looks for breakouts above/below the band depending on trend to be used as entry signs.

Highlighted in green shows these breakouts in an uptrend. Traders will look to enter at the indicated green circles. After each entry, it can be seen that the candles are ‘walking the Bollinger‘ (following the upper band). After the breakout candle the bands expand implying greater volatility in the market.

The black shaded circles illustrate the point at which traders will look to take profit before looking for further breakout signals.


What is Leverage in Forex? Forex Leverage Explained

What is Leverage in Forex? Forex Leverage Explained

Many people are attracted to forex trading due to the amount of leverage that brokers provide. Leverage allows traders to gain more exposure in financial markets than what they are required to pay for. Traders of all levels should have a solid grasp of what forex leverage is and how to use it responsibly. This article explains forex leverage in depth, including how it differs to leverage in stocks, and the importance of risk management.

Leverage in forex fulchrum example showing margin and full trade size

What is leverage in forex trading?

Leverage in forex is a useful financial tool that allows traders to increase their market exposure beyond the initial investment (deposit). This means a trader can enter a position for $10,000 worth of currency and only need $1000, in a ten-to-one leverage scenario. However, it is essential to know that gains AND losses are magnified with the use of leverage. In adverse market scenarios, a trader using leverage might even lose more money than they have as deposit.

Leverage of ten-to-one means that traders can gain exposure to a notional value or trade size, ten times more than the deposit/margin that is required to fund the trade. This can be thought of in a similar fashion to putting a 10% deposit down on a house; you gain access to the entire house while only funding 10%of the full value.

Leverage is usually expressed as a ratio:

Leverage expressed in words Leverage expressed as a ratio
Ten-to-one 10:1
Thirty-to-one 30:1
Fifty-to-one 50:1

The amount of forex leverage available to traders is usually made available through your broker and the amount of leverage will vary according to regulatory standards that preside in different regions.

Leverage in forex vs leverage in shares

Forex leverage differs to the amount of leverage that is offered when trading shares. This is due to the fact that the major FX pairs are liquid and typically exhibit less volatility than even the most frequently traded shares. As a result, hedging risk and getting in and out of trades is more manageable in the $5.1 trillion a day FX market.

How is forex leverage calculated?

Traders require the following to calculate leverage:

  • The notional value of the trade (trade size)
  • The margin percentage

Brokers often provide traders with a margin percentage to calculate the minimum equity needed to fund the trade. Margin and deposit can be used interchangeably. Once you have the margin percentage, simply multiply this with the trade size to find the amount of equity needed to place the trade.

Equity = margin percentage x trade size

To calculate leverage, simply divide the trade size by the required equity.

Leverage = trade size/ equity

Forex leverage example

Below is a typical example of how to calculate leverage using the above formulas:

  • Trade size: 10 000 units of currency (one mini contract on USD/JPY with a trade size equal to $10 000)
  • Margin percentage: 10%

Equity = margin percentage x trade size

0.1 x $10 000

=$1 000

Leverage = trade size/ equity

$10 000 / $1 000

= 10 times or 10:1

The example highlights the basics of how forex leverage is used when entering a trade. However, it must be noted that traders should not simply calculate the minimum amount needed to enter a trade and then fund the account with that exact amount. Traders must be mindful of margin calls if the position moves in the opposite direction, bringing the account equity below an acceptable level determined by the broker.

Trading forex with leverage has the potential to produce large losses. We have calculated a typical scenario of how the use of excessive leverage can impact a trading account and tabulated the results.

How to manage forex leverage risk

Leverage can be described as a two-edged sword, providing both positive and negative outcomes for forex traders. This is why it is essential to determine the appropriate effective leverage and incorporate sound risk management.

Top traders make use of stops to limit their downside risk when trading forex. At DailyFX we recommend risking no more than 1% of the account equity on any single trade and no more than 5% of the account equity for all open trades at any point in time.

Furthermore, successful traders make use of a positive risk-to-reward ratio in an attempt to achieve higher probability trades over time.

It is vital to avoid mistakes with leverage; to understand how to avoid other issues traders might face check our Top Trading Lessons guide.