Silver Price Forecast: XAG/USD rises gradually to $30.50 ahead of China’s third Plenum outcome

Silver Price Forecast: XAG/USD rises gradually to $30.50 ahead of China’s third Plenum outcome

Silver price (XAG/USD) moves higher to near $30.50 in Thursday’s European session. The white metal recovers ahead of China’s third plenum meeting outcome on Friday. Investors expect that China’s Communist Party will take measures to boost economic growth through fiscal and monetary policy expansion.

The World’s second-largest economy, which is a major consumer of Silver, which has applications in various sectors, is battling weak Gross Domestic Product (GDP) growth. The Chinese economy expanded at a slower pace of 0.7%, from the estimates of 1.1% and the former release of 1.5%, downwardly revised from 1.6%.

Meanwhile, firm expectations for the Federal Reserve (Fed) to begin reducing interest rates from the September meeting have kept the US Dollar (USD) and bond yields on the back foot. Lower yields on interest-bearing assets reduce the opportunity cost of holding an investment in non-yielding assets, such as Silver.

Contrarily, the US Dollar Index (DXY) edges up to 103.80 and 10-year US Treasury yields rise to 4.17% but remain close to multi-month lows.

Higher speculation for Fed rate cuts in September was prompted by easing inflationary pressures and cooling labor market conditions. The United States (US) annual core inflation, which excludes volatile food and energy prices, decelerated for straight third month in June. In the same month, monthly headline inflation deflated for the first time in more than four years.

Silver technical analysis

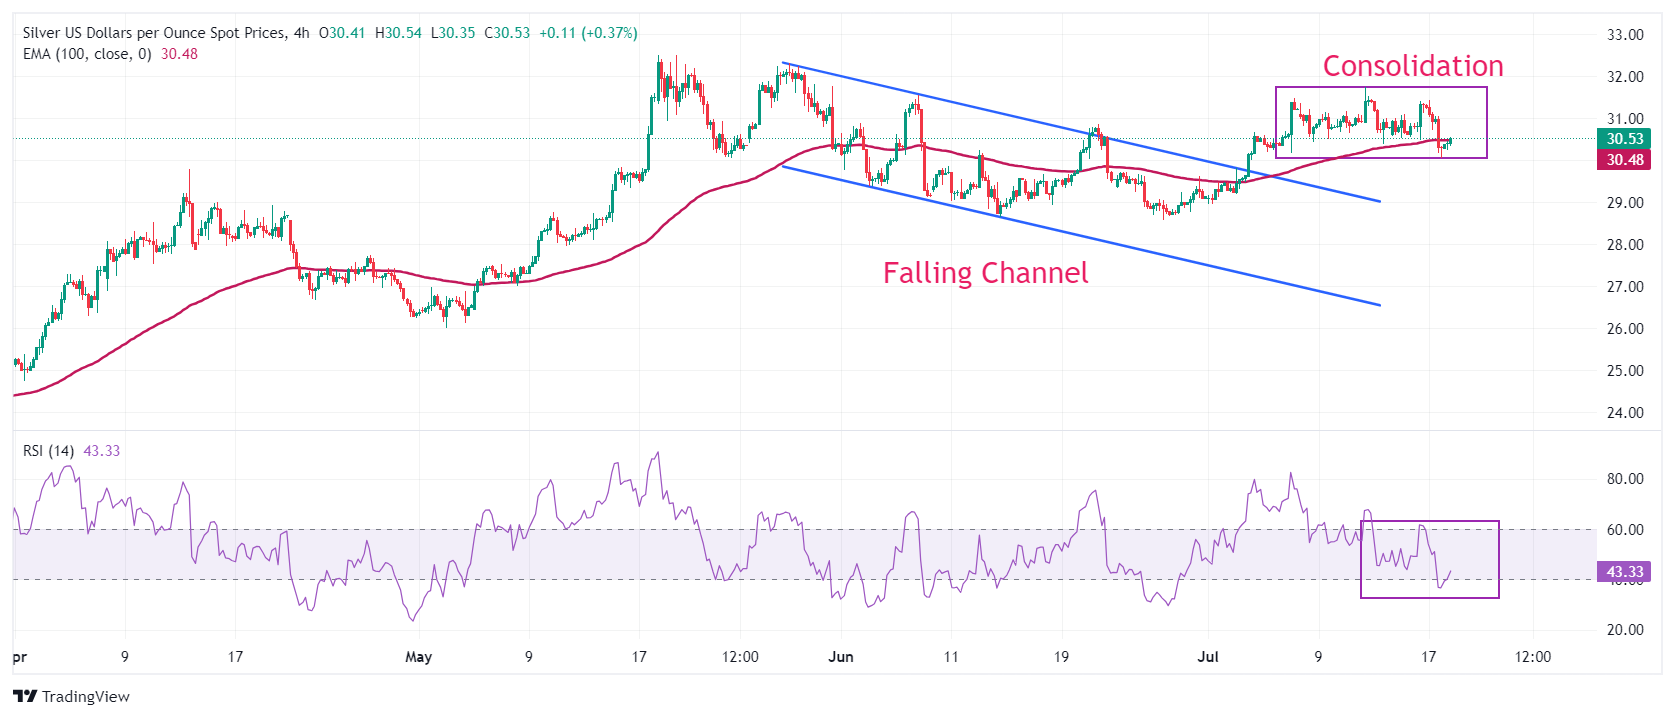
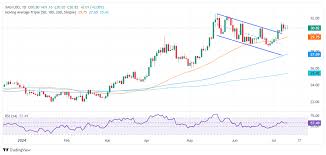
Silver price turns sideways in a range between $30.40-$30.80 for more than one week. The near-term outlook of the Silver price remains firm as the asset holds the breakout of the Falling Channel formation on a four-hour timeframe.

The 100-period Exponential Moving Average (EMA) near $30.50 continues to provide support to the Silver price bulls.

The 14-period Relative Strength Index (RSI) oscillates inside the 40.00-60.00 range, exhibiting indecisiveness among market participants.

Silver four-hour chart

Gold price holds position near all-time highs due to dovish Fedspeak

Gold price holds position near all-time highs due to dovish Fedspeak

Gold price (XAU/USD) edges higher to near $2,470 per troy ounce on Thursday, remaining close to record highs amid growing optimism that the Federal Reserve (Fed) will reduce rates in September. Lower interest rates make non-yielding assets like Gold more attractive to investors.

Federal Reserve officials have expressed increasing confidence that the pace of price increases is now more consistently aligning with policymakers’ goals. On Wednesday, Fed Governor Christopher Waller said that the US central bank is ‘getting closer’ to an interest rate cut. Meanwhile, Richmond Fed President Thomas Barkin stated that easing in inflation had begun to broaden and he would like to see it continue,” per Reuters. Traders will likely observe the US weekly Initial Jobless Claims and the Philly Fed Manufacturing Index on Thursday, along with the Fed’s Lorie Logan speech.

According to CME Group’s FedWatch Tool, markets now indicate a 93.5% probability of a 25-basis point rate cut at the September Fed meeting, up from 69.7% a week earlier.

The US Dollar Index (DXY), which measures the value of the US Dollar (USD) against the six other major currencies, rebounds due to improved US Treasury yields. The DXY trades around 103.80, with yields on 2-year and 10-year US Treasury bonds standing at 4.45% and 4.17%, respectively, at the time of writing. This scenario may limit the upside of the Gold prices.

EUR/USD consolidates below 1.0950 ahead of ECB policy announcements

EUR/USD consolidates below 1.0950 ahead of ECB policy announcements

EUR/USD turns sideways below 1.0950 in Thursday’s European session after rallying to a fresh four-month high on Wednesday. The pair trades with caution, as investors shift to the sidelines ahead of the European Central Bank policy meeting, which will be announced at 12:15 GMT.

EUR/USD seen facing the next upward obstacle at 1.0948 (July 17), followed by the March top of 1.0981 (March 8) and the psychological 1.1000 level.

If bears grab control, spot may test the 200-day SMA of 1.0808 before falling to the June low of 1.0666 (June 26). The loss of the May low of 1.0649 (May 1) leads to the 2024 bottom of 1.0601 (April 16).

Looking at the bigger picture, it appears that additional gains are on the way if the critical 200-day SMA is consistently surpassed.

So far, on the 4-hour chart, the uptrend appears quite solid for the time being. That said, the initial resistance is 1.0948, before 1.0981 and 1.1000. On the other side, the 55-SMA at 1.0861 is first, followed by the 200-SMA at 1.0791, and finally 1.0709. The relative strength index (RSI) climbed to approximately 68.

Microsoft’s Q4 Earnings Preview: Growth Momentum on Watch

Microsoft’s Q4 Earnings Preview: Growth Momentum on Watch

Microsoft’s Q4 Earnings Preview: Growth Momentum on Watch

When does Microsoft Corp report earnings?

Microsoft Corp is set to release its quarter four (Q4) financial results on 30 July 2024 (Tuesday), after the US market closes.

Microsoft’s earnings – what to expect

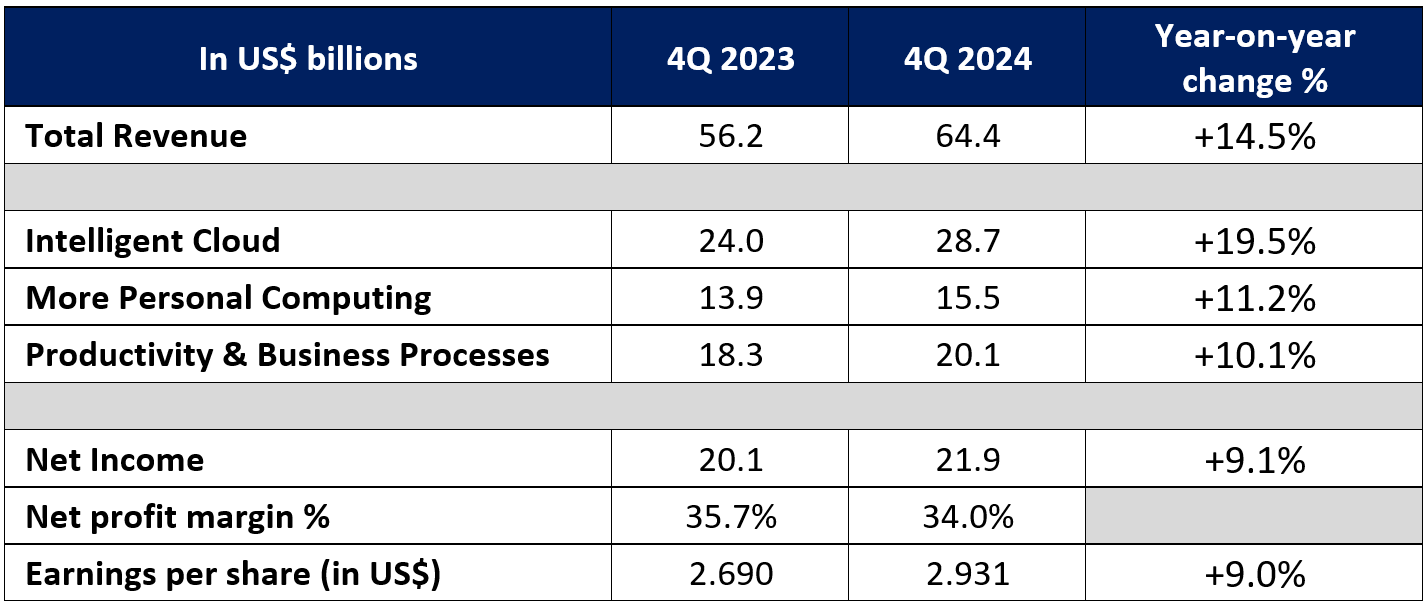
Market expectations are for Microsoft’s upcoming 4Q 2024 revenue to grow 14.5% year-on-year to US$64.4 billion, up from US$56.2 billion in 4Q 2023. This may mark a slowdown in year-on-year growth from the 17.0% delivered in 3Q 2024.

Earnings per share (EPS) is expected to increase 9% from a year ago to US$2.931, up from US$2.69 in 4Q 2023. Likewise, this may mark a softer read than the 20% year-on-year growth delivered in 3Q 2023.

Cloud segment remains on watch to drive earnings beat

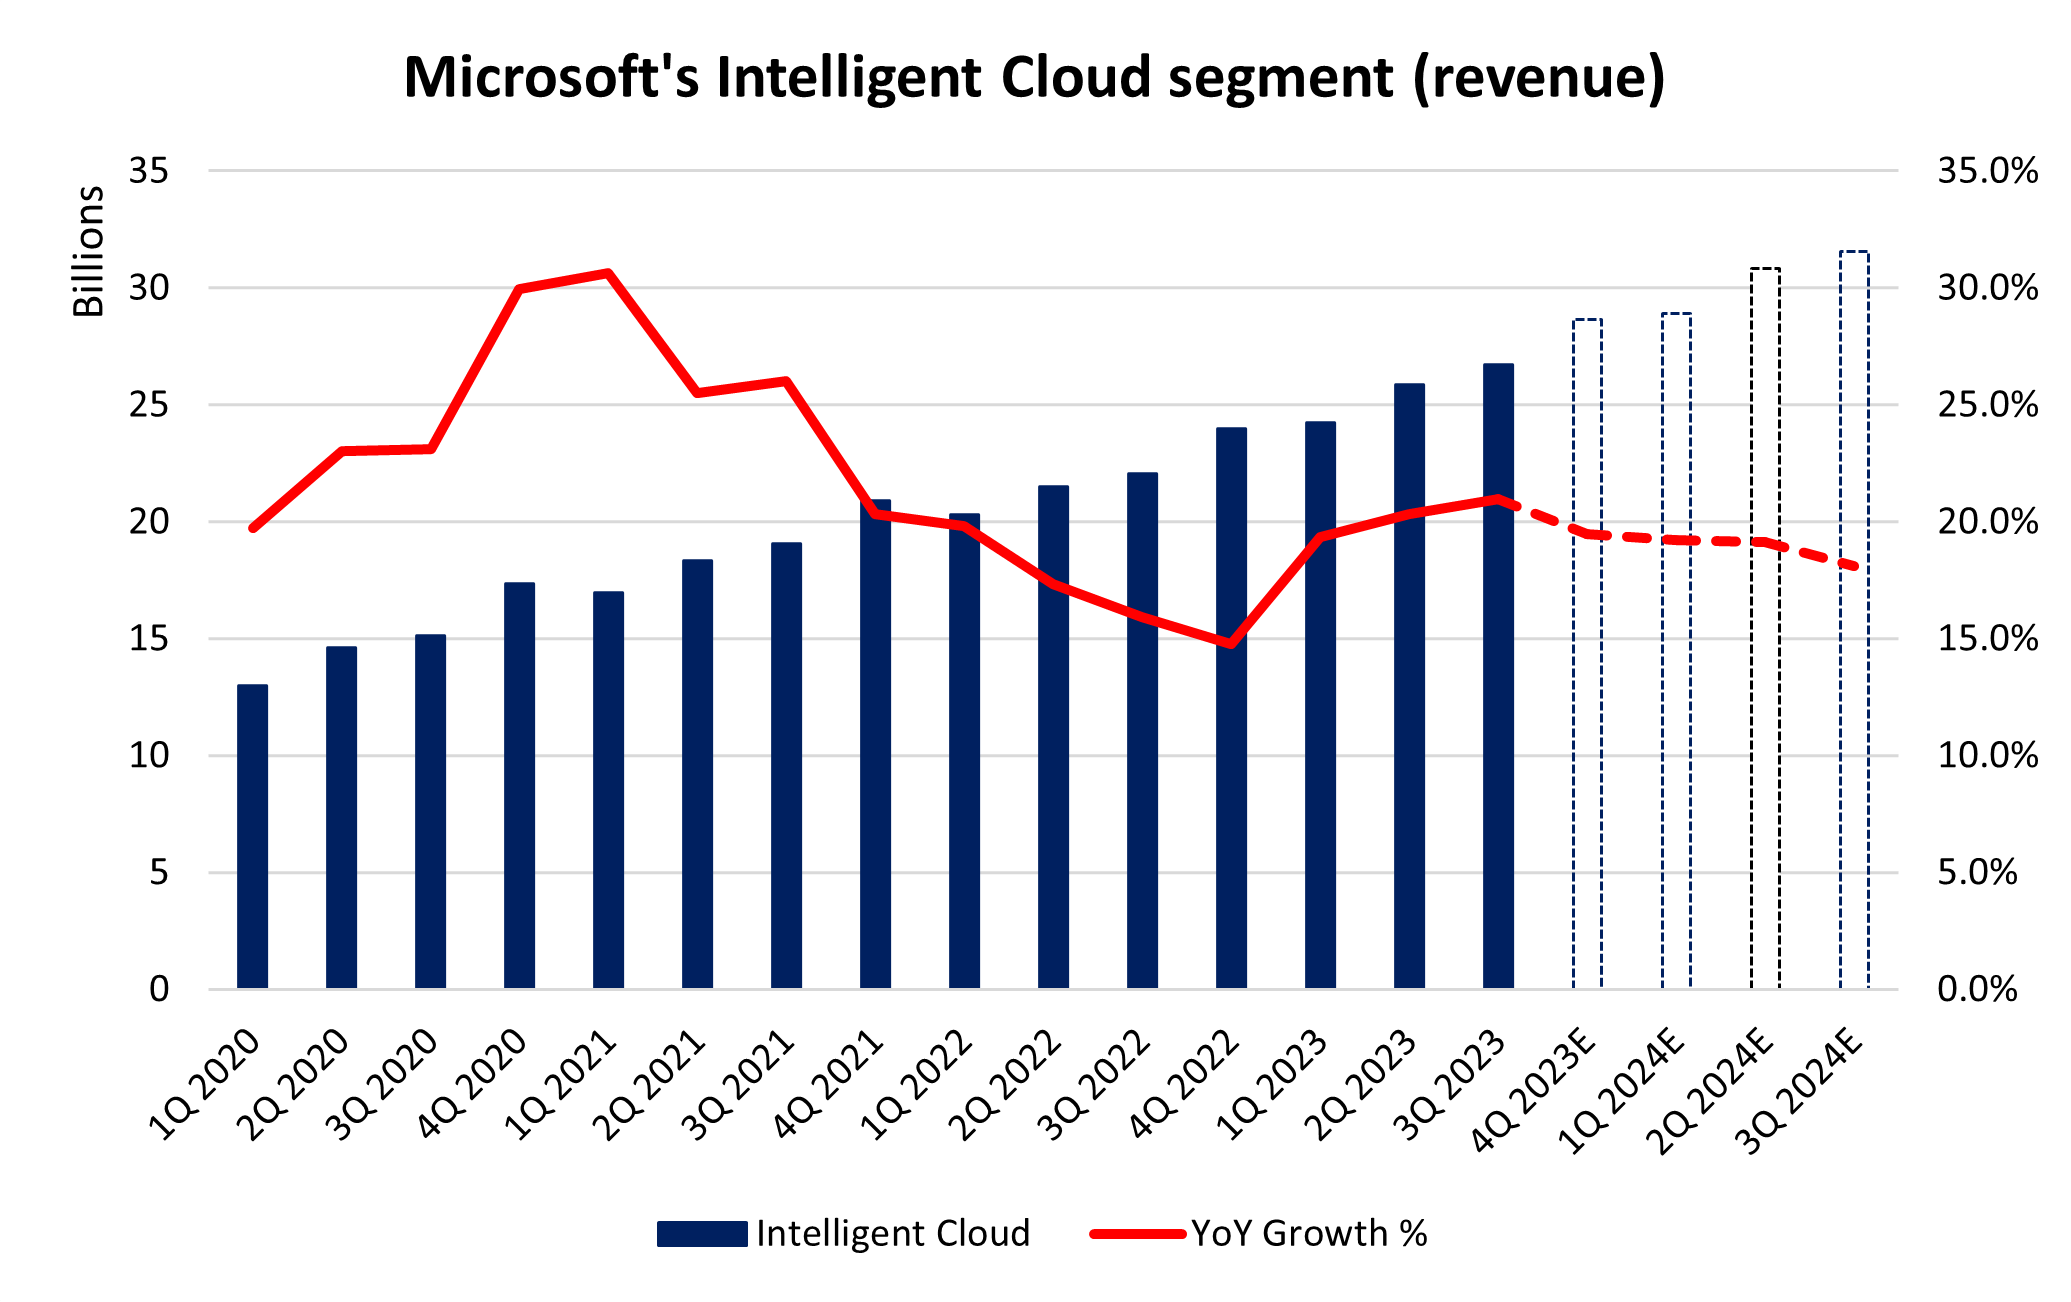
Microsoft’s Intelligent Cloud business remains as Microsoft’s highest-growth segment and accounts for 43% of its total revenue. For 4Q 2024, expectations are for the segment to grow 19.5% year-on-year to US$28.7 billion.

Previously, stronger-than-expected growth in this segment was one of the key reasons for the surge in Microsoft’s share price. During the quarter, Microsoft managed to improve its market share in the worldwide cloud infrastructure market to an all-time high of 25%, trailing just behind Amazon’s AWS at 31%.

That leaves little room for error ahead, given that a series of comments from Microsoft’s management team also seems to anchor expectations for the strong momentum in the adoption of Azure AI services to continue.

The management previously highlighted that the number of Azure AI customers continues to grow, average spend continues to increase and there is an “acceleration of revenue from migrations to Azure”. More famously, Chief Financial Officer Amy Hood said then that “near-term AI demand is a bit higher than available capacity”.

Product differentiators firing on all fronts previously. Growth momentum on watch.

Continued growth in several product offerings will remain on the lookout. Azure Arc, which allows its customers to run Azure services anywhere (across on-premises and multi-cloud platforms), has been up two-fold in the previous quarter to 33,000 customers.

New AI features have boosted LinkedIn premium growth, with revenue up 29% year over year previously. GitHub revenue has accelerated to over 45% year-over-year as well, fuelled by a surge in GitHub Copilot adoption. Microsoft Fabric, which is its next-generation analytics platform, has over 11,000 paid customers. Copilot in Windows is also available on nearly 225 million Windows 10 and Windows 11 PCs, up two times quarter-on-quarter.

Mass adoption of these features are likely to persist, with investors to keep a lookout on the growth progress ahead.

Cost pressures in focus amid cloud and AI infrastructure investments

In the previous quarter, Microsoft stated that it expects capital expenditures to increase “materially on a sequential basis” as a result of increased cloud and AI infrastructure investments. However, markets took comfort with the company’s guidance that despite the significant investments, FY 2024 operating margins will still up over 2 points year-on-year while FY 2025 operating margins will only be down only about 1 point year-over-year.

Any resilience in the company’s margins will be cheered. Market participants will also want to be assured that the huge investment cost outlay will be able to scale into profitable features quickly, rather than a long-term kind of a move. One may recall how Meta’s share price tumbled as much as 19% in its previous earnings release as investors did not buy into the company’s “long-term” investments in AI and the metaverse.

Other key segments may stabilize at double-digit growth

Microsoft’s “personal computing” segment has surprised on the upside in 3Q 2024, driven by a better-than-expected performance in gaming and Windows OEM. Year-on-year growth may stabilise at 11.2% in 4Q 2024, with expectations for recovery to continue ahead in the low double-digit growth.

Likewise, the “productivity and business processes” segment may offer a stable growth of 10% year-on-year in 4Q 2024, further underpinned by average revenue per user (ARPU) growth from continued E5 momentum and early Copilot for Microsoft 365 progress.

Technical analysis – Microsoft’s share price trading within a rising channel

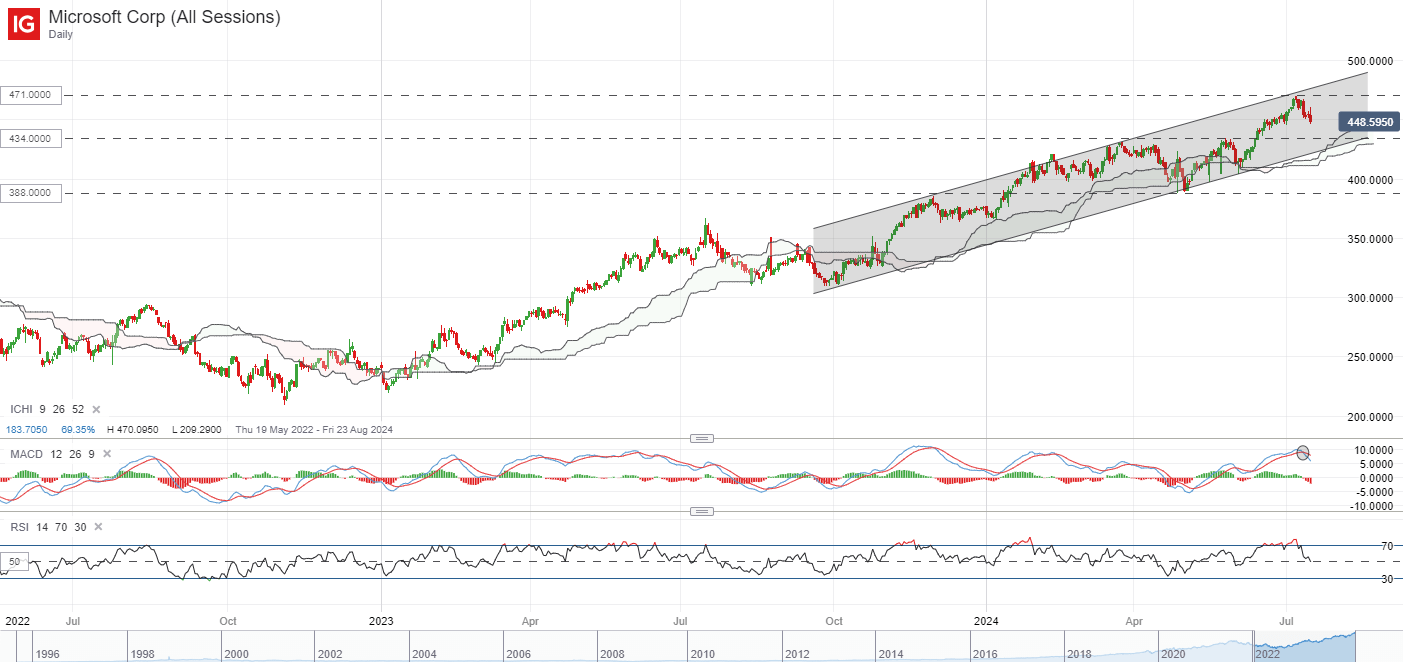
On the technical front, Microsoft’s share price has been trading within an upward trend, with a display of higher highs and higher lows since October 2023. A rising channel pattern seems to be in place, with recent interaction with the upper channel trendline at the US$471.00 level finding some near-term resistance. A bearish crossover was also presented in its daily moving average convergence/divergence (MACD), which may raise the odds of a near-term breather.

Any deeper retracement may leave the US$434.00 level on watch as a key support confluence to hold. That said, it will probably have to take much more to signal a wider trend change, potentially with a breakdown of the rising channel as an initial indication. Until that happens, the broader upward trend prevails, with immediate resistance to overcome at the US$471.00 level.


Japanese Yen Strengthens: Market Speculates over FX Intervention

Japanese Yen Strengthens: Market Speculates over FX Intervention

Yesterday’s report highlighted the drastic and sudden appreciation in the yen towards the end of last week which sent USD/JPY sharply lower – a theme that has continued this week, especially after today’s surge lower which has some parts of the market suspecting another smaller bout of FX intervention.

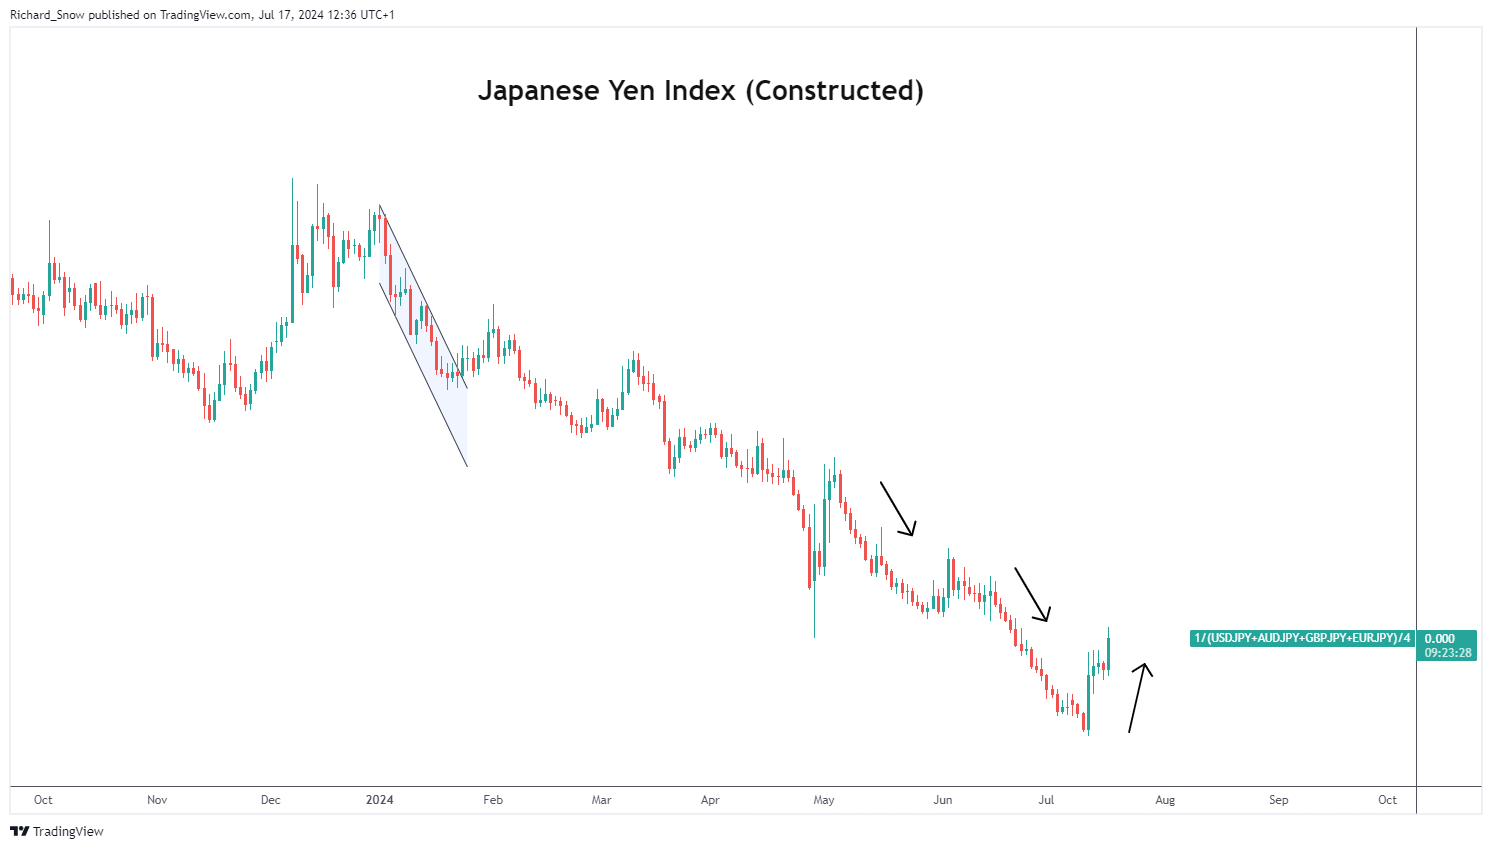
The Japanese Index below is a simple construction applying an equal weighting to the more commonly traded currency pairs, providing an indication of yen performance. The recent move higher has disturbed the otherwise steady downtrend – hinting at large scale yen purchases by Japanese officials, potentially.

Officials have preferred not to comment on questions around possible efforts to strengthen the local currency, hoping to dissuade speculators betting on a weaker yen.

Japanese Yen Index (equal weighting of USD/JPY, GBP/JPY, AUD/JPY and EUR/JPY)

A graph of a stock market  Description automatically generated

Despite mass yen purchases, Japanese currency officials have been unable to stop the yen’s decline which is more of a structural issue that appears via a large interest rate differential that remains in place to this day. The BoJ hiked earlier this year to pull interest rates out of negative territory but this did very little to overcome the massive gap between near zero rates in Japan and 5.25% in the US.

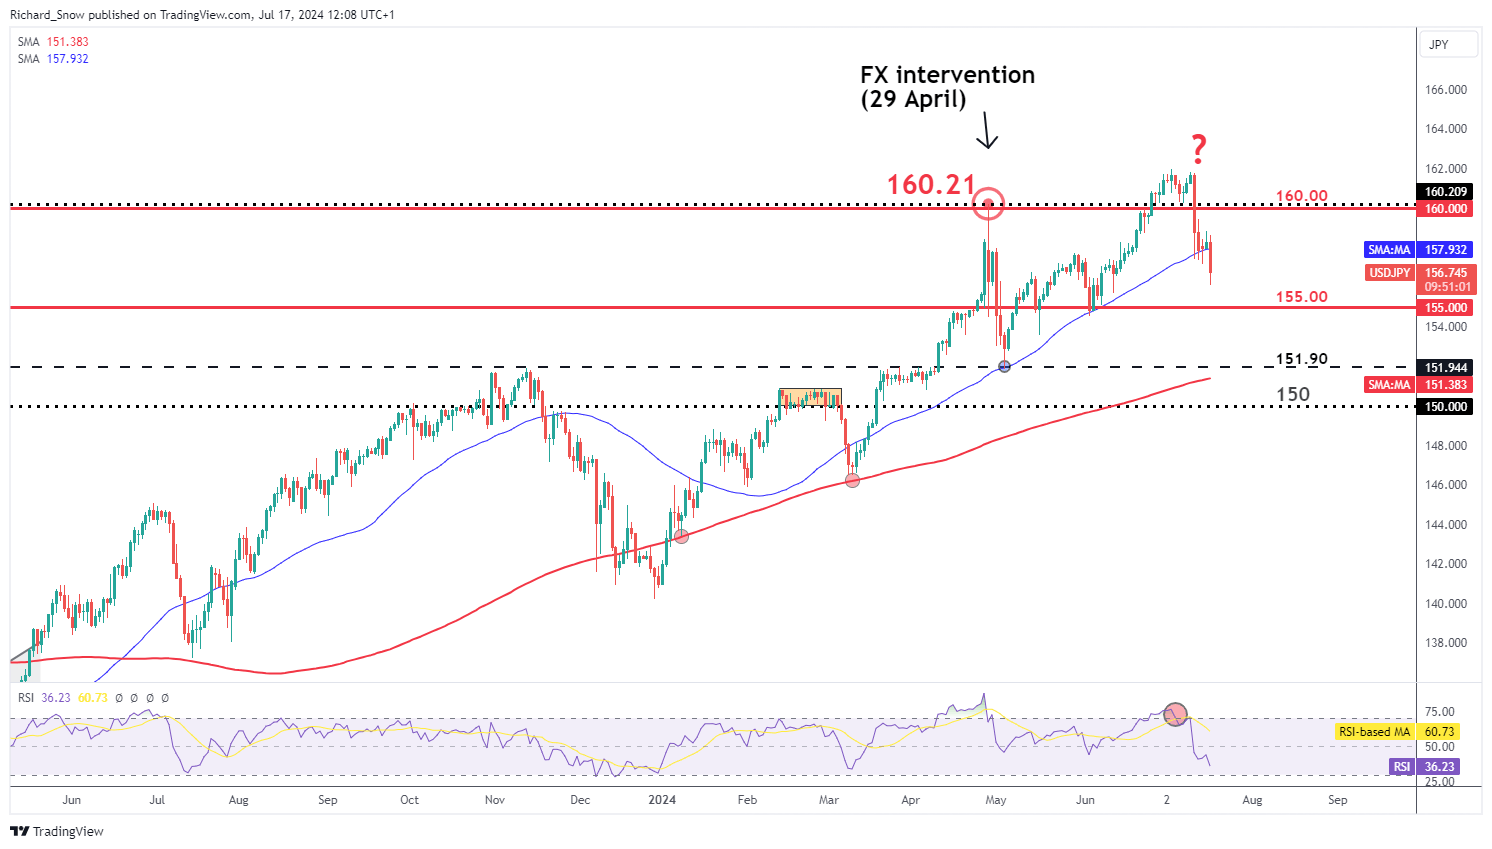
Today’s notable drop in USD/JPY has raised speculation of another round of yen purchases from Tokyo. After trading comfortably above 160.00, the pair now looks to 155.00 as the next level of support with 151.90 following thereafter.

Tokyo officials are hoping that the recent dollar decline can help extend the move lower in USD/JPY after lower US inflation has brightened the mood within the Fed’s ranks. Jerome Powell is encouraged by recent data and is looking for more of the same to achieve the necessary confidence to make that all important call to cut rates. Markets now fully price in a 25 basis point cut from the Fed in September – seeing the greenback depreciate against its peers.

The outlook for the yen remains precarious as it appears the strategy to keep the yen supported may have shifter to smaller, more frequent purchases instead of a massive, single transaction to sell dollars for yen. This is, of course, provided the recent volatility can be verified to have come at the instruction of Japan’s currency officials.

USD/JPY Daily Chart

A screenshot of a graph  Description automatically generated

Top 8 Forex Trading Strategies and their Pros and Cons

Top 8 Forex Trading Strategies and their Pros and Cons

What is a Forex Trading Strategy?

A forex trading strategy defines a system that a forex trader uses to determine when to buy or sell a currency pair. There are various forex strategies that traders can use including technical analysis or fundamental analysis. A good forex trading strategy allows for a trader to analyse the market and confidently execute trades with sound risk management techniques.

Forex Strategies: A Top-level Overview

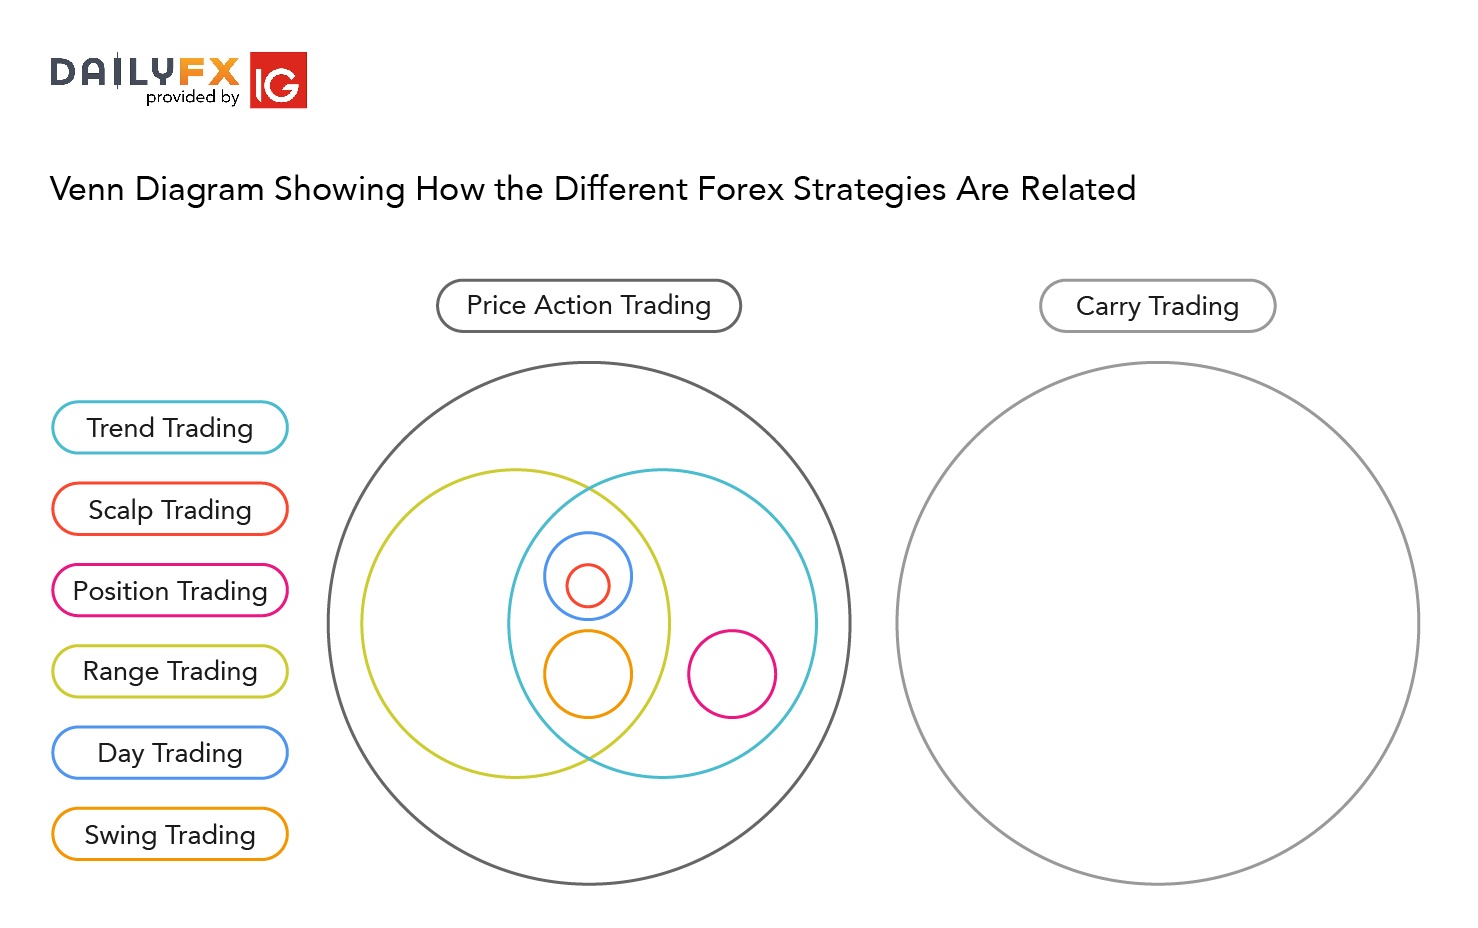
Forex strategies can be divided into a distinct organisational structure which can assist traders in locating the most applicable strategy. The diagram below illustrates how each strategy falls into the overall structure and the relationship between the forex strategies.
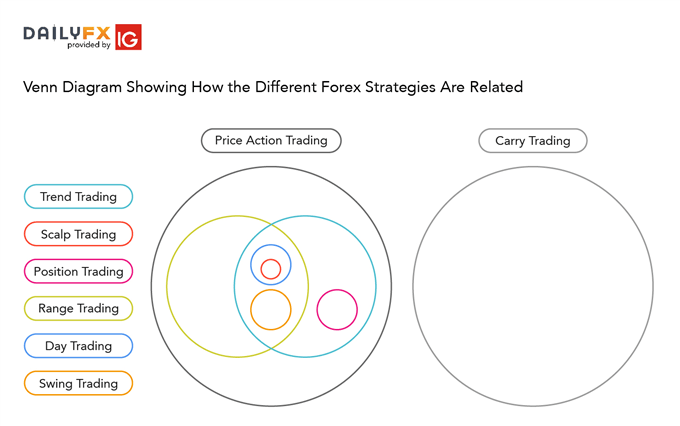
relationship between different forex strategies

Forex Trading Strategies That Work

Forex trading requires putting together multiple factors to formulate a trading strategy that works for you. There are countless strategies that can be followed, however, understanding and being comfortable with the strategy is essential. Every trader has unique goals and resources, which must be taken into consideration when selecting the suitable strategy.

There are three criteria traders can use to compare different strategies on their suitability:

  1. Time resource required
  2. Frequency of trading opportunities
  3. Typical distance to target

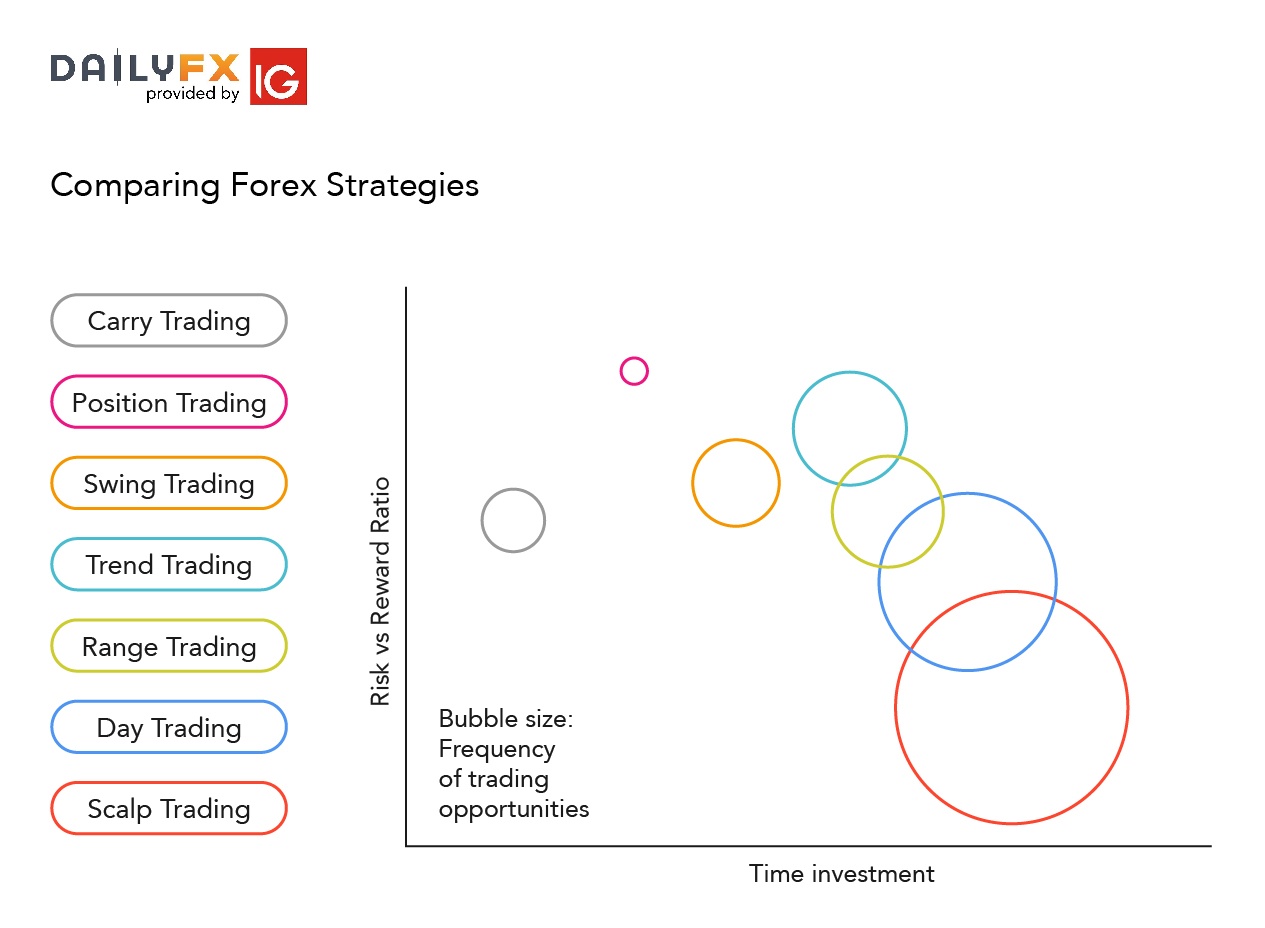
To easily compare the forex strategies on the three criteria, we’ve laid them out in a bubble chart. On the vertical axis is ‘Risk-Reward Ratio’ with strategies at the top of the graph having higher reward for the risk taken on each trade. Position trading typically is the strategy with the highest risk reward ratio. On the horizontal axis is time investment that represents how much time is required to actively monitor the trades. The strategy that demands the most in terms of your time resource is scalp trading due to the high frequency of trades being placed on a regular basis.
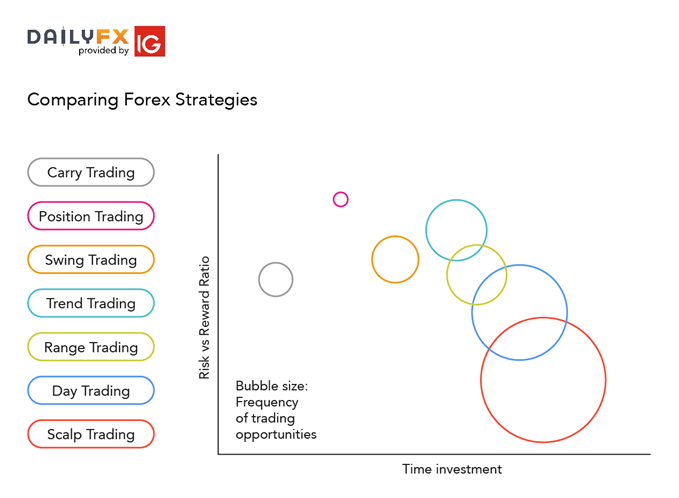
comparing forex strategies

1. Price Action Trading

Price action trading involves the study of historical prices to formulate technical trading strategies. Price action can be used as a stand-alone technique or in conjunction with an indicator. Fundamentals are seldom used; however, it is not unheard of to incorporate economic events as a substantiating factor. There are several other strategies that fall within the price action bracket as outlined above.

Length of trade:

Price action trading can be utilised over varying time periods (long, medium and short-term). The ability to use multiple time frames for analysis makes price action trading valued by many traders.

Entry/Exit points:

There are many methods to determine support/resistance levels which are generally used as entry/exit points:

Within price action, there is range, trend, day, scalping, swing and position trading. These strategies adhere to different forms of trading requirements which will be outlined in detail below. The examples show varying techniques to trade these strategies to show just how diverse trading can be, along with a variety of bespoke options for traders to choose from.

2. Range Trading Strategy

Range trading includes identifying support and resistance points whereby traders will place trades around these key levels. This strategy works well in market without significant volatility and no discernible trend. Technical analysis is the primary tool used with this strategy.

Length of trade:

There is no set length per trade as range bound strategies can work for any time frame. Managing risk is an integral part of this method as breakouts can occur. Consequently, a range trader would like to close any current range bound positions.

Entry/Exit points:

Oscillators are most commonly used as timing tools. Relative Strength Index (RSI), Commodity Channel Index (CCI) and stochastics are a few of the more popular oscillators. Price action is sometimes used in conjunction with oscillators to further validate range bound signals or breakouts.

Example 1: USD/JPY Range Trading
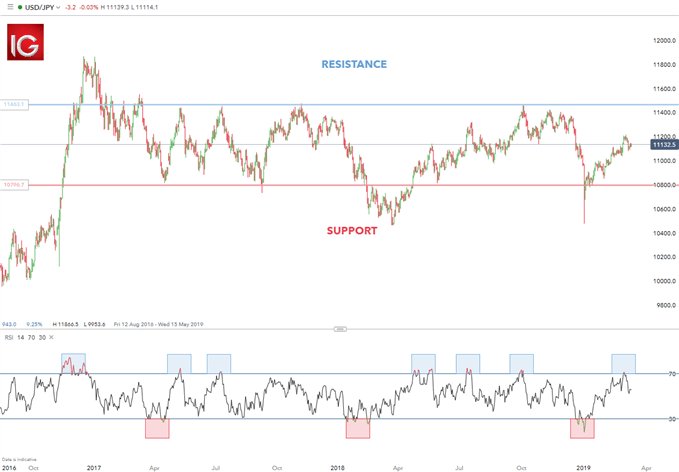
range trading USD/JPY

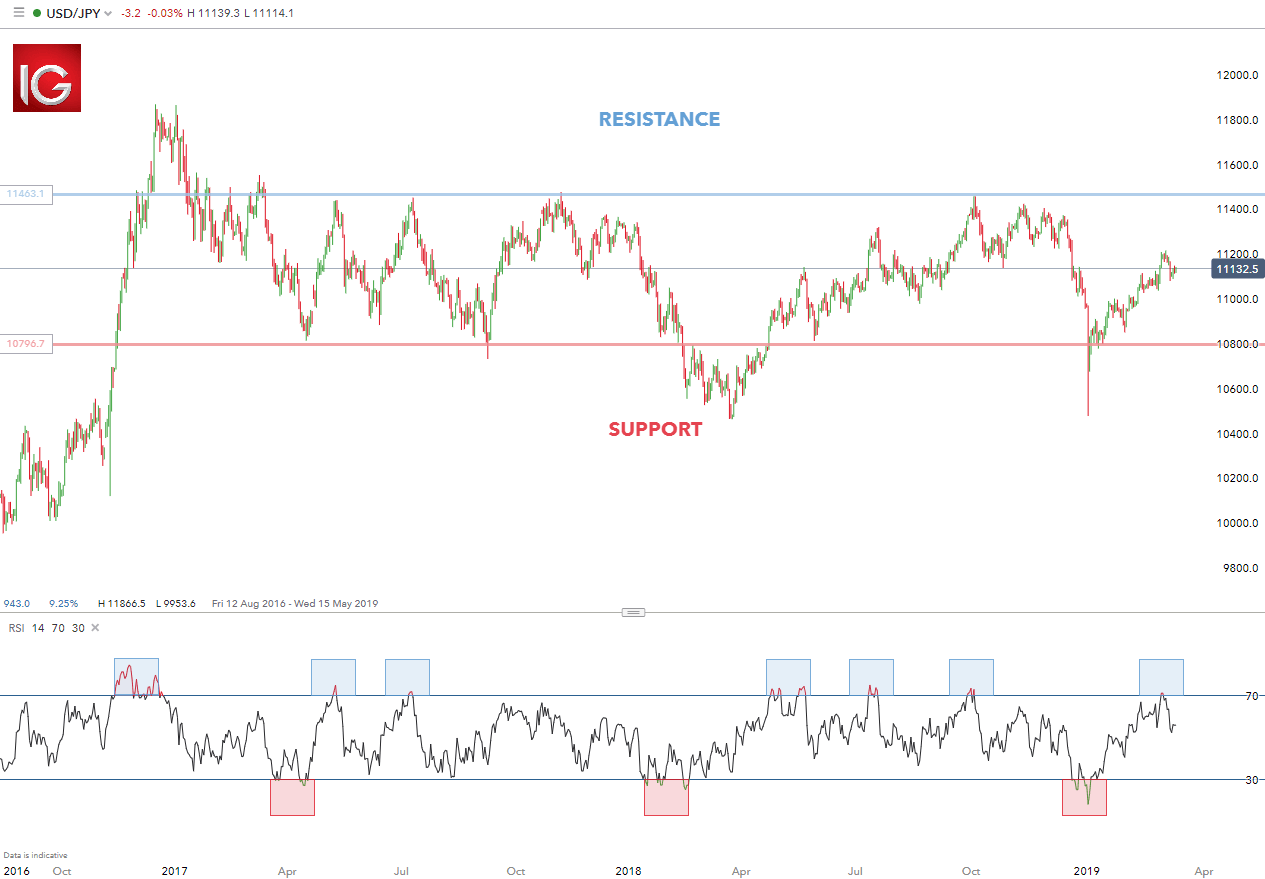
USD/JPY has been exhibiting a prolonged range bound price level over the past few years. The chart above illustrates a clear support and resistance band which traders use as entry/exit points. The RSI oscillator demonstrates timing of entry/exit points as highlighted by the shaded blue and red boxes – blue: overbought and red: oversold.

Range trading can result in fruitful risk-reward ratios however, this comes along with lengthy time investment per trade. Use the pros and cons below to align your goals as a trader and how much resources you have.

Pros:

  • Substantial number of trading opportunities
  • Favourable risk-to reward ratio

Cons:

  • Requires lengthy periods of time investment
  • Entails strong appreciation of technical analysis

3. Trend Trading Strategy

Trend trading is a simple forex strategy used by many traders of all experience levels. Trend trading attempts to yield positive returns by exploiting a markets directional momentum.

Length of trade:

Trend trading generally takes place over the medium to long-term time horizon as trends themselves fluctuate in length. As with price action, multiple time frame analysis can be adopted in trend trading.

Entry/Exit points:

Entry points are usually designated by an oscillator (RSI, CCI etc) and exit points are calculated based on a positive risk-reward ratio. Using stop level distances, traders can either equal that distance or exceed it to maintain a positive risk-reward ratio e.g. If the stop level was placed 50 pips away, the take profit level wold be set at 50 pips or more away from the entry point.

Example 2: Identifying the Trend
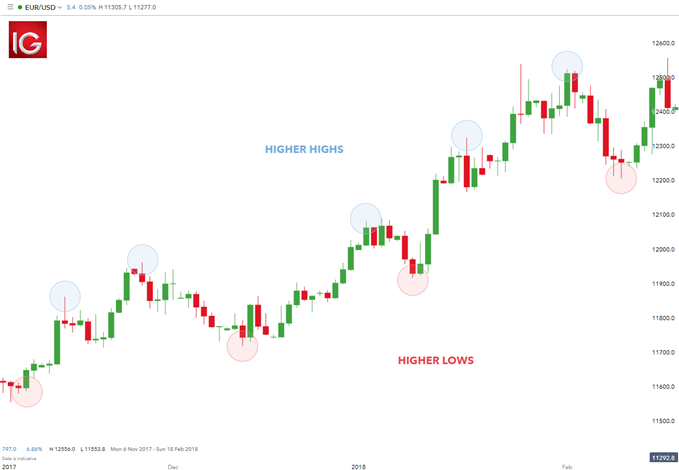
trend trading EUR/USD

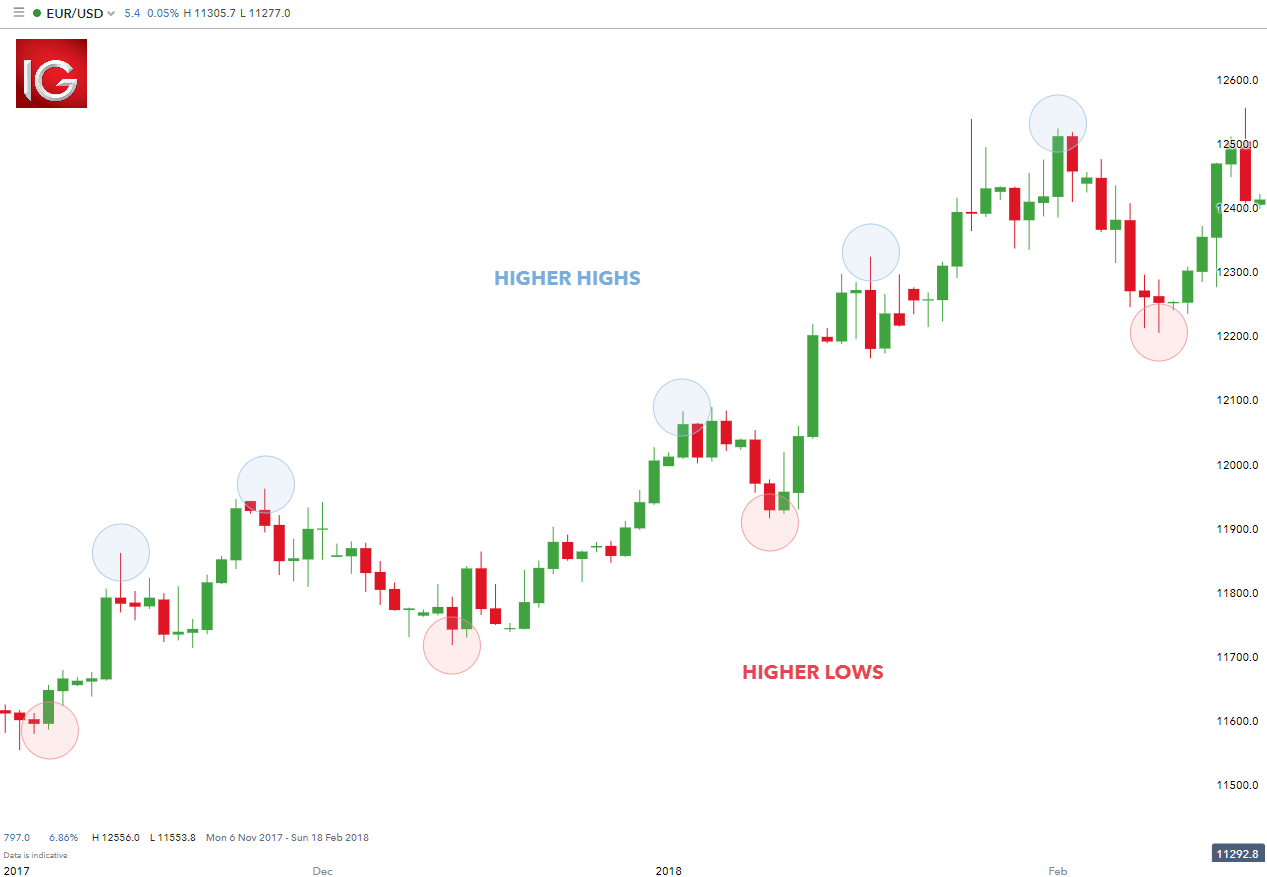
In the simple example above, EUR/USD exhibits an upward trend validated by higher highs and higher lows. The opposite would be true for a downward trend.

EUR/USD Trading the Trend
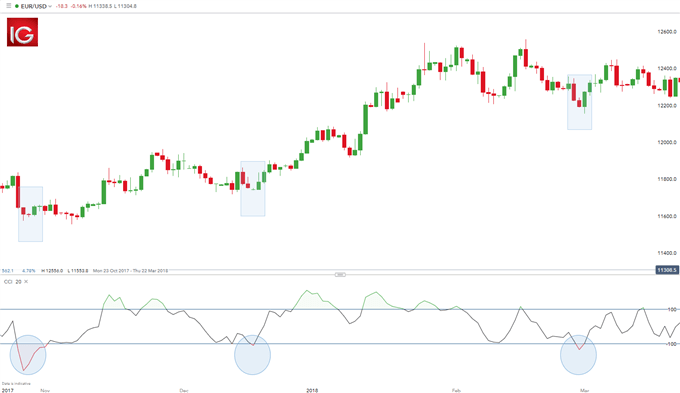
trend trading EUR/USD with CCI

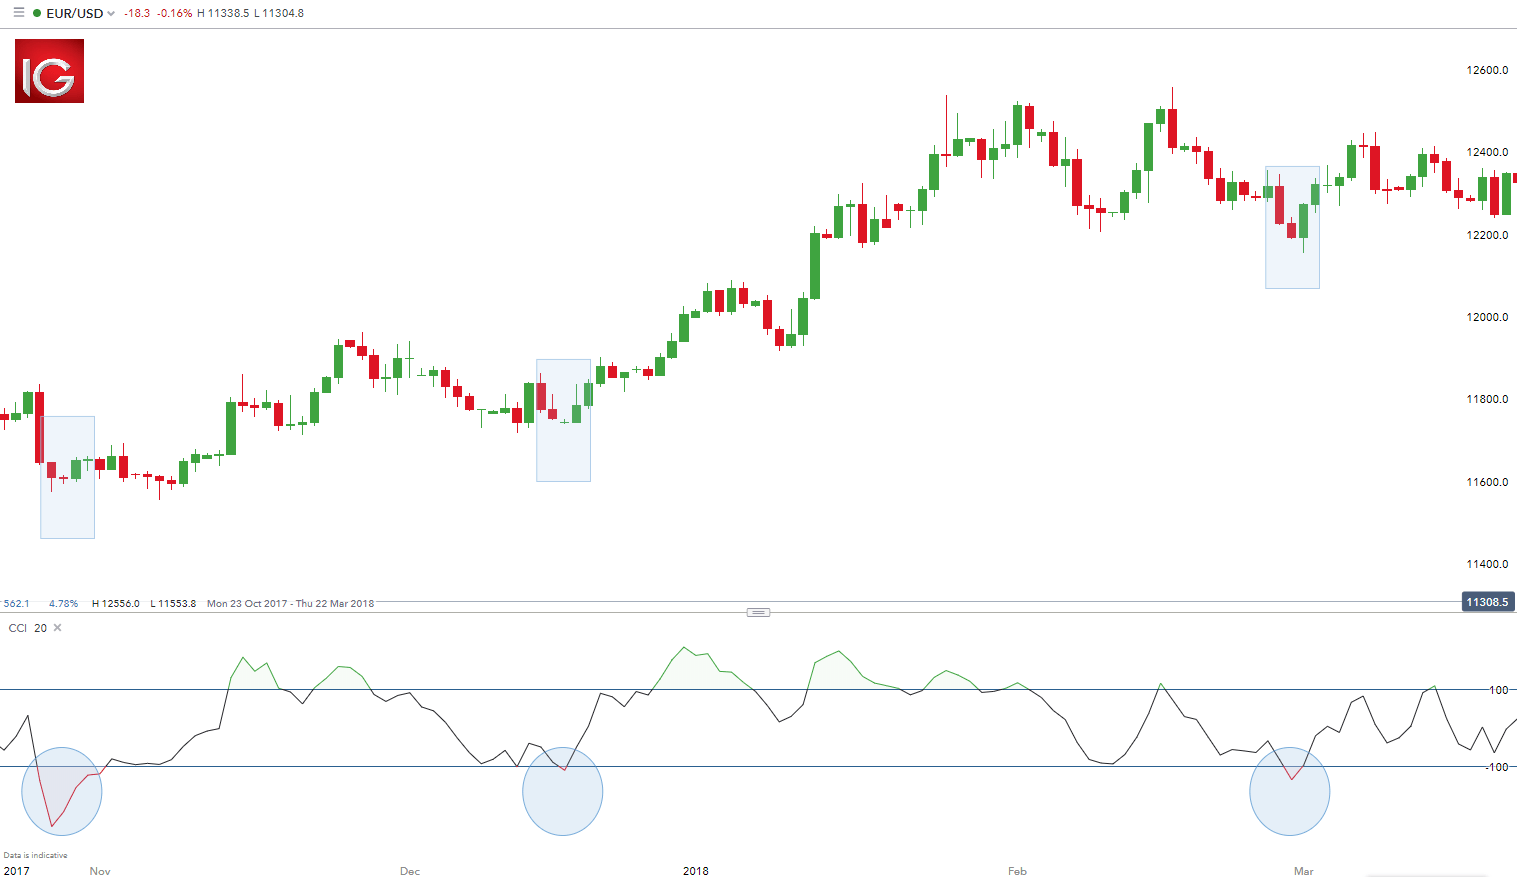
When you see a strong trend in the market, trade it in the direction of the trend. For example, the strong uptrend in EUR/USD above.

Using the (CCI) as a tool to time entries, notice how each time CCI dipped below -100 (highlighted in blue), prices responded with a rally. Not all trades will work out this way, but because the trend is being followed, each dip caused more buyers to come into the market and push prices higher. In conclusion, identifying a strong trend is important for a fruitful trend trading strategy.

Trend trading can be reasonably labour intensive with many variables to consider. The list of pros and cons may assist you in identifying if trend trading is for you.

Pros:

  • Substantial number of trading opportunities
  • Favourable risk-to reward ratio

Cons:

  • Requires lengthy periods of time investment
  • Entails strong appreciation of technical analysis

4. Position Trading

Position trading is a long-term strategy primarily focused on fundamental factors however, technical methods can be used such as Elliot Wave Theory. Smaller more minor market fluctuations are not considered in this strategy as they do not affect the broader market picture. This strategy can be employed on all markets from stocks to forex.

Length of trade:

As mentioned above, position trades have a long-term outlook (weeks, months or even years!) reserved for the more persevering trader. Understanding how economic factors affect markets or thorough technical predispositions, is essential in forecasting trade ideas.

Entry/Exit points:

Key levels on longer time frame charts (weekly/monthly) hold valuable information for position traders due to the comprehensive view of the market. Entry and exit points can be judged using technical analysis as per the other strategies.

Example 3: Germany 40 (DAX) Position Trading
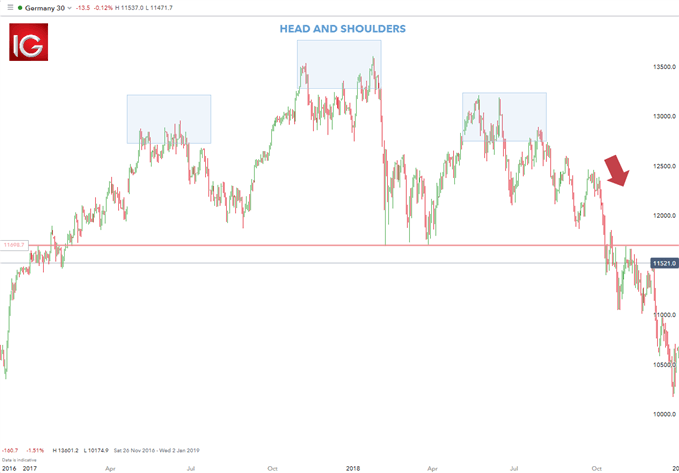
position trading DAX

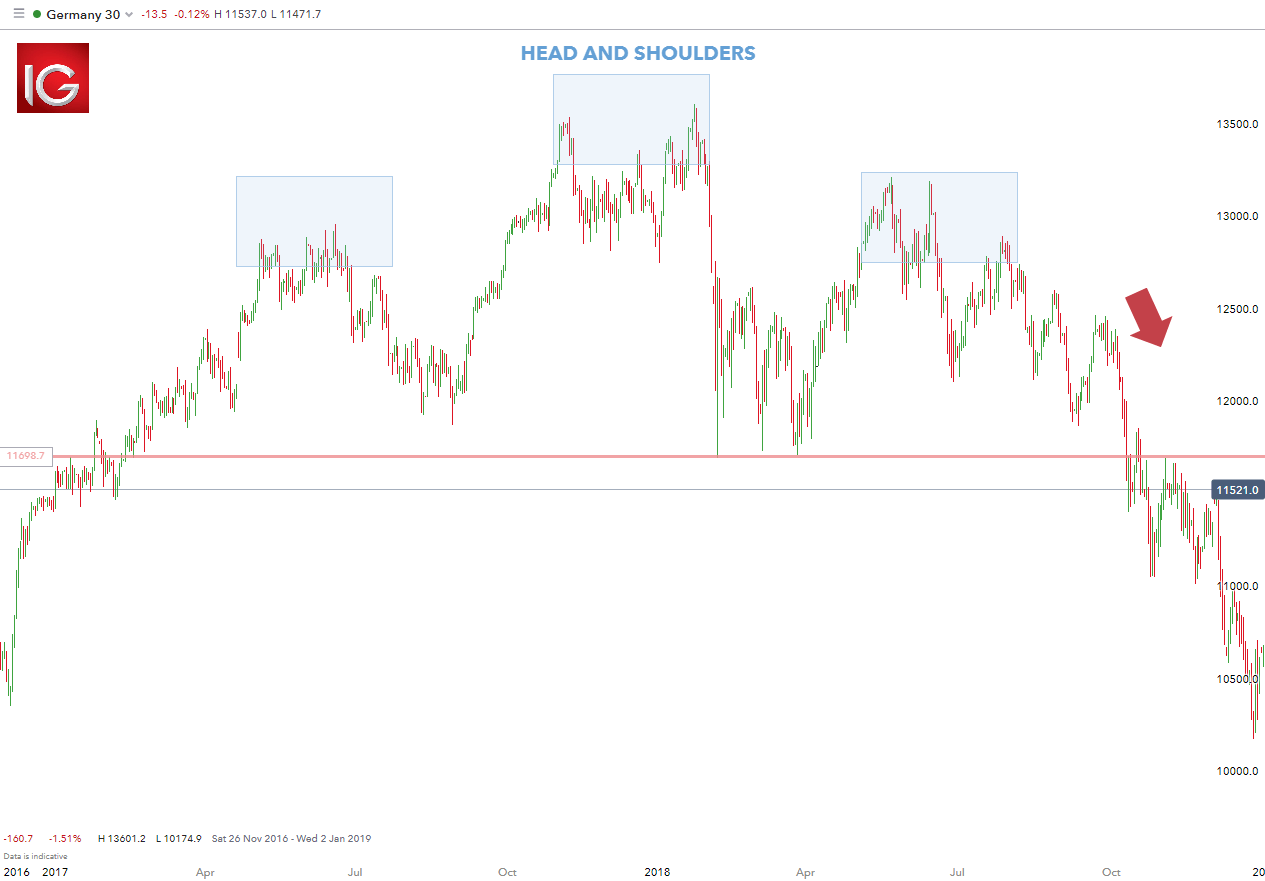
The Germany 40 chart above depicts an approximate two year head and shoulders pattern, which aligns with a probable fall below the neckline (horizontal red line) subsequent to the right-hand shoulder. In this selected example, the downward fall of the Germany 30 played out as planned technically as well as fundamentally. Towards the end of 2018, Germany went through a technical recession along with the US/China trade war hurting the automotive industry. Brexit negotiations did not help matters as the possibility of the UK leaving the EU would most likely negatively impact the German economy as well. In this case, understanding technical patterns as well as having strong fundamental foundations allowed for combining technical and fundamental analysis to structure a strong trade idea.

List of Pros and Cons based on your goals as a trader and how much resources you have.

Pros:

  • Requires minimal time investment
  • Highly positive risk-to reward ratio

Cons:

  • Very few trading opportunities
  • Entails strong appreciation of technical and fundamental analysis

5. Day Trading Strategy

Day trading is a strategy designed to trade financial instruments within the same trading day. That is, all positions are closed before market close. This can be a single trade or multiple trades throughout the day.

Length of trade:

Trade times range from very short-term (matter of minutes) or short-term (hours), as long as the trade is opened and closed within the trading day.

Entry/Exit points:

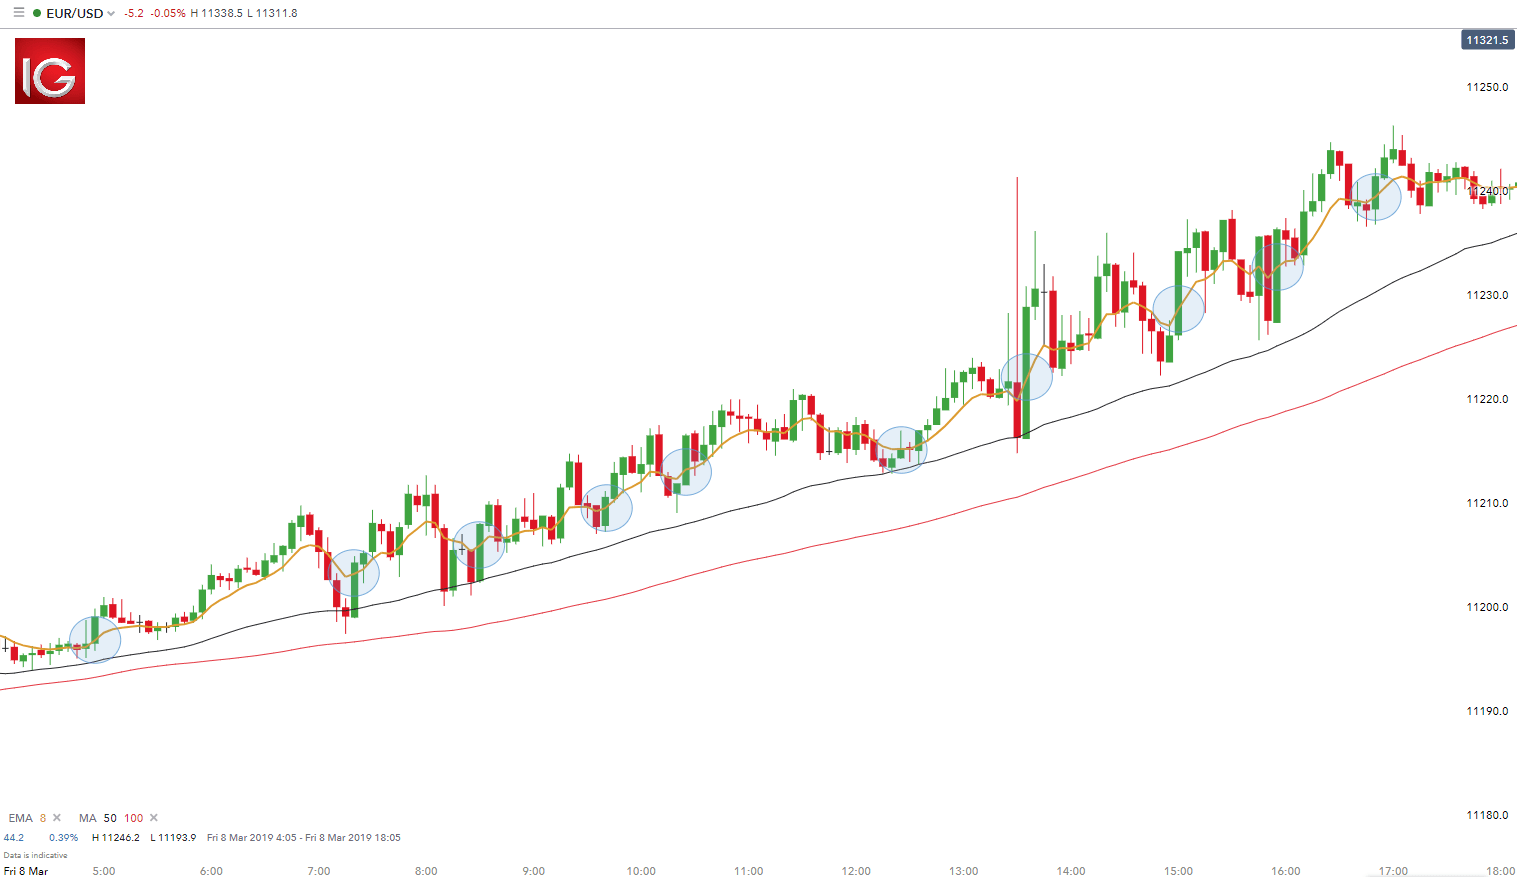
Traders in the example below will look to enter positions at the when the price breaks through the 8 period EMA in the direction of the trend (blue circle) and exit using a 1:1 risk-reward ratio.

Example 4: EUR/USD Day Trading
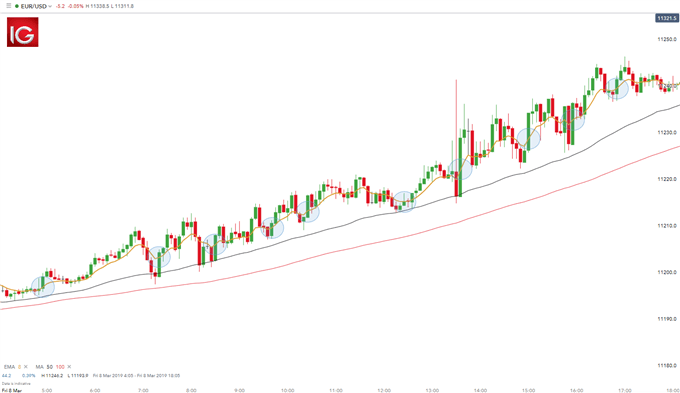
day trading EUR/USD

The chart above shows a representative day trading setup using moving averages to identify the trend which is long in this case as the price is above the MA lines (red and black). Entry positions are highlighted in blue with stop levels placed at the previous price break. Take profit levels will equate to the stop distance in the direction of the trend.

The pros and cons listed below should be considered before pursuing this strategy. Day trading involves much time and effort for little reward, as seen from the EUR/USD example above.

Pros:

  • Substantial number of trading opportunities
  • Median risk-to reward ratio

Cons:

  • Requires lengthy periods of time investment
  • Entails strong appreciation of technical analysis

6. Forex Scalping Strategy

Scalping in forex is a common term used to describe the process of taking small profits on a frequent basis. This is achieved by opening and closing multiple positions throughout the day. This can be done manually or via an algorithm which uses predefined guidelines as to when/where to enter and exit positions. The most liquid forex pairs are preferred as spreads are generally tighter, making the short-term nature of the strategy fitting.

Length of trade:

Scalping entails short-term trades with minimal return, usually operating on smaller time frame charts (30 min – 1min).

Entry/Exit points:

Like most technical strategies, identifying the trend is step 1. Many scalpers use indicators such as the moving average to verify the trend. Using these key levels of the trend on longer time frames allows the trader to see the bigger picture. These levels will create support and resistance bands. Scalping within this band can then be attempted on smaller time frames using oscillators such as the RSI. Stops are placed a few pips away to avoid large movements against the trade. The MACD indicator is another useful tool that can be exercised by the trader to enter/exit trades.

Example 5: EUR/USD Scalping Strategy
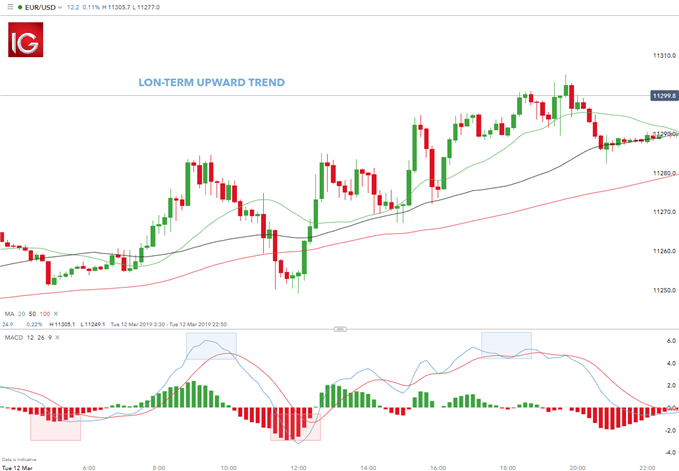
scalp trading EUR/USD

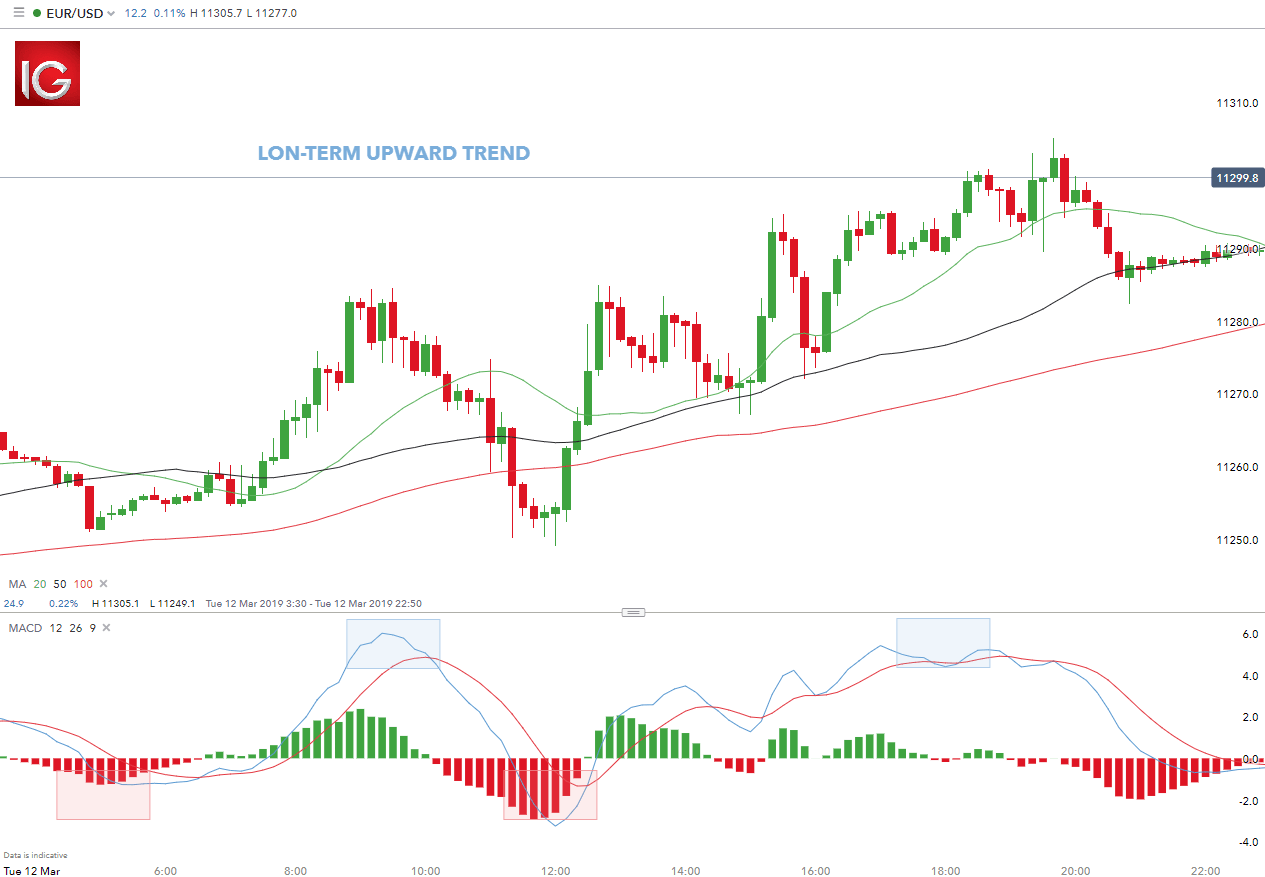
The EUR/USD 10 minute above shows a typical example of a scalping strategy. The long-term trend is confirmed by the moving average (price above 200 MA). The smaller time frame is then used to target entry/exit points. Timing of entry points are featured by the red rectangle in the bias of the trader (long). Traders can also close long positions using the MACD when the MACD (blue line) crosses over the signal line (red line) highlighted by the blue rectangles.

Traders use the same theory to set up their algorithms however, without the manual execution of the trader.

With this practical scalp trading example above, use the list of pros and cons below to select an appropriate trading strategy that best suits you.

Pros:

  • Greatest number of trading opportunities from all forex strategies

Cons:

  • Requires lengthy periods of time investment
  • Entails strong appreciation of technical analysis
  • Lowest risk-to reward ratio

7. Swing Trading

Swing trading is a speculative strategy whereby traders look to take advantage of rang bound as well as trending markets. By picking ‘tops’ and ‘bottoms’, traders can enter long and short positions accordingly.

Length of trade:

Swing trades are considered medium-term as positions are generally held anywhere between a few hours to a few days. Longer-term trends are favoured as traders can capitalise on the trend at multiple points along the trend.

Entry/Exit points:

Much like the range bound strategy, oscillators and indicators can be used to select optimal entry/exit positions and times. The only difference being that swing trading applies to both trending and range bound markets.

Example 6: GBP/USD Swing Trading Strategy
swing trading GBP/USD

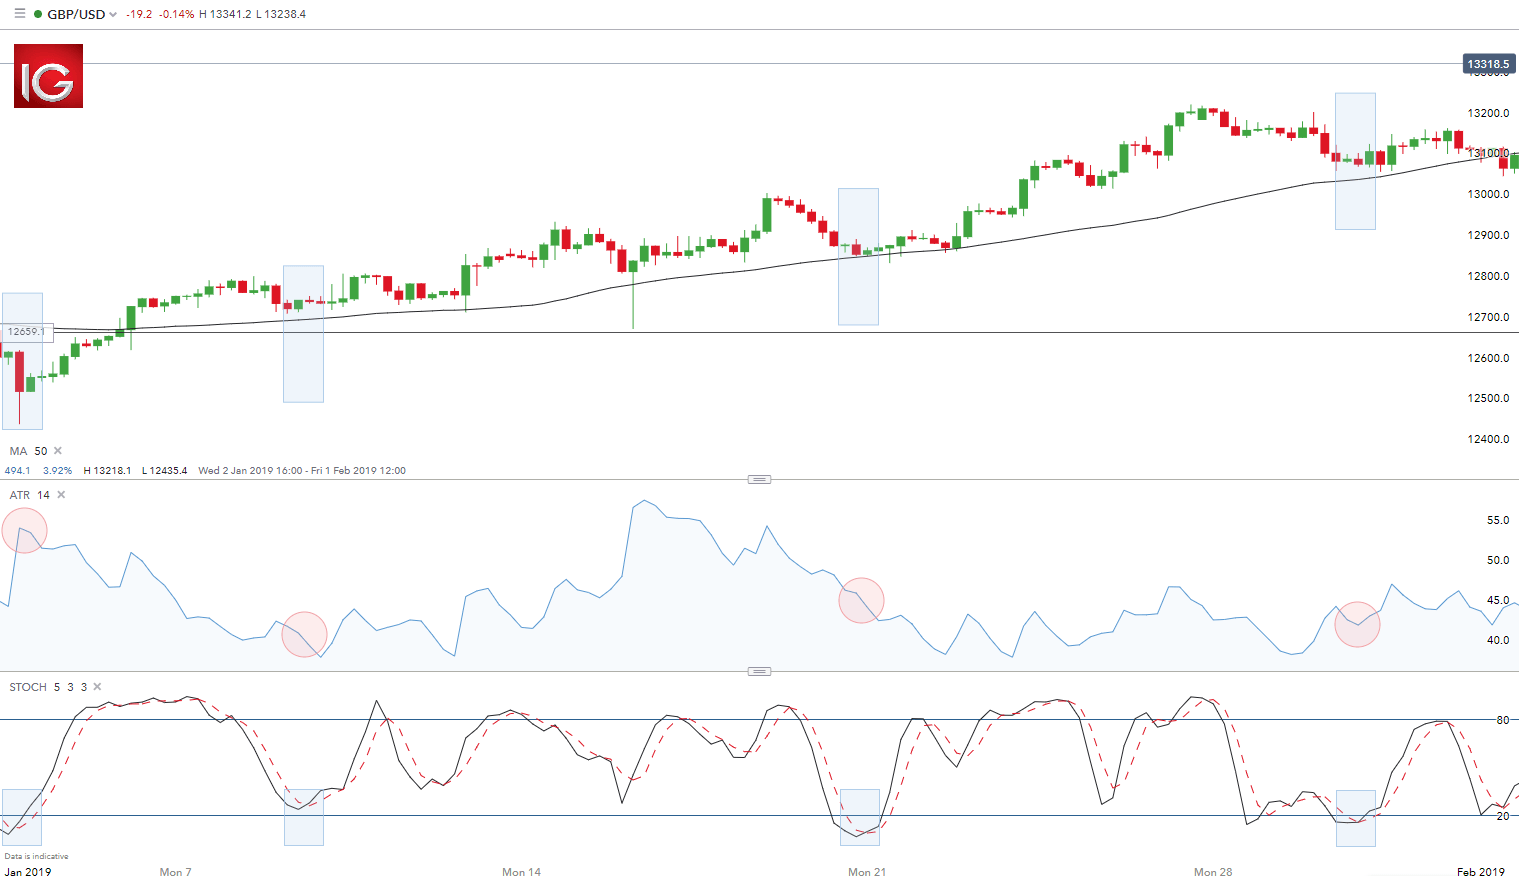
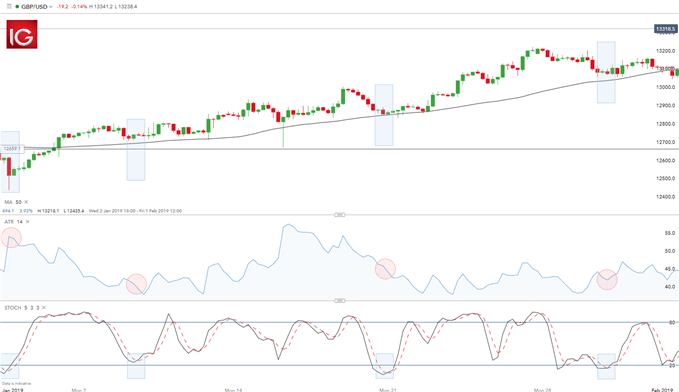
A combination of the stochastic oscillator, ATR indicator and the moving average was used in the example above to illustrate a typical swing trading strategy. The upward trend was initially identified using the 50-day moving average (price above MA line). In the case of an uptrend, traders will look to enter long positions with the old adage of ‘buy low, sell high’.

Stochastics are then used to identify entry points by looking for oversold signals highlighted by the blue rectangles on the stochastic and chart. Risk management is the final step whereby the ATR gives an indication of stop levels. The ATR figure is highlighted by the red circles. This figure represents the approximate number of pips away the stop level should be set. For example, if the ATR reads 41.8 (reflected in the last ATR reading) the trader would look to place the stop 41.8 pips away from entry. At DailyFX, we recommend trading with a positive risk-reward ratio at a minimum of 1:2. This would mean setting a take profit level (limit) at least 83.6 (41.8 x 2) pips away or further.

After seeing an example of swing trading in action, consider the following list of pros and cons to determine if this strategy would suit your trading style.

Pros:

  • Substantial number of trading opportunities
  • Median risk-to reward ratio

Cons:

  • Entails strong appreciation of technical analysis
  • Still requires extensive time investment

8. Carry Trade Strategy

Carry trades include borrowing one currency at lower rate, followed by investing in another currency at a higher yielding rate. This will ultimately result in a positive carry of the trade. This strategy is primarily used in the forex market.

Length of trade:

Carry trades are dependent on interest rate fluctuations between the associated currencies therefore, length of trade supports the medium to long-term (weeks, months and possibly years).

Entry/Exit points:

Strong trending markets work best for carry trades as the strategy involves a lengthier time horizon. Confirmation of the trend should be the first step prior to placing the trade (higher highs and higher lows and vice versa) – refer to Example 1 above. There are two aspects to a carry trade namely, exchange rate risk and interest rate risk. Accordingly, the best time to open the positions is at the start of a trend to capitalise fully on the exchange rate fluctuation. Regarding the interest rate component, this will remain the same regardless of the trend as the trader will still receive the interest rate differential if the first named currency has a higher interest rate against the second named currency e.g. AUD/JPY.

Could carry trading work for you? Consider the following pros and cons and see if it is a forex strategy that suits your trading style.

Pros:

  • Little time investment needed
  • Median risk-to reward ratio

Cons:

  • Entails strong appreciation of forex market
  • Infrequent trading opportunities

Forex Strategies: A Summary

This article outlines 8 types of forex strategies with practical trading examples. When considering a trading strategy to pursue, it can be useful to compare how much time investment is required behind the monitor, the risk-reward ratio and regularity of total trading opportunities. Each trading strategy will appeal to different traders depending on personal attributes. Matching trading personality with the appropriate strategy will ultimately allow traders to take the first step in the right direction.

 

UK Inflation Remains Sticky; GBP/USD Sentiment Analysis

UK Inflation Remains Sticky; GBP/USD Sentiment Analysis

UK inflation was little moved in June with core y/y unchanged at 3.5%, while headline inflation remained steady at the Bank of England’s 2% target. According to the Office for National Statistics,

‘The largest upward contribution to the monthly change in both CPIH and CPI annual rates came from restaurants and hotels, where prices of hotels rose more than a year ago; the largest downward contribution came from clothing and footwear, with prices of garments falling this year having risen a year ago.’

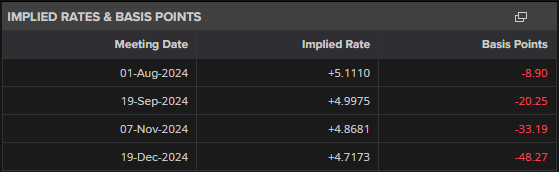
BoE rate cut expectations moved after the data hit the screens, with analysts seeing sticky inflation paring back rate cut expectations. The first UK rate cut has been pushed back to September with two quarter-point cuts seen this year.

image2.png

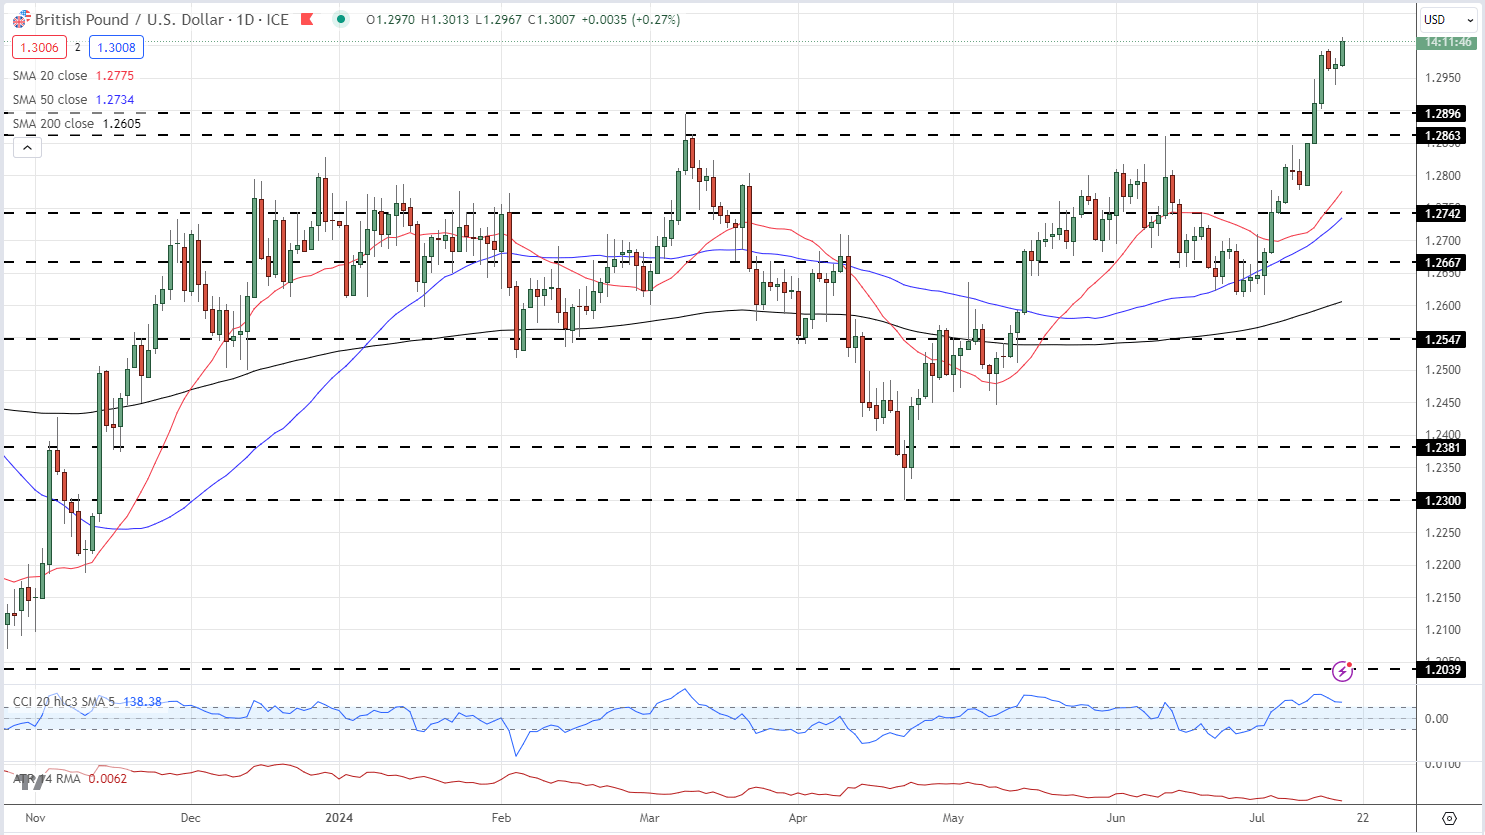
GBP/USD moved higher after the data release and is back above 1.3000 for the first time since July 2023. UK 2-year gilt yields are back above 4% after trading at 3.97% yesterday, while US dollar weakness is also helping the pair move higher.

GBP/USD Daily Price Chart

image3.png

GBP/USD Sentiment Analysis

Current Positioning: The latest retail trader data reveals that 29.52% of traders are net-long on GBP/USD, with a short-to-long ratio of 2.39:1. This indicates a significant bearish sentiment among retail traders.

Recent Changes:

  • Net-long positions have increased by 3.22% since yesterday but decreased by 8.55% from last week.
  • Net-short positions remain unchanged from yesterday but have risen by 15.16% compared to last week.

Contrarian Perspective: Adopting a contrarian view to crowd sentiment, the predominance of net-short positions suggests that GBP/USD prices may continue to rise. This approach is based on the principle that retail sentiment often contrasts with market movements.

What is Earnings Season & What to Look for in Earnings Reports?

What is Earnings Season & What to Look for in Earnings Reports?

What is Earnings Season & Why Is It Important?

Earnings season is a period each fiscal quarter, usually lasting several weeks, where many of the largest listed companies announce their latest financial accounts. An earnings report consists of revenue, net income, earnings per share (EPS) and forward outlook, amongst a bevy of other data points, which can help to provide investors with insight relating to the current health and outlook for the company. This information can be found on sec.gov, various financial publications, and individual companies’ websites.

Earnings season is important because it helps market participants glean information from the companies that they are monitoring along with the broader index. For example, a strong Apple (AAPL) earnings report may see investors bullish on Nasdaq 100 futures, a concept discussed further below when looking at bellwether stocks.

Something else that can accompany an earnings release is an earnings call. This is a conference between the company and analysts, press and investors which discusses the outcome of an earnings report and, in many cases, opens the floor for questions to company management. Such scrutiny of the reports can enable traders to access more information to further inform their decisions, although not all companies hold earnings calls.

When is Earnings Season & When Do Reports Come Out?

Earnings season takes place typically a few weeks after each quarter ends (December, March, June, September). In other words, earnings seasons begins around January-February (Q4 results), April-May (Q1 results), July-August (Q2 results) and October-November (Q3 results), with the unofficial start of earnings season usually marked by when the major US banks report results.

This typically coincides with an increase in the number of earnings being released, while the unofficial end of earnings season is usually around the time that Walmart (WMT) announces its earnings report.

3 Things to Look for in Company Earnings Reports

There are a number of factors to look for in company earnings reports. Traders should be most mindful of the performance of the largest ‘bellwether’ stocks, understand the significance of an earnings recession in a given stock, and grasp how a stock’s earnings announcement might impact a relevant index, depending on the weighting of the given security.

1) Performance of bellwether stocks

When analyzing company earnings, it is important to look out for ‘bellwether’ stocks which can be seen as a gauge for the performance of the macro-economy. While the status of a bellwether stock can change over time, the largest and most-established companies are typically considered a bellwether stock.

Examples of Bellwether stocks are:

  • FedEx (FDX): Ships goods for consumers and businesses across the globe
  • Caterpillar (CAT): World’s largest heavy-duty machinery maker has been viewed as a bellwether given its large exposure to construction, manufacturing and agricultural industries, particularly in China
  • 3M (MMM): Gauge for the health of the manufacturing sector
  • Apple (AAPL): Among the world’s largest companies. Important for key suppliers, in particular, chipmakers.

2) Earnings recession

An earnings recession is characterized as two consecutive quarters of year-on-year declines in company profits. However, while earnings are an important factor in stock market returns over the long term, an earnings recession does not necessarily coincide with an economic recession.

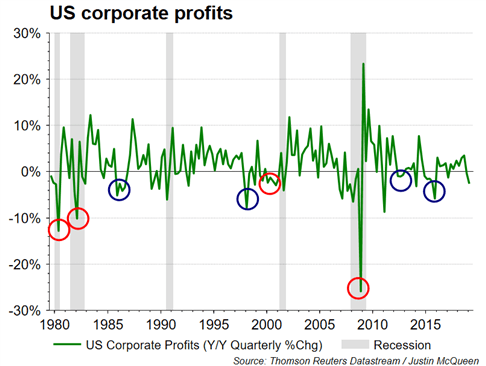
The chart below shows that in the past six earnings recessions witnessed in the US, only two had coincided with an economic recession. The blue circles show where there was an earnings recession without an economic recession, while the red circles represent where both an earnings and economic recession occurred.

How earnings recession relates to economic recession

3) Earnings and stock index weighting

Traders should understand that when trading earnings, certain stocks will have a greater impact on the wider index according to their index weighting. For example, when trading the Dow Jones, Boeing releasing its earnings will be highly influential on the index, while Visa likely won’t be as influential, due to the former’s 9.49% weighting compared to the latter’s 4.41%, as shown in the table below. This highlights the importance of paying close attention to bellwether stocks and how they may impact a broader equity index.

Table of index weighting of stocks to help trade earnings

Trading during earnings season: Top tips

We have an in-depth guide on how to trade earnings season, but the important things to remember are:

1) Know the ‘expected’ results

Being cognizant of what is ‘expected’ with regards to the revenue/sales and earnings per share (EPS) figures are important because a company’s share price reaction can often be determined by the amount by which they beat/miss an aggregate of analysts’ expectations.

2) Stay alert to surprise announcements

Any surprise announcements that coincide with an earnings report can also impact the share price of a company. These may include stock buybacks/share repurchase programs as well as company guidance.

3) Be aware of spillover effects between stocks

An example of spillover impact could be if an investor has a chipmaker stock within their portfolio (EG Dialog Semiconductor), earnings from Apple could have a sizeable impact on the stock. Consequently, it is important to assess related stocks, given that they may reveal the outlook for a sector, thus sparking a possible sector rotation.

4) Consider volatility over the bearing of an expected move

Working out the ‘expected move’ on a directional basis for a stock in reaction to the binary earnings event can be a fraught endeavor. Alternatively, a view taken with volatility in mind instead can prepare investors for significant movement without positioning on the wrong side of the eventual outcome.

Earnings Season: Key Takeaways for Investors and Stock Traders

In summary, earnings season can be an influential driver in a trader’s experience. Make sure you keep up to date on the when the key earnings are released for individual companies in order to proactively plan. Be aware of how bellwether stocks, potential earnings recessions and stock index weightings can influence price movements. Keep a handle on what results are expected for each stock, be mindful of greater potential volatility for either analytical or strategic purposes and understand how one stock’s performance can impact another’s (or an index as a whole).

Following these key tips can help the trader to attempt to weather earnings season and navigate the period more consistently.

Earnings Season FAQs

What does earnings season tell us about the global economy?

Earnings season’s impact on the global economy is dependent on a range of factors, from the performance of given sectors to a variety of fundamental factors. While bellwether companies meeting or exceeding expectations can reflect a strong corporate environment, the stock market interacts with the economy in many different ways – so there isn’t always a predictable relationship between the two.

How is earnings season impacted by financial downturns?

Financial downturns may impact earnings season in a significant way – dampened demand for products and services caused by a downturn or more prolonged recession can naturally mean earnings failing to hit expectations in multiple sectors. However, perceived defensive stocks such as those in consumer staples or healthcare may weather downturns better or perhaps even become more attractive in such a backdrop

The Psychology of Speculation in the Forex Market

The Psychology of Speculation in the Forex Market

Forex speculation is the name of the game in trading. Every trader, at some point or another, has to click ‘buy’ or ‘sell’ and commit to a position based on their analysis even though there is no guarantee of success. Unfortunately for traders, the market can have a very different viewpoint of the market and this can bring about a moment of serious introspection.

This article seeks to deal with some of those hard-hitting questions and explores the following:

  • What is speculation in the foreign exchange market?
  • What happens when it all goes wrong?
  • Top 4 tips to speculate like a successful trader

What is speculation in the forex market?

Speculation in the foreign exchange market involves the buying and selling of currencies with the view of making a profit. It is called speculation because of the uncertainty involved as no one can say for sure whether the market will be going up or down. Traders assess the likelihood of either scenario before placing a trade.

What happens when it all goes wrong?

After you’ve developed a trading strategy centered around forex speculation and learned the basics of the market – you have many of the tools that are needed to be successful. And when that success doesn’t come, numerous questions can swirl around inside your head.

“Am I trading the right strategy?”, “Do I really know what I’m doing?”

These questions/doubts are not unique. Most traders have these thoughts at some stage or another and have learned how to overcome them. Let’s address these questions directly:

1) Am I Trading the Right Strategy?

Many traders don’t realize this early on – market conditions change over time. As a currency speculator, you can spend weeks analysing a specific market that suits your strategy at the time, but this is likely to change and when it does it will seem like nothing is working in your favour.

A perfect example of this can be seen when comparing EUR/USD in 2017 to the same currency pair in the first half of 2019.

In 2017, EUR/USD was is a strong uptrend for the majority of the year. Backtesting trend trading strategies would naturally yield attractive results and any reasonable trader would look to implement such a strategy.

currency speculation EUR/USD upward trend 2017

A very different picture can be seen below as EUR/USD trades sideways for the first six months of 2019, making things difficult for new trend traders. The red 200 day moving average helps make this point as it cuts through price many times and fails to provide a clear signal.

Forex speculation in EUR/USD 2019

Traders should dedicate some time to analyze whether or not market conditions have changed. It is very possible that the trading strategy is fine but the market no longer exhibits the characteristics that drew you to it in the first place.

2) Do I Really Know What I’m Doing?

“FAIL: First Attempt in Learning” – Anonymous

This is a difficult question to answer as this will depend on each trader’s knowledge and preparedness. Since this question cannot be answered, the next best thing to do is to look at what others have done wrong, learn from it, and avoid making the same trading mistakes.

At DailyFX we researched over 30 million live IG trades to discover the number one mistake traders make in our Traits of Successful Traders report. Understanding where it all goes wrong and making the necessary adjustments is the first step to trading like the professionals.

4 Tips to speculate like a successful trader and get back on track

1) Don’t Let Risk Change Your Behaviour

The biggest psychological obstacle for traders is the perception of losses (and the concept of losing). For traders, the pain of closing a trade and realizing a loss outweighs the excitement of realizing a winning trade of equal magnitude.

Top traders apply sound risk management first and foremost. Traders can win two-thirds of all their trades and still land up blowing up the account in the absence of using stops. A natural consequence of this is that traders allow losing positions to run, while taking profit as soon as a position turns positive. The losses outweigh the winners and this should never happen.

One way to manage your emotions is to implement a trailing stop or manually move your existing stop when the market moves in your favor. This way, traders can relax knowing that they are breaking even and any further movement in your favor is purely profit.

Currency speculation using stops

Before placing a trade, know what level of risk you are prepared to take on and ensure that the risk to reward ratio is at least 1:1.

2) Bring a Positive Mindset to the Charts Every Day

Since you will inevitably be taking losses in this game of forex speculation, it’s important to deny those losses from altering your frame of mind.

Traders will often experience the disappointment of being stopped out and this can be very discouraging. As a result of this they take shortcuts on their analysis or question their own approach. This never ends well.

The key to keeping a positive mindset in trading is to look at losses in the same way that a business owner looks at expenses; simply as a cost of doing business. Because once you’ve learned to lose properly, and after you’ve learned to keep those losses in scope of the bigger picture – you’ve addressed biggest aspects of trading psychology.

3) Strike the delicate balance between fear and greed

These two drives can have a large bearing in the way we live our lives; and not just in trading. When trading, both fear and greed can be massively detrimental, as they can cloud your judgment and lead to bad decisions.

Most human beings will be greedy when they have a losing position; willing to hold on if only price can come back to their entry level. And when in a winning position, most human beings will begin to be fearful.

Traders should look to reverse those drives and to be greedy when they’ve been proven right. If fearful, you can use the breakeven stop to help alleviate the concern that your initial risk is still exposed.

4) Don’t let confidence get the best of you

After putting together a string of successes, it’s human nature to build up confidence around your dealings and this can be a good thing.

But once a trader has gone into the territory of being ‘over-confident’, risky habits may sneak into their approach, none more damaging than the willingness to bend their own trading rules simply because they feel it will be successful.

Therefore, traders should always look to strike that delicate balance between being scared or fearful, and over-confident.

What is OPEC and What is Their Role in Global Markets?

What is OPEC and What is Their Role in Global Markets?

What is OPEC?

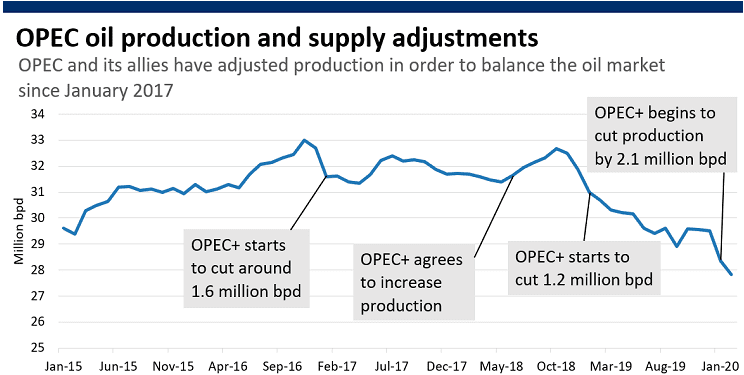
OPEC + is a group of oil-producing countries that controls a significant portion of the world’s oil supply. OPEC, or the Organization of Petroleum Exporting Countries, was founded in 1960 and initially consisted of just five countries: Iran, Iraq, Kuwait, Saudi Arabia, and Venezuela. Since then, the group has expanded to include 14 member countries, including Qatar, Nigeria, and Angola. In 2016, OPEC formed an alliance with 10 non-OPEC oil-producing countries, including Russia, Mexico, and Kazakhstan, to form what is now known as OPEC +. The alliance aims to manage global oil supplies to support oil prices and maintain a stable oil market.

image1.JPG

OPEC+ and Why it Was Formed?

OPEC + was formed in response to the dramatic drop in oil prices in 2014. At the time, oil prices had fallen from over $100 per barrel to below $30 per barrel. The drop in prices was due to a combination of factors, including oversupply, weak demand, and the rise of shale oil production in the United States. OPEC + was formed as a way to address the oversupply problem and stabilize prices.

The alliance has been successful in managing global oil supplies and supporting prices. Since its formation, OPEC + has implemented production cuts to reduce global oil supplies and increase prices. For example, in 2016, OPEC + agreed to cut production by 1.8 million barrels per day. The production cuts have helped to rebalance the global oil market and support prices.

The Impact of OPEC and OPEC+ on the Global Oil Market

The impact of OPEC + on global oil markets is significant. The group controls a large portion of the world’s oil supply and has the ability to influence oil prices through its production decisions. When OPEC + reduces production, oil prices tend to increase. When the group increases production, oil prices tend to decrease.

In addition to its production decisions, OPEC + also influences oil prices through its market sentiment. The group has a strong influence on how the market perceives the state of the oil industry. When OPEC + members express confidence in the oil market, prices tend to increase. When members express concern about oversupply or weak demand, prices tend to decrease.

image2.png

Source: Refinitiv, OPEC and CNBC

*NOTE: The 2.1million bpd reduction in December 2019 includes voluntary reductions.

The influence of OPEC + on global oil markets has not been without controversy. Some critics argue that the group’s production decisions are aimed at benefiting its member countries at the expense of other countries. For example, when OPEC + reduces production, it can lead to higher oil prices, which can benefit member countries but hurt oil-importing countries.

There have also been concerns about the impact of OPEC + on the global transition to renewable energy. Some critics argue that the group’s efforts to support oil prices could delay the transition to renewable energy by making it more difficult for alternative energy sources to compete with oil.

Despite these concerns, OPEC + remains a significant player in the global oil industry. The group’s ability to manage global oil supplies and influence oil prices is likely to continue for the foreseeable future. However, the group may need to adapt to the changing energy landscape, including the growing demand for renewable energy, in order to maintain its relevance in the long term.

The Effects of Production Cuts and Increases by OPEC+

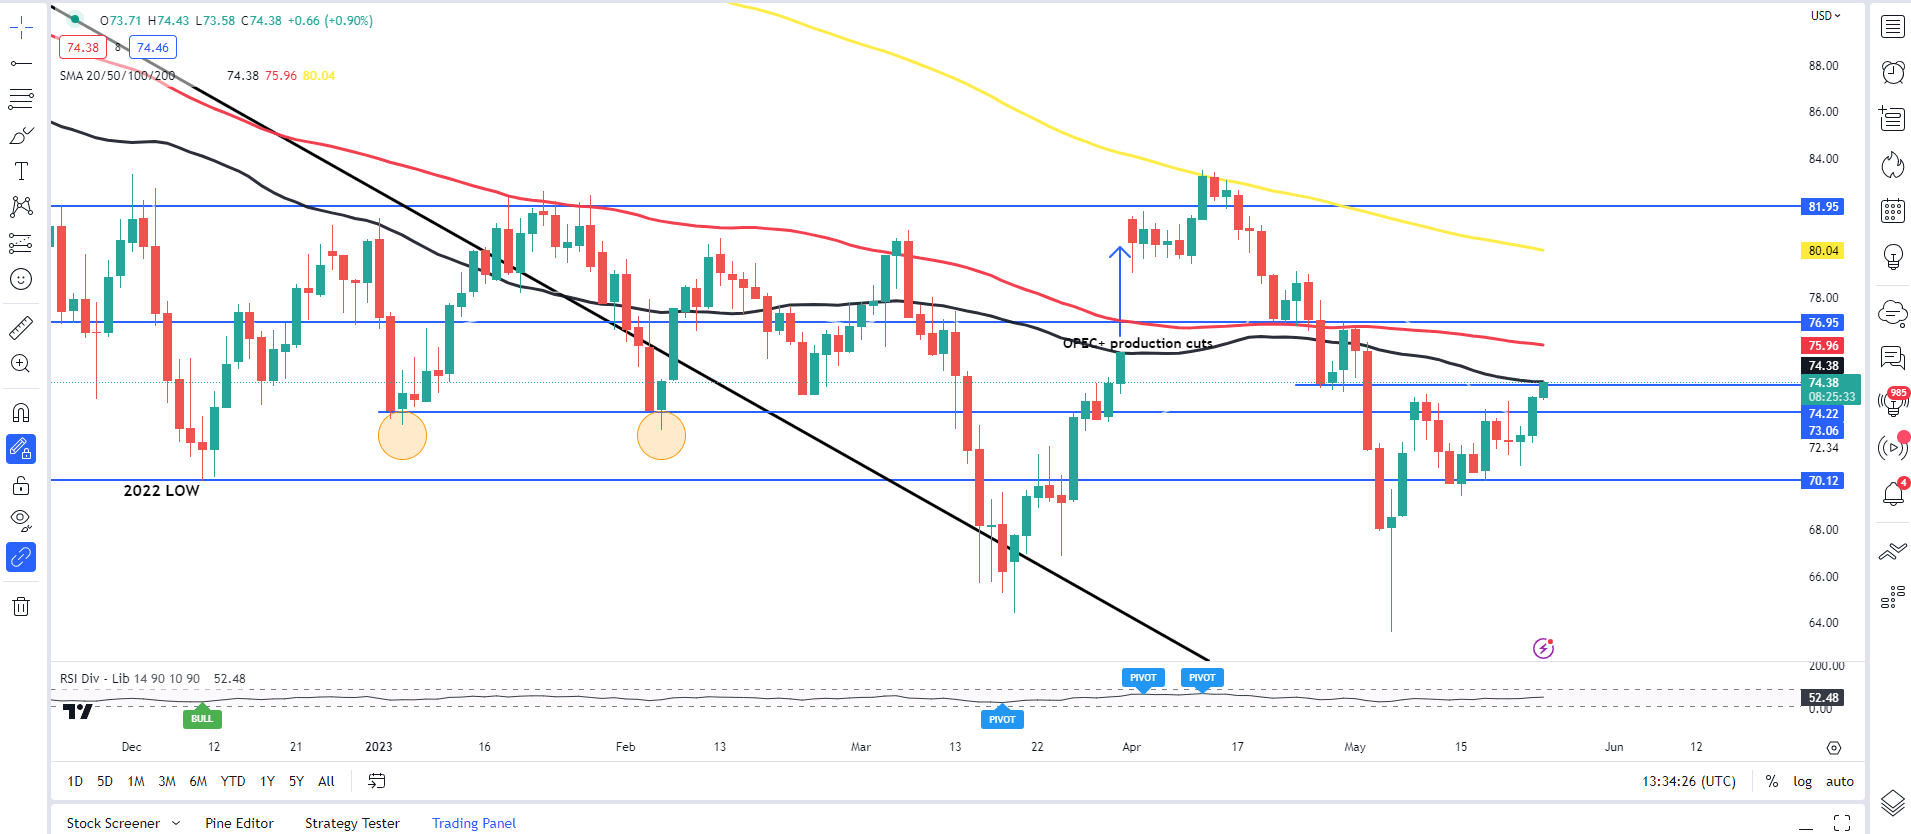
To gauge the effect OPEC + has on the oil market I have a chart below showing WTI oil on a daily chart. OPEC + announced a production cut over the weekend of March 31 to April 2, 2023. The impact saw oil prices gap higher following a Friday close around $75.60 a barrel and open around the $81.38 a barrel mark, a gain of around 7.6%.

image3.png

Summary

In conclusion, OPEC + is a group of oil-producing countries that has a significant impact on global oil markets. The group’s production decisions and market sentiment can influence oil prices, and its efforts to manage global oil supplies have helped to support prices and maintain a stable oil market. While there have been concerns about the group’s influence on the global transition to renewable energy, OPEC + remains a significant player in the global oil industry. As the energy landscape continues to evolve, the group will need to adapt to maintain its relevance in the long term.