Japanese Yen’s Comeback: Analyzing the Recent Market Shift

Japanese Yen’s Comeback: Analyzing the Recent Market Shift

The Yen Makes up More Ground Against the Dollar

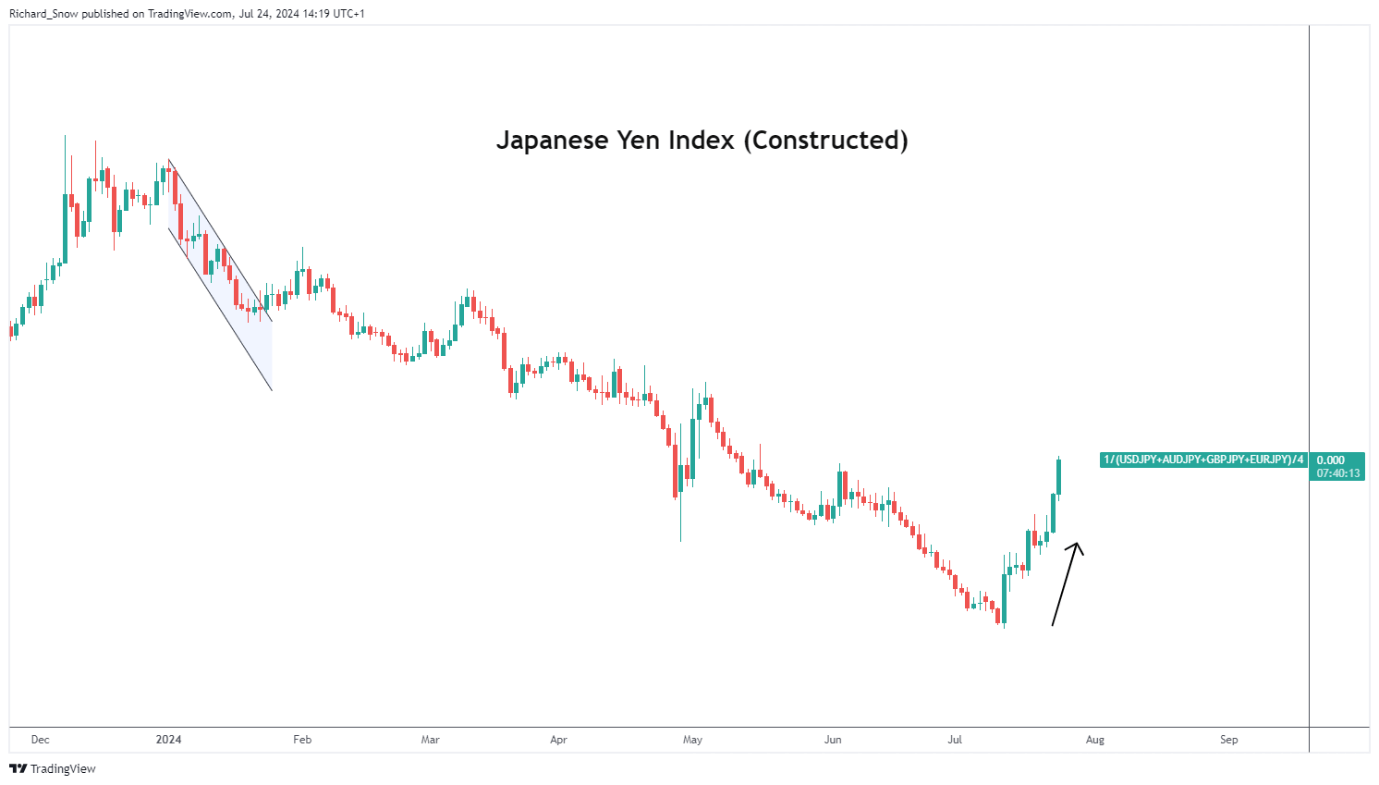
The Japanese yen appreciated against a basket of major currencies on Wednesday, one week ahead of the much-anticipated Bank of Japan (BoJ) meeting. The BoJ mentioned in their June meeting that details around reducing their balance sheet will be made available at the end of this month after disappointing market hopefuls last month.

Japan is in the slow process of policy normalisation whereby it is expected to hike rates to a neutral that is neither stimulatory nor restrictive – said to be anywhere between 0.5% and 1.5% – but is weighing up encouraging inflation data against less than stellar consumption data.

It is hoped that reduced taxes and higher wages would stimulate a rise in local consumption and household sentiment to such a degree that the inflation target of 2% is likely to be breached consistently.

Japanese Index (Equal-Weighting in USD/JPY, GBP/JPY, AUD/JPY, EUR/JPY)
A graph with red and blue lines Description automatically generated

USD/JPY Technical Analysis

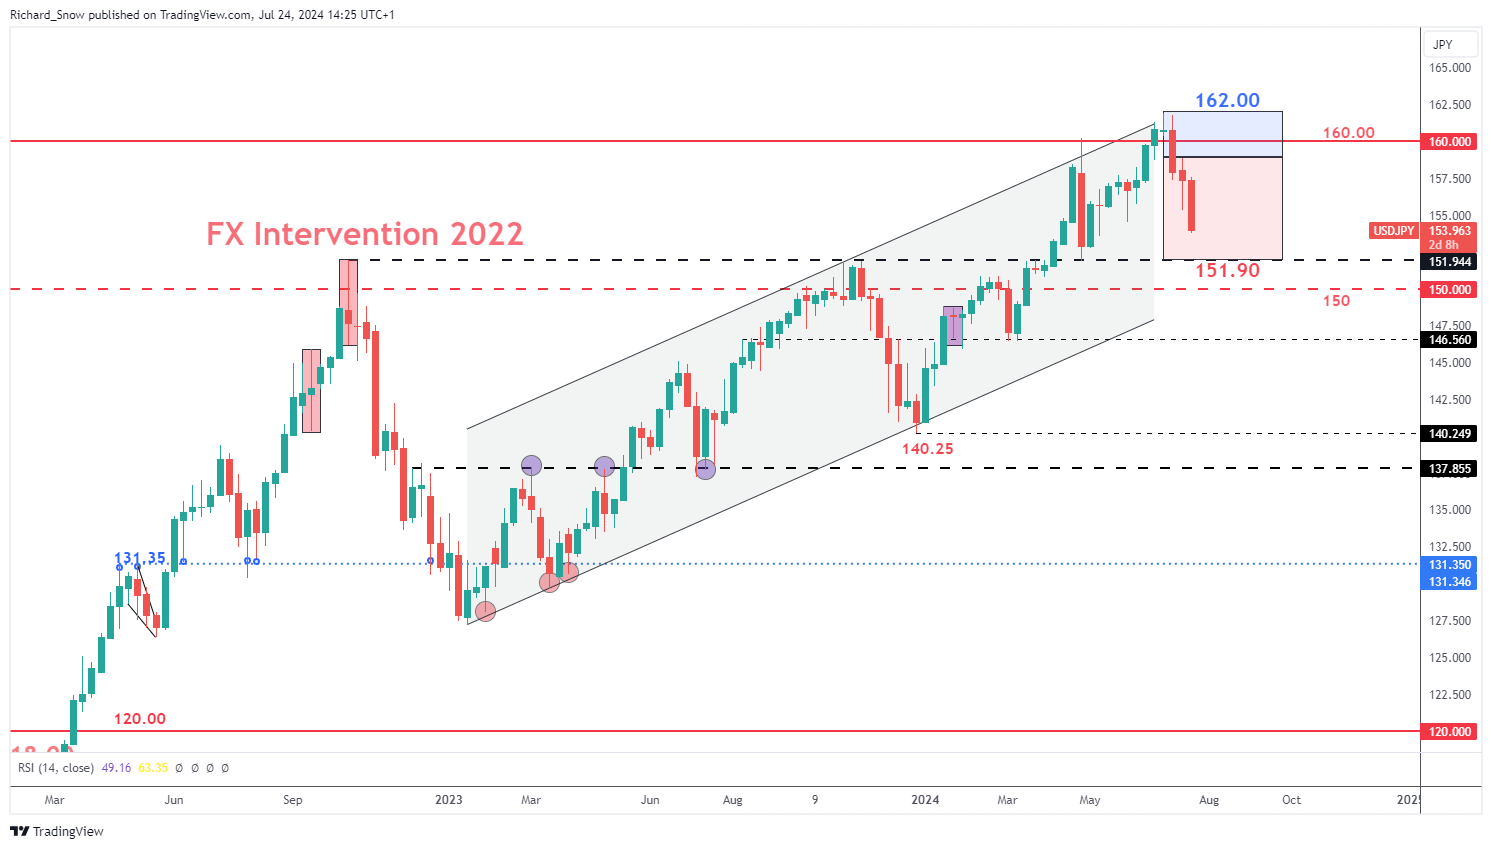
The weekly USD/JPY chart reveals the anticipated Q3 trading range, highlighting both the upward drift at the start of the quarter, followed by the much-anticipated move lower as the yen claws back significant losses. The next level of significance is the 151.90 level of support which market the moment Tokyo decided to intervene in the FX market back in 2022. Get the full insight of surrounding the many factors influencing the yen in our comprehensive Q3 forecast:

USD/JPY Weekly Chart
A graph of stock market Description automatically generated

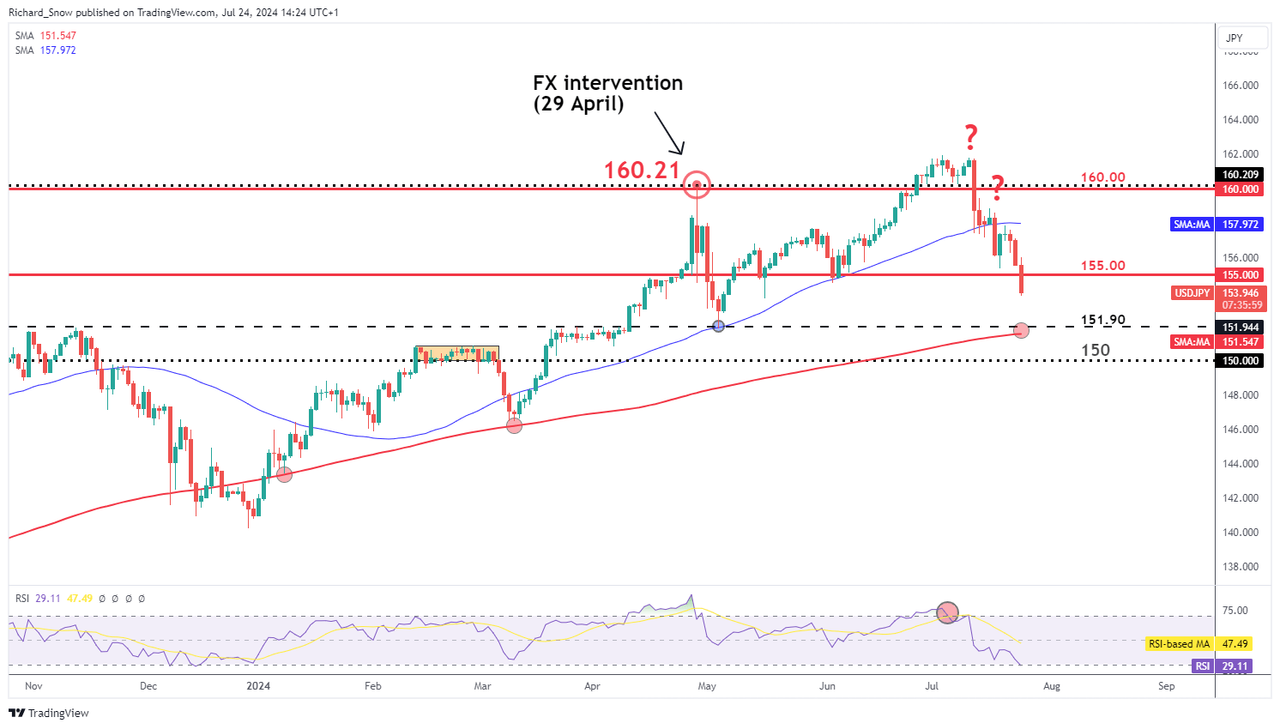
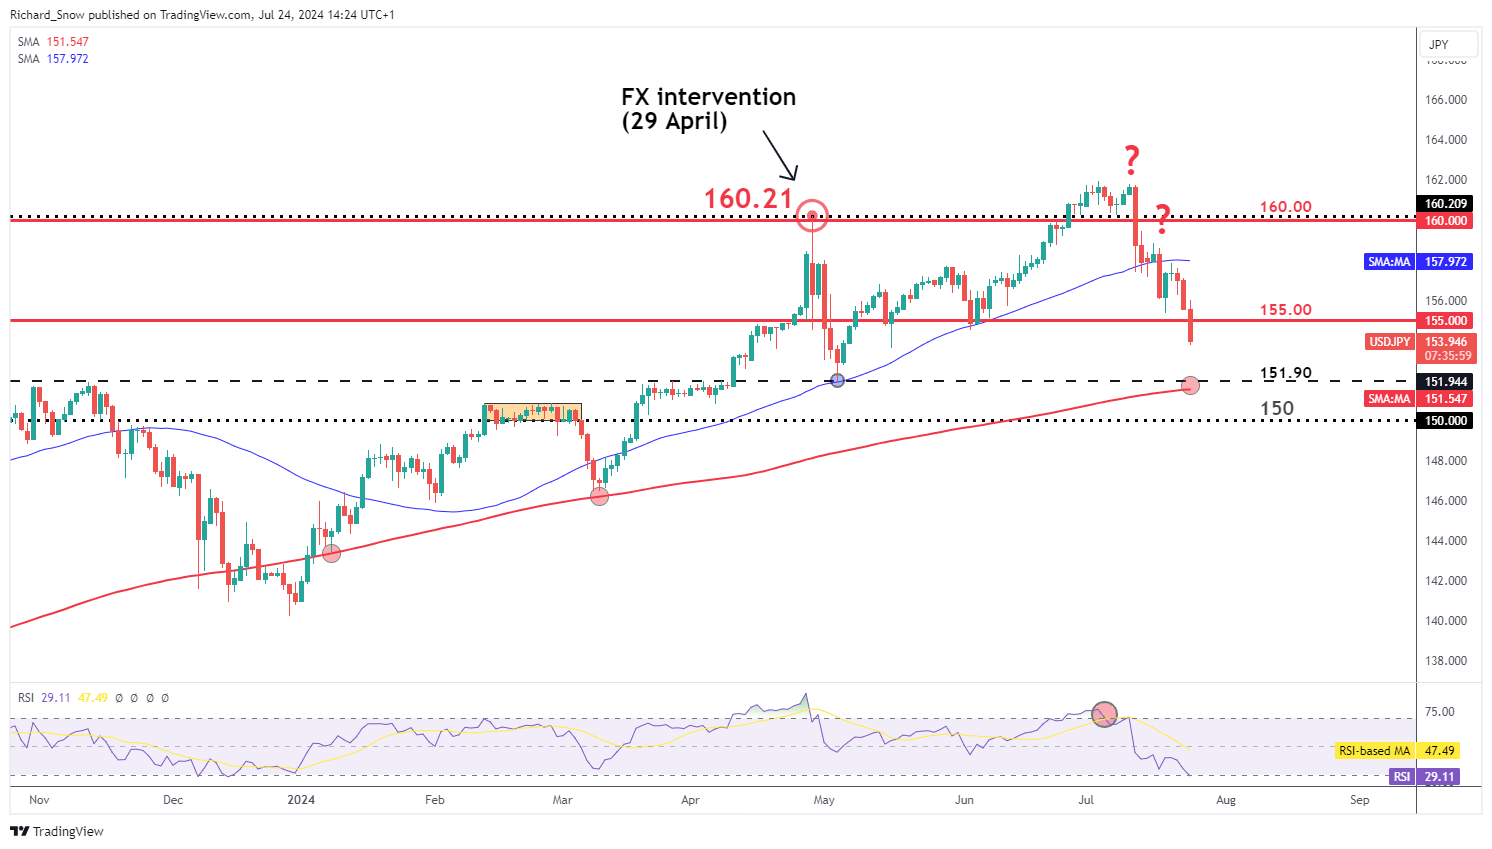
he daily USD/JPY chart shows the recent progress made by the yen, aided by a weaker US dollar and suspected FX intervention from FX officials. Markets have been wrong-footed by Japanese officials as it appears mass yen purchases are being carried out after good news such as lower than expected US inflation. This is in contrast to previous mass yen purchases which were deployed in a reactionary fashion after bad news for the yen like hotter than expected US inflation or economic growth.

The daily chart shows the oversold conditions that hinted at shorter-term bearish reversal which ultimately materialised. Since then, the pair has been riding the bearish wave lower, tagging the 160.00 and 155.00 markers on the way down.

This week’s US PCE data could extend the move if inflation surprises to the downside although, a print in line with expectations may continue the general move just at a slower pace. 151.90 and 150 flat present the next levels of support with the 200-day SMA in between the two levels – providing the next big test for yen bulls.

USD/JPY Daily Chart
A graph of stock market Description automatically generated

BoJ to Decide if Weak Consumption is Likely to Delay Inflation Goal

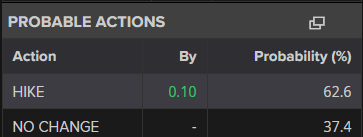
Next week Wednesday the BoJ will have to decide if recent uninspiring consumption figures are likely to stand in the way of the committee’s inflation goal. Markets expect a 62% chance of a rate hike of 0.1% to move the needle ever so slightly towards the neutral rate. The Bank will also provide greater detail around its plans to reduce its balance sheet by reducing the quantity of Japanese Government Bonds it purchases each month. Previously the BoJ sought to contain government borrowing costs to help stimulate the economy through fiscal spending initiatives. Now that the inflation and wages trend upwards, the Bank can afford to allow yields to rise. Higher yields often result in currency appreciation, especially against currencies linked to central banks that are now engaged in a rate cutting cycle.

Market-implied probability of a 0.1% hike at next week’s BoJ meeting
A screenshot of a video game Description automatically generated


How to Trade with Long Wick Candles

How to Trade with Long Wick Candles

Long Wicks Can Provide Valuable Trading Signals

Long wick candles are recurrent within the forex market. This makes understanding the meaning behind these candles invaluable to any trader to comprehend the market dynamics during a specific period.

Trading candle wicks is often overlooked due to its simplicity but appreciating this concept can be a great addition to a trader’s repertoire. This article will outline:

What are long wick candles?

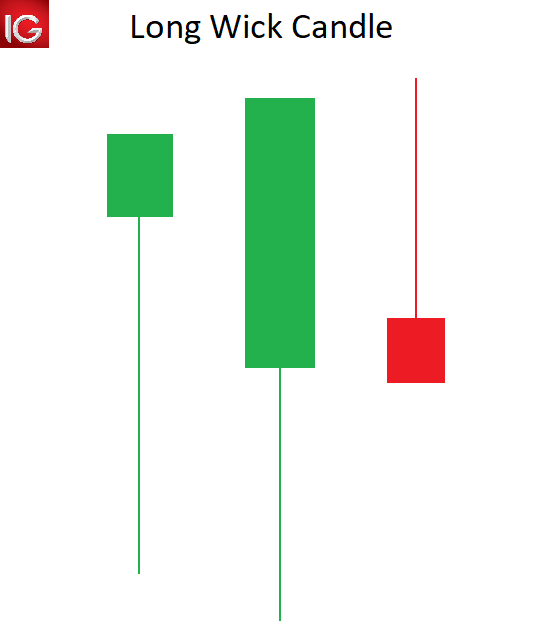
Long wick candles are type of candlestick that have a long wick attached to the candle body. The candle body can be positive or negative, making the long wick appropriate for any type of candlestick.

The length of the candle wick specifies the high and low of price movement within a designated time period. Understanding and trading candlestick wicks can provide forex traders with key tradeable opportunities.

long wicks candle

How to identify a long wick candle on forex charts

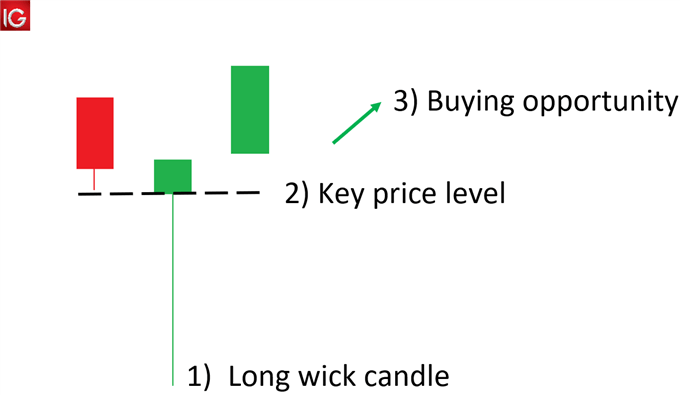
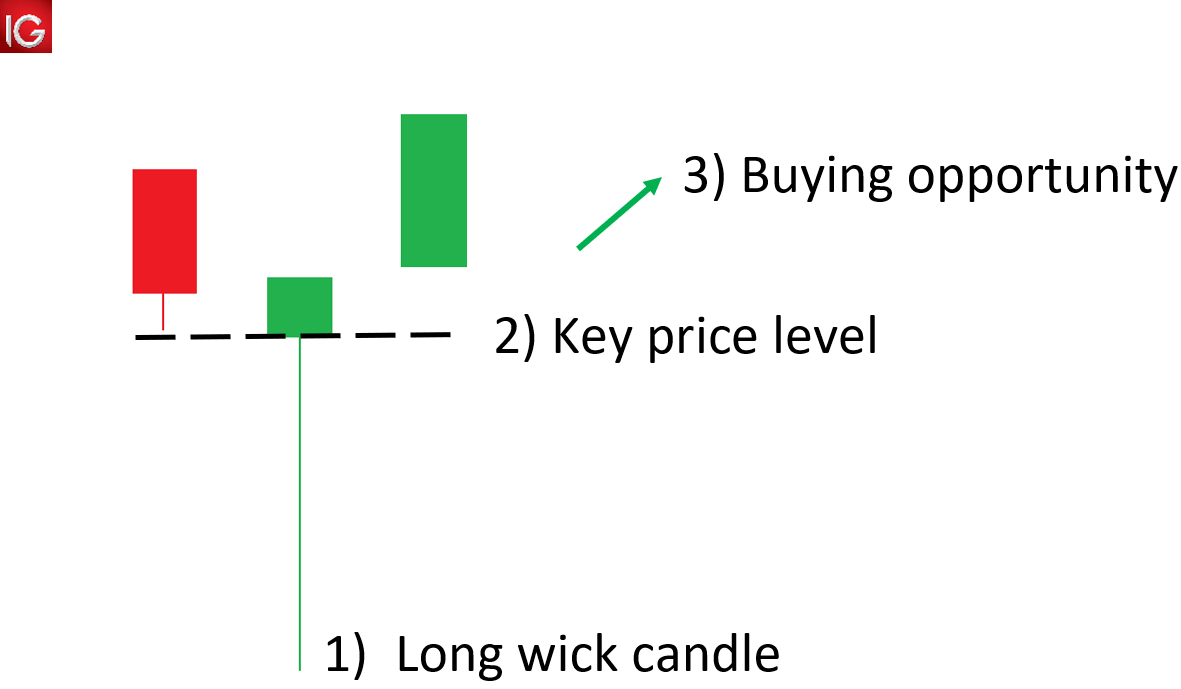
  1. Locate long wicks above/below a candle that is disproportionately longer than that of the surrounding wicks.
  2. Use price action to identify key price levels that may coincide with the long wick, signalling levels of support/resistance.
  3. Use the long wicks and key levels to detect potential trade opportunities.

identifying the long wick candle

What does a long wick indicate in forex?

A long wick candle, like shooting stars, gravestone Doji’s and hammers are part of a “family” of reversal candlesticks. Let’s explore an example:

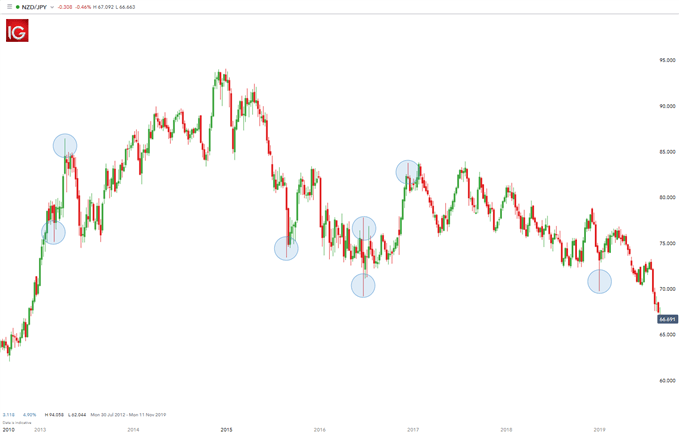
NZD/JPY Long Wick Candles

The chart below shows NZD/JPY on a weekly time frame. Highlighted in blue illustrates long candle wicks prior to a reversal in price movement. In other words, if the longer wick is below the body of the candle, price tends to move up.

Conversely, if the longer wick is above the body of the candle, price tends to move down. These extended wicks (those that are longer relative to other wicks on the chart) provide valuable information for the trader.

trading the long wick candle

A long wick that extends below a candle signifies that sellers were able to push the price down significantly. However, bulls were able to drive price back up showing buyers strength. Since bulls overpowered the selling pressure by bears, there exists the potential that their strength will carry forward leading to an upwards movement in price. The same principal would apply for long wicks appearing above the candle – in the opposite direction.

How can a trader use long wicks in their trading

The first step when utilizing long wicks is to identify the trend (as mentioned above). If the trend is down, seeing a candle (or several candles) with long wicks on the top points to a stronger potential for price to move down in the direction of the market.

Continuing with the downtrend example, if the pair retraces (moves against the trend) and stalls at a level of resistance or a Fibonacci level, traders will look for long wicks at the tops of the candles forming along that resistance line for two reasons:

  1. Those long wicks indicate the potential for the pair to trade to the downside back in the direction of the trend.
  2. The top of that extended wick provides a very prudent level for a trader to place their stop. The rationale for that stop placement being that buyers pushed price to the top of that wick but could not push it beyond that point. Hence, placing the stop just above that wick is a level that has a lower likelihood of getting hit.

There is often confusion amongst traders as to which time frame of chart this strategy can be applied to. For day traders, they may look at 5- or 10-min time frame charts. Swing traders on the other hand may look at other intraday charts like 2-hour or 4-hour charts.


Trading the Bullish Hammer Candle

Trading the Bullish Hammer Candle

The Bullish Hammer Candlestick Pattern: Main Talking Points

The bullish hammer candlestick pattern is frequently observed in financial markets and, like many Japanese candlesticks, provides important insight into market momentum. In particular, the bullish hammer can help to validate a chart’s reversal point.

Traders can exploit the detection of a bullish hammer candle with a proper understanding of its foundations. This article will outline the following:

  • What is a bullish hammer?
  • Using a Bullish Hammer Candlestick Pattern in Trading
  • Further Reading on Trading with Candlestick Patterns

What is a bullish hammer?

A bullish hammer is a single candle found within a price chart indicating a bullish reversal. It differs from other  candlestick patterns  due to its single candle hinting at a turn during an established downtrend.

Pictured below the hammer is interpreted by understanding a candles particular open, low high and close levels. To create a hammer, price must first significantly sell off to create a new low for a currency pair. However, after this decline, prices must significantly rally causing prices to have a small body and close near its opening price.

bullish hammer candle

It’s important to remember that bullish hammers should have long wicks at least twice the length of the candle body. In addition, the candle itself can either be red or green depending on the strength of the reversal.

Often the bullish hammer is confused with a bearish hanging man candle. The misrepresentation is logical because both candles look identical. The difference between these two candles lies in their placement in a trending market. The hanging man has a small body and long wick but is found hanging at the end of an uptrend. Bullish hammers have small bodies and long wicks also but are only seen at the end of a downtrend.

How to spot a Bullish Hammer pattern:

  • Candle with a short body and long wick (at least 2x the size of the body)
  • Occurs at the bottom of a downward trend
  • Confirmation from other indicators as mentioned below

What does it indicate:

  • Trend reversal to the upside (bullish reversal)
  • Price rejection at a certain ‘key level’

Value to traders:

  • Indicates potential price reversals which could lead to entering a long position at the start of an upward swing – capitalize on the full upward movement
  • Easy to identify

Using a Bullish Hammer Candlestick Pattern in Trading

Bullish hammer candlestick in the forex market

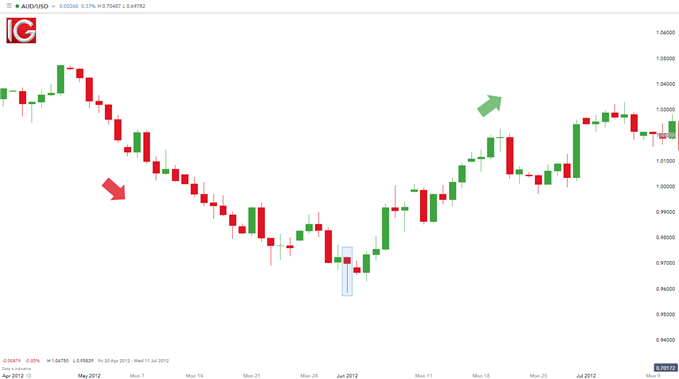
Bullish hammer candles can be found on a variety of charts and  time frames. Depicted above is an example of the hammer on the AUD/USD daily chart. From 20 April through to 31 May the AUD/USD fell as much as 892 pips. This downtrend was concluded with a bullish hammer candle, and price has subsequently rallied a total of 792 pips through today’s price action.

AUD/USD Bullish Hammer candlestick:

AUD/JPY bullish hammer candle

As the strength of a hammer depends on its placement on the graph, normally traders use this candle in conjuncture with other indications of price support. This includes using tools such as Fibonacci retracements, pivot points and psychological whole numbers. In an ideal scenario, the wick of the hammer will penetrate a support level, but the body will close above support on renewed buying sentiment. With a new buying opportunity presented, traders may then choose to place stops under the created wick below support.

Bullish hammer candlestick in the equity market

The bullish hammer candle is interpreted the same way in all financial markets (indices, forex, commodities and stocks) however, stock analysis requires further data as confirmation. It is important to note that brokers generally show internal volume figures for the other financial markets including forex which is why the volume indicator is not reliable for an overall market volume estimate.

The chart below shows a bullish hammer candle on a Barclays PLC chart. In conjunction with the bullish hammer, there is a subsequent relative increase in volume traded as highlighted. This emphasizes institutional activity for this period due to the large volume – retail traders will not be able to affect such large volumes.

This ‘denial’ by bulls (traders taking long positions) after the recent swing low displays price rejection at that level. This level may be a key level whereby ‘buy’ order are triggered. With the bullish hammer and the volume exhibit this relationship, traders can have some form of validation to place a long trade. As always, the principals of risk management should apply to all trades.

Barclays PLC Bullish Hammer:

Barclays PLC bullish hammer candle

Further Reading on Trading with Candlestick Patterns

The bullish hammer candle is one of many bullish price patterns that can assist traders when entering a trade. Other bullish patterns traders should be aware of, include: morning star and the inverse  head and shoulders  among others.

Day traders, however, incorporate the use of  indicators  and key levels of support and resistance, alongside candlesticks, to substantiate trades before entering. Other aides you can use to improve your trading include our free  trading guides and for those just getting started, take a look at our  New to FX guide.

Overbought vs. Oversold and What This Means for Traders

Overbought vs. Oversold and What This Means for Traders

OVERBOUGHT VS OVERSOLD

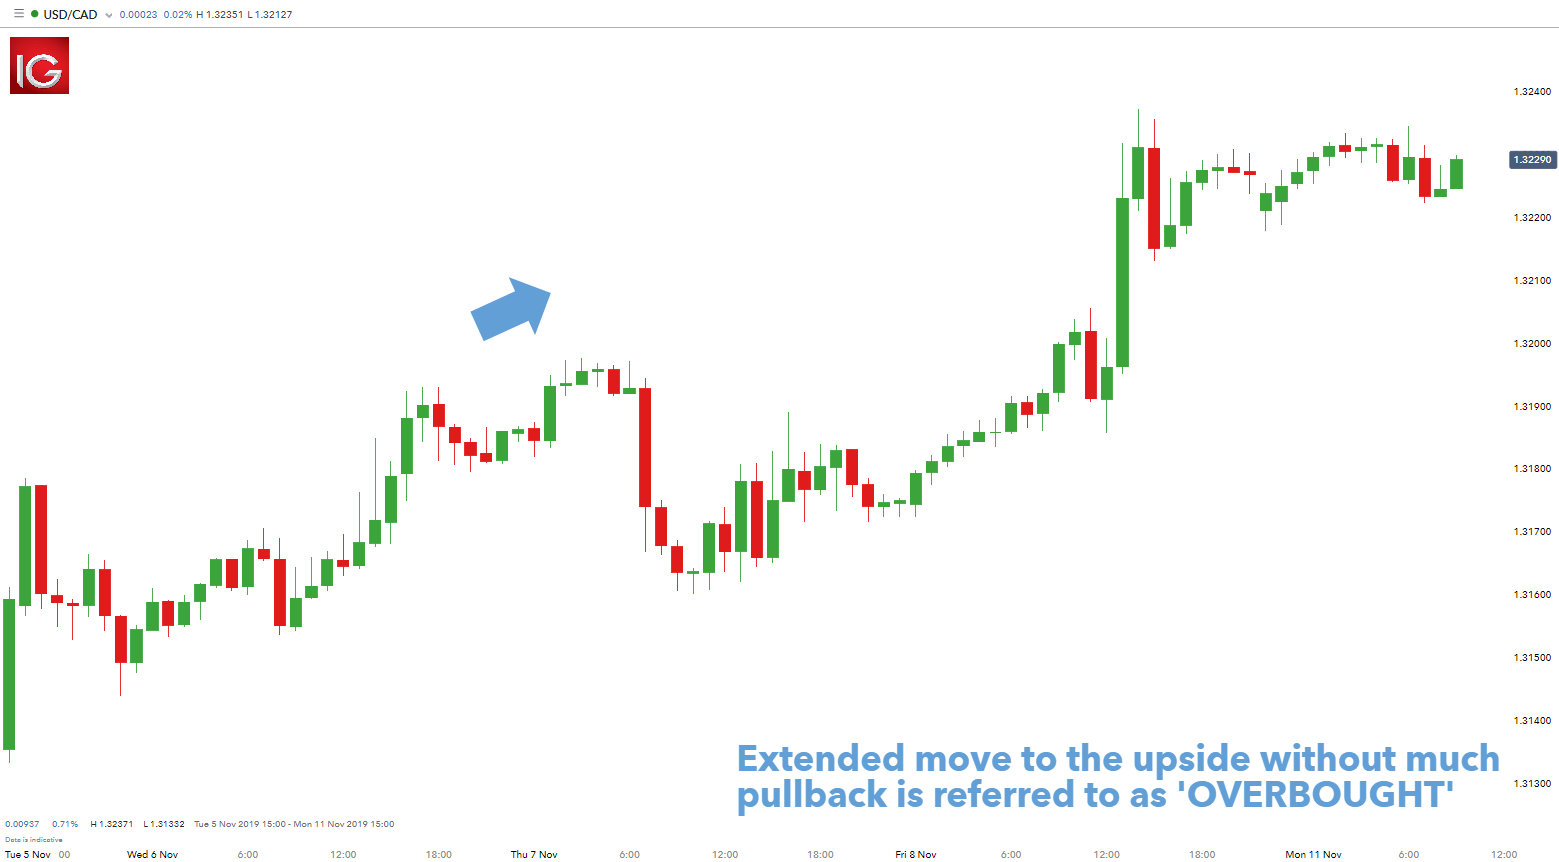
These two terms actually describe themselves pretty well. Overbought defines a period of time where there has been a significant and consistent upward move in price over a period of time without much pullback. This is clearly defined by a chart showing price movement from the “lower-left to upper-right” like the chart shown below.

LEARN FOREX: USD/CAD HOURLY CHART – OVERBOUGHT

USD/CAD hourly chart overbought

The term oversold illustrates a period where there has been a significant and consistent downward move in price over a specified period of time without much pullback. Essentially, a move from the “upper-left to the lower-right” – see chart below.

LEARN FOREX: AUD/JPY WEEKLY CHART – OVERSOLD

AUD/JPY hourly chart oversold

Since price cannot move in one direction forever, price will turn around at some point. Currency pairs that are overbought or oversold sometimes have a greater chance of reversing direction however, could remain overbought or oversold for a very long time. Therefore, traders need to use an oscillator to help determine when a reversal could occur.

OVERBOUGHT OVERSOLD INDICATOR READINGS WITH RSI

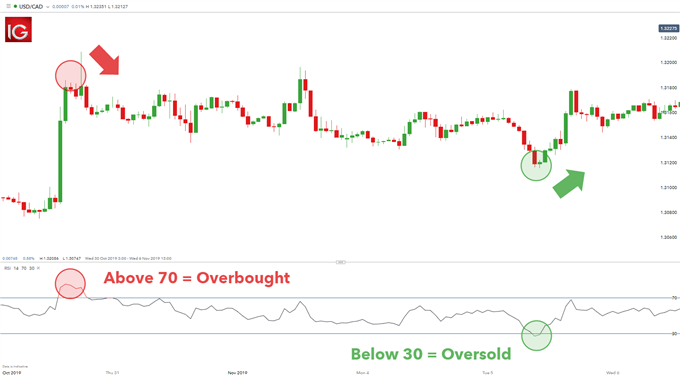
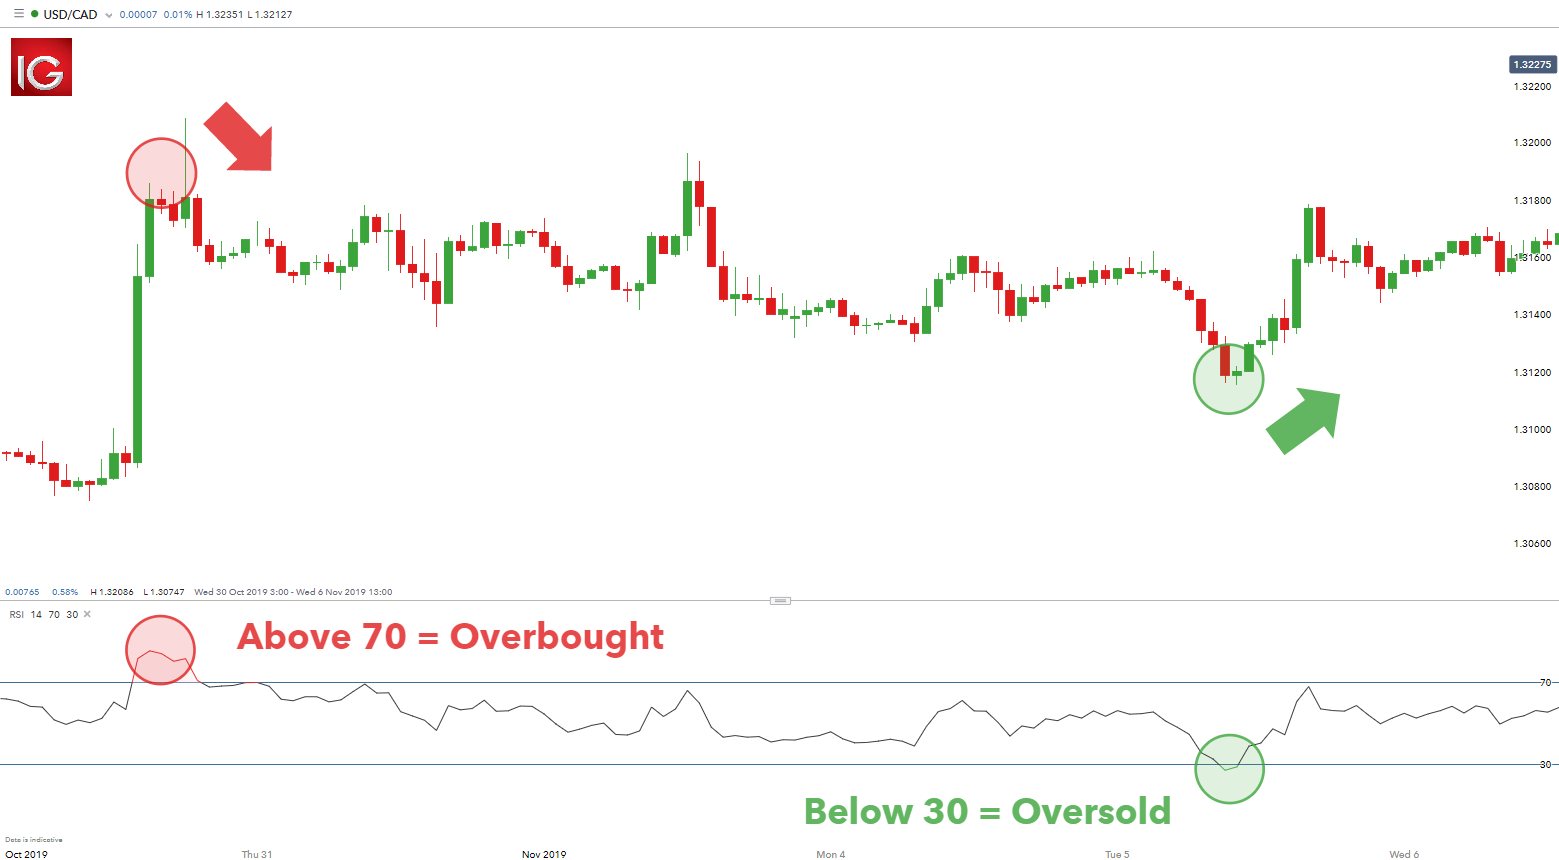
There is a quick tool traders can use to gauge overbought and oversold levels, the Relative Strength Index (RSI). The premise is simple, when RSI moves above 70, it is overbought and could lead to a downward move. When RSI moves below 30, it is oversold and could lead to an upward move.

RSI OVERBOUGHT AND OVERSOLD LEVELS:

USD/CAD RSI overbought vs oversold levels

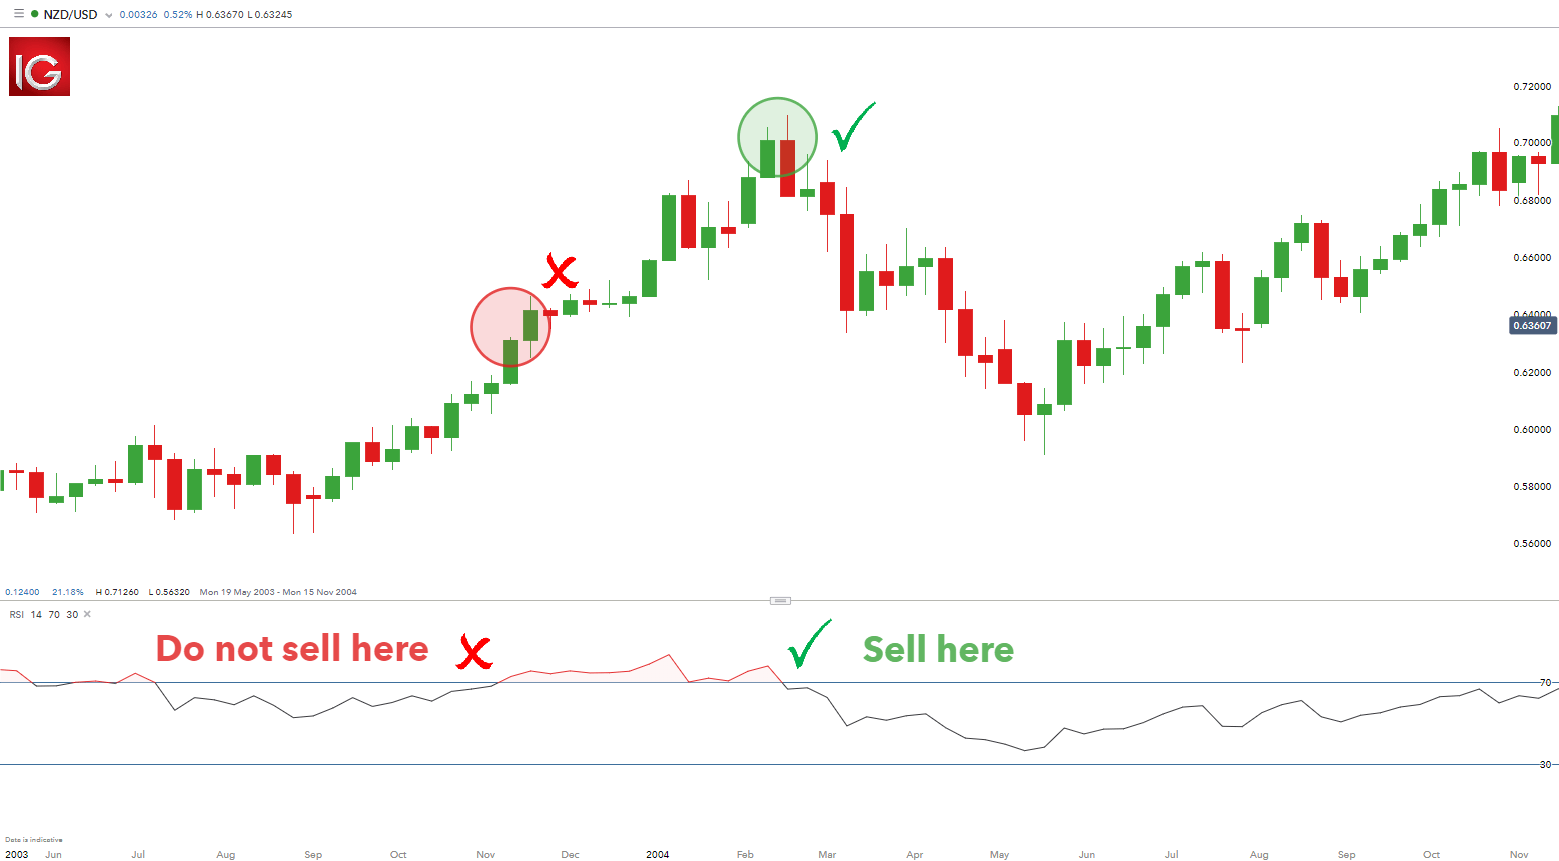
Traders need to be patient before entering trades using the RSI as on occasion the RSI can stay overbought or oversold for a prolonged period as seen on the chart below. A common error made by traders is attempting to pick a top or bottom of a strong move that continues to move further into overbought or oversold territory. The key is to delay until the RSI crosses back under the 70 or over the 30 as an instrument to enter.

RSI PROLONGED OVERBOUGHT AND OVERSOLD SIGNALS

NZD/USD hourly chart overbought

The image above shows the RSI clearly breaking above the 70 level resulting in an overbought reading, but a seasoned trader will not look to immediately sell because there is uncertainty as to how far price could continue to rally. Traders ideally will wait until the RSI falls back below 70 and then place a short trade. This gives a better entry and a higher probability trade. When the RSI falls below 30, same rules apply.

FREQUENTLY ASKED QUESTIONS (FAQs)

How reliable are overbought and oversold signals?

Overbought and oversold signals as a solitary signal is not entirely reliable. Think of building a house; a builder is reliant on a hammer but as an isolated tool, the hammer is worthless when building an entire house. Other tools will be needed in conjunction with the hammer for construction – saw, drill etc. The same concept relates to overbought/oversold signals which requires complimentary tools to strengthen the signal, and eventually allow traders to make sound trade decisions. For example, trend identification, risk management and sentiment are useful tools that help compliment overbought and oversold signals.

What can traders do to strengthen/support overbought and oversold signals?

There are several common tools that can be used to compliment overbought and oversold signals. Below is a list of tools that can enhance your trading decisions:

  1. Identify the trend – Filtering for the trend can aid traders in selecting entry points using overbought and overbought signals. For example, in an uptrend traders will filter for oversold signals as ‘long entry’ points which correlate to direction of the trend. The opposite will apply to a downtrend.
  2. Risk management – Using proper risk-reward ratios which relate to stop and limit levels should be adhered to.
  3. Sentiment– Utilize client sentiment data to further verify overbought and oversold signals.

Meta Q2 2024 Earnings Preview: Steady Growth and a Focus on its AI Story

Meta Q2 2024 Earnings Preview: Steady Growth and a Focus on its AI Story

What should traders look out for?

Last quarter, Meta reported a revenue beat of $36.46 billion vs. $36.16 billion expected and an EPS beat of $4.71 per share vs. $4.32 expected.

The company reported the following key numbers.

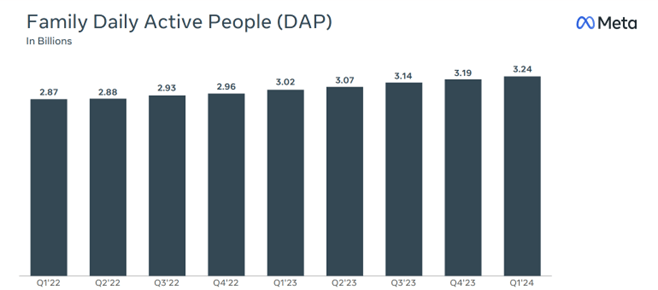
  • Family daily active people (DAP) – DAP was 3.24 billion on average for March 2024, an increase of 7% year-over-year.
  • Ad impressions – Ad impressions delivered across Family of Apps increased by 20% year over year.
  • Average price per ad increased by 6% year over year.
  • Headcount fell to 69,329 as of March, a 10% decrease year over year.

Meta founder and CEO Mark Zuckerberg noted the strong start to the year and said, “The new version of Meta AI with Llama 3 is another step towards building the world’s leading AI. We’re seeing healthy growth across our apps and we continue making steady progress building the metaverse as well.”

Nonetheless, Meta’s Q1 2024 earnings report met with a cool reception. Its share price dived 16% in after-hours trading as investors focused on its Q2 2024 sales forecasts, at the lower end of analysts’ estimates and after it said it expects its 2024 capital expenses to be higher than anticipated due to its investments in AI.

Chart – Family Daily Active People (DAP) in billions

Meta Earnings – What to Expect

During its Q1 Earnings report, Meta said it expected Q2 2024 revenues to be between $36.5 billion to $39 billion. The midpoint of the range, $37.75 billion, would represent 18% year-over-year growth and is just below analysts’ average estimate of$38.3 billion.

The company also said that it expected total expenses in 2024 to be $96-99 billion – more than previously forecasted due to higher infrastructure and legal costs. Full-year 2024 capital expenses are expected to be in the range of $35-$40 billion, up from the prior range of $30-$37 billion as the company continues to “accelerate our infrastructure investments to support our artificial intelligence roadmap.”

Key Financials – Summary

Revenue: $38.29 bn vs $36.46bn in Q1 2024

EPS: $4.70 vs $4.71c in Q1 2024

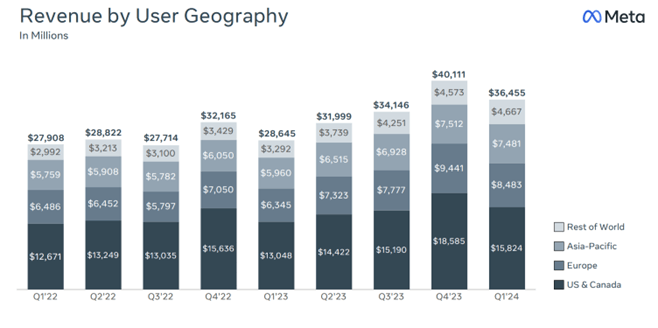
Chart – Meta Sales Revenue by User Geography

What else to watch for?

Advertising Performance – Advertising revenues increased by 27% in Q1. The market will look for a similar performance in Q2 2024.

User Engagement Metrics – DAP reached 3.24 billion on average in March 2024, a gain of 7% year over year. Investors will be looking for continued growth in this area.

AI integration and impact – Meta emphasised AI integration in its products, contributing to strong financial results in Q1.Look for updates on how AI is improving user engagement, particularly in areas like Reels, where AI-powered recommendations have led to an 8-10% increase in watch time.

Expenses and profitability – Meta increased its capital expenditure outlook for 2024 to between $35 billion and $40 billion.Watch for any further increases to expense projections and their impact on profitability.

Reality Labs performance – Reality Labs includes virtual, augmented, and mixed reality related consumer hardware, software and content used in developing the MetaVerse. Analysts expect the division to show an operating loss of $4.31 billion for the quarter as it continues to bleed cash.

Forward guidance—Investors will look for guidance on Meta’s outlook for Q3 and the rest of 2024, as this will provide insights into the company’s expectations for growth and challenges in the coming months.

Meta Shares Technical Analysis

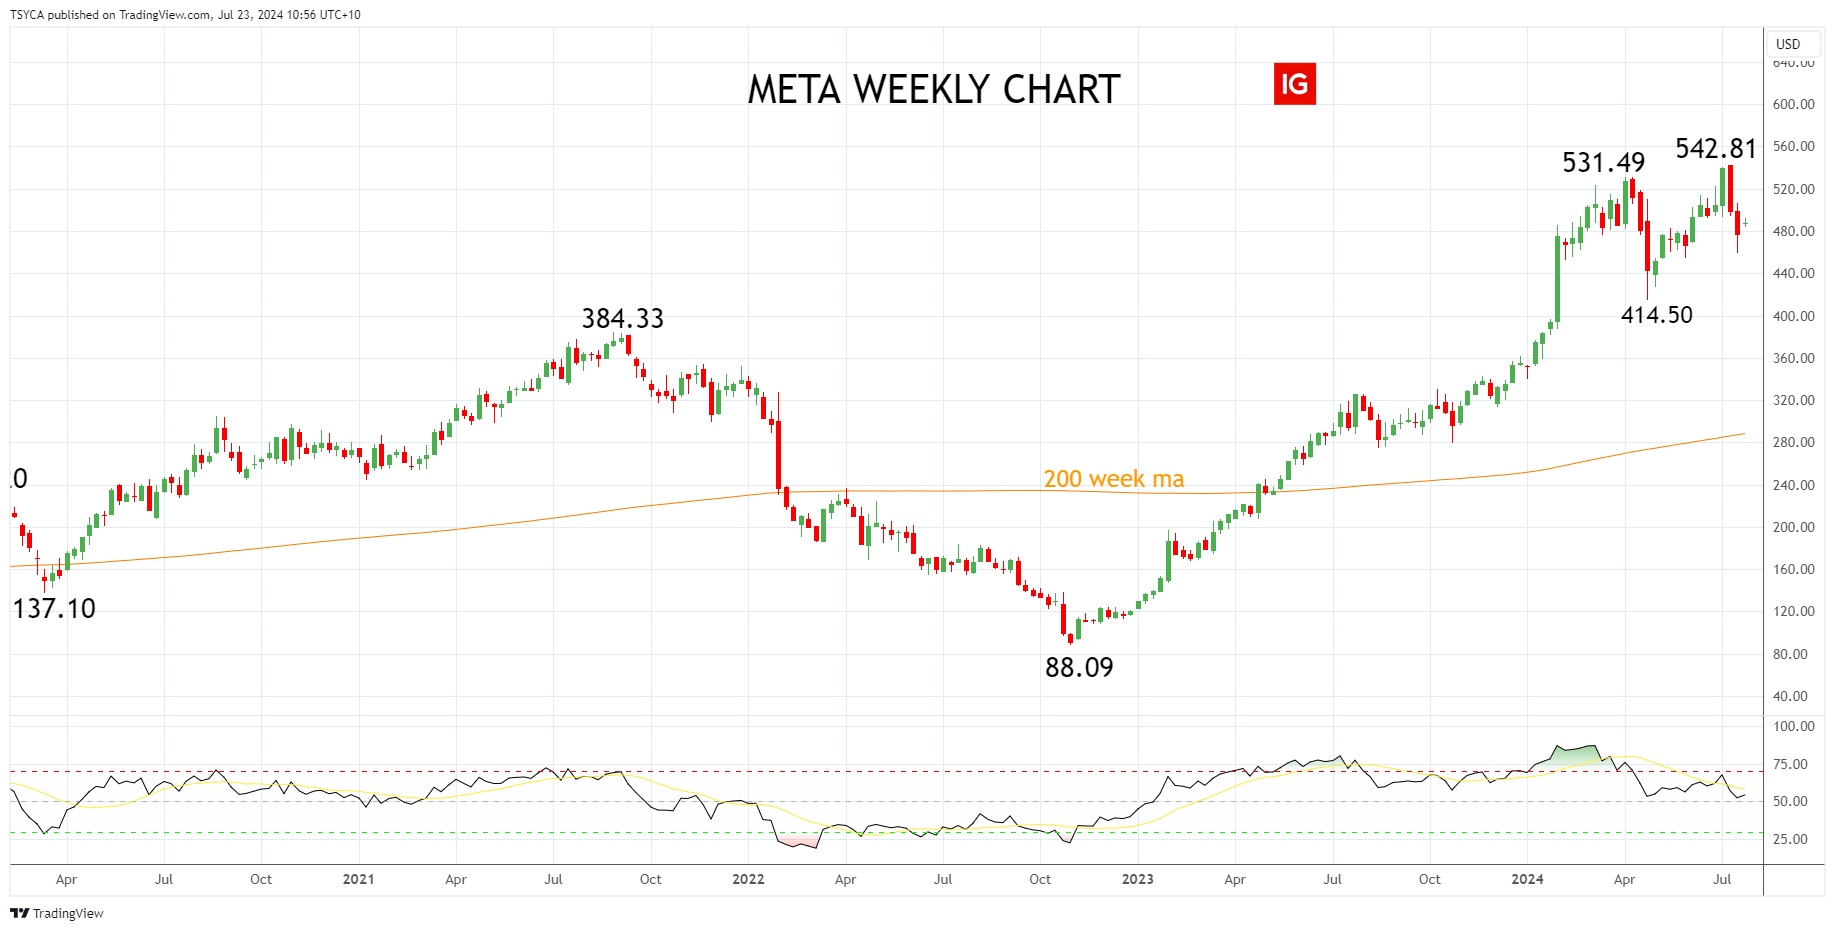
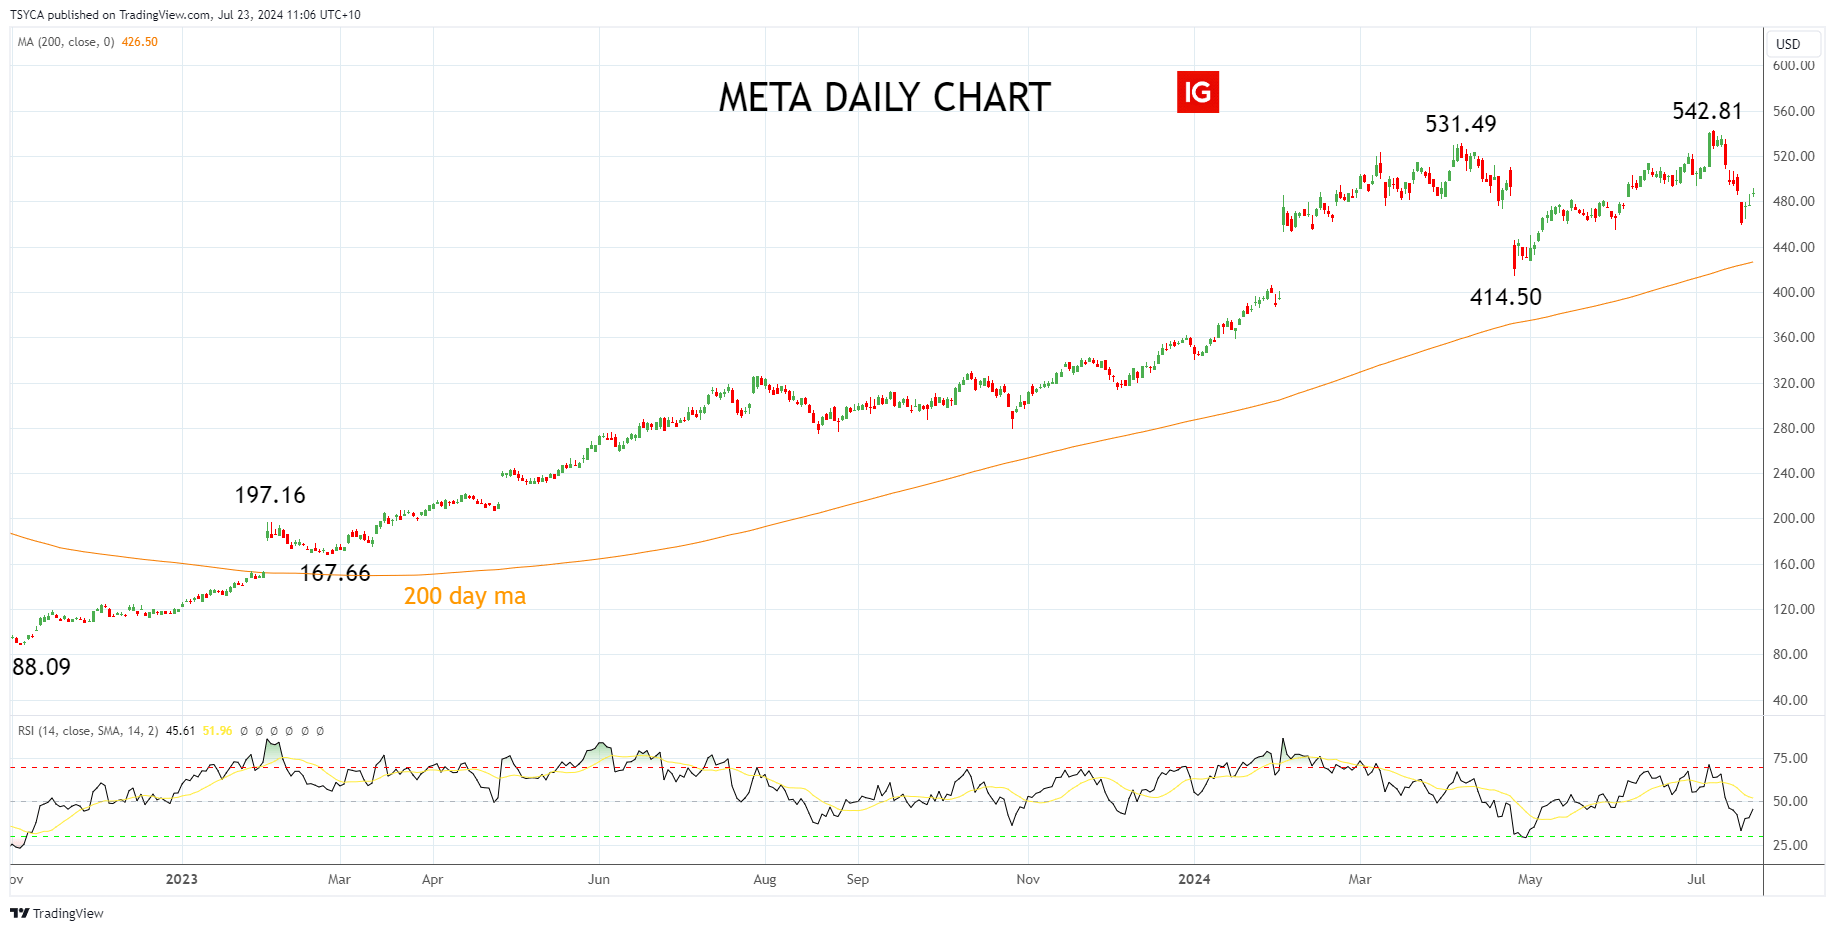
Meta’s share price soared 194% in 2023, reclaiming all and more of the losses it suffered in 2022 after hitting a low of $88.09.

Meta has extended its gains in 2024, reaching a fresh record high of $542.81 in early July. Notably, the high was made on selling, with the Meta share price falling 15% in the following two weeks.

Meta Weekly Chart

Turning to the daily chart, while Meta’s share price has been able to ride the AI tech frenzy higher in 2024, we note the bearish divergence that occurred at the early July $542.81 high, evident via the RSI indicator.

Bearish divergence and the possibility of a completed five-wave Elliott Wave advance from the $88.09 low to the $542.81 high indicate that Meta’s share price may have already entered a correction.

This could see Meta’s share price test support in the $426/$414.50 area, which includes the 200-day moving average and the April $414.50 low. Buyers would be expected to be operating in this support region, in anticipation of the uptrend resuming.

Meta Daily Chart

Summary

Meta is scheduled to report its second quarter (Q2) earnings after the market closes on Wednesday, July 31st, 2024. While expectations are high, the technical picture suggests that the Meta share price may have entered a correction which may offer better buying levels before the uptrend resumes.

Source Tradingview. The figures stated are as of July 22nd, 2024. Past performance is not a reliable indicator of future performance. This report does not contain and is not to be taken as containing any financial product advice or financial product recommendation.

Ethereum (ETH) Spot ETFs Up and Running

Ethereum (ETH) Spot ETFs Up and Running

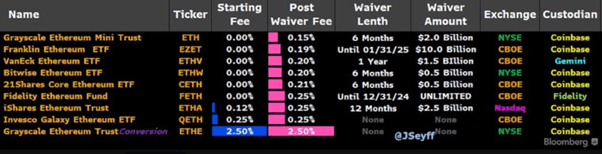
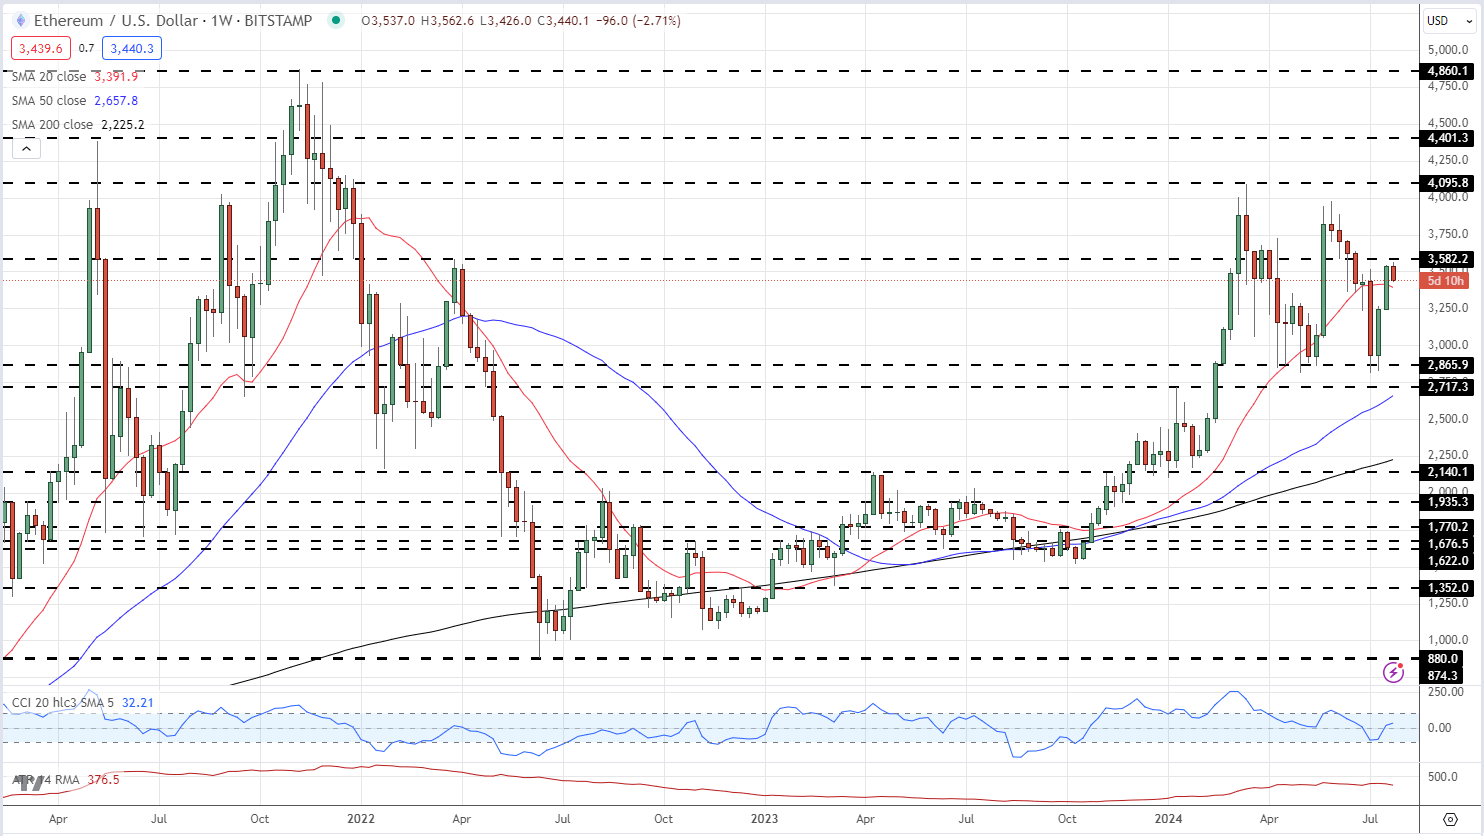
Ethereum spot ETFs are set to begin trading today, giving a larger audience a second cryptocurrency exchange-traded fund to look at after Bitcoin spot ETFs hit the market in early January this year. All nine ETFs start trading today and while there is likely to be demand for these products, it is unlikely to be on the same scale as the Bitcoin spot ETF launch.

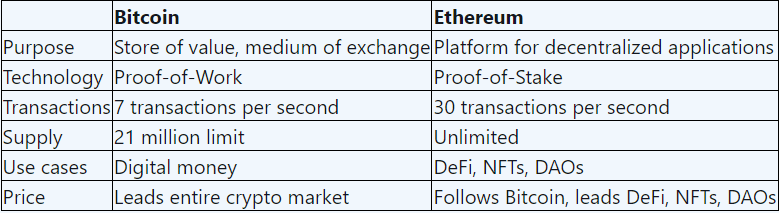
There remain a number of major differences between Bitcoin and Ethereum with BTC seen as digital money while ETH is seen as a global application platform. The supply of Bitcoin is fixed at 21 million, while Ethereum’s supply is technically unlimited. The fixed issuance/halving of Bitcoin is seen as a major selling point, while the ability of the Ethereum Foundation to issue new ETH if/when needed reduces the scarcity factor and allure for some investors. In addition, current holders of Ethereum tokens are able to ‘stake’ their tokens, while the new ETFs do not have a staking option due to SEC concerns.

Ethereum’s staking system offers users an opportunity to actively participate in network security while earning rewards. Ethereum holders can stake their ether tokens, contributing to the operation and security of the network. In return for their participation, stakers receive new ether tokens and transaction fees, effectively a yield on their staked money. The current Ethereum staking yield is around 3.2%.

image1.png

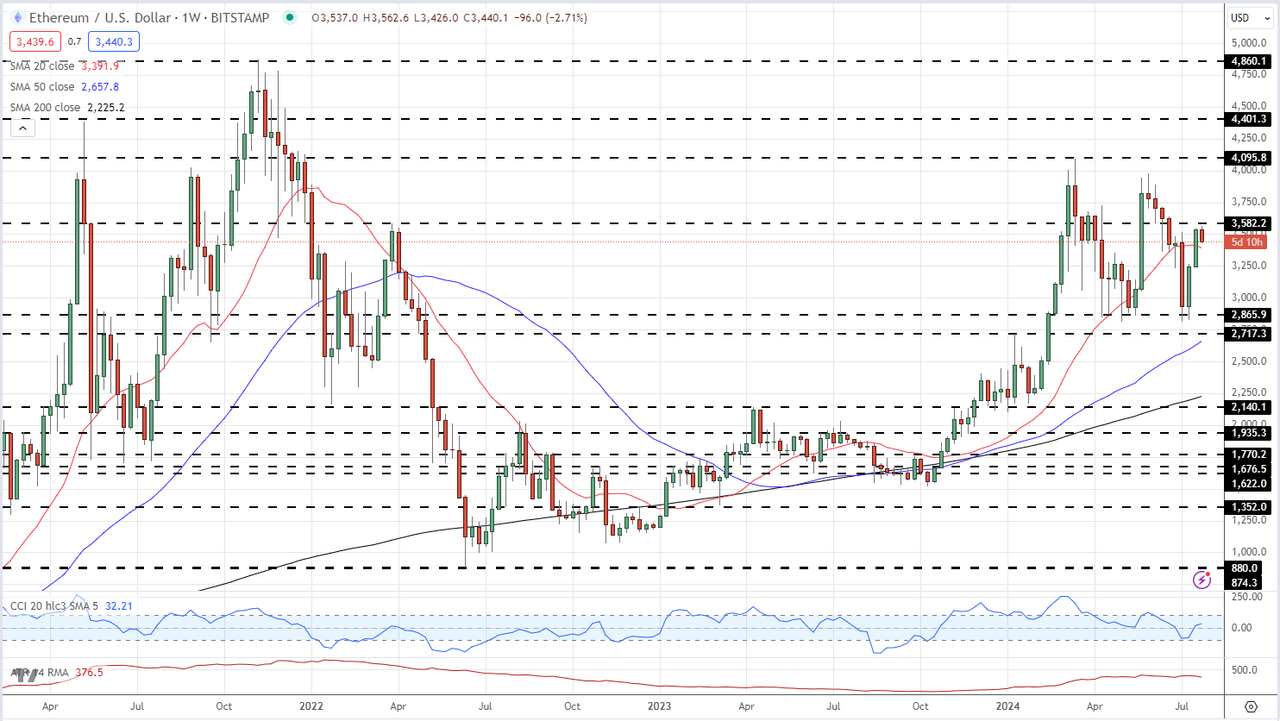
With a new flow of demand expected, Ethereum is likely to move higher but gains may be limited in the short-term as other macro drivers dominate the landscape, in particular the upcoming US elections. In the longer term, and especially if spot ETH staking is approved, the price of Ethereum should move higher and break the November 2021, all-time high at $4,898.

Ethereum Weekly Price Chart

image2.png


Currency Carry Trade: What is it and How Does It Work?

Currency Carry Trade: What is it and How Does It Work?

A currency carry trade involves borrowing a low-yielding currency in order to buy a higher yielding currency in an attempt to profit from the interest rate differential. This is also known as “rollover” and forms an integral part of a carry trade strategy. Traders gravitate towards this strategy in the hope of collecting daily interest payments over and above any currency appreciation from the actual trade.

This article explains FX carry trades with the use of examples and presents a top carry trade strategy to use in your trading.

What is a currency carry trade and how does it work?

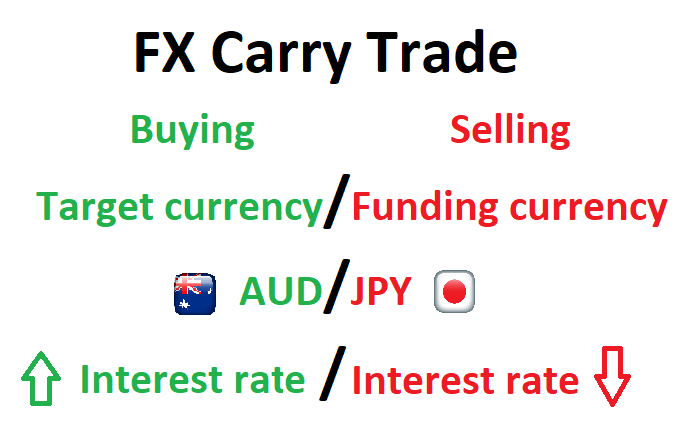
An FX carry trade involves borrowing a currency in a country that has a low interest rate (low yield) to fund the purchase of a currency in a country that has a high interest rate (high yield). Holding this position overnight will result in an interest payment being made to the trader based on the “positive carry” of the trade.

The lower yielding currency is referred to as the “funding currency” while the currency with the higher yield is referred to as the “target currency”.

Currency carry trade infographic

“Rollover” is the process whereby brokers extend the settlement date of open forex positions held past the daily cut-off time. The broker either debits or credits the account, based on the direction of the trade (long or short) and whether the interest rate differential is positive or negative. Since interest is quoted as an annual figure, these adjustments will be the daily adjusted rate.

Interest rates

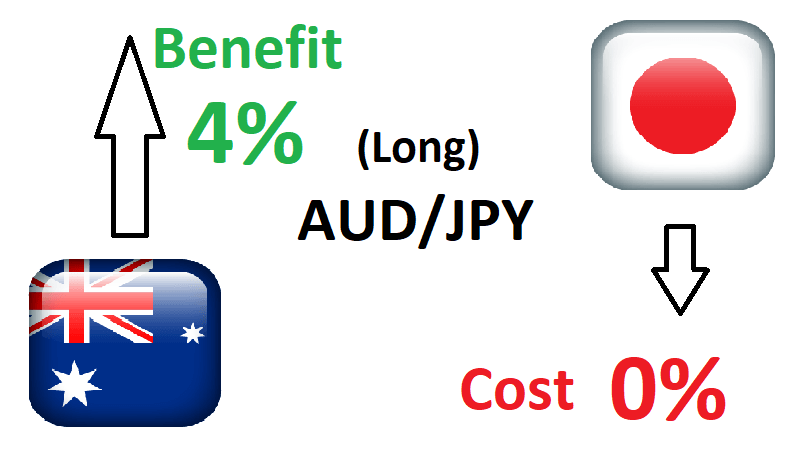
Interest rates are set by a country’s central bank in accordance with the mandate of that country’s monetary policy – this will differ from country to country. A trader then earns interest on a position when they are long the currency in the pair with the higher interest rate. For example, if the Australian dollar offers 4% and the Japanese Yen has interest rates set at 0%, traders could look to buy (long) AUD/JPY to take advantage of the 4% net interest rate differential.

There are two main components to the FX carry trade:

1) Changes in interest rates

The main component of the carry trade is centered around the interest rate differential between the two traded currencies. Even if the exchange rate between the two currencies remains unchanged, the trader will profit from the overnight interest payment. However, over time, central banks deem it necessary to alter interest rates and this poses a potential risk to the carry trade strategy.

2) Exchange rate appreciation/depreciation

The other component of the carry trade strategy focuses on the exchange rate of the two currencies. A trader looks for the target currency to appreciate (increase in value) when long. When this happens the payoff to the trader includes the daily interest payment and any unrealised profit from the currency. However, the profit the trader sees, as a result of the target currency appreciating, will only be realised when the trader closes the trade.

It is possible for a trader to lose money when the target currency depreciates against the funding currency so that the capital depreciation wipes out the positive interest payments.

Currency carry trade example

Continuing with the example used above, if the Australian Official Cash Rate is currently at 4% and the Japanese Yen yields 0%, a trader may decide to take a long trade on AUD/JPY if the pair is likely to rise.

FX carry trade example using AUD/JPY

Traders looking to capitalise on the interest rate differential will essentially be borrowing Yen at the much lower rate and receiving the higher interest rate associated with the Australian dollar. In reality, retail traders will receive less than 4% as forex brokers usually apply a spread.

For a detailed example of how to calculate the approximate overnight interest charge/gain, read our article on understanding foreign exchange rollover.

The risks involved with carry trades

A currency carry trade, like most trading strategies, carries a degree of risk and therefore, requires the adoption of sound risk management. Risk management has become even more important since the 2008/09 global financial crisis which resulted in lower interest rates for developed nations, forcing carry traders to look to riskier, high yielding emerging markets currencies until interest rates normalize.

  • Exchange rate risk: Should the target currency weaken against the funding currency, traders that are long the pair will see the trade move against them but will still receive the daily interest.
  • Interest rate risk: If the country of the target currency reduces interest rates and the country behind the funding currency increases interest rates, this will reduce the positive net interest rate and is likely to reduce the profitability of the FX carry trade.

FX Carry trade strategy

Filtering FX carry trades in the direction of the trend is one such strategy employed by top traders. This is because the carry trade is a long term trade, and therefore, it’s useful to analyse markets that exhibit strong trends.

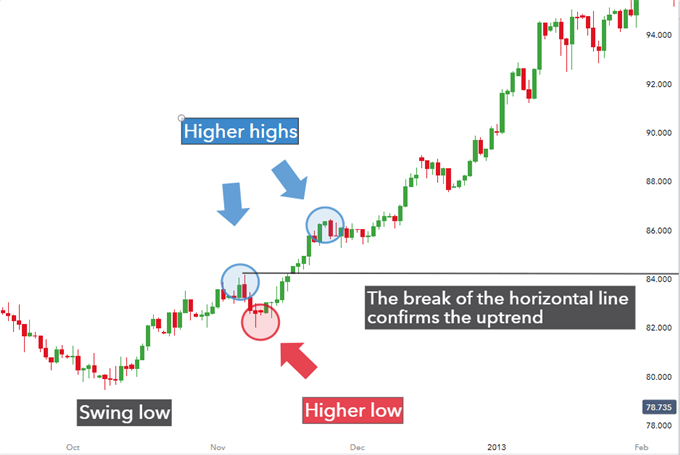
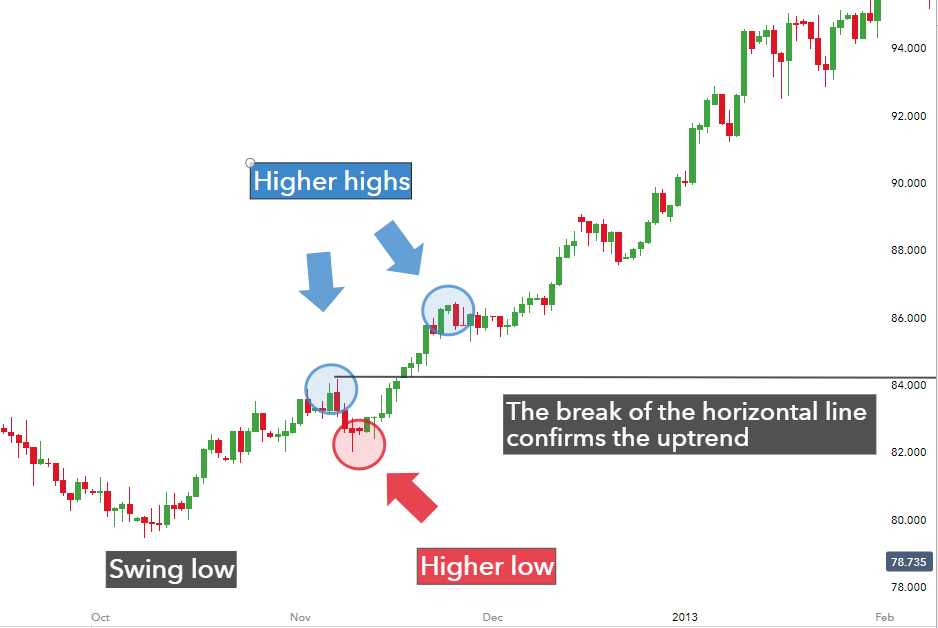
In an attempt to get into higher probability trades, traders should first look to confirm the uptrend which, in the below chart, is confirmed after the higher high and higher low.

Trend bias in positive carry trade strategy

The figure depicts higher highs and higher lows whereby a break of the horizontal line (drawn at the first higher high) confirms the uptrend. Thereafter, traders can make use of multiple time frame analysis and indicators to spot ideal entry points to enter a long trade.

Conclusion

Currency carry trades present traders with two avenues to profit (exchange rate and interest rate differential) but it is essential to manage risk as losses are can arise when the pair moves against traders or the interest rate differential narrows.

For higher probability trades, traders should look for entry points in the direction of an uptrend and should protect downside risk by utilizing prudent risk management techniques.

Retail Trader Sentiment Analysis – USD/JPY, EUR/JPY, and AUD/JPY

Retail Trader Sentiment Analysis – USD/JPY, EUR/JPY, and AUD/JPY

Gauge market dynamics by examining sentiment indicators, position ratios, price fluctuations, and technical signals to determine prevailing bullish or bearish trends.

Recent market data indicates notable performance variations among key currencies, with the Japanese yen showing relative strength while the Australian dollar underperforms. The following analysis examines current retail trader positioning and its potential implications for future price movements, utilizing a contrarian approach.

USD/JPY Retail Trader Data: Bullish Bias

Current retail trader data reveals a short-to-long ratio of 2.07 to 1, with 32.57% of traders holding net-long positions. Net-long traders have increased by 0.70% since yesterday but decreased by 3.68% over the past week. Conversely, net-short traders have risen by 6.94% since yesterday and 3.96% over the week. This positioning suggests a USD/JPY bullish contrarian bias.

AUD/JPY Retail Trader Bias: Bearish Continuation

Retail trader data shows a short-to-long ratio of 1.39 to 1, with 41.91% of traders in net-long positions. Net-long traders have increased by 8.23% since yesterday and 47.41% over the week, while net-short traders have marginally increased by 0.42% since yesterday but decreased by 24.76% over the week. While the net-short position typically indicates potential price increases, recent shifts in sentiment suggest the AUD/JPY trend may continue lower despite the fact traders remain net-short.

EUR/JPY Retail Trader Data: Bearish Bias

Current data indicates a short-to-long ratio of 2.44 to 1, with 29.09% of traders holding net-long positions. Net-long traders have increased by 9.24% since yesterday and 13.56% over the week, while net-short traders have risen by 2.30% since yesterday but decreased by 8.41% over the week. Despite the overall net-short position suggesting potential price increases, recent sentiment changes may indicate a bearish continuation.

This analysis provides valuable insights for market participants to consider when formulating trading strategies. However, it is crucial to combine this information with other analytical tools and market factors for comprehensive decision-making.

EUR/USD Forecast: Euro finds it difficult to gather bullish momentum

EUR/USD Forecast: Euro finds it difficult to gather bullish momentum

After closing the last two days of the previous week in negative territory, EUR/USD seems to have entered into a consolidation phase slightly below 1.0900 early Monday. The pair’s technical outlook points to a lack of buyer interest in the near term.

Euro PRICE Last 7 days

The table below shows the percentage change of Euro (EUR) against listed major currencies last 7 days. Euro was the strongest against the New Zealand Dollar.

USD EUR GBP JPY CAD AUD NZD CHF
USD 0.17% 0.48% -0.82% 0.71% 1.81% 1.84% -0.75%
EUR -0.17% 0.34% -0.80% 0.72% 1.68% 1.85% -0.73%
GBP -0.48% -0.34% -1.05% 0.37% 1.33% 1.46% -1.08%
JPY 0.82% 0.80% 1.05% 1.53% 2.42% 2.63% -0.13%
CAD -0.71% -0.72% -0.37% -1.53% 1.03% 1.13% -1.46%
AUD -1.81% -1.68% -1.33% -2.42% -1.03% 0.18% -2.37%
NZD -1.84% -1.85% -1.46% -2.63% -1.13% -0.18% -2.55%
CHF 0.75% 0.73% 1.08% 0.13% 1.46% 2.37% 2.55%

The heat map shows percentage changes of major currencies against each other. The base currency is picked from the left column, while the quote currency is picked from the top row. For example, if you pick the Euro from the left column and move along the horizontal line to the US Dollar, the percentage change displayed in the box will represent EUR (base)/USD (quote).

The US Dollar (USD) benefited from the souring risk mood in the second half of last week and caused EUR/USD to turn south. Additionally, several European Central Bank (ECB) officials hinted at another rate reduction in September on Friday, making it difficult for the Euro to gather strength.

Over the weekend, US President Joe Biden announced that he will no longer run for President at the upcoming election and endorsed Vice President Kamala Harris to be the new nominee. Nevertheless, markets showed little to no reaction to this development.

In the European morning, US stock index futures trade modestly higher on the day. Investors, however, could refrain from taking large positions ahead of Tesla and Google’s second-quarter earnings figures, which will be released after the closing bell on Tuesday.

The US economic docket will not feature any high-tier data releases on Monday. Later in the week, S&P Global PMI data from Germany, the Eurozone and the US will be watched closely by market participants. On Thursday, the US Bureau of Economic Analysis will release its first estimate of the second-quarter Gross Domestic Product (GDP) growth ahead of Friday’s Personal Consumption Expenditures (PCE) Price Index.

EUR/USD Technical Analysis

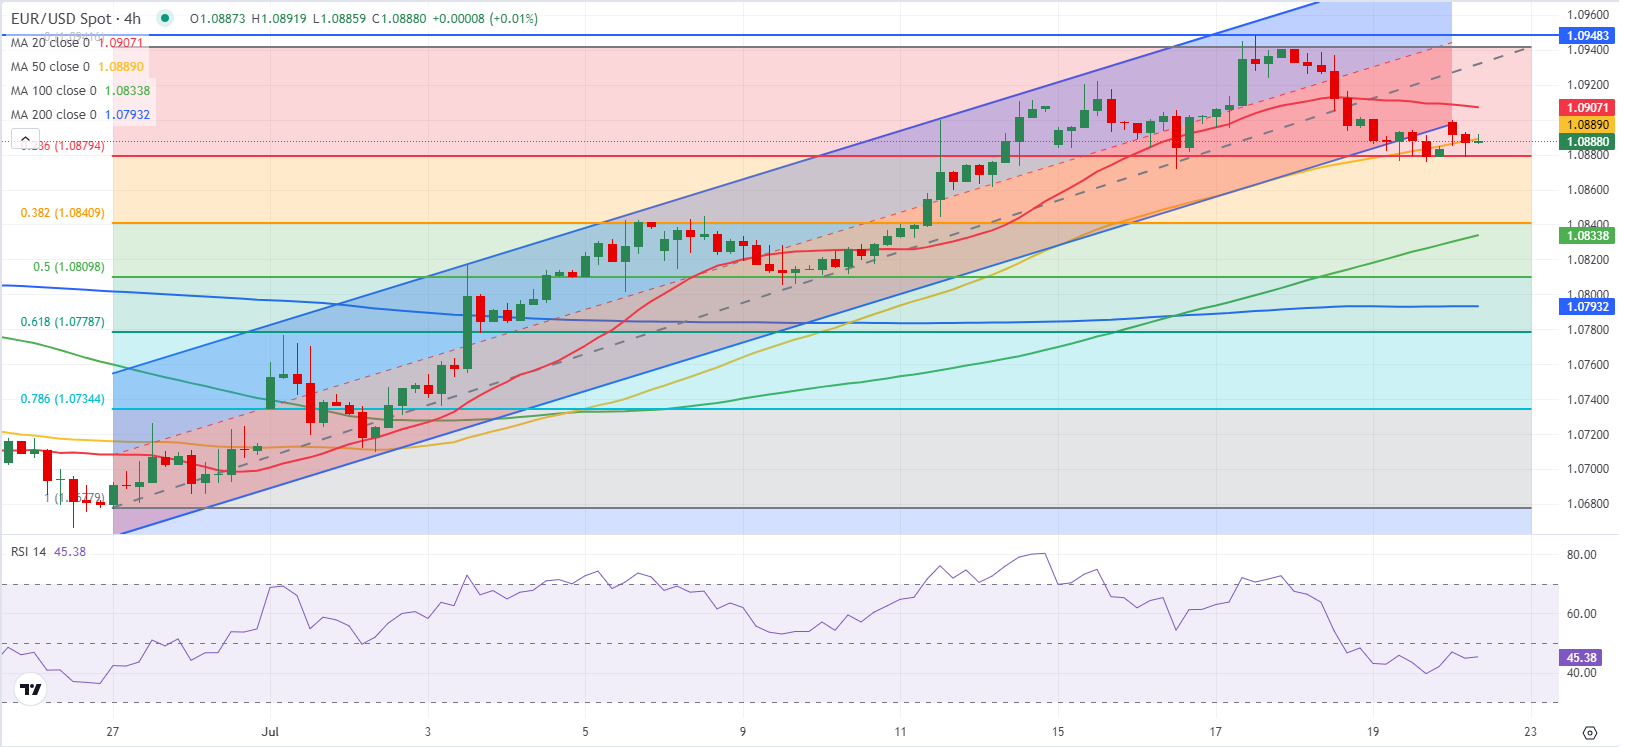
EUR/USD failed to return within the ascending regression channel coming from late June after testing the lower limit at the beginning of the week. Additionally, the Relative Strength Index (RSI) indicator on the 4-hour chart stays below 50, reflecting a lack of buyer interest.

On the downside, 1.0880 (Fibonacci 23.6% retracement of the latest uptrend) aligns as immediate support. If EUR/USD falls below that level and starts using it as resistance, 1.0840-1.0835 (Fibonacci 38.2% retracement, 100-period Simple Moving Average) could be seen as next support before 1.0810-1.0800 (Fibonacci 50% retracement, static level).

In case EUR/USD manages to rise above 1.0900-1.0910 (lower limit of the ascending channel, 20-period Simple Moving Average) and stabilize there, technical buyers could take action. In this scenario, 1.0940 (mid-point of the channel, static level) could act as strong resistance before 1.1000 (static level, psychological level) could be set as the next bullish target.

EUR/USD holds gains near 1.0900 amid weaker US Dollar

EUR/USD holds gains near 1.0900 amid weaker US Dollar

EUR/USD defends gains below 1.0900 in the European session on Monday. The US Dollar weakens, as risk sentiment improves, supporting the pair. The focus remains on the US political updates and mid-tier US data for fresh trading impetus.

EUR/USD failed to return within the ascending regression channel coming from late June after testing the lower limit at the beginning of the week. Additionally, the Relative Strength Index (RSI) indicator on the 4-hour chart stays below 50, reflecting a lack of buyer interest.

On the downside, 1.0880 (Fibonacci 23.6% retracement of the latest uptrend) aligns as immediate support. If EUR/USD falls below that level and starts using it as resistance, 1.0840-1.0835 (Fibonacci 38.2% retracement, 100-period Simple Moving Average) could be seen as next support before 1.0810-1.0800 (Fibonacci 50% retracement, static level).

In case EUR/USD manages to rise above 1.0900-1.0910 (lower limit of the ascending channel, 20-period Simple Moving Average) and stabilize there, technical buyers could take action. In this scenario, 1.0940 (mid-point of the channel, static level) could act as strong resistance before 1.1000 (static level, psychological level) could be set as the next bullish target.

After closing the last two days of the previous week in negative territory, EUR/USD seems to have entered into a consolidation phase slightly below 1.0900 early Monday. The pair’s technical outlook points to a lack of buyer interest in the near term.

The US Dollar (USD) benefited from the souring risk mood in the second half of last week and caused EUR/USD to turn south. Additionally, several European Central Bank (ECB) officials hinted at another rate reduction in September on Friday, making it difficult for the Euro to gather strength.

Over the weekend, US President Joe Biden announced that he will no longer run for President at the upcoming election and endorsed Vice President Kamala Harris to be the new nominee. Nevertheless, markets showed little to no reaction to this development.

In the European morning, US stock index futures trade modestly higher on the day. Investors, however, could refrain from taking large positions ahead of Tesla and Google’s second-quarter earnings figures, which will be released after the closing bell on Tuesday.

The US economic docket will not feature any high-tier data releases on Monday. Later in the week, S&P Global PMI data from Germany, the Eurozone and the US will be watched closely by market participants. On Thursday, the US Bureau of Economic Analysis will release its first estimate of the second-quarter Gross Domestic Product (GDP) growth ahead of Friday’s Personal Consumption Expenditures (PCE) Price Index.