Retail Trader Sentiment Analysis – FTSE 100, GBP/USD, and EUR/GBP

Retail Trader Sentiment Analysis – FTSE 100, GBP/USD, and EUR/GBP

Analysis of retail trader positioning reveals a slight bearish tilt, with 48.54% of traders holding long positions and a short-to-long ratio of 1.06 to 1. While net-long positions have decreased marginally by 0.85% since yesterday, they’ve increased by 19.89% over the past week. Conversely, net-short positions have seen a minor 0.44% increase from yesterday but a 15.36% decrease compared to last week. Given our contrarian market sentiment approach, the net-short bias suggests the potential for continued FTSE 100 appreciation. However, the mixed short-term and medium-term positioning shifts indicate a nuanced trading outlook for the FTSE 100.

GBP/USD Retail Trader Data: Downside Correction?

Recent retail trader data indicates a strong bearish sentiment, with merely 35.60% of traders maintaining long positions and a short-to-long ratio of 1.81 to 1. Net-long positions have seen a slight 0.90% increase since yesterday and a substantial 29.32% rise over the week. Net-short positions show a minimal 0.28% decline from yesterday and a more significant 9.27% weekly decrease. While our contrarian interpretation of crowd sentiment would typically suggest potential GBP/USD gains given the net-short position, the recent reduction in bearish positioning and increase in bullish sentiment warrant caution. These shifts in trader behavior suggest the current upward trend in GBP/USD may be approaching a reversal point.

EUR/GBP Retail Trader Data: Reversal Higher?

Recent retail trader data indicates pronounced bullish sentiment, with 75.19% of traders maintaining long positions and a long-to-short ratio of 3.03 to 1. Net-long positions have seen a slight 0.62% increase since yesterday but a 5.09% decrease over the week. Net-short positions show a 2.56% rise from yesterday and a more significant 12.68% weekly increase. While our contrarian interpretation of crowd sentiment would typically suggest potential EUR/GBP losses given the net-long position, the recent growth in bearish positioning and decrease in bullish sentiment warrant caution. These shifts in trader behavior suggest the current downward trend in EUR/GBP may be approaching a reversal point.

Using Stop Loss Orders in Forex Trading

Using Stop Loss Orders in Forex Trading

Market movements can be unpredictable, and the stop loss is one of the few mechanisms that traders have to protect against excessive losses in the forex market. Stop losses in forex come in different forms and methods of application. This article will outline these various forms including static stops and trailing stops, as well as highlighting the importance of stop losses in forex trading.

What is a stop loss?

A forex stop loss is a function offered by brokers to limit losses in volatile markets moving in a contrary direction to the initial trade. This function is implemented by setting a stop loss level, a specified amount of pips away from the entry price. A stop loss can be attached to long or short trades making it a useful tool for any forex trading strategy.

Why is a stop loss order important?

Stops are critical for a multitude of reasons, but it can really be boiled down to one thing: we can never see the future. Regardless of how strong the setup might be, or how much information might be pointing in the same direction – future currency prices are unknown to the market, and each trade is a risk.

In the DailyFX Traits of Successful Traders research, this was a key finding – traders actually do win in many currency pairs the majority of the time. The chart below shows some of the more common pairings.

forex winning percentage

As you can see, traders were successfully winning more than half the time in most of the common pairings, but because their money management was often bad they were still losing money on balance.

Traders lost much more when they were wrong (in red) than they made when they were right (blue)

forex profit and loss

In the article Why do Many Traders Lose Money, David Rodriguez explains that traders can look to address this problem simply by looking for a profit target at least as far away as the stop-loss. That is, if a trader opens a position with a 50 pip stop, look for – as a minimum – a 50 pip profit target.

This way, if a trader wins more than half the time, they stand a good chance at being profitable. If the trader is able to win 51% of their trades, they could potentially begin to generate a net profit – a strong step towards most traders’ goals.

Forex stop loss strategies

Below are five strategies to apply in your forex trading when placing stop loss orders:

1. Setting Static Stops

Traders can set forex stops at a static price with the anticipation of allocating the stop-loss, and not moving or changing the stop until the trade either hits the stop or limit price. The ease of this stop mechanism is its simplicity, and the ability for traders to ensure that they are looking for a minimum one-to-one risk-to-reward ratio.

For example, let’s consider a swing-trader in California that is initiating positions during the Asian session; with the anticipation that volatility during the European or US sessions would be affecting their trades the most.

This trader wants to give their trades enough room to work, without giving up too much equity in the event that they are wrong, so they set a static stop of 50 pips on every position that they trigger. They want to set a profit target at least as large as the stop distance, so every limit order is set for a minimum of 50 pips. If the trader wanted to set a one-to-two risk-to-reward ratio on every entry, they can simply set a static stop at 50 pips, and a static limit at 100 pips for every trade that they initiate.

2. Static Stops based on Indicators

Some traders take static stops a step further, and they base the static stop distance on an indicator such as Average True Range. The primary benefit behind this is that traders are using actual market information to assist in setting that stop.

So, if a trader is setting a static 50 pip stop loss with a static 100 pip limit as in the previous example – what does that 50 pip stop mean in a volatile market, and what does that 50 pip stop mean in a quiet market?

If the market is quiet, 50 pips can be a large move and if the market is volatile, those same 50 pips can be looked at as a small move. Using an indicator like average true range, or pivot points, or price swings can allow traders to use recent market information to more accurately analyze their risk management options.

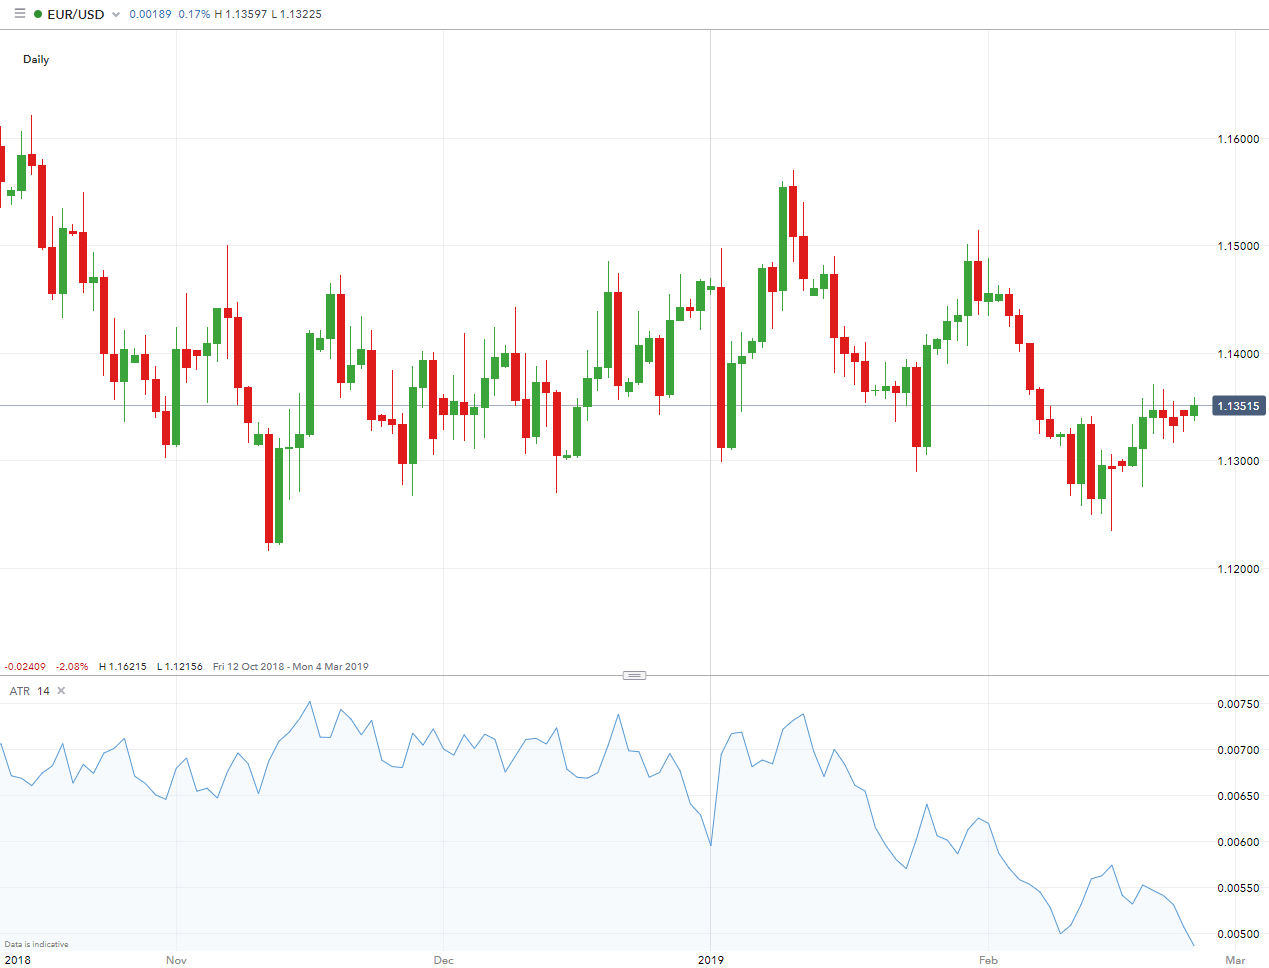
Average True Range can assist traders in setting stops using recent market information

average true range (ATR) in forex

We walk through such a mechanism in our article on Managing Risk with ATR (Average True Range).

3. Manual Trailing Stops

For traders that want the upmost control, forex stops can be moved manually by the trader as the position moves in their favor.

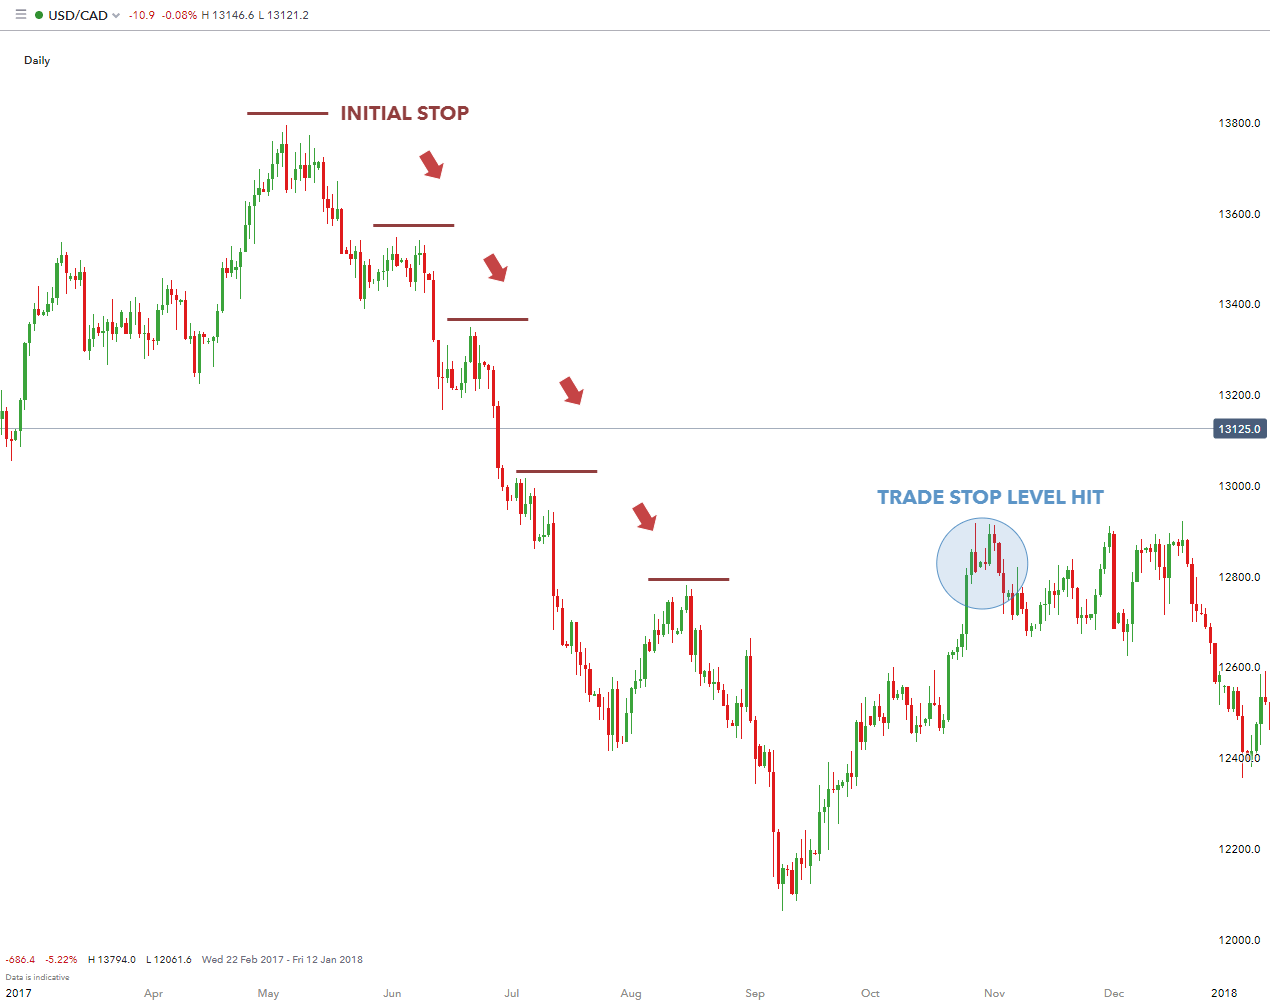
The chart below highlights the movement of stops on a short position. As the position moves further in favor of the trade (lower), the trader subsequently moves the stop level lower. When the trend eventually reverses (and new highs are made), the position is then stopped out.

Trader adjusting stops to lower swing-highs in a strong down-trend

forex stop loss manual stop

Take a look at Trading Trends by Trailing Stops with Price Swings for more information on how to implement the trailing stop.

4. Trailing Stops

It is important to note that some jurisdictions allow brokers to enforce the trailing stop function

Static stop losses can bring vast improvement to a new trader’s approach, but other traders use stops in a different way to further maximize their money management.Trailing stops are stops that will be adjusted as the trade moves in the trader’s favor, in an attempt to further mitigate the downside risk of being incorrect in a trade.

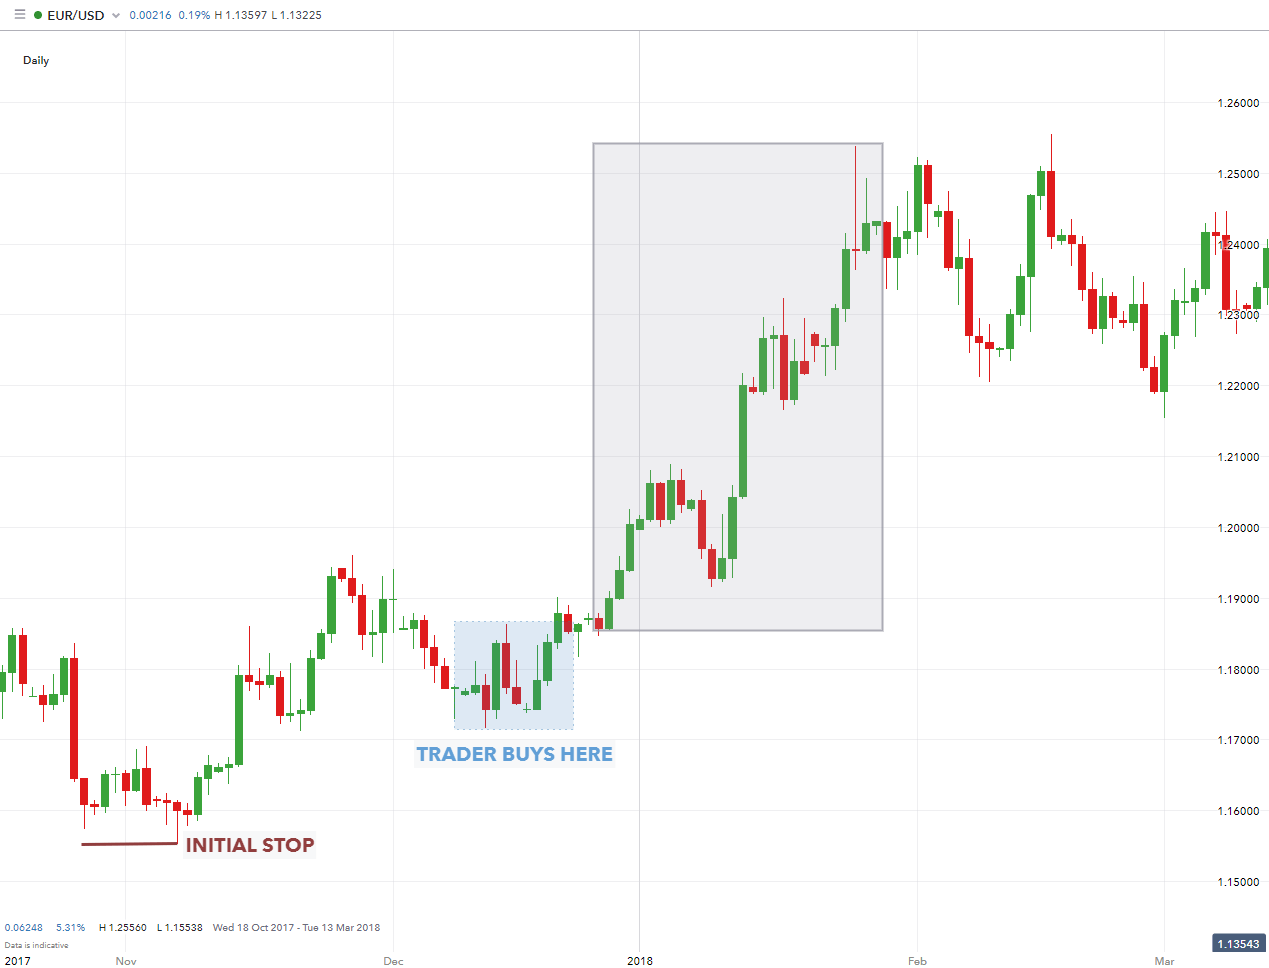
Let’s say, for instance, that a trader took a long position on EUR/USD at 1.1720, with a 167 pip stop at 1.1553. If the trade moves up to 1.1720, the trader may look at adjusting their stop up to 1.1720 from the initial stop value of 1.1553 (see image below).

This does a few things for the trader: It moves the stop to their entry price, also known as ‘break-even’ so that if EUR/USD reverses and moves against the trader, at least they won’t be faced with a loss as the stop is set to their initial entry price.

This break-even stop allows the trader to remove their initial risk in the trade.After which, the trader can look to place that risk in another trade opportunity, or simply keep that risk amount off the table and enjoy a protected position in their long EUR/USD trade.

Break-even stops can assist traders in removing their initial risk from the trade

forex stop loss trailing stop

5. Fixed Trailing Stops

Traders can also set trailing stops so that the stop will adjust incrementally. For example, traders can set stops to adjust for every 10 pip movement in their favor.

Using an example of a trader buying EUR/USD at 1.3100 with an initial stop at 1.3050 – after EUR/USD moves up to 1.3110, the stop adjusts up 10 pips to 1.3060. After another 10 pip movement higher on EUR/USD to 1.3120, the stop will once again adjust another 10 pips to 1.3070. This process will continue until such time as the stop level is hit or the trader manually closes the trade.

Fixed Trailing stops adjust in increments set by the trader

If the trade reverses from that point, the trader is stopped out at 1.3070 as opposed to the initial stop of 1.3050; a savings of 20 pips had the stop not adjusted.

Gold (XAU/USD) – Recent Sell-off May Open Up Opportunities

Gold (XAU/USD) – Recent Sell-off May Open Up Opportunities

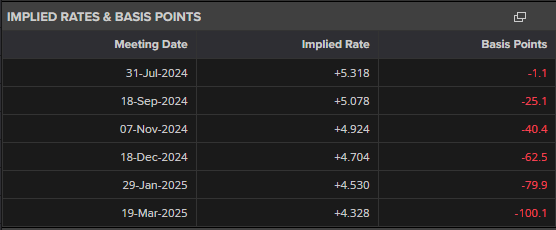
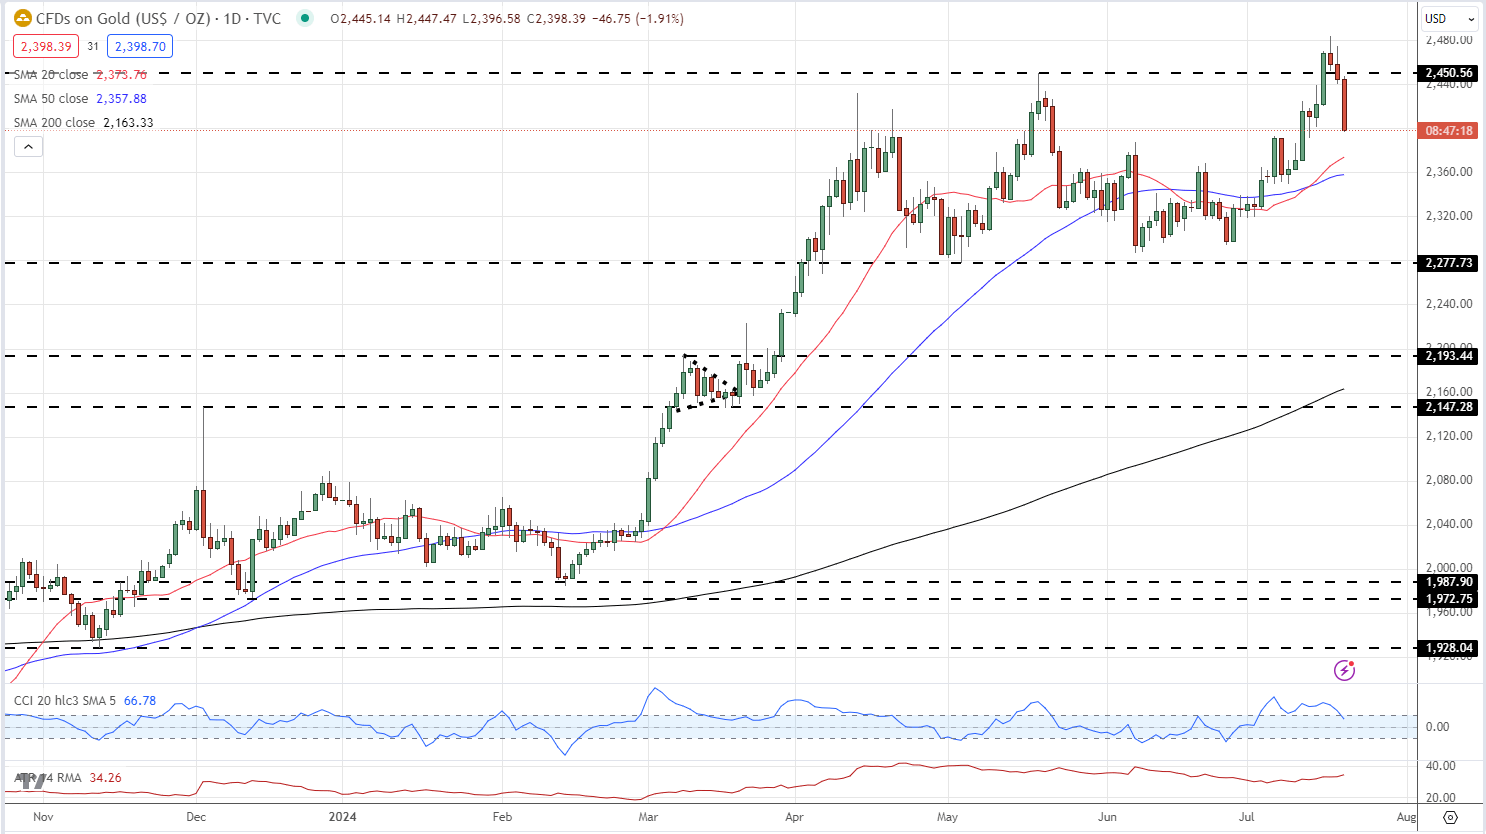
Gold posted a fresh multi-decade high earlier this week, breaking out of a range that has held since late March. A break above the 20-day and 50-day moving averages at the start of the month allowed the precious metal to test and then break the mid-May high. The sell-off in the second half of this week has no real fundamental driver and any further move lower is likely to attract buyers back into the market. The US interest rate space looks positive for gold with two, and potentially three, quarter-point rate cuts now priced into the market. The first cut is fully expected at the September 18th FOMC, which coincides with the release of the latest Summary of Economic Projections.

image1.png

Data using Reuters Eikon

Gold is trading on either of $2,400/oz. and any further sell-off is likely to be limited. Prior areas of resistance turned support between $2,350/oz. and $2,370/oz. also include the short- and medium-term smas and these should hold and add an extra layer of support.

Gold Daily Price Chart

image2.png

Client Sentiment is Bearish

Retail trader data shows 52.21% of traders are net-long with the ratio of traders long to short at 1.09 to 1.The number of traders net-long is 2.65% lower than yesterday and 1.64% higher from last week, while the number of traders net-short is 11.07% lower than yesterday and 7.53% lower from last week.

We typically take a contrarian view to crowd sentiment, and the fact traders are net-long suggests Gold prices may continue to fall. Traders are further net-long than yesterday and last week, and the combination of current sentiment and recent changes gives us a stronger Gold-bearish contrarian trading bias.

What is your view on Gold – bullish or bearish?? You can let us know via the form at the end of this piece or contact the author.

GBP/USD flirts with weekly low below 1.2950 after UK Retail Sales

GBP/USD flirts with weekly low below 1.2950 after UK Retail Sales

GBP/USD is testing weekly lows below 1.2950 in the early European session on Friday. The pair stays on the back foot after disappointing UK Retail Sales data amid the extended US Dollar recovery. The focus now shifts to the Fedspeak.

The lower limit of the ascending regression channel coming from early July aligns as immediate support at 1.2980. Meanwhile, the Relative Strength Index (RSI) indicator on the 4-hour chart declines toward 50, reflecting a loss of bullish momentum.

1.2940 (Fibonacci 23.6% retracement of the latest uptrend) could be seen as next support before 1.2900 (psychological level, static level), in case 1.2980 support fails. On the upside, 1.3000 (psychological level, static level) aligns as first resistance before 1.3040-1.3050 (static level, mid-point of the ascending channel) and 1.3100 (upper limit of the ascending channel).

GBP/USD gathered bullish momentum and set a new 2024-high at 1.3045 on Wednesday. The pair, however, lost its traction early Thursday and declined below 1.3000.

Pound Sterling gathered strength midweek after the UK data showed that services inflation remained sticky in June. Early Thursday, the UK’s Office for National Statistics reported that the ILO Unemployment Rate remained unchanged at 4.4% in the three months to May, matching the market expectation. The details of the report showed that the wage inflation, as measured by the change in the Average Earnings Including Bonus, declined to 5.7% from 5.9%. GBP/USD started to edge lower following these figures.

In the second half of the day, the US Department of Labor will release the weekly Initial Jobless Claims data. Investors see the number of first-time applications for unemployment benefits to rising to 230,000 from 222,000 in the previous week.

A bigger-than-forecast print could remind investors of loosening conditions in the US labor market. With markets fully pricing in a 25 basis points Federal Reserve (Fed) rate cut in September, however, the reaction could remain short-lived.

Investors will also continue to pay close attention to comments from Fed policymakers before the blackout period starts this Saturday.

Retail Sentiment Analysis – GBP/USD, EUR/USD, and AUD/USD Updates

Retail Sentiment Analysis – GBP/USD, EUR/USD, and AUD/USD Updates

GBP/USD Retail Trader Data: Reversal Lower?

Recent retail trader data indicates a net-long position of 32.63%, with a short-to-long ratio of 2.07 to 1. Net-long traders have increased by 1.37% since yesterday and 13.89% from last week. Net-short traders have decreased by 4.09% since yesterday but increased by 1.06% from last week.

Our contrarian approach to market sentiment suggests potential continued growth in GBP/USD prices, given the net-short position of traders. However, the reduction in net-short positions compared to yesterday and last week may indicate an impending downward trend reversal, despite the overall net-short stance.

EUR/USD Retail Trader Data: Mixed Outlook

Retail trader data indicates 34.95% of traders are net-long, with a short-to-long ratio of 1.86 to 1. Net-long positions have increased by 20.13% since yesterday but decreased by 1.65% from last week. Net-short positions have declined 10.96% since yesterday but risen 3.60% week-over-week.

Given the net-short trader positioning, our contrarian approach to market sentiment suggests potential upward movement in EUR/USD prices. However, the reduced net-short stance compared to yesterday and the increased net-short position from last week present a mixed trading outlook for EUR/USD.

AUD/USD Retail Trader Data: Bearish Bias

Retail trader data indicates 58.13% of traders are net-long, with a long-to-short ratio of 1.39 to 1. Net-long positions have increased 6.13% since yesterday and 28.51% from last week. Net-short positions have decreased 8.06% since yesterday and 22.21% week-over-week.

Our contrarian approach to market sentiment suggests potential downward movement in AUD/USD prices, given the net-long trader positioning. The increased net-long stance compared to both yesterday and last week reinforces a stronger bearish outlook for AUD/USD based on our contrarian trading bias.

Crude Oil Trading Strategies and Tips

Crude Oil Trading Strategies and Tips

Crude oil is the world economy’s primary energy source, making it a very popular commodity to trade. A naturally occurring fossil fuel, it can be refined into various products like gasoline (petrol), diesel, lubricants, wax and other petrochemicals. It is highly demanded, traded in volume, and extremely liquid. Oil trading therefore involves tight spreads, frequent chart patterns, and high volatility.

Brent crude is the world’s benchmark for oil with almost two thirds of oil contracts traded being Brent oil. WTI is America’s benchmark oil, it is a slightly sweeter and lighter oil compared to Brent.

CRUDE OIL TRADING HOURS

WTI trades on CME Globex:

Sunday – Friday, 6:00 p.m. – 5:00 p.m. (with an hour break from 5:00 p.m. to 6:00 p.m. each day)

Brent trades on ICE:

Sunday – Friday – 7:00 p.m. – 5:00 p.m.

CRUDE OIL TRADING BASICS: UNDERSTANDING WHAT AFFECTS PRICE MOVEMENTS

When trading oil, the two major focal points are, as with many commodities, supply and demand. Whether there was an economic report like a news event or press release or tensions in the Middle East, the two factors that will be taken into consideration is how supply and demand is affected, because this will affect the price.

Supply Factors

  • Outages or maintenance in key refineries around the globe, whether it’s the Forties pipeline in the North Sea or the Port Arthur refinery in Texas, must be monitored because of the effect it can have on the supply of oil. War in the Middle East leads to concerns about supply. For example, when the Libyan Civil war began in 2011, prices had seen a 25% rise from in the space of a couple of months.
  • OPEC (Organization of the Petroleum Exporting Countries) production cuts or extensions lead to changes in the price of oil. For example, back in 2016 when the cartel had announced their decision to curb global supply by 1.9% (see chart below), the price of oil has risen from $44/bbl to as much as $80/bbl.

WTI and Brent Crude price reaction to OPEC supply cut:

WTI and Brent Crude price reaction to OPEC supply cut

Chart prepared by Warren Venketas, TradingView

  • Oil Suppliers: Similarly, with understanding the importance of OPEC, it is also worth knowing who the top global oil suppliers are, and this information can be fond from the EIA website.

Demand Factors

  • Seasonality: Hot summers can lead to increased activity and higher oil consumption. Cold winters cause people to consume more oil products to heat their houses.
  • Oil Consumers: The largest consumers of oil have typically been developed nations such as the U.S. and European countries. However, in recent times there has been a surge in oil consumption in Asian countries, namely China and Japan. As such, it is important for traders to pay attention to the level of demand from these nations, alongside their economic performance. Any slowdown could affect oil prices and demand may fall.
  • Correlation to Global Growth: The chart below shows the largely positive correlation between the price of crude oil and global growth. The Chinese and US economies being the two largest in the world are a great barometer for global growth. The chart includes their respective major stock indices which move in line with crude oil prices – when the equity indices fall, the price of crude oil tends to fall and vice versa.

WTI and Brent Crude positive correlation with FTSE China A50 and S&P 500 chart representation:

WTI and Brent Crude positive correlation with FTSE China A50 and S&P 500

  • Alternative Energy: While fossil fuels such as oil and gas continue to dominate cleaner energy sources, there is an incessant push towards sustainability on a global scale. This will definitely impact crude oil prices going forward which makes this a key factor to monitor in a crude oil trading strategy.

The impact of derivatives on the traditional valuations of crude oil have been thought by many to have destabilized the asset class. Simply put, the oil futures are thought to have reflected higher proportions of noise which do not reflect the fundamental data at the time. This is contentious within the investing community with some in disagreement with the above rationale, but it cannot be ignored that large speculative traders are becoming more influential with the flourishing derivative market.

HOW TO TRADE OIL: TOP TIPS AND STRATEGIES

Expert oil traders generally follow a strategy. They will understand the fundamental factors that affect the price of oil and use a trading strategy that suits their trading style. Each trading strategy is different, risk management is an important component to consistent trading, like the effective use of leverage and avoiding top trading mistakes.

A comprehensive crude oil trading strategy could include:

  1. Fundamental Analysis
  2. Technical Analysis
  3. Risk Management

Once a trader understands the fundamental supply and demand factors that affect the price of oil, he/she can look for entries into the market using technical analysis. Then, when a buy or sell signal has been identified using technical analysis, the trader can implement the proper risk management techniques. Let’s go through an example using the steps outlined above:

  1. Fundamental Analysis

On the 30th of November 2017, OPEC and Russia agreed to extend an oil production cut, which lead to a decrease in supply. The basic theory of supply and demand suggests that a decrease in supply should be succeeded by an increase in demand and consequently price. This is the fundamental analysis a trader would need to incorporate into their strategy in order to identify potential buy signals in the market.

WTI daily chart highlighting supply cut:

WTI daily chart highlighting supply cut

Chart prepared by Warren Venketas, IG

2. Technical Analysis

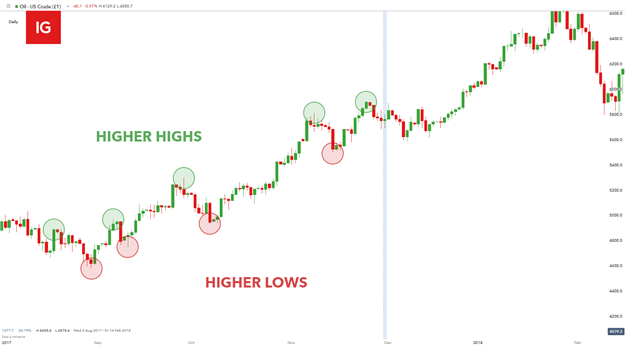
The next step would be to analyze the chart using technical analysis. There are a variety of technical indicators and price patterns a trader can use to look for signals to enter the market. There is no need to use many technical indicators, one that you understand well will do the job. A common yet very effective way to begin analyzing any chart is to identify the overall trend of the market. In this example, the implementation of simple price action is used to identify higher highs and higher lows which is suggestive of a preceding upward trend. This falls in line with our fundamental expectation of further upward price movement.

WTI daily chart showing preceding upward trend:

WTI daily chart showing preceding upward trend

Chart prepared by Warren Venketas, IG

Once the bullish trend has been confirmed, the next step in the trading strategy would be to recognize possible entry points. Again, there are multiple tools and techniques to locate entry points but this example uses the Commodity Channel Index (CCI) indicator which moves into oversold terrirtoy shortly after the fundamental supply cut announcement was made. An oversold signal on the CCI advocates further price appreciation and the possibility of a long (buy) entry.

WTI daily chart with CCI indicator:
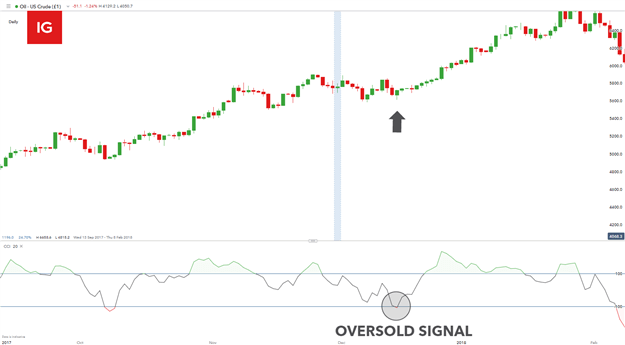
WTI daily chart with CCI Indicator

3. Risk Management

The final step in any trading strategy would be to employ sound risk management to every trade. At DailyFX we support the 1:2 risk-reward ratio guideline which basically means that the target level should be roughly two times more than the position stop-loss level. To manage risk, the trader could look to set a take-profit above the recent high and set a stop-loss at the recent low.

In this example, a recent swing low ($49.30) has been identified as stop level which is approximately $8 away from the entry price ($57.20). There is no recent high which in this case which would allow for a target projection using basic maths. With the stop distance being roughly $8 away from entry, a 1:2 projection could seee initial resistance at the $73 level.

WTI daily chart with 1:2 risk-reward ratio:

WTI daily chart with 1:2 risk-reward ratio

Chart prepared by Warren Venketas, IG

This sample trade would illustrate a positive risk to reward ratio. We researched millions of live trades in a variety of markets and discovered a positive risk to reward ratio was a key element to consistent trading. Additionally, at DailyFX, we recommend risking less than 5% of capital on all open trades.

ADVANCED TIPS FOR OIL TRADING

Advanced traders can incorporate additional information when setting up trades. Traders sometimes look at the futures curve to forecast future demand, CFTC speculative positioning to understand the current market dynamic and can use options to take advantage of forecasted high volatility moves or to hedge current positions.

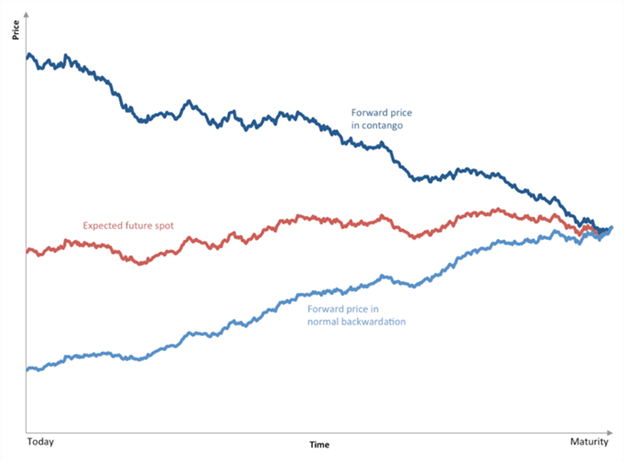
Futures Curve: The shape of the futures curve is important for commodity hedges and speculators. As such, when investors analyze the curve, they look for two things, whether the market is in contango or backwardation:

  1. Contango: This is a situation in which the futures price of a commodity is above the expected spot price, as investors are willing to pay more for a commodity at some point in the future than the actual expected price. This typically signals a bearish structure.
  2. Backwardation: This is a situation when the spot price is above the forward price for a commodity. This typically signals a bullish structure.
Contango

CFTC/Speculative Positioning:

The Commodity Future Trading Commission Report (CFTC) is important when trading crude oil futures. It provides traders with information related to market dynamics and therefore s can be a good way to gain a sense of where oil prices are heading. Movements in the CFTC managed money net positions typically precede the move in oil prices.

Trading via futures and options

Buying futures and options, a trader must use the appropriate exchange for the oil benchmark he/she wants to trade. Most exchanges have criteria for who is allowed trade on them, so the majority of futures speculation is undertaken by professionals.

Oil Investing

Instead of trading the individual market, a trader can get exposure to oil through shares of oil companies or through energy-based exchange traded funds (ETFs). The price of oil companies and ETFs are heavily influenced by the price of oil.

Major Oil/Energy ETFs:

  • Energy Select Sector SPDR (XLE)
  • Vanguard Energy ETF (VDE)
  • United States Energy Fund (USO)

KEY REPORTS EVERY OIL TRADER SHOULD FOLLOW

Weekly updates on the amount of crude oil inventories in the U.S. are very important pieces of data for oil traders – the release of which frequently leads to a bout of volatility. The inventory data is an important barometer for oil demand. For example, if weekly inventories are increasing, this would suggest that demand for oil is dropping, while a drop in inventories suggests that oil demand is outstripping supply.

  1. American Petroleum Institute (API): The API produces a weekly statistical report, which highlights the most important petroleum products that account for more than 80% of total refinery production, while crude oil inventories are also included. This data is typically released on Tuesday at 16:30ET/21:30 London time.
  2. Department of Energy (DoE/EIA): Much like the API report, the DoE report provides information on the supply of oil and the level of inventories of crude oil and refined products. This is announced on Wednesday at 10:30ET/15:30 London time.

USING SOCIAL MEDIA TO TRADE CRUDE OIL

Over the years, social media has become an increasingly useful platform to share ideas, pass on information and receive breaking news. This is the case for oil traders using #OOTT, which stands for the “Organization of Oil Traders” on Twitter. Here traders and industry leaders provide breaking news and key reports related to the oil market.

Supply and Demand vs Support and Resistance

Supply and Demand vs Support and Resistance

The difference between supply and demand vs support and resistance

Support and resistance is a level where traders see a lot of failed attempts at which price cannot surpass – this idea is familiar to most traders. Supply and demand is a much deeper zone that represents regions of key price levels of broad support and resistance.

Supply and Demand Support and Resistance
Represented by a broad price region Defined by a key price level
Easier to find trade entries More difficult to base trade decisions

How to use support and resistance to trade supply and demand

Trading Supply and Demand

The first thing traders need to do before placing a trade based on supply and demand is to decide whether the environment is expected to stay the same or to rapidly change. This can be assessed by market volatility measures such as significant political strife or economic news. This is the dichotomy between the decision to trade for a range or trade for a breakout.

Trading the Range

When trading a range, traders are anticipating the environment to stay about the same; with support or resistance standing its ground allowing for traders to ‘buy low,’ and ‘sell high’. The chart below illustrates how a trader can use price alone to identify those points in the market at which demand begins to outstrip supply (creating increased prices) or supply begins to overrun demand (creating decreased prices).

Trading the range with a GBP/USD chart

trading the range with support and resistance

Trading the Breakout

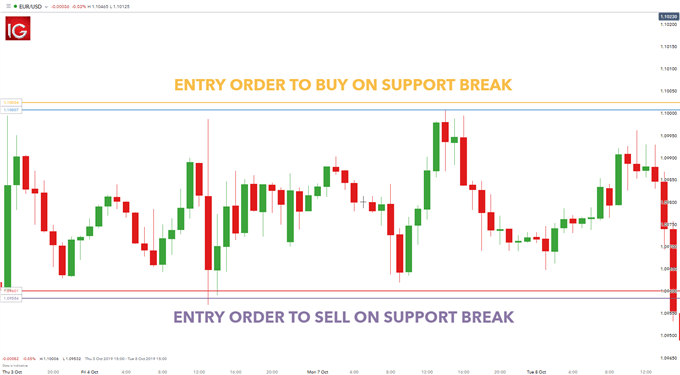
The other side of the coin is the trader who is expecting the environment to change, with breaks of support or resistance to create new highs or new lows.

With this style, the trader’s objective changes from the range-bound condition. The goal is now to ‘buy high, and sell back at a higher price,’ or to ‘sell low and buy back to cover at a lower price.’

Trading the breakout with a EUR/USD chart

trading the breakout with supply and demand

Since these environments can be considerably more chaotic than what might be expected in ‘ranging’ markets, traders are usually best served by altering the risk management condition to account for the increased risk of trading in a rapid market. For more information, read our guide to forex risk management techniques.
Pivot Point Strategies for Forex Traders

Pivot Point Strategies for Forex Traders

A forex pivot point strategy could very well be a trader’s best friend as far as identifying levels to develop a bias, place stops and identify potential profit targets for a trade.

Pivot points have been a go-to for traders for decades. The basis of pivot points is such that price will often move relative to a previous limit, and unless an outside force causes the price to do so, price should stop near a prior extreme. Pivot point trading strategies vary which makes it a versatile tool for forex traders.

Keep reading to learn more about:

  • Defining the pivot point
  • How to calculate pivot points
  • Using pivot points in forex trading
  • Pivot point trading strategies
  • Difference between pivot points and Fibonacci retracements

What is a pivot point?

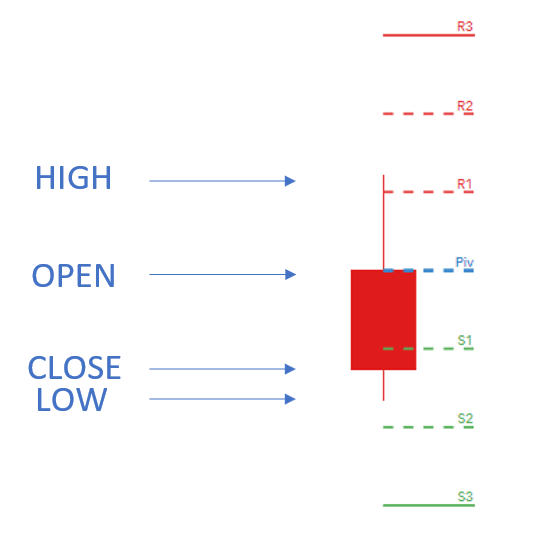
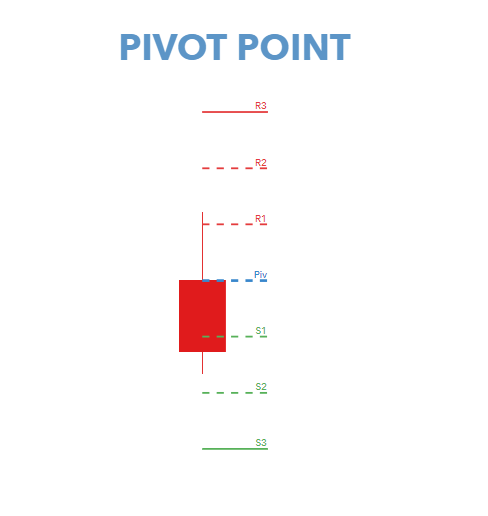
A pivot point is a is a technical indicator used by forex traders as a price level gauge for potential future market movements. The pivot point indicator is used to determine trend bias as well as levels of support and resistance, which in turn can be used as profit targets, stop losses, entries and exits.

Pivot point example:

pivot point indicator

How to calculate pivot points

The calculation for the most basic flavor of pivot points, known as ‘floor-trader pivots,’ along with their support and resistance levels:

Pivot point formula

Pivot point (PP) = (High + Low + Close) / 3

First resistance (R1) = (2 x PP) – Low

First support (S1) = (2 x PP) – High

Second resistance (R2) = PP + (High – Low)

Second support (S2) = PP – (High – Low)

Third resistance (R3) = High + 2 (PP – Low)

Third support (S3) = Low – 2 (High – PP)

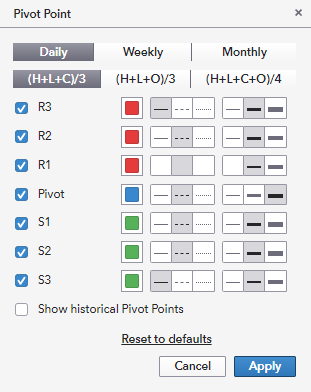
There are other ways to calculate the pivot point, which is available on most trading platforms and can be extended through different time frames. The support and resistance levels will be calculated as above. Below is an example of what is offered on the IG trading platform for daily pivots. The same calculation can be made for weekly or monthly pivots too:

pivot point calculation

How did the pivot point calculation come about?

Up until recently, computers were not available on a mass scale. Therefore, market makers and floor traders needed a way of determining whether price was ‘cheap’ or ‘expensive’ on a relative basis. From a simple mathematical calculation, pivot points were born.

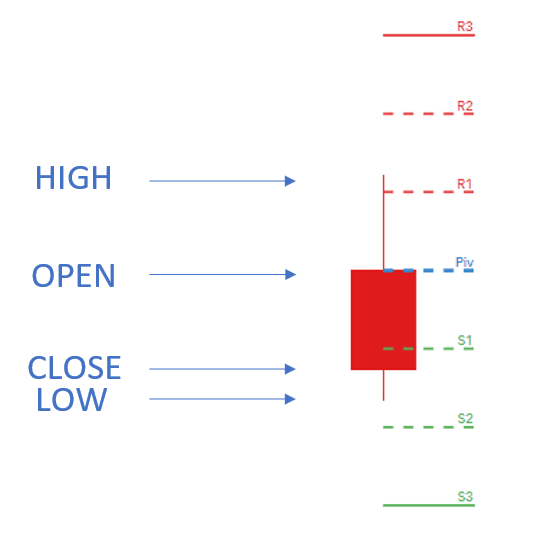
Traders simply took the high, low, and closing price from the previous period and divided by three to find the ‘pivot.’ From this pivot, traders would then base their calculations for three support, and three resistance levels.

pivot point formula

How to use pivot points in forex trading

Pivot points are used by forex traders in line with traditional support and resistance trading techniques. Price tends to respect these levels as they do with support and resistance. Pivot point price levels are recurrently tested which further substantiates these levels.

Traders frequently use additional validation tools such as indicators, candlestick patterns, oscillators, fundamentals and price action to use in conjunction with the pivot to make trade decisions in the forex market.
There are a few basic guidelines to follow when trading with pivot points:

  1. Price above pivot = bullish bias
  2. Price below pivot = bearish bias
  3. Longer period pivot points are more dependable due to increased data set
  4. Support and resistance levels are extensions of the pivot which can be used as supplementary key price levels

Pivot Point trading strategies

1. Pivot point swing trading

For traders who prefer the medium to longer-term trades, swing trading with the pivot point is possible by using weekly/monthly time frames.

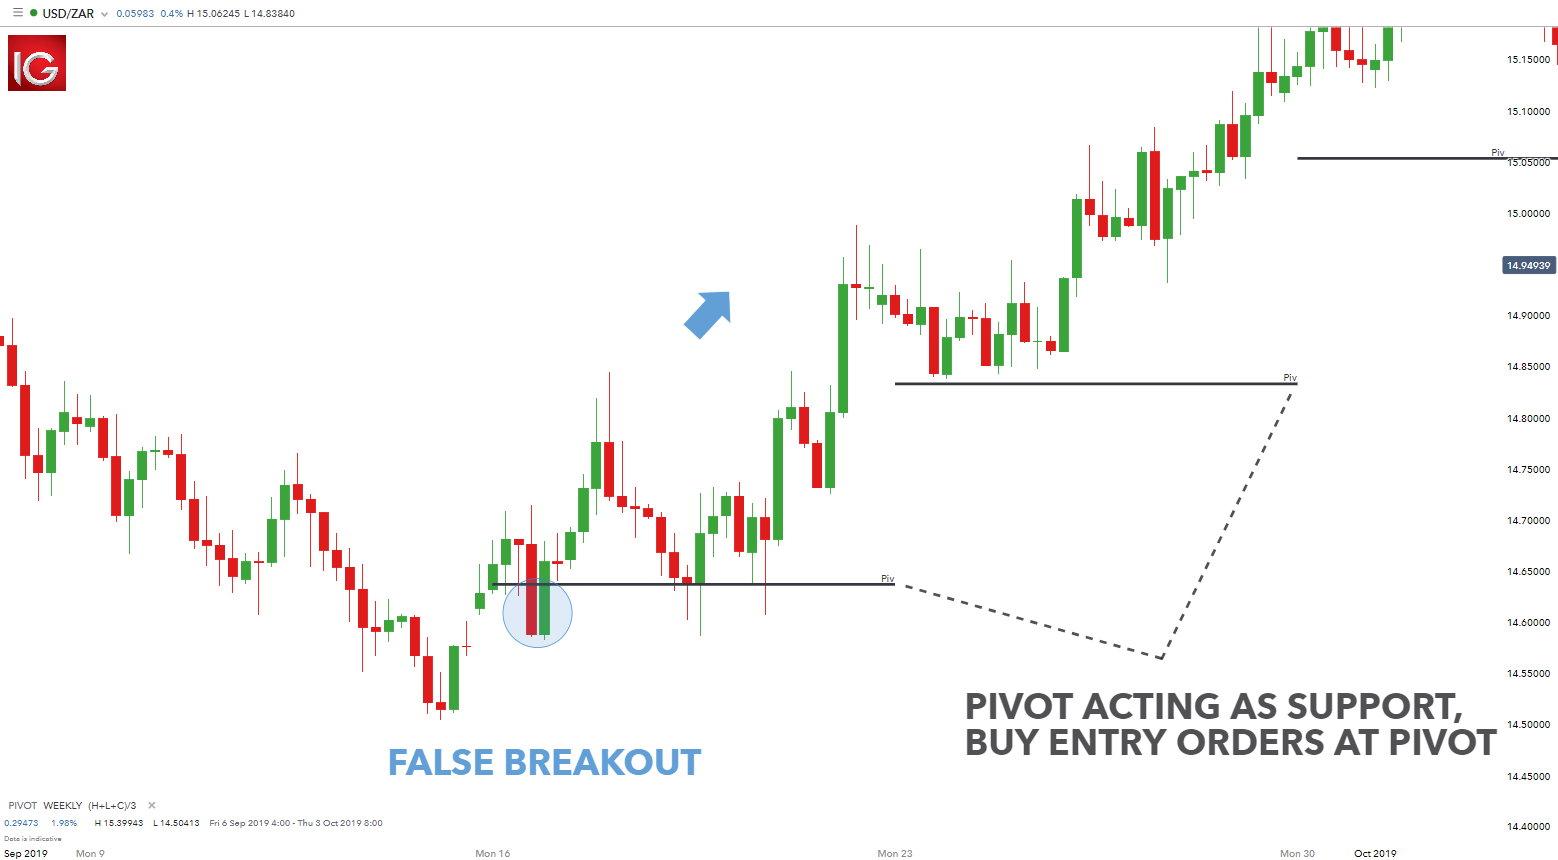
The chart below depicts a weekly chart with the addition of the pivot point only (this can be edited by changing the pivot settings on the platform). It is clear there has been a trend reversal to the upside which is evident after the price breaks through the previous pivot resistance.

Now acting as a support level, forex traders can place long entry orders at the pivot price. There is a false breakout (blue circle) but after this, there is substantial upside which could be exploited. The pivot levels won’t always contain the price, but it does offer a price level to maintain the directional bias. This would be a lengthier time horizon which would be ideal for swing traders.

USD/ZAR weekly chart

swing trading with pivot points

2. Pivot point breakout strategy

Many traders attempt to focus their trading activity to the more volatile periods in the market when the potential for large moves may be elevated.

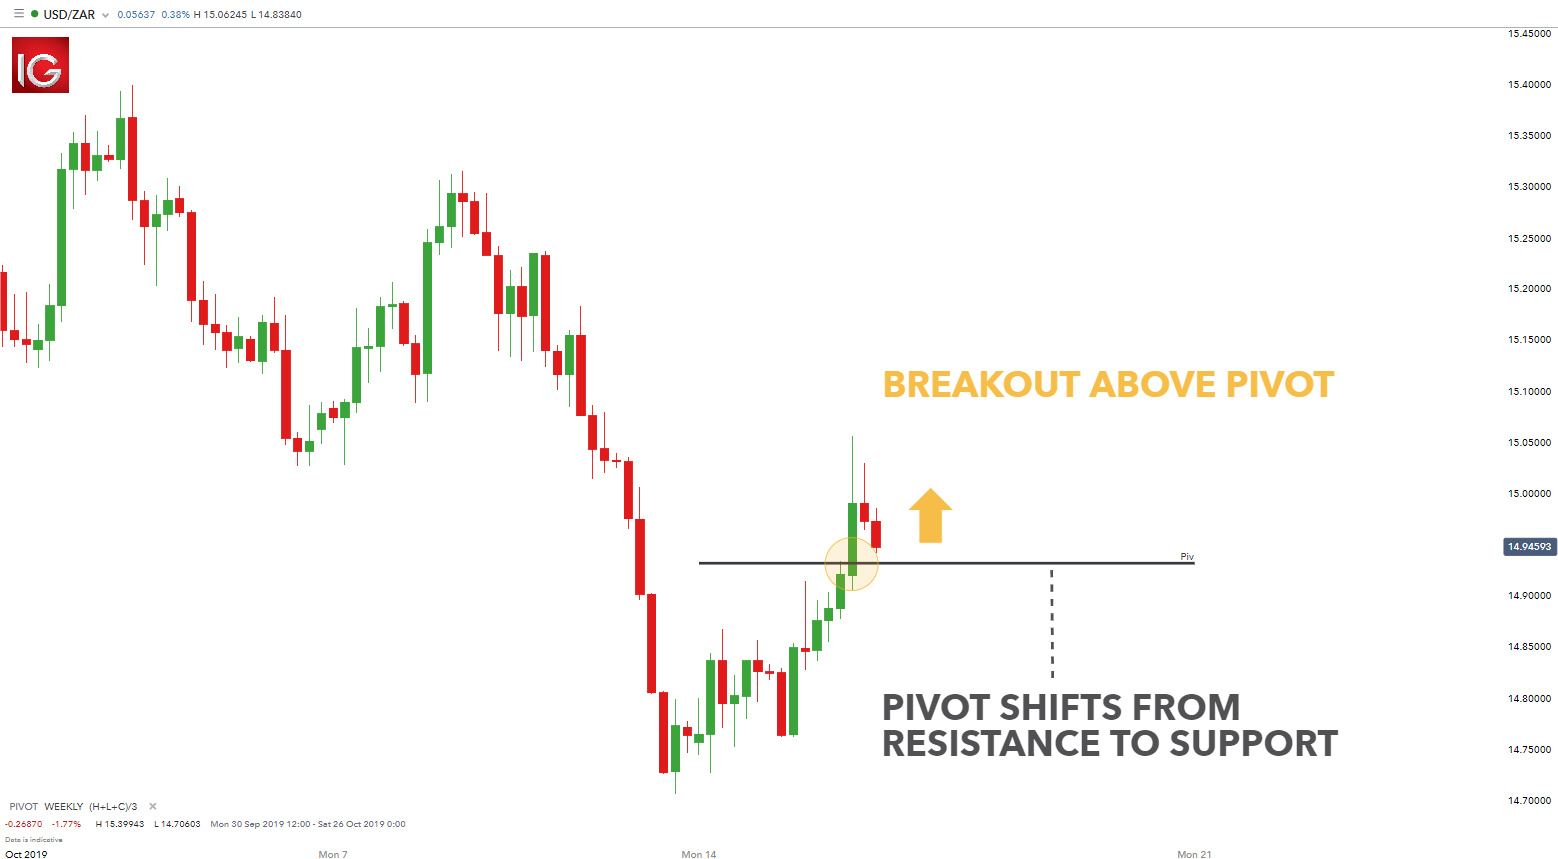
Traders may attempt to look at breaks of each support or resistance level as an opportunity to enter a trade in a fast-moving market. This can be particularly relevant for longer-term pivot levels, with focus being paid to the weekly and monthly pivot points. The charts below will show how a trader can set up a pivot point breakout strategy using firstly the pivot alone as an indication as well as the more complex support and resistance levels.
The chart below shows a pivot point with support and resistance levels excluded. In this example, the pivot indicator is based over a weekly period which provides traders with an extended data set for a more reliable key level. The pivot is used as a key price level, which was initially respected a few candles prior to the breakout. Once the breakout occurs, traders can then look to enter into a long trade as price above the pivot signals a bullish bias.

USD/ZAR four-hour chart

pivot point breakout strategy

What’s the difference between pivot points and Fibonacci retracements/extensions?

Both pivot points and Fibonacci retracements/extensions present traders with hidden levels of support and resistance. However, there are some significant differences:

Forex Vs Stocks: Top Differences & How to Trade Them

Forex Vs Stocks: Top Differences & How to Trade Them

Traders often compare forex vs stocks to determine which market is better to trade. Despite being interconnected, the forex and stock market are vastly different. The forex market has unique characteristics that set it apart from other markets, and in the eyes of many, also make it far more attractive to trade.

When choosing to trade forex or stocks, it often comes down to knowing which trading style suits you best.But knowing the differences and similarities between the stock and forex market also enables traders to make informed trading decisions based on factors such as market conditions, liquidity and volume.

Top 5 Differences between forex and stocks

The table below summarizes a few key differences between the forex market and the stock market:

Forex Market Stock Market
Large volume- Around $5 Trillion per day Less volume – Roughly $200 billion per day
Highly Liquid Less liquid
24 Hour Markets 8 Hour Markets
Minimal or no commissions Commissions
Narrow Focus Wide Focus

Let’s take a more in-depth look into how exactly the forex market compares with equities (stocks).

1) Volume

One of the biggest differences between forex and stocks is the sheer size of the forex market. Forex is estimated to trade around $5 trillion a day, with most trading concentrated on a few major pairs like the EUR/USD, USD/JPY, GBP/USD and AUD/USD. The forex market volume dwarfs the dollar volume of all the world’s stock markets combined, which average roughly $200 billion per day.
Having such a large trading volume can bring many advantages to traders. High volume means traders can typically get their orders executed more easily and closer to the prices they want. While all markets are prone to gaps, having more liquidity at each pricing point better equips traders to enter and exit the market.

2) Liquidity

A market that trades in high volume generally has high liquidity. Liquidity leads to tighter spreads and lower transaction costs. Forex major pairs typically have extremely low spreads and transactions costs when compared to stocks and this is one of the major advantages of trading the forex market versus trading the stock market. Read more on the differences in liquidity between the forex and stock market.

3) 24 Hour Markets

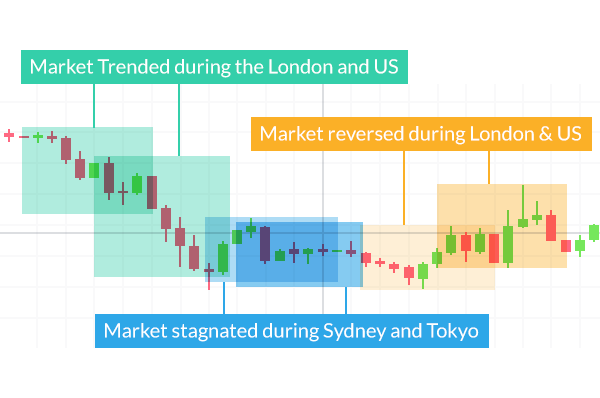
Forex is an over the counter market meaning that it is not transacted over a traditional exchange. Trading is facilitated through the interbank market. This means that trading can go on all around the world during different countries business hours and trading sessions. Therefore, the forex trader has access to trading virtually 24 hours a day, 5 days a week. Major stock indices on the other hand, trade at different times and are affected by different variables. Visit the Major Indices page to find out more about trading these markets-including information on trading hours.

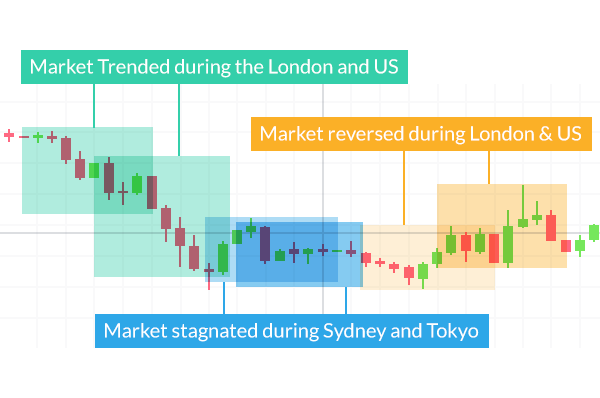
Forex market trading sessions highlighted

4) Minimal or no commission

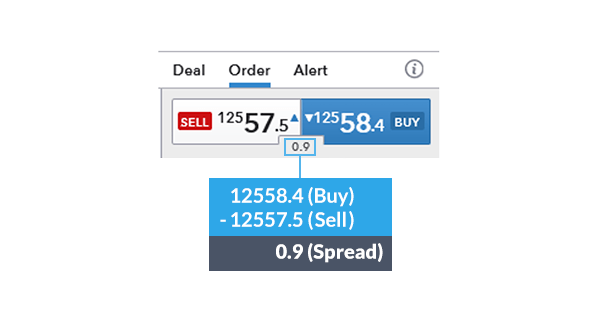
Most forex brokers charge no commission, instead they make their margin on the spread – which is the difference between the buy price and the sell price. When trading equities (stocks) or a futures contract, or a major index like the S&P 500, often traders must pay the spread along with a commission to a broker.

Forex spreads are quite transparent compared to costs of trading other contracts. Below you will see the spread of the EUR/USD highlighted inside of the executable dealing rates. The spread can be used to calculate the cost for your position size upfront prior to execution.

Deal ticket showing spread cost of forex pair, EURUSD

5) Narrow focus vs wide focus

There are eight major currencies traders can focus on, while in the stock universe there are thousands. With only eight economies to focus on and since forex is traded in pairs, traders will look for diverging and converging trends between the currencies to match up a forex pair to trade. Eight currencies are easier to keep an eye on than thousands of stocks.

The variables that effect the major currencies can be easily monitored using an economic calendar.

Should you trade forex or stocks?

Whether you choose to trade forex or stocks depends greatly on your goals and preferred trading style.

The table below shows different types of trading styles, including the pros and cons of each when trading forex and stocks.

Type of Trader Definition Advantages Disadvantages Forex vs Stocks
Short- Term (Scalping) A trading style where the trader looks to open and close trades within minutes, taking advantage of small price movements. Traders can focus more on volatility and less on fundamental variables that move the market. As a result of placing more trades, beginner traders may lose more money if their strategy isn’t fine-tuned. Suited to forex trading due to inexpensive costs of executing positions. Some exchanges require large capital account balances to trade. Most forex brokers only require you to have enough capital to sustain the margin requirements.
Medium-Term A trading style where the trader looks to hold positions for one or more days, where the trades are often initiated due to technical reasons. Lower capital requirements compared with other styles because a trader is looking for larger moves. Trades must be accompanies with analysis which may take time. Suited to trading forex and stocks.
Long-Term A trading style where a trader looks to hold positions for months or years, often basing decisions on long-term fundamental factors. Traders do not have to spend as much time analysing. Large capital requirements required to cover volatile movements. Suited more to stock trading because the forex market tends to vary in direction more than stocks.

If you are new to trading forex download our free forex for beginners guide. We also provide free equities forecasts to support stock market trading.

Forex vs other markets FAQs

How can I transition from forex trading to stock trading?

To move from forex to stock trading you will need to understand the fundamental differences between forex and stocks. When you boil it down, forex movements are caused by interest rates and their anticipated movements. Stocks are dependent on revenue, balance sheet projections and the economies they operate in amongst other things. Find out more on how to transition from forex to stock trading.

Are there any differences between forex and commodities trading?

Forex and commodities differ in terms of regulation, leverage, and exchange limits. Forex markets are a lot less regulated than commodities markets whilst commodities markets are highly regulated. In terms of leverage, it exists in both the forex and commodities market, but in the forex market it is more popular due to greater liquidity and lower volatility (leverage can amplify losses and gains).

Also, like stocks, commodities trade on exchanges. Commodity exchanges set roofs and floors for the price fluctuations of commodities and when these limits are hit trading may be halted for a certain time depending on the product traded. The forex and stock market do not have limits that can prevent trading from happening.

Keep up to date with current currency, commodity and indices pricing on our top rates page. Also, see our expert trading forecasts on equities, major currencies the USD and EUR, or read our guide on the Traits of Successful traders for insight into the top mistake traders make.

Pound Sterling edges lower after UK employment data

Pound Sterling edges lower after UK employment data

The Pound Sterling (GBP) exhibits a subdued performance against its major peers in Thursday’s London session. The British currency drops as United Kingdom (UK) Average Earnings data, a key measure of wage growth that fuels inflation in the service sector and has been a major barrier to the Bank of England’s (BoE) confidence for interest rate cuts, decelerated as expectedly.

Annual Average Earnings (Including and Excluding bonuses) rose by  5.7% in the three months ending in May, below the 5.9% and 6%, respectively, from the previous month. Though the wage growth momentum slowed, it is still higher than what is needed to be consistent for achieving price stability.

Meanwhile, the Office for National Statistics (ONS) reported that employers hired 19K job-seekers in the three months ending in May, against a drawdown of 140K employees in the previous reading. In the same period, the ILO Unemployment Rate was recorded at 4.4%, remaining in line with estimates and the former release.

Expectations for the BoE to begin reducing interest rates from the August meeting have already diminished due to sticky core Consumer Price Index (CPI) data for June. UK’s core CPI grew steadily by 3.5% due to sticky service inflation data.

Daily digest market movers: Pound Sterling declines moderately against US Dollar

  • The Pound Sterling edges lower near the psychological support of 1.3000 against the US Dollar (USD) in Thursday’s European session. The broader appeal of the GBP/USD pair remains firm as the Federal Reserve (Fed) is widely expected to start lowering its key borrowing rates from the September meeting.
  • The scenario of higher expectations for Fed rate cuts is unfavorable for the US Dollar (USD). The US Dollar Index (DXY), which tracks the Greenback’s value against six major currencies, hovers near an almost four-month low at around 103.70.
  • Firm speculation for Fed rate cuts has been prompted by meaningful signs from June’s Consumer Price Index (CPI) report that the disinflation process has resumed after stalling in the first quarter of the year. Annual headline and core CPI, which excludes volatile food and energy prices, decelerated at a faster-than-expected pace.
  • Cooling inflationary pressures have also improved Fed officials’ confidence that price pressures are on track to return to the central bank’s target of 2%. On Wednesday, Richmond Fed Bank President Thomas Barkin cited broadening disinflation as “very encouraged.” Barkin added he is sure policymakers will debate at the July policy meeting whether it is still appropriate to describe inflation as elevated, Reuters reported.

Technical Analysis: Pound Sterling trades above all short-to-long-term EMAs

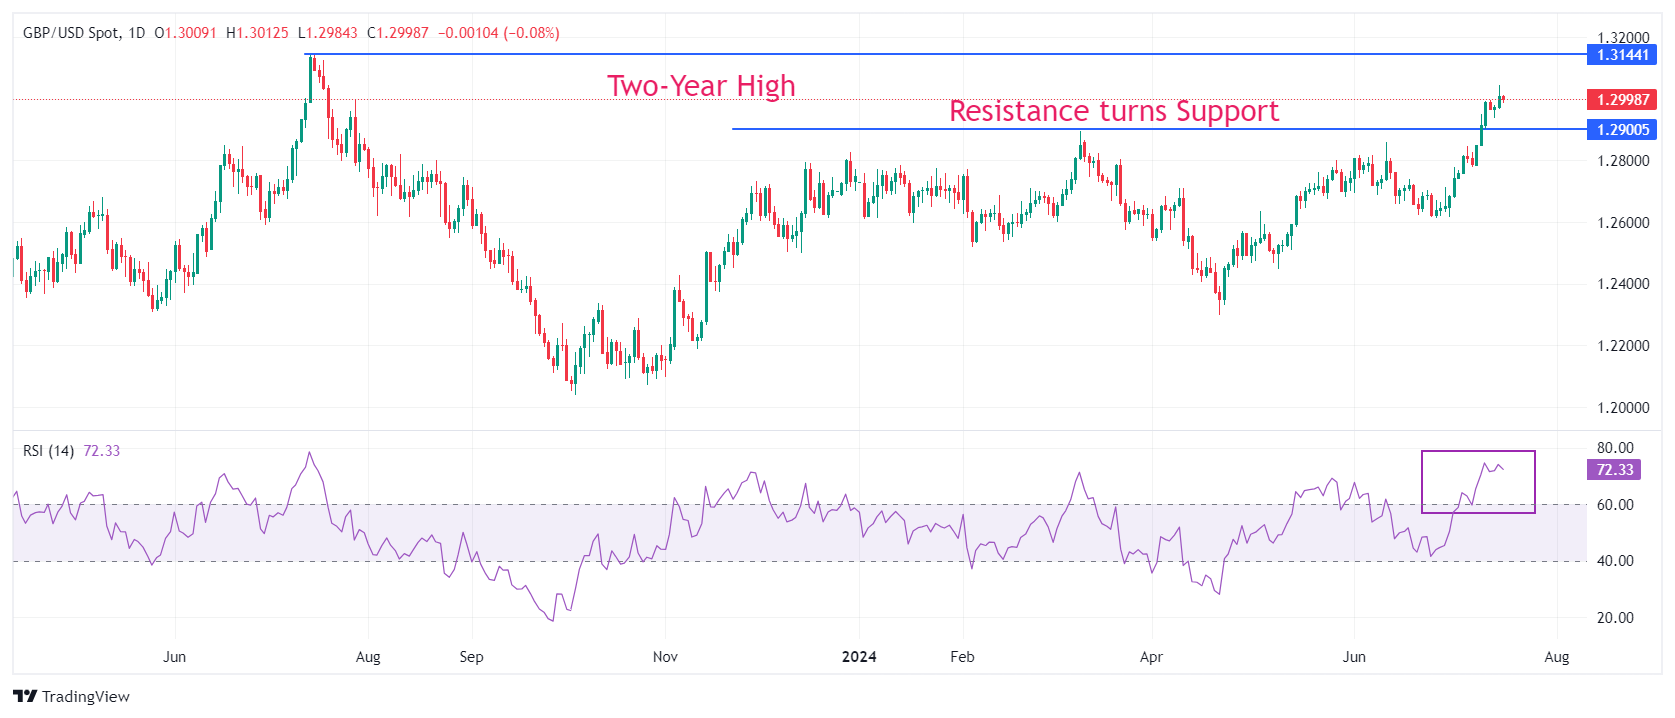
The Pound Sterling drops to near 1.3000 against the US Dollar on a steady decline in the UK wage growth measure. However, the overall trend remains firm as the GBP/USD pair trades close to a fresh two-year high of 1.3044 recorded on Wednesday.

All short-to-long-term Exponential Moving Averages (EMAs) are sloping higher, suggesting a strong bullish trend.

The 14-period Relative Strength Index (RSI) jumps to near 70.00 for the first time in more than a year, indicating strong momentum towards the upside.

The major is expected to extend its upside towards the two-year high near 1.3140. If the GBP/USD pair faces selling pressure after UK data, the March 8 high near 1.2900 will be a key support for the Pound Sterling bulls.