Hawkish vs Dovish: How Monetary Policy Affects FX Trading

Hawkish vs Dovish: How Monetary Policy Affects FX Trading

You have probably heard a financial news presenter say something along the lines of “The central bank governor came out slightly hawkish today after bouts of strong economic data”. The terms Hawkish and Dovish refer to whether central banks are more likely to tighten (hawkish) or accommodate (dovish) their monetary policy.

Central bank policy makers determine whether to increase or decrease interest rates, which have significant impact on the forex market. Policy makers increase interest rates to prevent an economy from overheating (to prevent inflation from going too high) and they decrease interest rates to stimulate an economy (to prevent deflation and stimulate GDP growth).

Hawkish and dovish policies affect currency rates through a mechanism central bankers like to call “forward guidance”. This is policy makers trying to be as transparent as possible in their communications to the market about where monetary policy may be heading.

Keep reading to learn more about hawkish and dovish policies and how to apply this knowledge to your forex trades.

What does hawkish mean?

The term hawkish is used to describe contractionary monetary policy. Central bankers can be said to be hawkish if they talk about tightening monetary policy by increasing interest rates or reducing the central bank’s balance sheet. A monetary policy stance is said to be hawkish if it forecasts future interest rate increases. Central bankers can also be said to be hawkish when they are positive about the economic growth outlook and expect inflation to increase.

Currencies tend to move the most when central bankers shift tones from dovish to hawkish or vice versa. For example, if a central banker was recently dovish, stating that the economy still requires stimulus and then, in a later speech, stated that they have seen inflation pressures rising and strong economic growth, you could see the currency appreciate against other currencies.

Some words that could be used describing a hawkish monetary policy include:

  • Strong economic growth
  • Inflation increasing
  • Reducing the balance sheet
  • Tightening of monetary policy
  • Interest rate hikes

Generally, words used that indicate increasing inflation, higher interest rates and strong economic growth lean towards a more hawkish monetary policy outcome.

What does dovish mean?

Dovish refers to the opposite. When central bankers are talking about reducing interest rates or increasing quantitative easing to stimulate the economy they are said to be dovish. If central bankers are pessimistic about economic growth and expect inflation to decrease or become deflation and they signal this to the market through their projections or forward guidance, they are said to be dovish about the economy.

Some words that could be used to describe a dovish monetary policy, include:

  • Weak economic growth
  • Inflation decreasing/deflation (negative inflation)
  • Increasing the balance sheet
  • Loosening of monetary policy
  • Interest rate cuts

Hawkish vs Dovish Explained

The below graphic provides a snapshot of the main differences between hawkish and dovish monetary policy:

hawkish vs dovish

The table below provides a more in depth comparison on dovish vs hawkish monetary policies, highlighting the differences between the two and how they impact currencies.

Hawkish monetary policies Dovish monetary policies
Increasing interest rates to stem inflation pressures

→ Currency could appreciate as capital flows to higher interest rate currency

Decreasing interest rates to stimulate the economy

→ Currency could depreciate as capital flows to a lower interest rate currency

Reducing the Federal Reserve balance sheet by selling mortgaged backed securities (MBS) and treasuries

→ Currency could appreciate as selling of treasuries and MBS could increase interest rates

Increasing the Federal Reserve balance sheet through quantitative easing (QE). QE is the purchasing of MBS and treasuries that increase the money supply in the economy to stimulate it.

→ Currency could depreciate as an increase in money supply decreases demand for the currency

Forward guidance from central banks include positive statements about the economy, economic growth, and inflation outlook.

→ Currency could appreciate as investors forecast further interest rate hikes

Forward guidance from central banks include negative statements about the economy, economic growth, and signs of deflation.

→ Currency could depreciate as investors forecast interest rate cuts

How to trade a Hawkish or Dovish Central Bank

A slight shift in tone from a central banker could have drastic consequences for a currency. Traders often monitor Federal Open Market Committee meetings and minutes to look for slight changes in language that could suggest further rate hikes or cuts and attempt to take advantage of this.

Monetary policy leaning dovish to hawkish

Monetary policy standing as at 1 January 2019

The image above shows the different central banks current monetary policy stance. When a central banks’ monetary policy stance moves more towards the left (dovish) their currency could depreciate against other currencies. If the monetary policy stance moves more towards the right (hawkish) their currency could appreciate.

Trading a hawkish or dovish central bank isn’t as easy as buying a hawkish central bank currency or selling a dovish central bank currency. It has to do with changing interest rate expectations. Let’s look at two scenarios:

Scenario 1:

If a central bank is currently in a rate hiking cycle, the market will have already forecasted future interest rate hikes. It is the job of the trader to watch for clues and economic data that could shift the tone of the central bank to either more hawkish than currently, or to dovish. Currencies could move a large amount when the monetary tones shift from what they are currently.

Scenario 2:

Likewise, if a central bank is currently cutting rates and economic data hasbeen negative, the market would have priced-in the current dovish monetary stance. Traders would have to watch the central bankers forward guidance and economic data, which you can find on an economic calendar, for clues to whether they may become more dovish than currently, or hawkish.

In late 2018 the federal reserve was quite hawkish. Federal Reserve Chairman, Jerome Powell, stated that “we’re a long way away from neutral at this point” which the market perceived as hawkish (2 Oct 2018). This implied that the Federal Reserve still had to hike rates many more times to get to the neutral rate. Then on the 28th of November, the FOMC released their statement of monetary policy in which Jerome Powell said he saw rates at “just below neutral”. This shift in tone is like scenario 1 above, where the central banks shifts tone from hawkish to slightly dovish. Leading to a depreciation of the currency- see the charts below that show what happened to the Dollar Index (DXY) on the October 2, 2018 and then on the November 28, 2018.

October 2, 2018 – Federal Reserve Chairman, Jerome Powell says “We’re a long way away from neutral at this point” leading to appreciation of the Dollar.

15min US Dollar index chart, vertical line indicating October 2, 2018.

2nd October Federal Reserve chairman states that rates are a far away from neutral

November 28, 2018 Federal Reserve Chairman says that interest rates are “just below neutral” indicating a shift in tone from hawkish to dovish. Dollar depreciations.

15min USD Dollar index chart

Federal reserve chairman Jerome Powell states that rates are just below neutral

Keeping up to date with central banks can be difficult. At DailyFX we have a Central Bank Weekly Webinar where we analyze central bank decisions and keep you up to date with central bank activity.

If you are just starting out on your trading journey it is essential to understand the basics of forex trading in our New to Forex guide. We also offer a range of trading guides to supplement your forex knowledge and strategy development.

Senior Analyst, Tyler Yell of DailyFX sat down with former Federal Reserve Advisor, Danielle Dimartino Booth in a podcast that covered global central bank developments and Danielle’s biggest lesson she learned as a Fed insider.

How to Combine Fundamental and Technical Analysis

How to Combine Fundamental and Technical Analysis

Fundamental and technical analysis can complement one another

Fundamental and technical analysis can be combined to provide a holistic trading strategy. Traders often compare the differences between fundamental and technical analysis, however blending the two can have positive benefits. Although there are no hard facts as to which style of analysis is superior, combining the two may lead to more definitive trade choices. This article will explore various ways how to combine fundamental and technical analysis using practical examples.

Ways to combine fundamental and technical analysis

There are numerous ways of combining fundamental and technical analysis. Below are examples of how three different technical analysis methods can be combined with fundamental analysis to provide richer insights including:

  1. Combining range bound trading with fundamental analysis
  2. Combining breakout trading with fundamental analysis
  3. Using oscillators with fundamental analysis

Range bound trading with fundamental analysis

Range bound trading attempts to identify a price channel of a market, by which a trader uses to buy at the lower trendline support and sell at the higher trendline resistance.

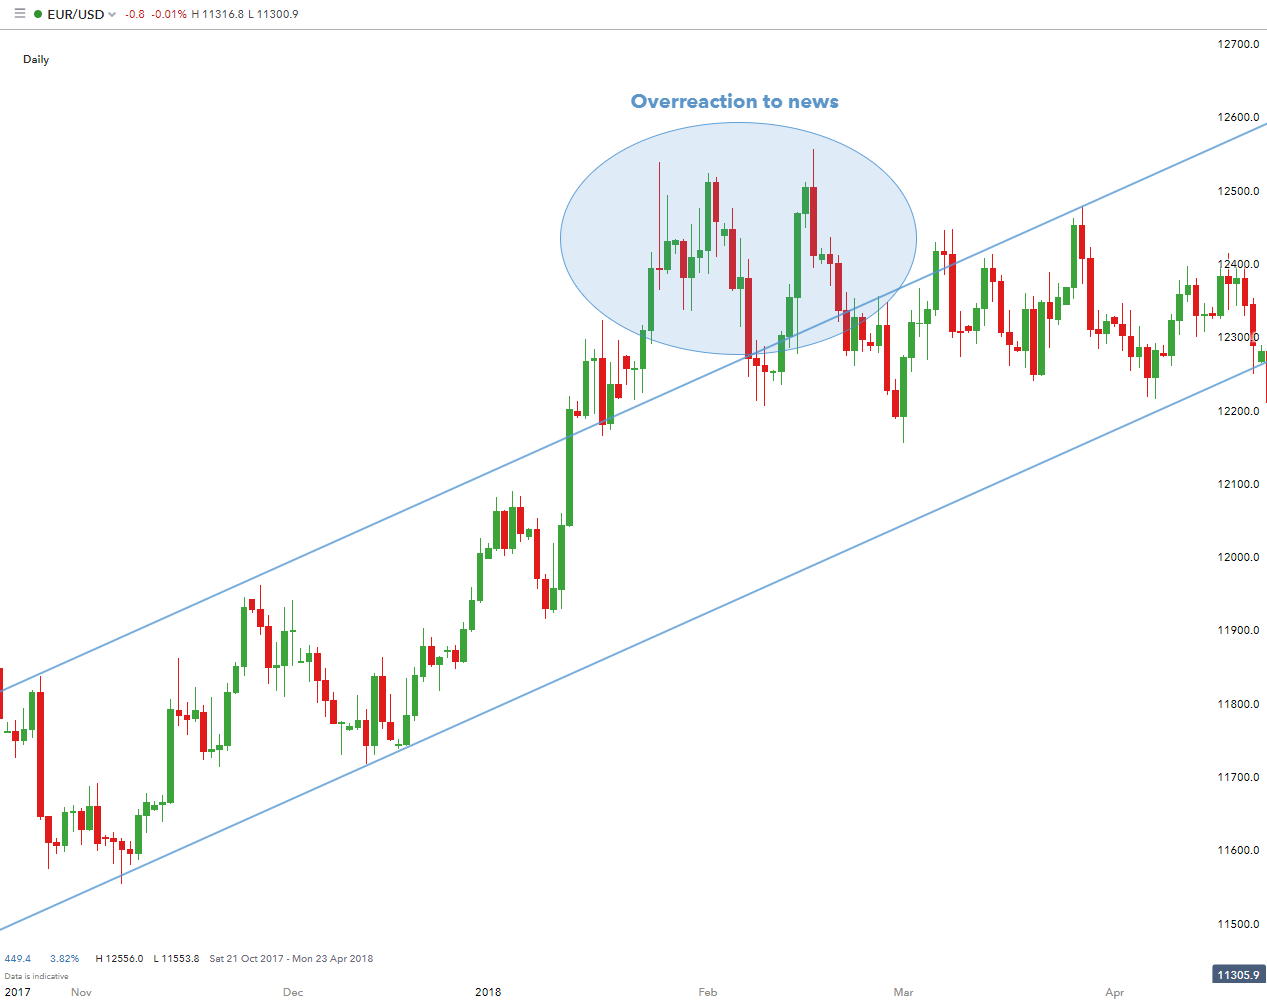
The chart below shows a strong bullish (upward) trend on EUR/USD. In a strong up-trending market, traders are looking to enter or buy at the lowest possible level to maximize on the strategy. However, news events can disrupt a range bound market. In this case, the trader would look to avoid open trades around the time of the news release (poor ‘retail sales’ and ‘durable goods orders’ figures). The chart shows clearly this disruption as indicated, after which the price level returns to preceding range bound levels.

fundamental news trading

Breakout trading with fundamental analysis

A breakout trade strategy involves capitalising on prices of an instrument moving outside of a predefined trading range; often catalysed by news events.

While range traders should remain cautious when going into news releases (since additional volatility could pierce support and/or resistance with which they are using to set their stops), they can still look to take advantage of overreactions to news. Traders in these situations would want to wait for news or data to cause price to reach support and/or resistance – and once a test of either of these levels are put in – could look to buy or sell accordingly. Traders can look to trade breakouts with any of the prescribed mechanisms of support and resistance, with the anticipation that news releases could bring in the wanted volatility to a) trigger into the trade b) move the trade closer to the trader’s profit target (limit).

Using oscillators with fundamental analysis

fundamental trading with indicators

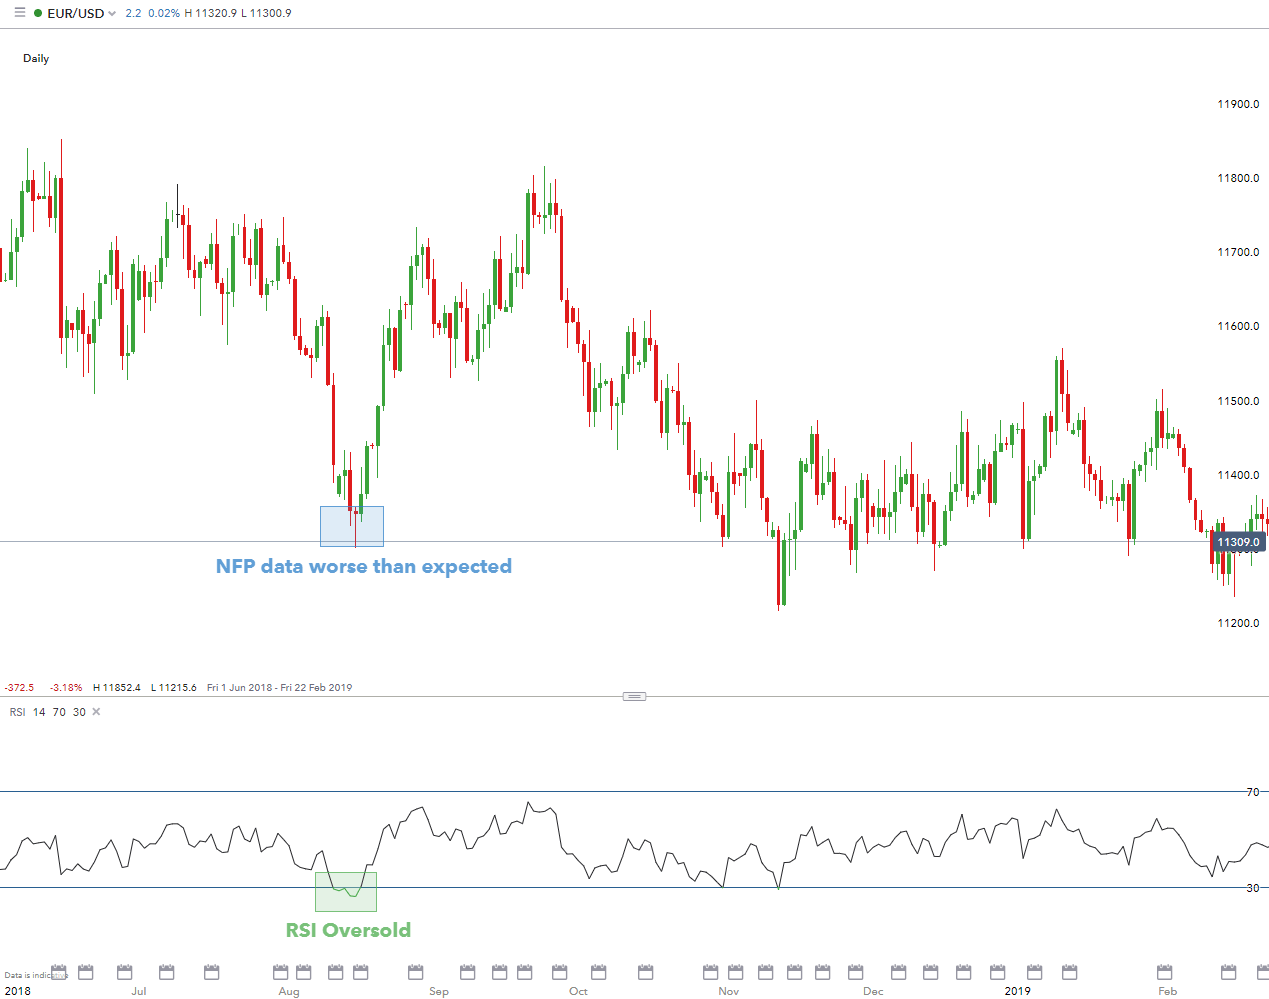
Oscillators are a frequently used technical instruments, usually to discover short-term overbought/oversold conditions. In the chart above, I have included an example of using an RSI indicator (technical indicator) in conjunction with a Non-farm Payroll (fundamental indicator) data release, one of the most significant fundamental indicators in US history. The NFP figure was lower than estimates, which caused the USD to weaken as depicted by the strong bullish move on EUR/USD. When NFP is due to be released and you expect it to be lower than estimates based on recent events in the US, then this would mean EUR/USD could become more volatile so potentially a good choice to sell and vice versa. Oscillators can further assist with entry and exit points and their respective timing.

Combining Fundamental and Technical Analysis: A Summary

Technical analysis can be an extremely informative technique to analyse markets, but it is important to note that fundamentals do play a role in the broader picture. The above content has provided real world scenarios of combining technical and fundamental analysis.

Advantages of fundamental and technical analysis:

Fundamental Analysis Technical Analysis
Market valuation (undervalued/overvalued) Trade timing (entry/exit points)
Solid understanding of the market/industry Can be used on most trading instruments
Geared at more longer-term trades Favours shorter-term trades
Extensive research required Encompasses all current information

Traders could experiment with techniques of technical, fundamental and a combination of both before settling on a trade strategy. It is recommended testing out different methods on a demo trading account before live trading.

What Trading Style Best Suits Your Personality?

What Trading Style Best Suits Your Personality?

Trading style often correlates with the personality of the trader. It is important to reflect internally on personality and lifestyle before choosing a trading strategy and creating a trading plan. This is because using a trading style contrary to your personality will lead to difficulties down the road in sticking to your trading plan.When a trader finds the trading style that suits them best; the style generally endures long term. A trader who isn’t comfortable with a trading style or has not found a home in a specific trading style is the one who most often makes the most common trading mistakes.

Trading Styles for Highly-Organized Individuals Short on Time

Strategies to consider:

  • Swing Trading– Swing trades are considered medium-term as positions are generally held anywhere between a few hours to a few days. The time investment is minimal which is suitable for traders short on time. Orders to open and close may be used which will automatically trigger once certain price levels are reached.
  • Automated Trading – Another approach for traders short on time, or trading in their spare time, is automated trading. Traders merely set their entry and exit criteria along with the size of the trade and allow the market to do the rest.

Trading Style for Cautious Individuals with Time to Research

Strategies to consider:

  • Position Trading – This is suitable for traders looking to hold positions for a prolonged period (months/years), often basing decisions on long-term fundamental factors. Large capital is required to withstand any potential volatility during the lifetime of the trade in order to avoid a margin call. Cautious individuals will also tend to trade smaller sizes, make use of stops, and avoid highly volatile markets.

Trading Style for Decisive Individuals who Prefer Instant Results

Strategies to consider:

  • Scalp Trading – A scalp trader looks to open and close a trade within minutes, often takingadvantage of small price movements usually with high leverage. Profits and losses are realized swiftly due to the fast-moving nature of this trading strategy. Decisive traders that seek instant results often trade the news by formulating an opinion of how the market is likely to react and plan accordingly.

Being Consistent with Your Trading Style

Consistency in trading style will lead to consistency in results. Altering styles when trades are not favourable is a common mistake with novice traders. Judgement should not be handed after limited trades, because not every trade is successful. If the trading strategy is sound with proper risk management, sticking to it should provide the desired results.

Finding Your Trading Personality and Style: A Summary

Traders of different personalities and lifestyles can all participate in the forex market. Whether a trader is comfortable with a hands-on longer-term swing or position trading approach, or shorter-term day trading or scalping approach or even a hands-off automated trading approach; trading has something for everyone!

Bitcoin and Ethereum Trade Sharply Higher – BTC/USD and ETH/USD Latest

Bitcoin and Ethereum Trade Sharply Higher – BTC/USD and ETH/USD Latest

The cryptocurrency market turned higher over the weekend and in early European trade, regaining some of June’s hefty losses. After touching a $72k high in early June, sellers took control of the market and pushed BTC/USD down to a multi-month of $53.5k on July 5th. During this period, the German government sold approximately 50k Bitcoin into the market, coins that had been confiscated from the illegal streaming site Movie2k. On-chain analysis shows the German government’s cryptocurrency wallet now has a zero Bitcoin balance.

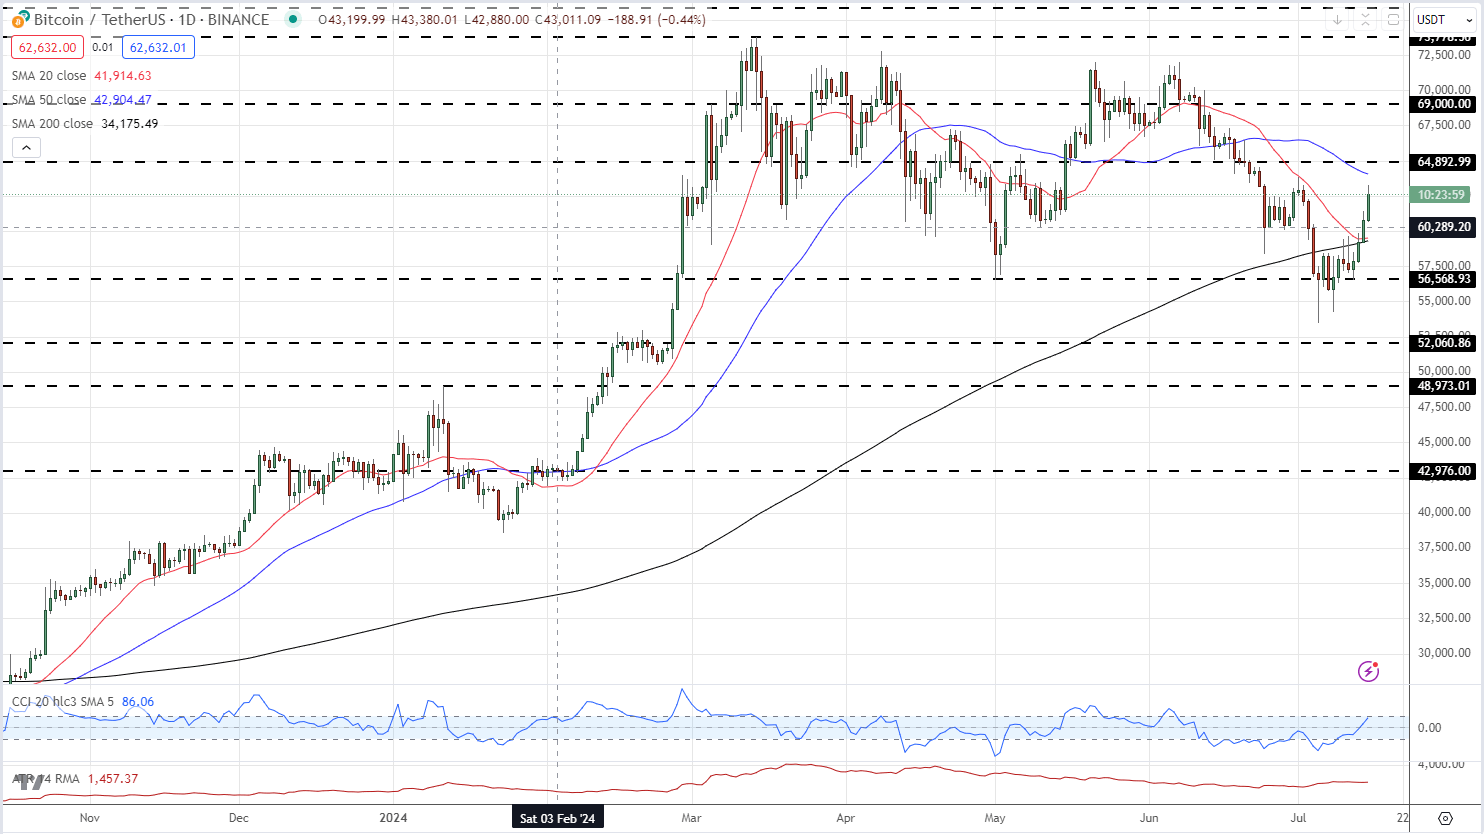
The daily Bitcoin chart shows BTC/USD back above the 20-day and the 200-day simple moving averages. A reclaim of the 50-dsma at $64k and a prior swing high at just under $65k would set the tone for a higher move.

BTC/USD Daily Price Chart


image1.png

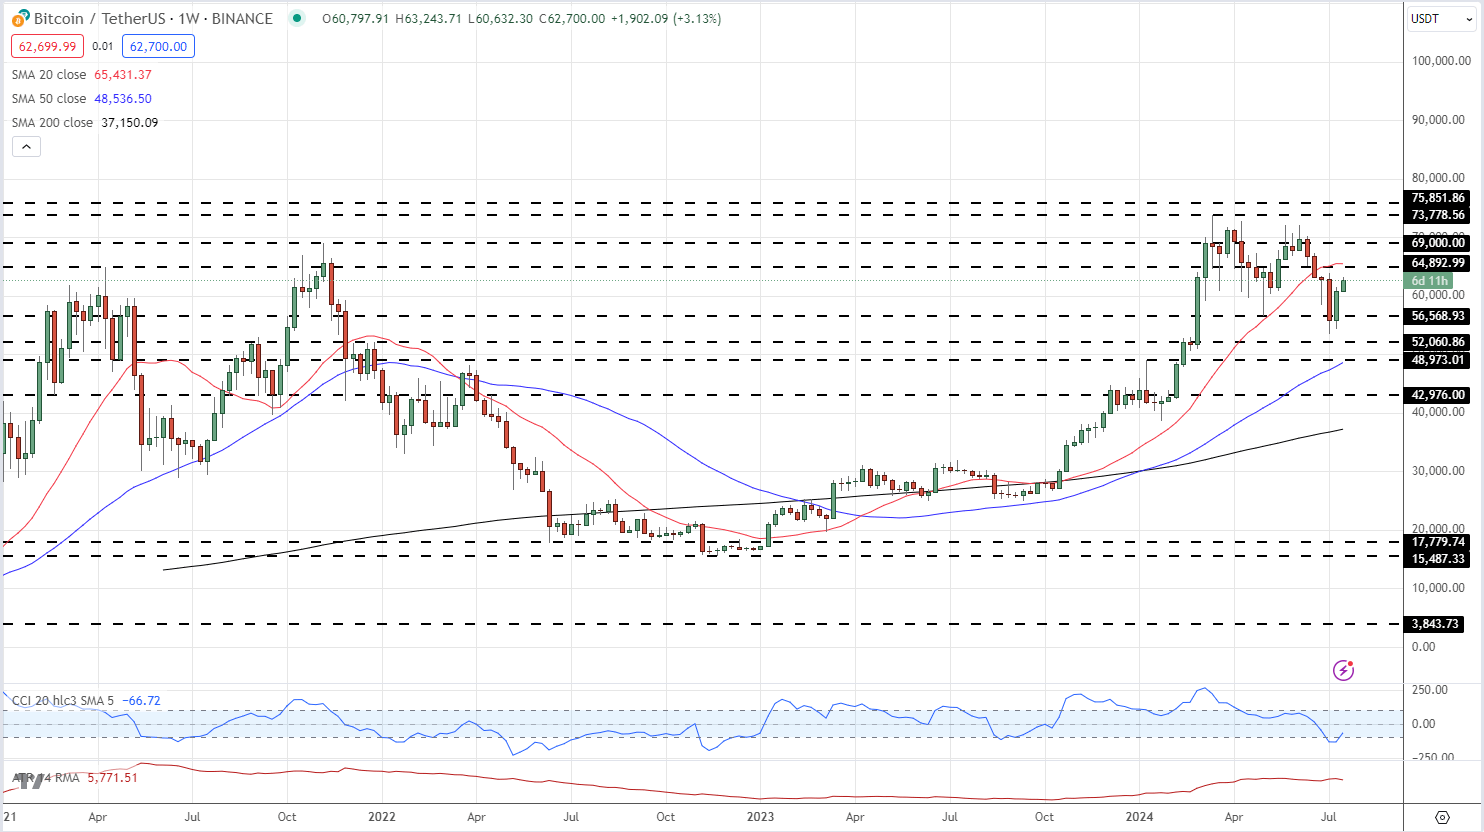
On the weekly chart, a bullish cup and handle pattern continues to be formed and suggests that Bitcoin will move higher over the coming months.

BTC/USD Weekly Price Chart

​

image2.png

Ethereum traders are waiting for launch dates from the SEC on the highly anticipated Ethereum spot ETFs. In late May the SEC gave the regulatory go-ahead to several spot Ethereum ETFs from eight providers, including BlackRock, Fidelity, Franklin Templeton, and VanEck. Final SEC approval and launch date are expected shortly.

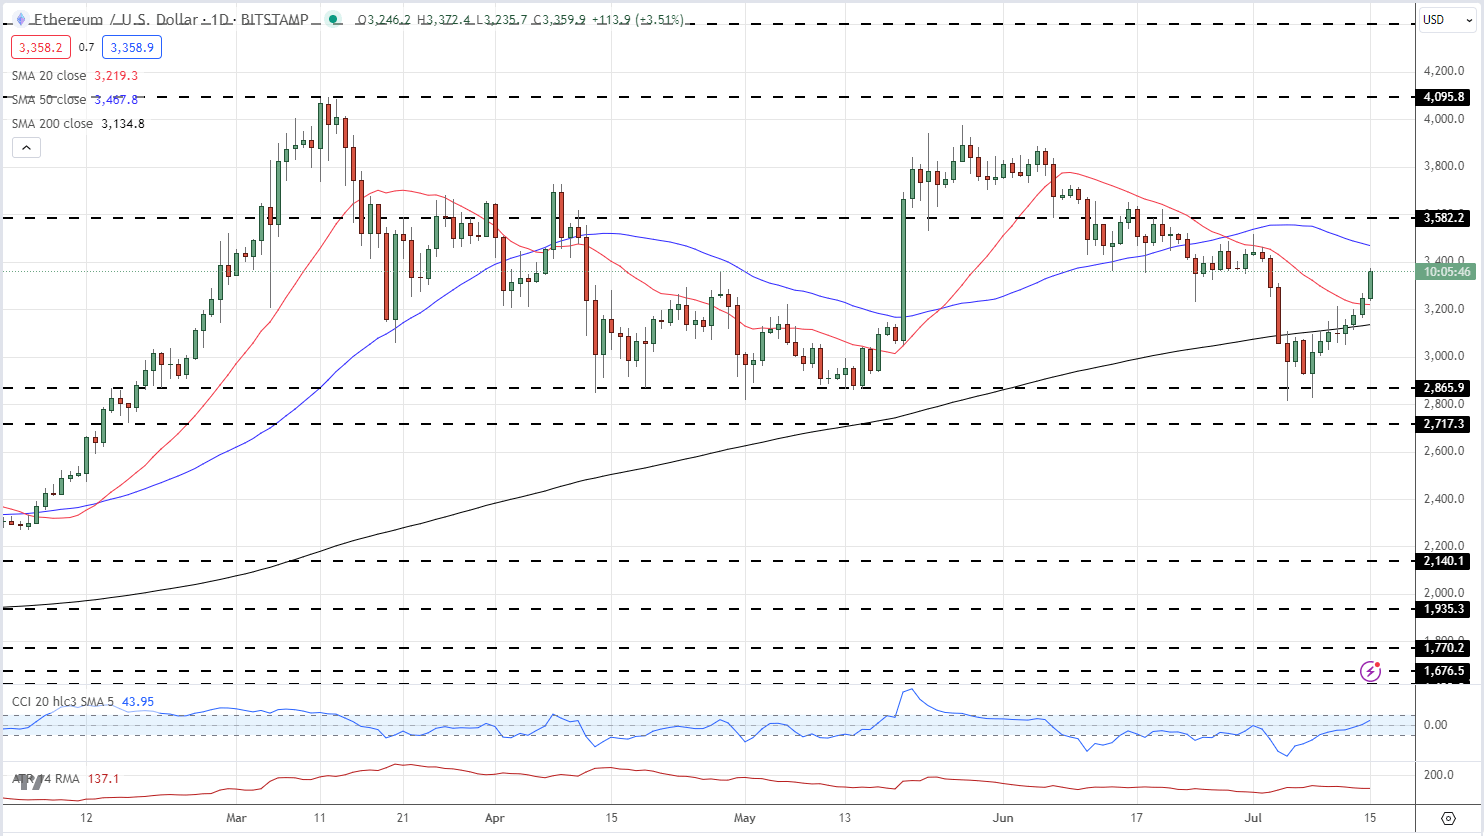
In line with Bitcoin, Ethereum has climbed higher over the last week and is also back above both the 20-day and 200-day simple moving averages. The 50-day sma is currently located at just under $3.5k. Above here, $3.6k comes into view, ahead of a recent lower high at just under $4k, before the March 11th multi-month high at $4,095 comes into play.

ETH/USD Daily Price Chart

image3.png

What is your view on Bitcoin and Ethereum

Gold, US Oil, S&P 500 – Latest Retail Sentiment Analysis

Gold, US Oil, S&P 500 – Latest Retail Sentiment Analysis

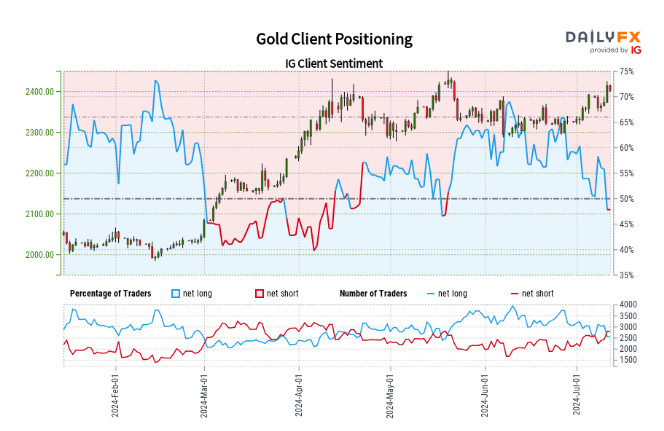
Gold Retail Sentiment

Recent retail trader data reveals a balanced market, with 49.85% of traders in long positions and a short-to-long ratio of 1.01 to 1. Notable shifts have occurred: long positions have decreased by 13.24% since yesterday and 13.73% over the past week. Conversely, short positions have increased by 8.36% daily and 6.44% weekly.

Our analytical approach often counters prevailing market sentiment. The current net-short positioning implies the potential for Gold price appreciation. The growing short bias observed both daily and weekly, strengthens our contrarian bullish view on Gold.

image1.png

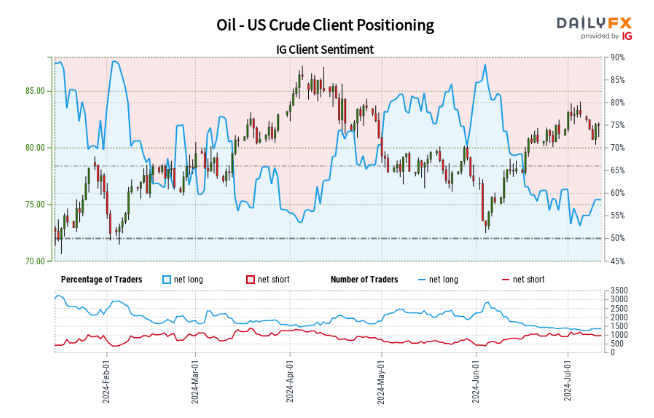
US Crude Oil Sentiment

Recent data indicates 58.26% of retail traders are net-long, with long positions outweighing short by 1.40 to 1. Net-long traders have decreased by 0.43% daily but increased by 7.19% weekly. Net-short traders have grown by 4.31% since yesterday but declined by 14.98% over the week.

Our strategy often opposes market sentiment. The current net-long majority implies potential US Crude price decreases. However, the conflicting short-term and medium-term changes in positioning yield an ambiguous trading outlook for Oil – US Crude.

image2.png

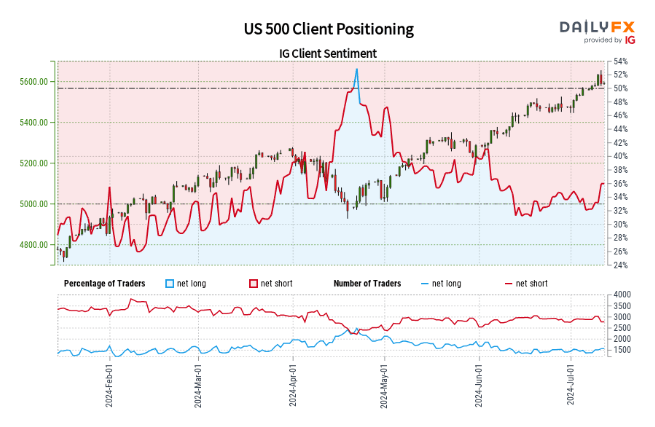
S&P 500 Sentiment

Retail trader data reveals a bearish tilt, with 36.30% net-long positions and a 1.75 to 1 short-to-long ratio. Net-long traders have grown by 13.58% since yesterday and 6.75% over the week. Net-short traders have declined by 8.07% daily and 2.91% weekly.

Our approach typically contradicts crowd positioning. The dominant net-short sentiment suggests continued US 500 price appreciation. However, the recent decline in net-short positions across both daily and weekly periods indicates a possible reversal in the current US 500 uptrend, despite the persisting net-short majority.

image3.png

Oil – US Crude
Japanese Yen Analysis – USD/JPY Trims Losses; Official Intervention or Jawboning?

Japanese Yen Analysis – USD/JPY Trims Losses; Official Intervention or Jawboning?

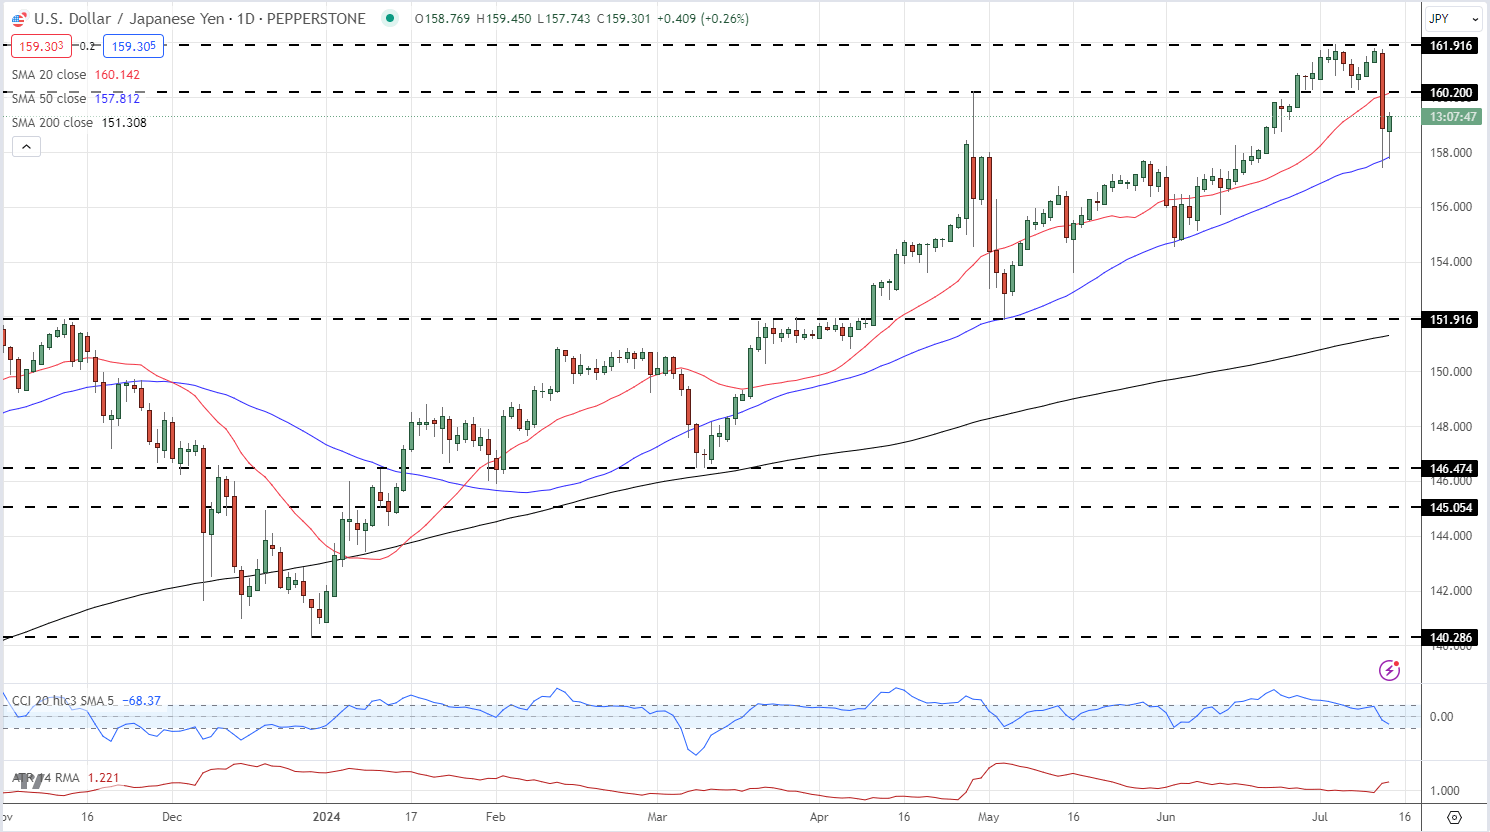
USD/JPY shed over 400 pips in just over 30 minutes yesterday afternoon, hitting 157.42, after the latest US CPI report showed price pressures easing by more than expected in June. US dollar weakness was driven by a sharp boost in US rate cut expectations which at one stage yesterday hit a 97% probability for a cut at the September 18 FOMC meeting. The US dollar fell across the board, but the weakness in USD/JPY stood out for the size and speed of the sell-off.

This invariably sparked talk about Bank of Japan (BoJ) intervention, especially as USD/JPY was trading around a 38-year high just before the US CPI data was released. Various reports suggest that the BoJ may have been checking market prices, a known form of verbal intervention that precedes any actual action, although this remains difficult to confirm. Stop losses may also have been triggered for traders who have been running the long USD/JPY trade over the last few weeks. Japanese officials refused to comment on market speculation, leaving the market waiting for official data at the end of the month to see if the BoJ/MoF bought any Japanese Yen.

The US dollar is marginally stronger in early European trade, pushing USD/JPY back to 159.25. The pair have made a handful of attempts to break above 162.00 over the last two weeks without any success and this level of resistance should hold going forward. Financial markets are currently showing a 46% chance that the BoJ will hike rates by 10 basis points at the end of July, a move that would start to narrow the interest rate differential between the two currencies and weaken USD/JPY.

USD/JPY Daily Price Chart

image1.png

Retail trader data shows 28.57% of traders are net-long with the ratio of traders short to long at 2.50 to 1.The number of traders net-long is 6.24% higher than yesterday and 19.65% higher than last week, while the number of traders net-short is 24.54% lower than yesterday and 27.96% lower than last week.

We typically take a contrarian view to crowd sentiment, and the fact traders are net-short suggests USD/JPY prices may continue to rise. Yet traders are less net-short than yesterday and compared with last week. Recent changes in sentiment warn that the current USD/JPY price trend may soon reverse lower despite the fact traders remain net-short.

Top 3 Technical Analysis Charts for Trading

Top 3 Technical Analysis Charts for Trading

Technical analysis of charts aims to identify patterns and market trends by utilising differing forms of technical chart types and other chart functions. Interpreting charts can be intimidating for novice traders, so understanding basic technical analysis is essential. This article reveals popular types of technical analysis charts used in forex trading, outlining the foundations and uses of these chart types.

How many types of charts are there?

There are three main types of technical analysis charts: candlestick, bar, and line charts. They are all created using the same price data but display the data in different ways. As a result, they involve different types of technical analysis to help traders make informed decisions across forex, stocks, indices and commodities markets. While there are several different types of charts, this article is covering only the top three because these three are the most widely followed.

The three charts presented below have been selected as they are universal across most trading platforms.

Top 3 types of technical analysis charts for trading

Line Charts

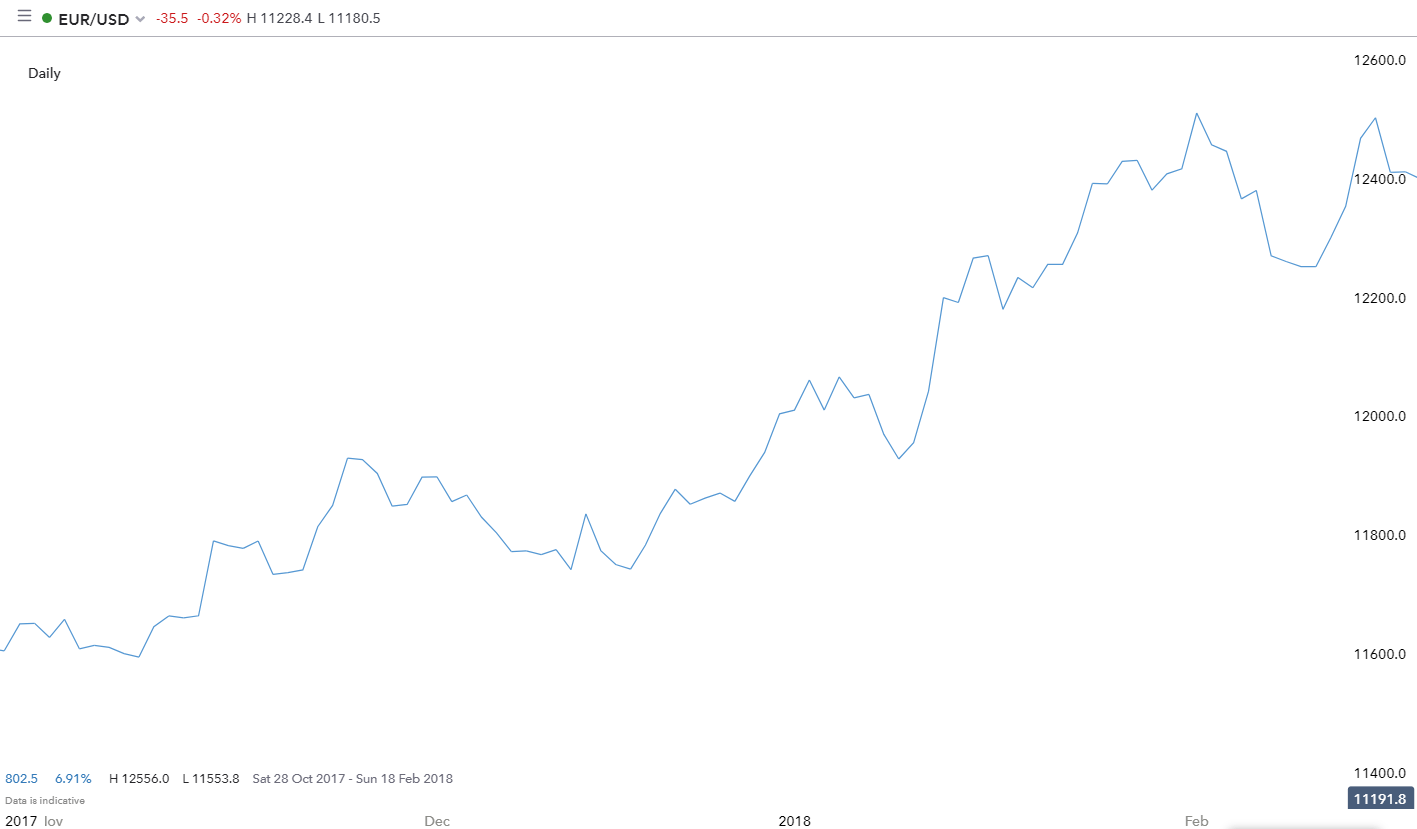
line chart used for technical analysis

  • Best for trading: Stocks
  • Trading experience: Beginner
  • Technical analysis technique: Holistic market overview which eliminates shifting data
  • Advantages: Supports trading without the influence of emotions

A line chart typically displays closing prices and nothing else. Each closing price is linked to the previous closing price to make a continuous line that is easy to follow.

This type of chart is often used for television, newspapers and many web articles because it is simple and easy to digest. It provides less information than candlestick or bar charts but it is better for viewing at a glance for a simplistic market view.

Another advantage of the line chart is that it can assist in managing the emotions of trading by selecting a neutral colour, like the blue chart depicted above. This is because the line chart eliminates ‘choppy’ movements in different colours as seen in the bar and candlestick charts.

Expert tip: Due to the line chart illustrating only closed prices, more experienced traders will consider a line chart to map out the daily closing prices or for situations when the analyst wants to inspect the sub-waves without the noise.

Bar (HLOC) Charts

bar (HLOC) chart

  • Best for trading: Forex, stocks, indices and commodities
  • Trading experience: Intermediate
  • Technical analysis technique: Use price data (HLOC) to identify trends, support/resistance and entry points
  • Advantages: Provides the trader with more detail which helps to identify key levels and in-depth data

A bar chart displays the high, low, open and closing (HLOC) prices for each period designated for the bar. The vertical line is created by the high and low price for the bar. The dash to the left of the bar was the opening price and the dash to the right signals the closing price.

Being able to identify whether a bar closes up (green) or down (red), indicates to the trader the market sentiment (bullish/bearish) for that period.

The similarities between this chart type and a candlestick chart are visible when they are viewed side by side, but a bar chart is better for a cleaner market view. By removing the bolded colour from the chart, traders can view market trends with an uncomplicated outlook.

Candlestick Charts

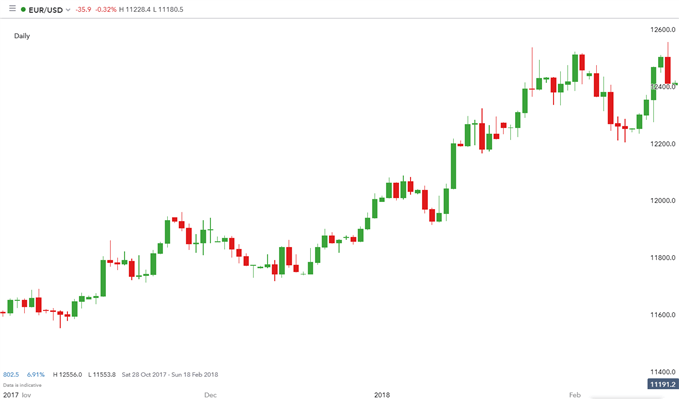
candlestick chart

  • Best for trading: Forex, stocks, indices and commodities
  • Trading experience: Intermediate
  • Technical analysis technique: Equivalent to the bar chart technique (dependant on trader preference)
  • Advantages: Candlesticks are easier on the eye for traders as opposed to bar charts, due to the fuller nature of the candlestick

A candlestick chart displays the high, low, open and closing (HLOC) prices for each period designated for the candle. The “body” of each candlestick represents the opening and closing prices while the candle “wicks” display the high and low prices for each period.

The colour of each candle depends on the applied settings, but most charting packages will use green and red as the default colours. The green candles reflect that price closed higher than where it opened (often called a bullish candle), and every candle that is red means the price closed lower than where it opened (often called a bearish candle).

The candlestick chart is by far the most popular type of chart used in forex technical analysis as it provides the trader with more information while remaining easy to view at a glance.

Engulfing Candle Patterns & How to Trade Them

Engulfing Candle Patterns & How to Trade Them

Engulfing patterns in the forex market provide a useful way for traders to enter the market in anticipation of a possible reversal in the trend. This article explains what the engulfing candle pattern is, the trading environment that gives rise to the pattern, and how to trade engulfing candlesticks in forex.

Keep reading for information on:

  • What is an engulfing candlestick and how do they signal a reversal of current trends in the market?
  • There are two engulfing patterns to look out for: bullish engulfing and bearish engulfing patterns.
  • Engulfing candle trading strategies

What is an Engulfing Candlestick?

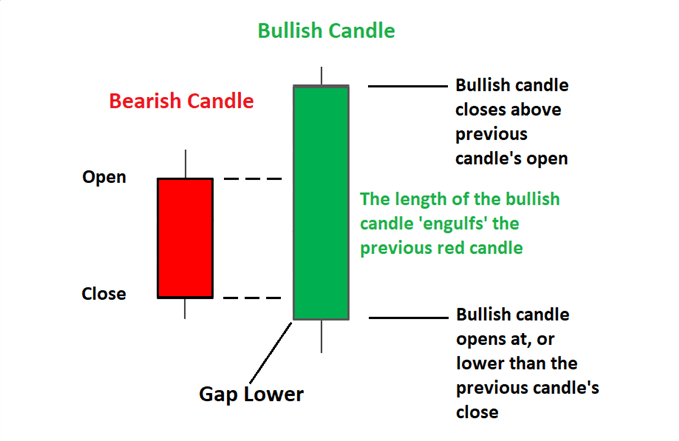
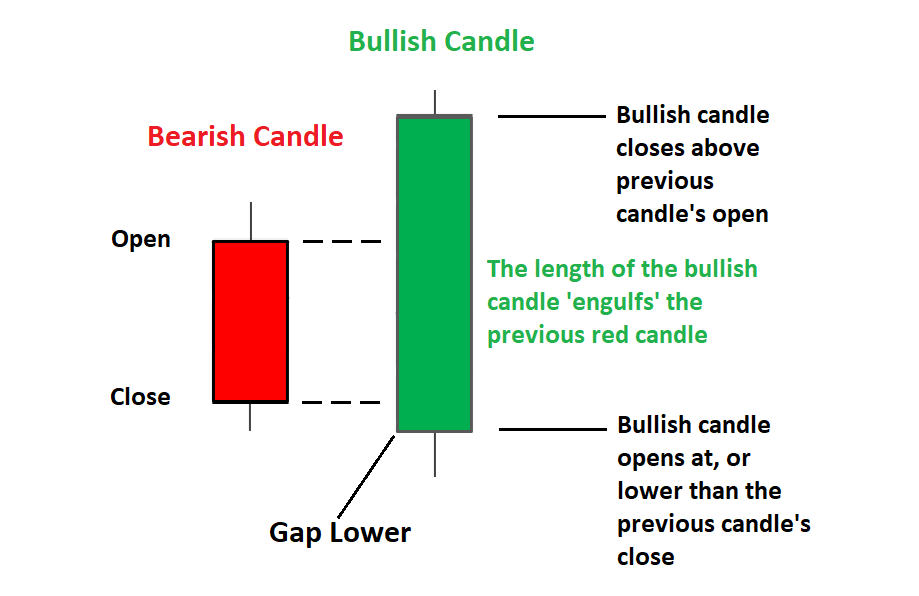
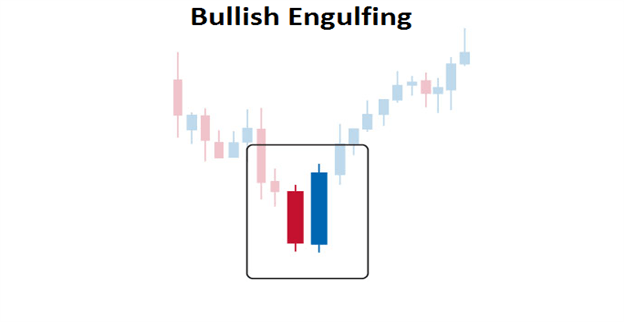
Engulfing candles tend to signal a reversal of the current trend in the market. This specific pattern involves two candles with the latter candle ‘engulfing’ the entire body of the candle before it. The engulfing candle can be bullish or bearish depending on where it forms in relation to the existing trend. The image below presents the bullish engulfing candle.

bullish engulfing candle at the bottom of a downtrend in forex suggests potential reversal

Types of Forex Engulfing Patterns

There are two engulfing candle patterns: bullish engulfing pattern and the bearish engulfing candle.

1) Bullish engulfing pattern

The bullish engulfing candle provides the strongest signal when appearing at the bottom of a downtrend and indicates a surge in buying pressure. The bullish engulfing pattern often triggers a reversal of an existing trend as more buyers enter the market and drive prices up further. The pattern involves two candles with the second candle completely engulfing the ‘body’ of the previous red candle.

Interpretation: Price action must show a clear downtrend when the bullish pattern appears. The large bullish candle shows that buyers are piling into the market aggressively and this provides the initial bias for further upward momentum. Traders will then look for confirmation that the trend is indeed turning around by making use of indicators, key levels of support and resistance and subsequent price action after the engulfing pattern.

bullish engulfing pattern appearing at the bottom of a downtrend

2) Bearish engulfing pattern

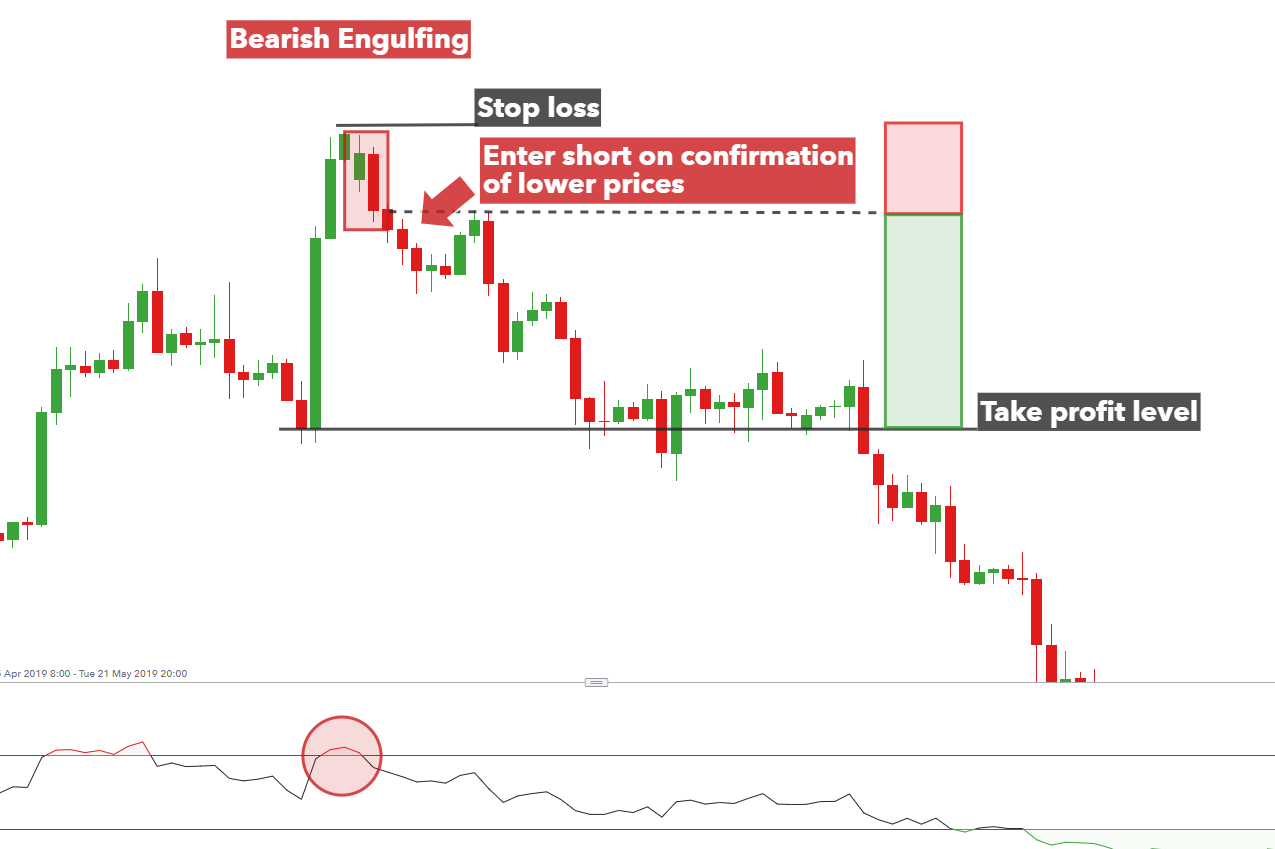
The bearish engulfing pattern is simply the opposite of the bullish pattern. It provides the strongest signal when appearing at the top of an uptrend and indicates a surge in selling pressure. The bearish engulfing candle often triggers a reversal of an existing trend as more sellers enter the market and drive prices down further. The pattern involves two candles with the second candle completely engulfing the ‘body’ of the previous green candle.

Interpretation: Price action must show a clear uptrend when the bearish pattern appears. The large bearish candle shows that sellers are piling into the market aggressively and this provides the initial bias for further downward momentum. Traders will then look for confirmation that the trend is indeed turning around by making use of indicators, levels of support and resistance, and subsequent price action that occurs after the engulfing pattern.

Bearish engulfing pattern appearing near the top of an uptrend

Why are Engulfing Candles Important for Traders?

Engulfing candles assist traders to spot reversals, indicate a strengthening trend, and assist traders with an exit signal:

  1. Reversals: Spotting reversals are self-explanatory – it allows the trader to enter a trade at the best possible level and ride the trend to completion.
  2. Trend continuation: Traders can look to the engulfing pattern to support the continuation of the existing trend, for example, spotting a bullish engulfing pattern during an uptrend provides more conviction that the trend will continue.
  3. Exit strategy: The pattern can also be used as a signal to exit an existing trade if the trader holds a position in the existing trend which is coming to an end.

A limitation of the engulfing candle can arise when the pattern turns out to be more of a retracement than a definite change in direction, but traders can look for subsequent price action to reduce the likelihood of this undesirable outcome.

Engulfing Candle Trading Strategies

Using the Engulfing Candle Reversal Strategy

Traders can look to trade the bearish engulfing pattern by waiting for confirmation of the move by observing subsequent price action or to wait for a pullback before initiating a trade.

See below for guidance on how to trade the engulfing candlestick pattern observed on the GBP/USD four-hour chart.

GBPUSD 4 hour chart showing how to trade the bearish engulfing candle pattern

  1. Entry: Look for a successful close below the low of the bearish engulfing candle. Alternatively, traders can look for a momentary retracement (towards the dotted line) before entering a short trade.
  2. Stop: Stops can be placed above the swing high where the bearish engulfing pattern occurs.
  3. Target / take profit level: The target can set at a previous level of support while ensuring a positive risk to reward ratio. The risk to reward ratio is depicted by the green and red rectangles.

Using the Engulfing Candle When Trend Trading

Engulfing candles don’t always have to appear at the end of a trend. When viewed within a strong trend, traders can glean information from the candle pattern pointing towards continued momentum in the direction of the existing trend.

For example, the below chart shows a strong uptrend in the S&P 500 with the appearance of multiple engulfing patterns (in the direction of the trend) adding more conviction to long trades. Traders can enter a long trade after observing a close above the bullish candle.

Furthermore, this example includes the presence of a bearish engulfing pattern (red rectangle) that appeared at the top of the trend, signaling a potential reversal. However, subsequent price action did not validate this move as successive candles failed to close below the low of the bearish engulfing candle and the market continued higher – thus underscoring the importance of validating the pattern.

bullish engulfing candles adding to the upward bias

How to Read a Candlestick Chart

How to Read a Candlestick Chart

What is a candlestick chart?

A candlestick chart is simply a chart composed of individual candles, which traders use to understand price action. Candlestick price action involves pinpointing where the price opened for a period, where the price closed for a period, as well as the price highs and lows for a specific period.

Price action can give traders of all financial markets clues to trend and reversals. For example, groups of candlesticks can form patterns which occur throughout forex charts that could indicate reversals or continuation of trends. Candlesticks can also form individual formations which could indicate buy or sell entries in the market.

The period that each candle depicts depends on the time-frame chosen by the trader. A popular time-frame is the daily time-frame, so the candle will depict the open, close, and high and low for the day. The different components of a candle can help you forecast where the price might go, for instance if a candle closes far below its open it may indicate further price declines.

Boost your chart patterns expertise with our interactive quiz!

Our Forex Trading Patterns Quiz will test your knowledge of some of the most important trading patterns. Take the test today by clicking on the link and raise your technical analysis game!

Interpreting a candle on a candlestick chart

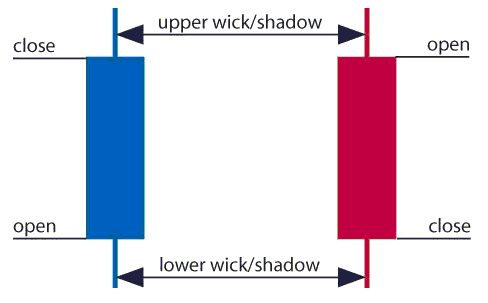
The image below represents the design of a typical candlestick. There are three specific points (open, close, wicks) used in the creation of a price candle. The first points to consider are the candles’ open and close prices. These points identify where the price of an asset begins and concludes for a selected period and will construct the body of a candle. Each candle depicts the price movement for a certain period that you choose when you look at the chart. If you are looking at a daily chart each individual candle will display the open, close, upper and lower wick of that day.

A red and a blue candlestick with open and close wicks

Open price:

The open price depicts the first price traded during the formation of the new candle. If the price starts to trend upwards the candle will turn green/blue (colors vary depending on chart settings). If the price declines the candle will turn red.

High Price:

The top of the upper wick/shadow indicates the highest price traded during the period. If there is no upper wick/shadow it means that the open price or the close price was the highest price traded.

Low Price:

The lowest price traded is the either the price at the bottom of the lower wick/shadow and if there is no lower wick/shadow then the lowest price traded is the same as the close price or open price in a bullish candle.

Close Price:

The close price is the last price traded during the period of the candle formation. If the close price is below the open price the candle will turn red as a default in most charting packages. If the close price is above the open price the candle will be green/blue (also depends on the chart settings).

The Wick:

The next important element of a candlestick is the wick, which is also referred to as a ‘shadow’. These points are vital as they show the extremes in price for a specific charting period. The wicks are quickly identifiable as they are visually thinner than the body of the candlestick. This is where the strength of candlesticks becomes apparent. Candlesticks can help traders keep our eye on market momentum and away from the static of price extremes.

Direction:

The direction of the price is indicated by the color of the candlestick. If the price of the candle is closing above the opening price of the candle, then the price is moving upwards and the candle would be green (the color of the candle depends on the chart settings). If the candle is red, then the price closed below the open.

Range:

The difference between the highest and lowest price of a candle is its range. You can calculate this by taking the price at the top of the upper wick and subtracting it from the price at the bottom of the lower wick. (Range = highest point – lowest point).

Having this knowledge of a candle, and what the points indicate, means traders using a candlestick chart have a clear advantage when it comes to distinguishing trendlines, price patterns and Elliot waves.

Bar Chart vs Candlestick Chart

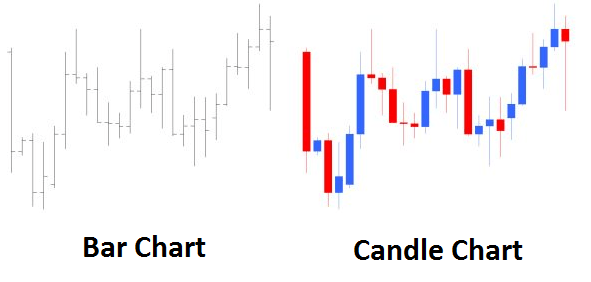
As you can see from the image below, candlestick charts offer a distinct advantage over bar charts. Bar charts are not as visual as candle charts and nor are the candle formations or price patterns. Also, the bars on the bar chart make it difficult to visualize which direction the price moved.

Difference between bar chart and candle chart

How to read a candlestick chart

There are various ways to use and read a candlestick chart. Candlestick chart analysis depends on your preferred trading strategy and time-frame. Some strategies attempt to take advantage of candle formations while others attempt to recognize price patterns.

Interpreting single candle formations

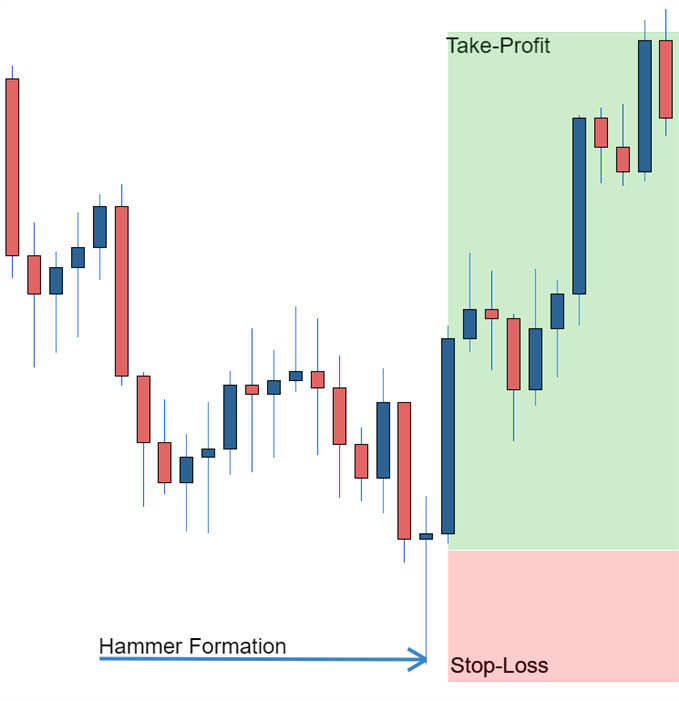
Individual candlesticks can offer a lot of insight into current market sentiment. Candlesticks like the Hammer, shooting star, and hanging man, offer clues as to changing momentum and potentially where the market prices maytrend.

As you can see from the image below the Hammer candlestick formation sometimes indicates a reversal in trend. The hammer candle formation has a long lower wick with a small body. Its closing pricing is above its opening price. The intuition behind the hammer formation is simple, price tried to decline but buyers entered the market pushing the price up. It is a bullish signal to enter the market, tighten stop-losses or close out a short position.

Traders can take advantage of hammer formations by executing a long trade once the hammer candle has closed. Hammer candles are advantageous because traders can implement ‘tight’ stop-losses (stop-losses that risk a small amount of pips). Take-profits should be placed in such a way as to ensure a positive risk-reward ratio. So, the take-profit is larger than the stop-loss.

Hammer formation showing stop loss

Candlestick charts help traders recognize price patterns that occur in the charts. By recognizing these price patterns, like the bullish engulfing pattern or triangle patterns you can take advantage of them by using them as entries into or exit signals out the market.

For example, in the image below we have the bullish engulfing price pattern. The bullish engulfing is a combination of a red candle and a blue candle that ‘engulfs’ the entire red candle. It is an indication that it could be the end of a currency pairs established weakness. A trader would take advantage of this by entering a long position after the blue candle closes. Remember, the price pattern only forms once the second candle closes.

As with the hammer formation, a trader would place a stop loss below the bullish engulfing pattern, ensuring a tight stop loss. The trader would then set a take-profit. For more forex candlestick charts check our forex candlesticks guide where we go in depth into the advantages of candlestick charts as well as the strategies that can be implemented using them.

Bullish engulfing pattern

US Dollar Slumps After Inflation Eases Further – Stocks, Gold, and Silver Rally

US Dollar Slumps After Inflation Eases Further – Stocks, Gold, and Silver Rally

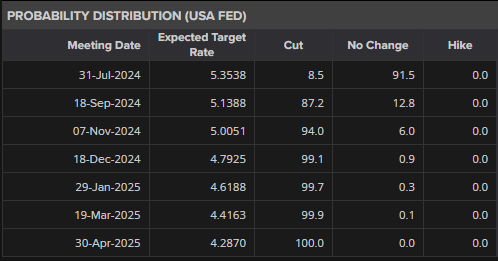
Markets are now showing an 87% chance of a 25 basis point interest rate cut at the September 18th FOMC meeting.

image2.png

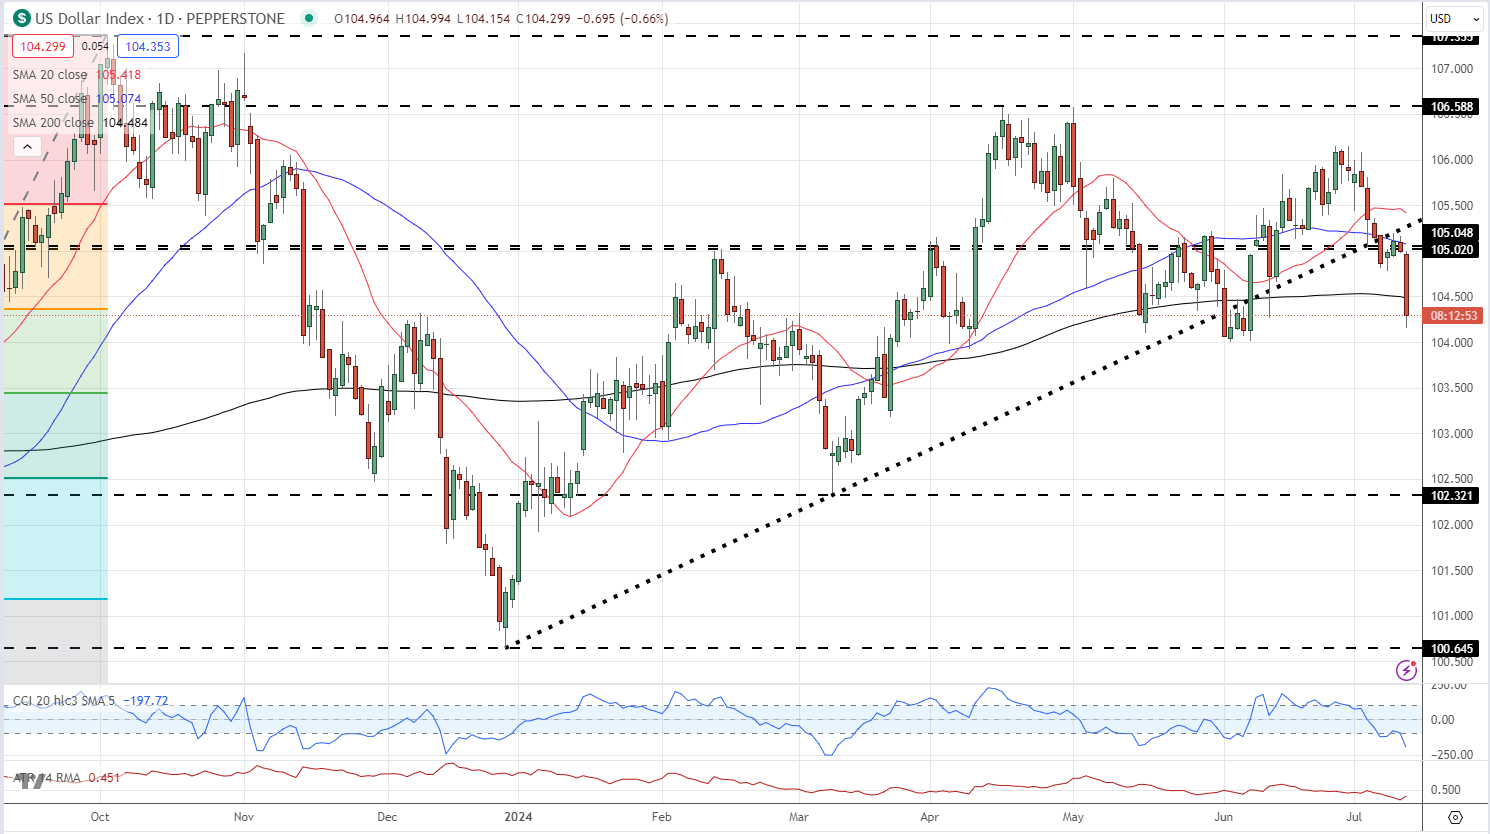
The US dollar index fell around 40 pips on the news and continues to sell off. The DXY is now closing in on the recent low prints around 104.00 made in early June

US Dollar Index Daily Chart

image3.png

US indices have now turned positive pre-open with the Nasdaq 100 and the S&P 500 currently showing gains of 0.3% on the session.

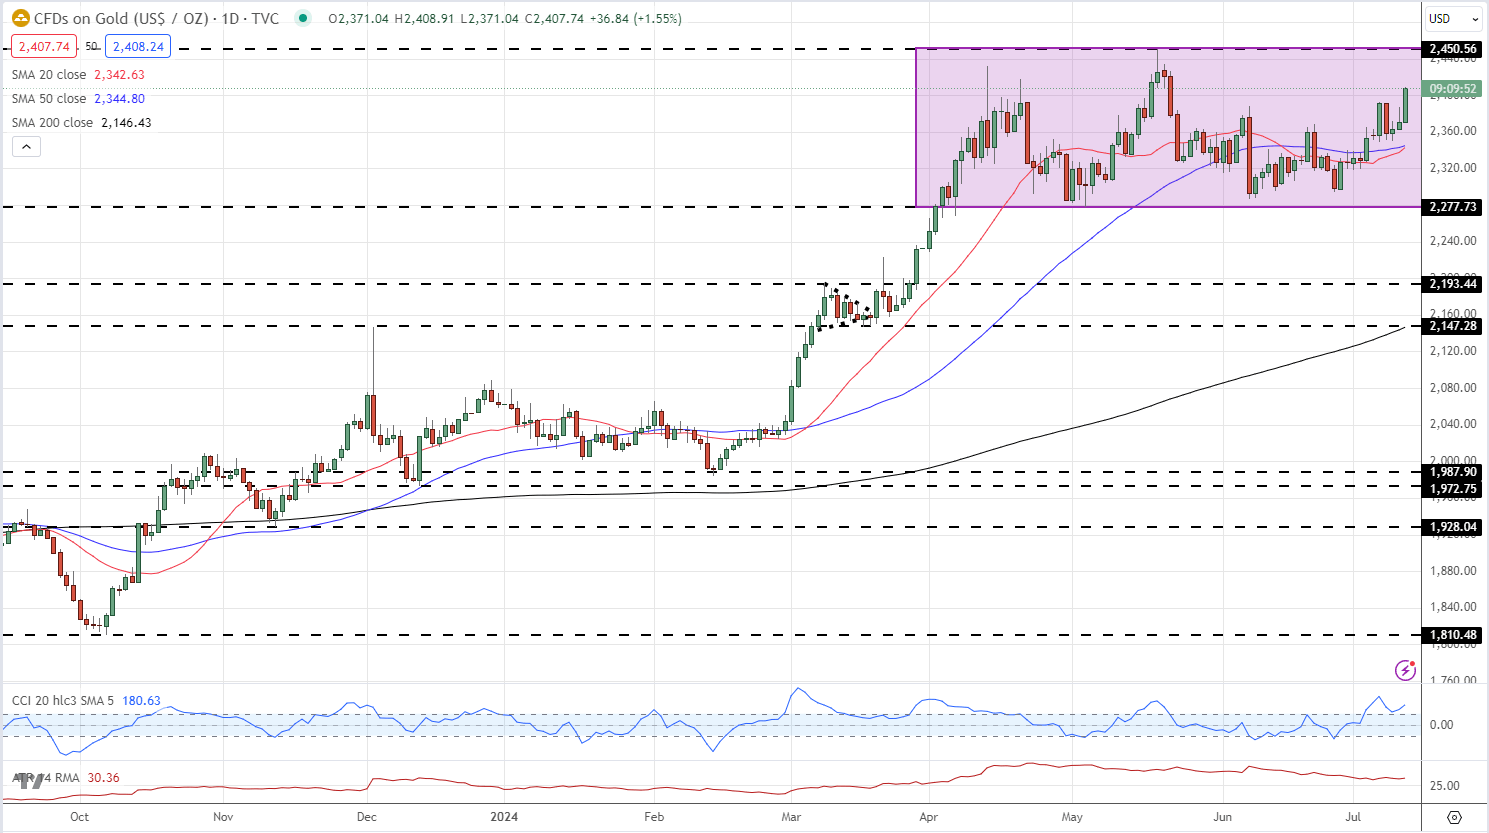
Gold is back above $2,400/oz. for the first time since late May, and there is little resistance left on the daily charts until the recent high at $2,450/oz. comes into play.

Gold Daily Price Chart

image4.png

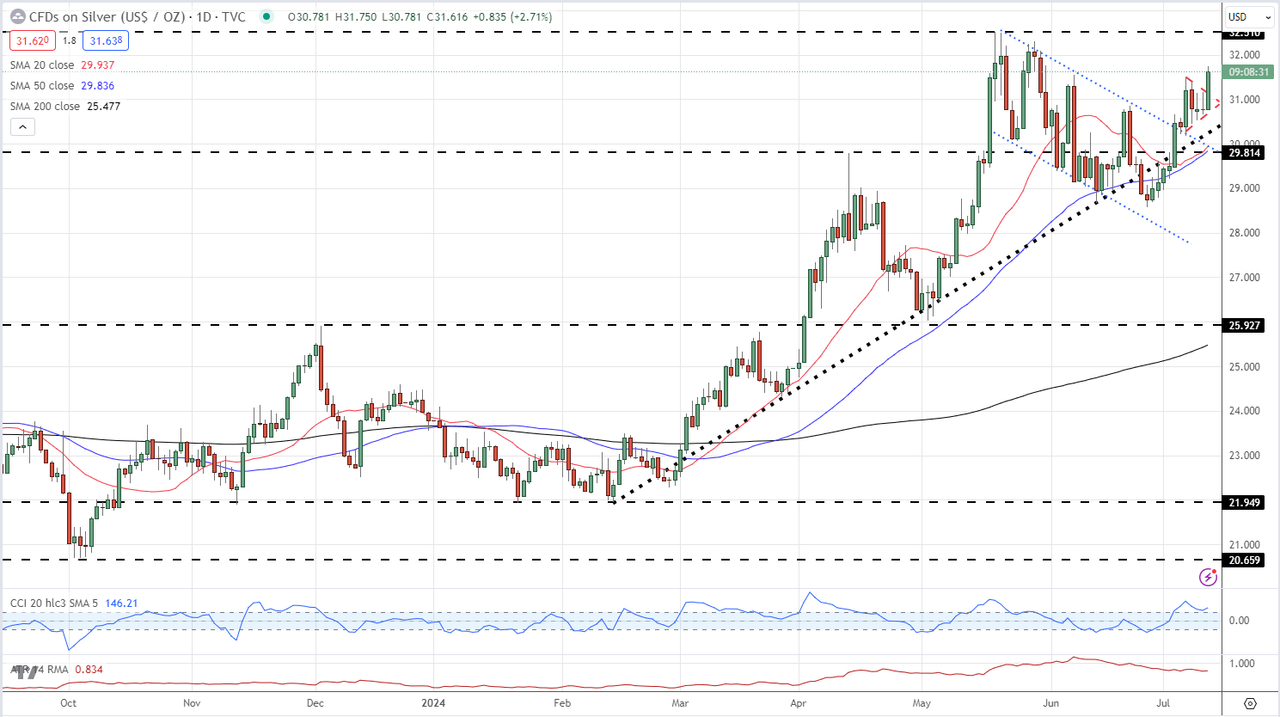
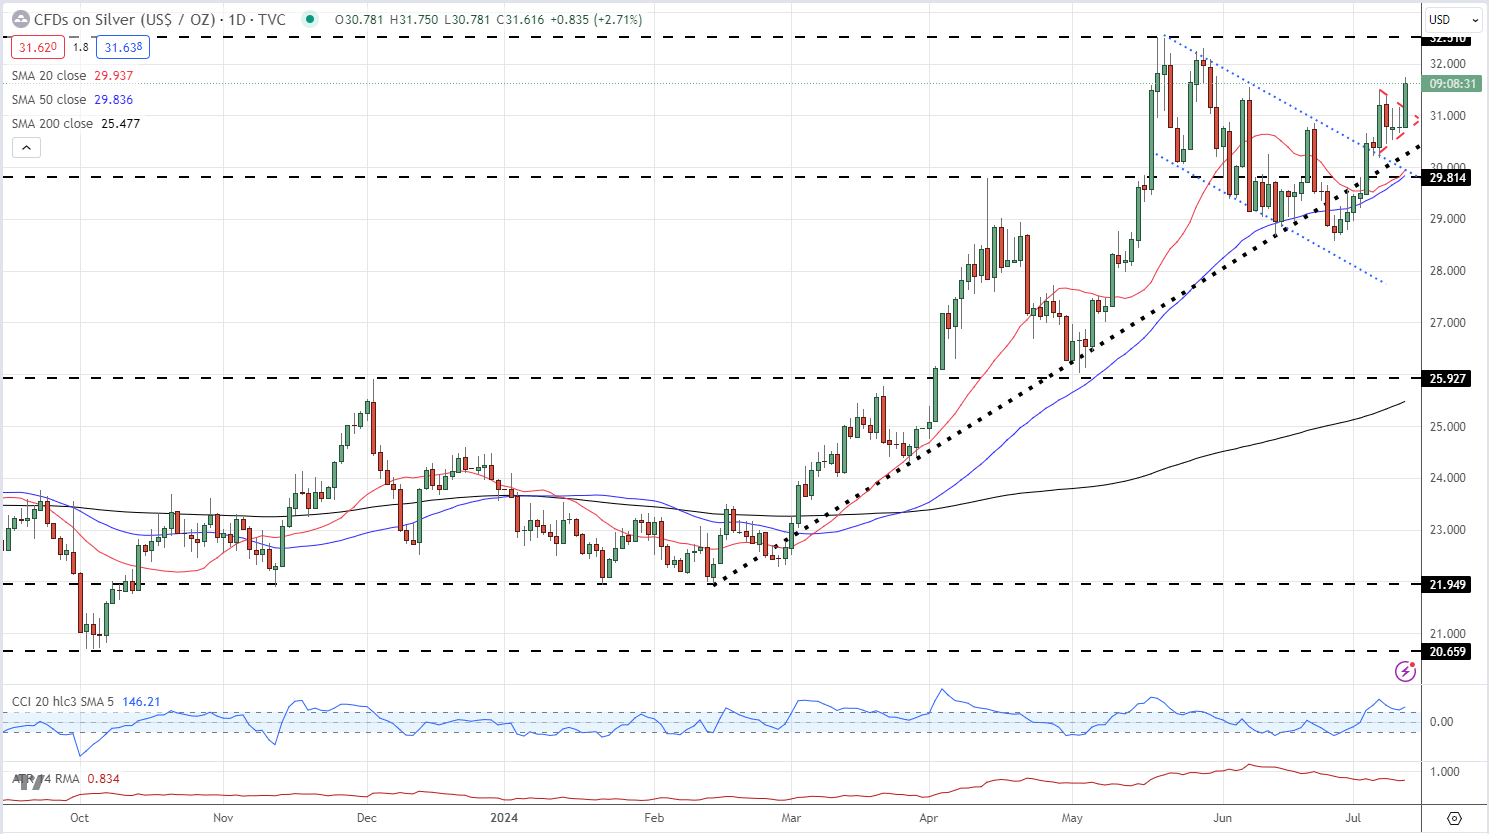
Silver outperforms gold and is over 2.5% higher after the data release. Silver has also broken out of the recent daily pennant pattern, confirming a bullish outlook and a test of $32.50/oz.

Silver Daily Price Chart

image5.png