Using Stop Loss Orders in Forex Trading

Using Stop Loss Orders in Forex Trading

What is a stop loss?

A forex stop loss is a function offered by brokers to limit losses in volatile markets moving in a contrary direction to the initial trade. This function is implemented by setting a stop loss level, a specified amount of pips away from the entry price. A stop loss can be attached to long or short trades making it a useful tool for any forex trading strategy.

Why is a stop loss order important?

Stops are critical for a multitude of reasons, but it can really be boiled down to one thing: we can never see the future. Regardless of how strong the setup might be, or how much information might be pointing in the same direction – future currency prices are unknown to the market, and each trade is a risk.

In the DailyFX Traits of Successful Traders research, this was a key finding – traders actually do win in many currency pairs the majority of the time. The chart below shows some of the more common pairings.

forex winning percentage

As you can see, traders were successfully winning more than half the time in most of the common pairings, but because their money management was often bad they were still losing money on balance.

Traders lost much more when they were wrong (in red) than they made when they were right (blue)

forex profit and loss

In the article Why do Many Traders Lose Money, David Rodriguez explains that traders can look to address this problem simply by looking for a profit target at least as far away as the stop-loss. That is, if a trader opens a position with a 50 pip stop, look for – as a minimum – a 50 pip profit target.

This way, if a trader wins more than half the time, they stand a good chance at being profitable. If the trader is able to win 51% of their trades, they could potentially begin to generate a net profit – a strong step towards most traders’ goals.

Forex stop loss strategies

Below are five strategies to apply in your forex trading when placing stop loss orders:

1. Setting Static Stops

Traders can set forex stops at a static price with the anticipation of allocating the stop-loss, and not moving or changing the stop until the trade either hits the stop or limit price. The ease of this stop mechanism is its simplicity, and the ability for traders to ensure that they are looking for a minimum one-to-one risk-to-reward ratio.

For example, let’s consider a swing-trader in California that is initiating positions during the Asian session; with the anticipation that volatility during the European or US sessions would be affecting their trades the most.

This trader wants to give their trades enough room to work, without giving up too much equity in the event that they are wrong, so they set a static stop of 50 pips on every position that they trigger. They want to set a profit target at least as large as the stop distance, so every limit order is set for a minimum of 50 pips. If the trader wanted to set a one-to-two risk-to-reward ratio on every entry, they can simply set a static stop at 50 pips, and a static limit at 100 pips for every trade that they initiate.

2. Static Stops based on Indicators

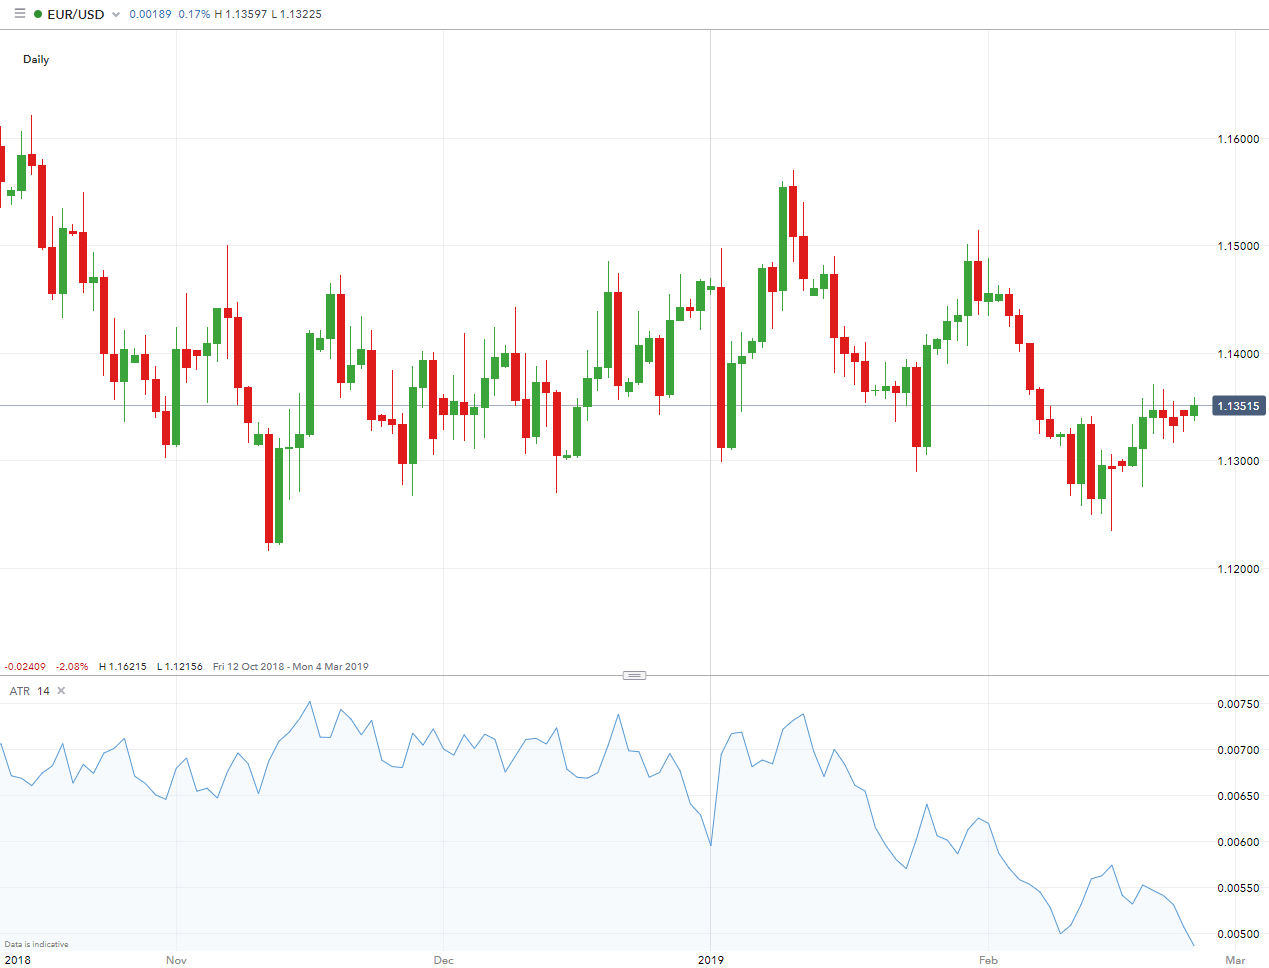
Some traders take static stops a step further, and they base the static stop distance on an indicator such as Average True Range. The primary benefit behind this is that traders are using actual market information to assist in setting that stop.

So, if a trader is setting a static 50 pip stop loss with a static 100 pip limit as in the previous example – what does that 50 pip stop mean in a volatile market, and what does that 50 pip stop mean in a quiet market?

If the market is quiet, 50 pips can be a large move and if the market is volatile, those same 50 pips can be looked at as a small move. Using an indicator like average true range, or pivot points, or price swings can allow traders to use recent market information to more accurately analyze their risk management options.

Average True Range can assist traders in setting stops using recent market information
average true range (ATR) in forex

3. Manual Trailing Stops

For traders that want the upmost control, forex stops can be moved manually by the trader as the position moves in their favor.

The chart below highlights the movement of stops on a short position. As the position moves further in favor of the trade (lower), the trader subsequently moves the stop level lower. When the trend eventually reverses (and new highs are made), the position is then stopped out.

Trader adjusting stops to lower swing-highs in a strong down-trend
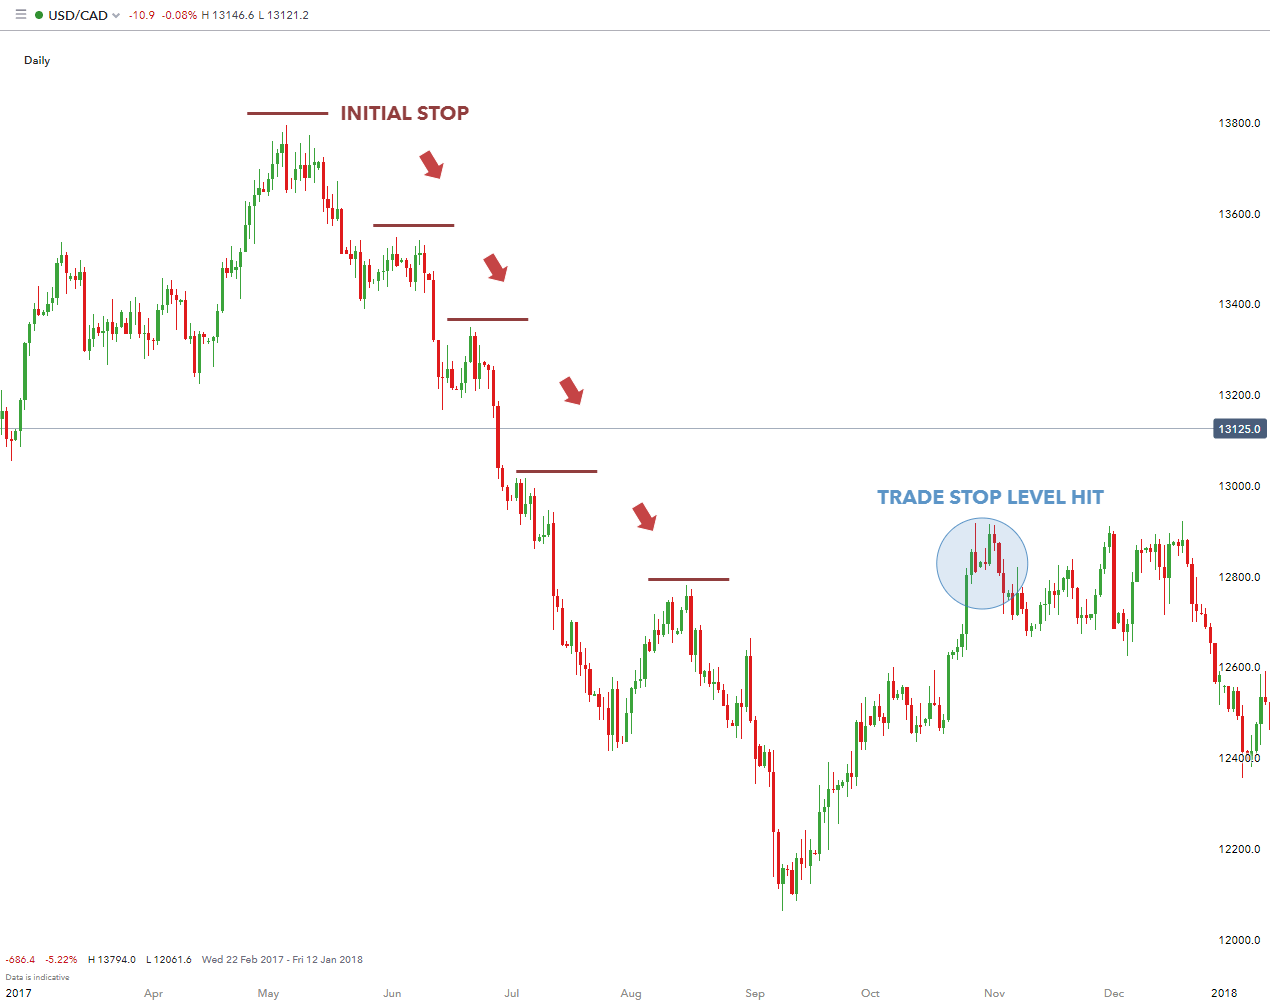
forex stop loss manual stop

Take a look at Trading Trends by Trailing Stops with Price Swings for more information on how to implement the trailing stop.

4. Trailing Stops

It is important to note that some jurisdictions allow brokers to enforce the trailing stop function

Static stop losses can bring vast improvement to a new trader’s approach, but other traders use stops in a different way to further maximize their money management.Trailing stops are stops that will be adjusted as the trade moves in the trader’s favor, in an attempt to further mitigate the downside risk of being incorrect in a trade.

Let’s say, for instance, that a trader took a long position on EUR/USD at 1.1720, with a 167 pip stop at 1.1553. If the trade moves up to 1.1720, the trader may look at adjusting their stop up to 1.1720 from the initial stop value of 1.1553 (see image below).

This does a few things for the trader: It moves the stop to their entry price, also known as ‘break-even’ so that if EUR/USD reverses and moves against the trader, at least they won’t be faced with a loss as the stop is set to their initial entry price.

This break-even stop allows the trader to remove their initial risk in the trade.After which, the trader can look to place that risk in another trade opportunity, or simply keep that risk amount off the table and enjoy a protected position in their long EUR/USD trade.

Break-even stops can assist traders in removing their initial risk from the trade
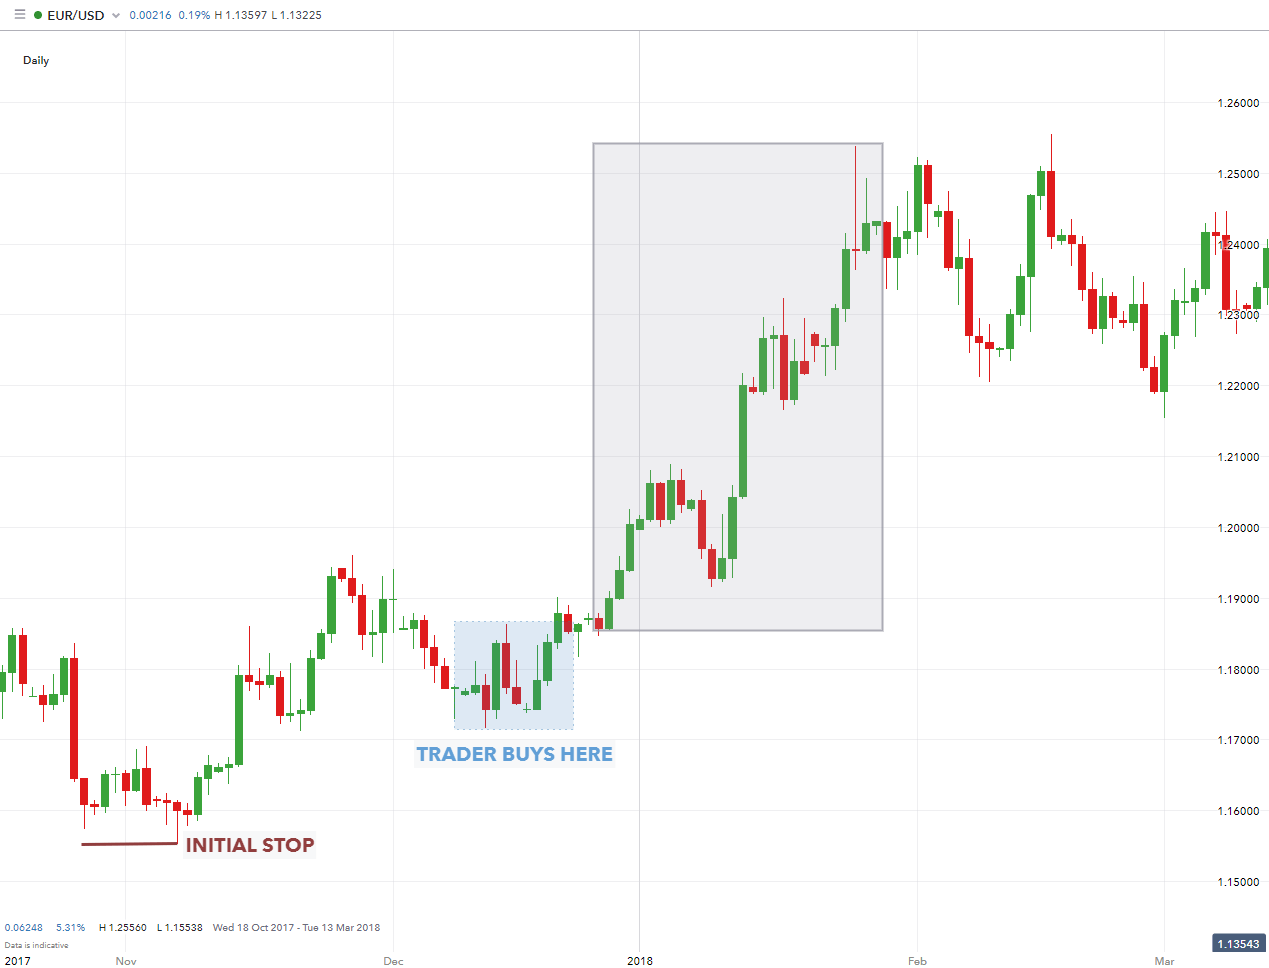
forex stop loss trailing stop

5. Fixed Trailing Stops

Traders can also set trailing stops so that the stop will adjust incrementally. For example, traders can set stops to adjust for every 10 pip movement in their favor.

Using an example of a trader buying EUR/USD at 1.3100 with an initial stop at 1.3050 – after EUR/USD moves up to 1.3110, the stop adjusts up 10 pips to 1.3060. After another 10 pip movement higher on EUR/USD to 1.3120, the stop will once again adjust another 10 pips to 1.3070. This process will continue until such time as the stop level is hit or the trader manually closes the trade.

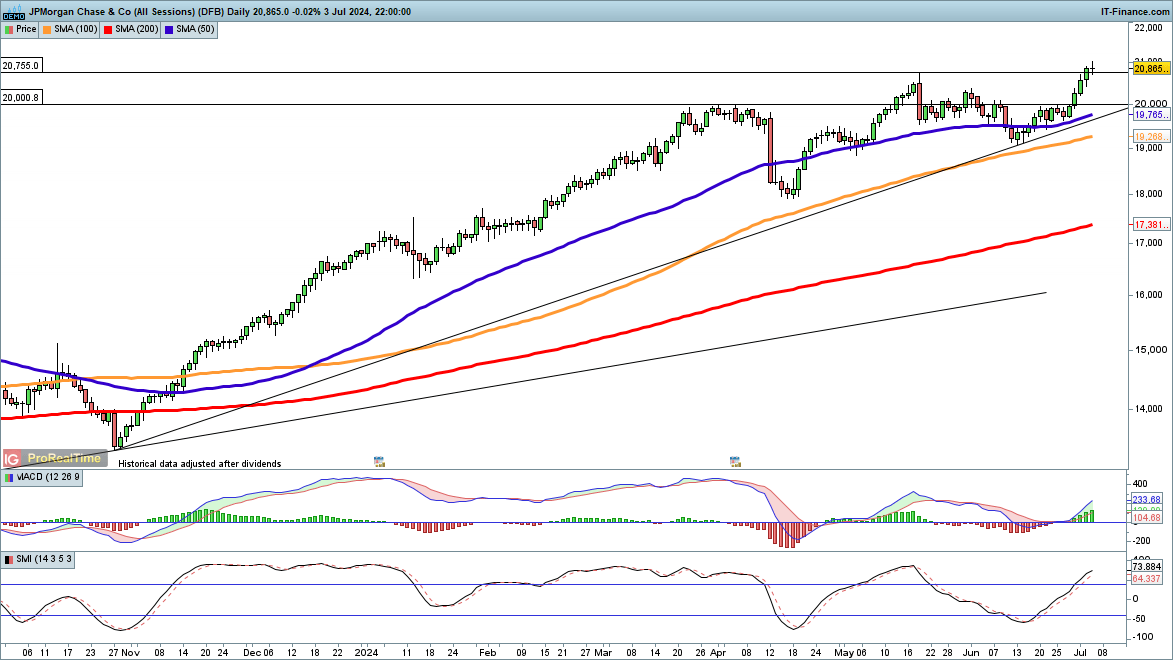
JPMorgan stock price at record high ahead of Q2 earnings

JPMorgan stock price at record high ahead of Q2 earnings

JPMorgan Q2 Analysis and Chart

​​​​JPMorgan is set to release its Q2 2024 earnings on July 12, before the market open. Analysts project earnings of $4.19 per share, a 4.1% decrease from the previous year. Despite this forecast, JPMorgan has consistently beaten EPS estimates in recent quarters. However, the bank previously cautioned about an “uncertain” outlook due to geopolitical issues and inflation. For fiscal 2024, analysts anticipate EPS of $16.44, down 2.1% from 2023.

​Understanding various market scenarios is crucial for identifying opportunities. Market expectations have shifted from a “higher for longer” interest rate environment to anticipating a soft landing where inflation falls towards target and rates are eased. However, the possibility of a recession in the US and Europe remains a concern. Banks are generally well-positioned for all three outcomes, though some scenarios are more favorable than others.

​In a higher-for-longer scenario, banks can sustain higher net interest margins, particularly those with more floating-rate mortgages. US money center banks are likely to thrive, while regional banks may face challenges. A soft-landing scenario would challenge net interest margins but improve banks’ alternative income sources.

​Banks can mitigate some risks through interest rate hedges, and lower rates might ease political pressures and windfall taxes imposed on banks in some European countries.

​A recession would be the most challenging scenario for banks, as they often act as proxies for the broader macroeconomic environment. Investor focus would shift to asset quality and potential loan losses, with US regional banks and the Chinese small to medium enterprise sector facing increased scrutiny.

​Stock Performance

​JPM stock has outperformed both the S&P 500 and the Financial Sector SPDR year-to-date, rising 18.9%. However, shares dropped 4% on May 20 after CEO Jamie Dimon announced limited stock repurchases at current prices. The stock also fell 6% following Q1 results, despite beating revenue and EPS estimates, due to lower-than-expected net interest income and full-year forecasts.

​Analyst Outlook

​Analysts maintain a “Strong Buy” rating on JPM, with 17 out of 24 analysts recommending a “Strong Buy.” The average price target of $205.25 suggests modest upside potential.

​JPMorgan Stock Price – Technical Analysis

​JPMorgan has had an impressive run since October, rallying 57% and hitting a new record high in trading on 3 July.​The price recently surpassed its May record high of $207.55, and has recorded higher highs and higher lows over the year so far. It remains above the 50-day simple moving average (SMA), while the 50-, 100- and 200-day SMAs are all pointing higher. The short-term view remains bullish, while the price holds above the June low at $190.50.

Japanese Yen (USD/JPY) – Bond Buying, Rate Expectations, and Fed Chair Powell

Japanese Yen (USD/JPY) – Bond Buying, Rate Expectations, and Fed Chair Powell

The Bank of Japan’s most recent summary of market opinions, released earlier today, has highlighted a growing consensus among bond market participants: the need to curtail the central bank’s bond-purchasing program. While the BoJ currently acquires bonds worth about 6 trillion yen each month, market experts are proposing a significant reduction, recommending monthly purchases be downsized to between 2 and 4 trillion yen instead. A reduced bond-buying program would allow Japan interest rates to move higher, aiding the central bank as it looks to start the process of tightening monetary policy.

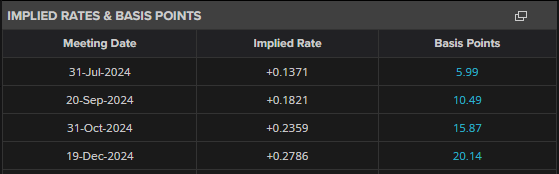
According to the latest money market forecasts, there is around a 60% chance that the BoJ will raise interest rates by 10 basis points at the July 31st meeting. If the BoJ stands pat, then interest rates are fully expected to be hiked at the September 20th meeting with a second rate increase seen on December 19th.

image1.png

USD/JPY is currently treading water just below multi-decade-high levels. While the Japanese Yen remains weak, recent USD/JPY price action has also been driven by the US dollar. The dollar index, DXY, continues to print a pattern of higher lows since the end of last year and press higher, although the recent failure to print a new higher high may temper further upside. Fed chair Jerome Powell is set to testify before Congress today and tomorrow, and lawmakers are likely to quiz Powell on the central bank’s current policy of keeping rates at elevated levels.

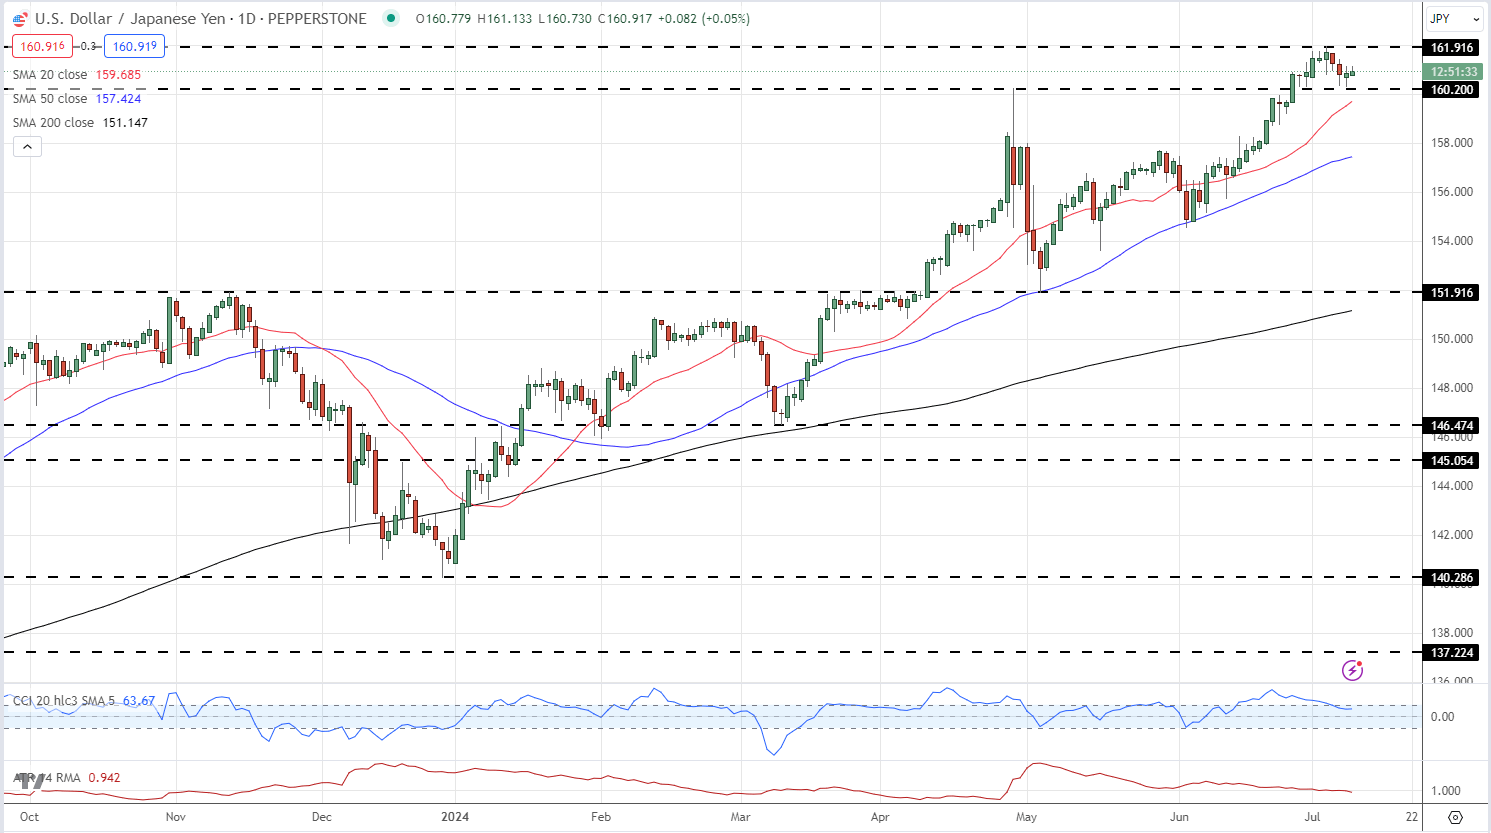
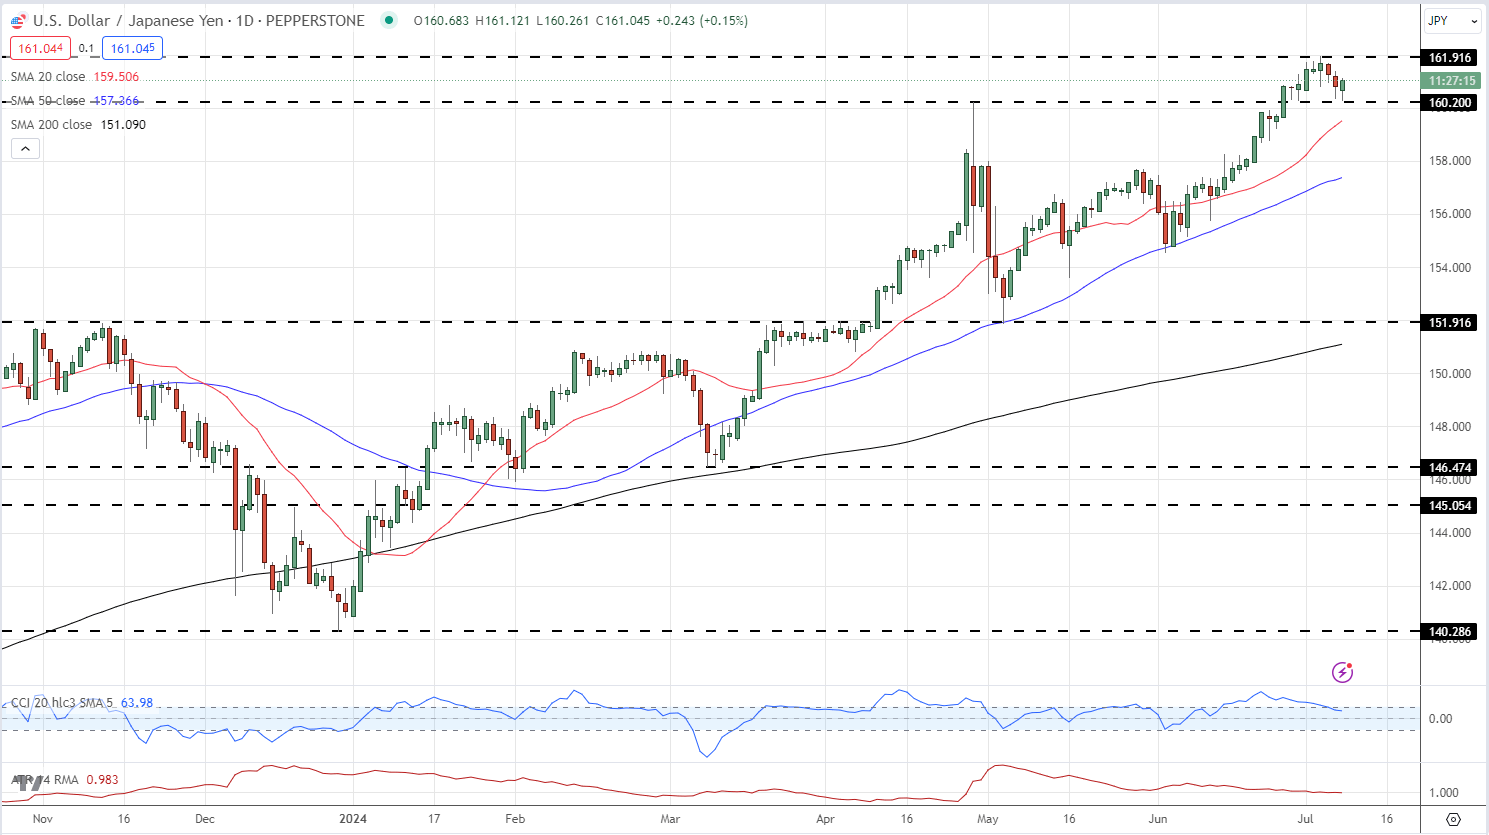
USD/JPY remains capped at just below 162.00 with short-term support seen at 160.20. USD/JPY volatility remains low but traders should remain alert to any official intervention by Japanese authorities if USD/JPY breaks higher.

USD/JPY Daily Price Chart

image2.png

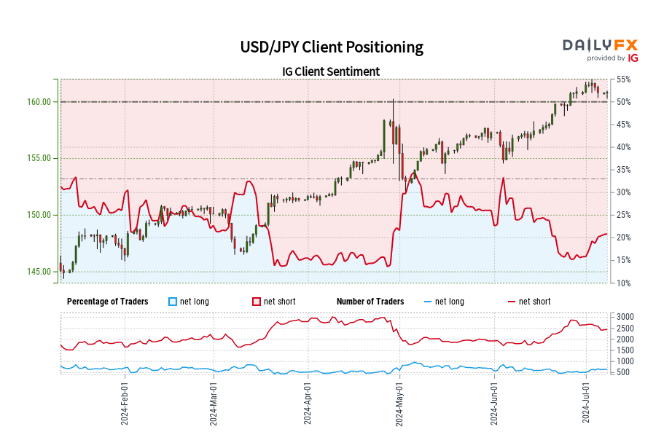
Retail trader data show 21.98% of traders are net-long with the ratio of traders short to long at 3.55 to 1.The number of traders net-long is 10.10% higher than yesterday and 18.24% higher than last week, while the number of traders net-short is 0.08% lower than yesterday and 9.90% lower than last week.

We typically take a contrarian view to crowd sentiment, and the fact traders are net-short suggests USD/JPY prices may continue to rise. Yet traders are less net-short than yesterday and compared with last week. Recent changes in sentiment warn that the current USD/JPY price trend may soon reverse lower despite the fact traders remain net-short.

Gold Trading: Three Top Tips for Trading Gold

Gold Trading: Three Top Tips for Trading Gold

Gold Trading Tips

Few markets on Earth have the historical appeal and attraction as Gold. While traders have numerous trading options today, in a number of different currencies or asset classes or geographies, Gold has been a long-standing store of value that’s piqued speculators’ interest for about as long as human beings have traded with each other.

We previously looked at some of the basics around Gold trading in the What is Gold article a little earlier in this sub-module. And we also have a ‘How to Trade Gold’ article on the Gold page of DailyFX. But, in this article, we’re going to get a bit more granular as we investigate Gold Trading Strategies, Tips and Tactics.

Gold Trading Tips

Probably one of the more obvious aspects of Gold, particularly on a longer-term basis, is the cycle sensitivity that will often show around the metal – and this isn’t a new phenomenon. As markets themselves are cyclical animals, Gold often moves to a similar type of tune, although timing may be differentiated from other markets at the time. Looking at Gold prices over the past 45 years, and this becomes a bit more clear. On the below chart, trends and ranges have been identified by blue or grey boxes, and that leads us into tip number one:

Gold Trading Tip #1: Adapt to the Present Condition

The key takeaway here is the importance of adaptation: Because if a trend trader approaches Gold with their typical approach while Gold markets are in a range, there’s high odds they could see unfavorable results. If Gold markets are mean-reverting and range-bound, the trader would likely want to approach the matter with a range-based approach. But, when Gold markets are trending, such as the case from 2001-2011 or 1976-1980, then traders are going to want to utilize trend strategies to adapt to the present condition.

Gold Futures Monthly Chart

Gold Trading Tip #2: Watch the US Dollar

The US Dollar is traded in a number of markets but, in the largest venues, Gold is traded in US Dollars. As a matter of fact, one common equation on CFD platforms presents a quote for Gold prices as ‘XAU/USD.’ The chemical symbol for Gold on the periodic table of elements is ‘AU’ and the denominator in that quote is the US Dollar, highlighting how Gold is being priced in terms of US Dollars.

This also means that, all factors held equal, and if Gold made no move at all but the US Dollar increased in value – the price of Gold could go down. Because in the function above, the value of the denominator, or USD, would increase in value thereby decreasing the value of the function as a whole.

So, there could be a tendency for Gold to display an inverse correlation with the US Dollar. This isn’t all of the time, there are scenarios where both Gold and the Dollar may increase in value although those are somewhat rare, historically speaking.

On the below chart, that correlation is highlighted in the bottom portion of the image. Reads or values above the zero line indicate positive correlation which, again, is somewhat rare but not unheard of. Reads below zero highlight inverse correlation, with a value of -1 highlighting a perfect inverse relationship.

Gold Monthly Price Chart: An Inverse Relationship with the US Dollar

Gold Trading Tip #3: Know Your Time Frames

On the above charts we’re looking at the bigger picture behind Gold prices using the Monthly variety. But these conditions and market changes can take place on shorter-terms, as well, and it’s key for traders to have some type of consistent framework for their analysis so that they can properly implement their strategies in the ways that they want.

As we looked at in the multiple time frames article, traders should analyze markets from more than a single vantage point. The above monthly variety can be helpful to see the bigger picture – but for actually setting up trades and implementing strategies, traders will likely want to look to shorter time frames.

In the above graphic, the blue box on the right side of the chart shows a trend that’s been going for a little over two years now. But, looking at the shorter-term daily chart below to get a more granular look at that two-year-outlay shows that Gold prices were not trending the entire time. As a matter of fact, the same type of trend-range-trend-range relationship presented itself inside of this longer-term trend.

This is again important for traders when setting up strategy because for those that are looking to trade a trend, waiting for the monthly chart to highlight that potential may be too late. On the below chart, that blue box has been expanded so we can take a more granular look at the trend; but this time, I’ve added green boxes around the shorter-term trends and grey boxes around the mean-reverting or range-bound periods.

Gold Daily Price Chart

Gold Trading Strategies

Perhaps more important than the specific strategy that one is using to analyze or set up trades in Gold is the ‘fit’ to that specific market condition. For instance, if we look at the above image and focus on the green boxes, when the short-term trend is moving in the direction of the longer-term trend, traders are going to want to follow the age-old adage of ‘buying low and selling high.’ In the grey portions, however, when prices are ranging, traders want to similarly buy low and sell high but they’re going to want to do that in a slightly different way; closing the entirety of the long position while ‘high’ and then looking at potentially getting short to play the other side of the range.

Right up front – this means that no trader is always going to be ‘right’ because conditions, similar to trends, will change; and its impossible to know that until after the fact. This is where items like trade and risk management come into play, potentially helping to mitigate the downside in those instances where something changes or shifts away from their expectations.

Simplifying Market Behaviors by Assigning ‘Conditions’

With any market, if you think about it, there’s really only a couple of things that prices might do: Trend or not. Either prices are trending in a directional move for some reason, or they’re not trending at all: And the transitory state between mean-reversion and trends are breakouts, which are technically a market condition, itself. So, in that effort of simplification, analysts can break down market conditions into three specific types:

  1. Trend – a directional move is showing and there’s often a fundamental reason for it as traders are bidding higher-highs and higher-lows (or selling lower-lows and lower-highs).
  2. Range/Mean-Reversion – devoid of a driver, prices will often display no trend, which can open the door for range-bound or mean-reversion strategies.
  3. Breakouts – this is what happens when new information gets priced-in, and this can create a breakout move from a range and into a new trend. That new trend may last for a while or it may merely propel price action into a new range.

Bespoke Approach for the Proper Condition

Knowing what state a market is in isn’t enough, as traders are usually going to want to cater their approach to that specific condition. For instance, a trader focusing on breakouts likely won’t be able to withstand as much excursion as a trader picking on range/mean reversion setups.

At DailyFX, we help traders learn more about strategies for each of these conditions. But, perhaps the most important aspect of customizing a strategy to a specific traders’ needs is the risk management component, which is explored in-depth our Traits of Successful Traders research series, which is available completely free-of-charge and can be accessed by clicking on the link below:

USD/JPY and GBP/JPY – Latest Sentiment Analysis and Charts

USD/JPY and GBP/JPY – Latest Sentiment Analysis and Charts

USD/JPY: Mixed Trading Bias

image1.png

Recent retail trader data indicates 20.37% of traders hold net-long positions, with a short-to-long ratio of 3.91 to 1. Net-long traders decreased by 1.11% daily but increased by 15.77% weekly. Conversely, net-short traders increased by 0.29% daily but decreased by 9.29% weekly.

Our contrarian approach to market sentiment suggests potential USD/JPY price increases, given the predominantly short positions. However, the mixed short-term changes in positioning yield an unclear USD/JPY trading outlook.

USD/JPY Daily Price Chart

image2.png

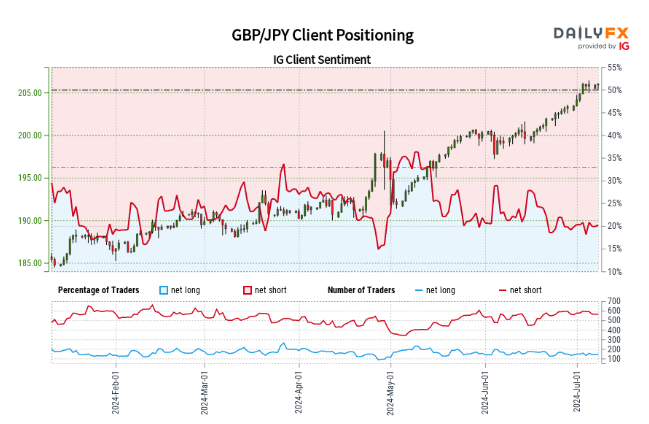
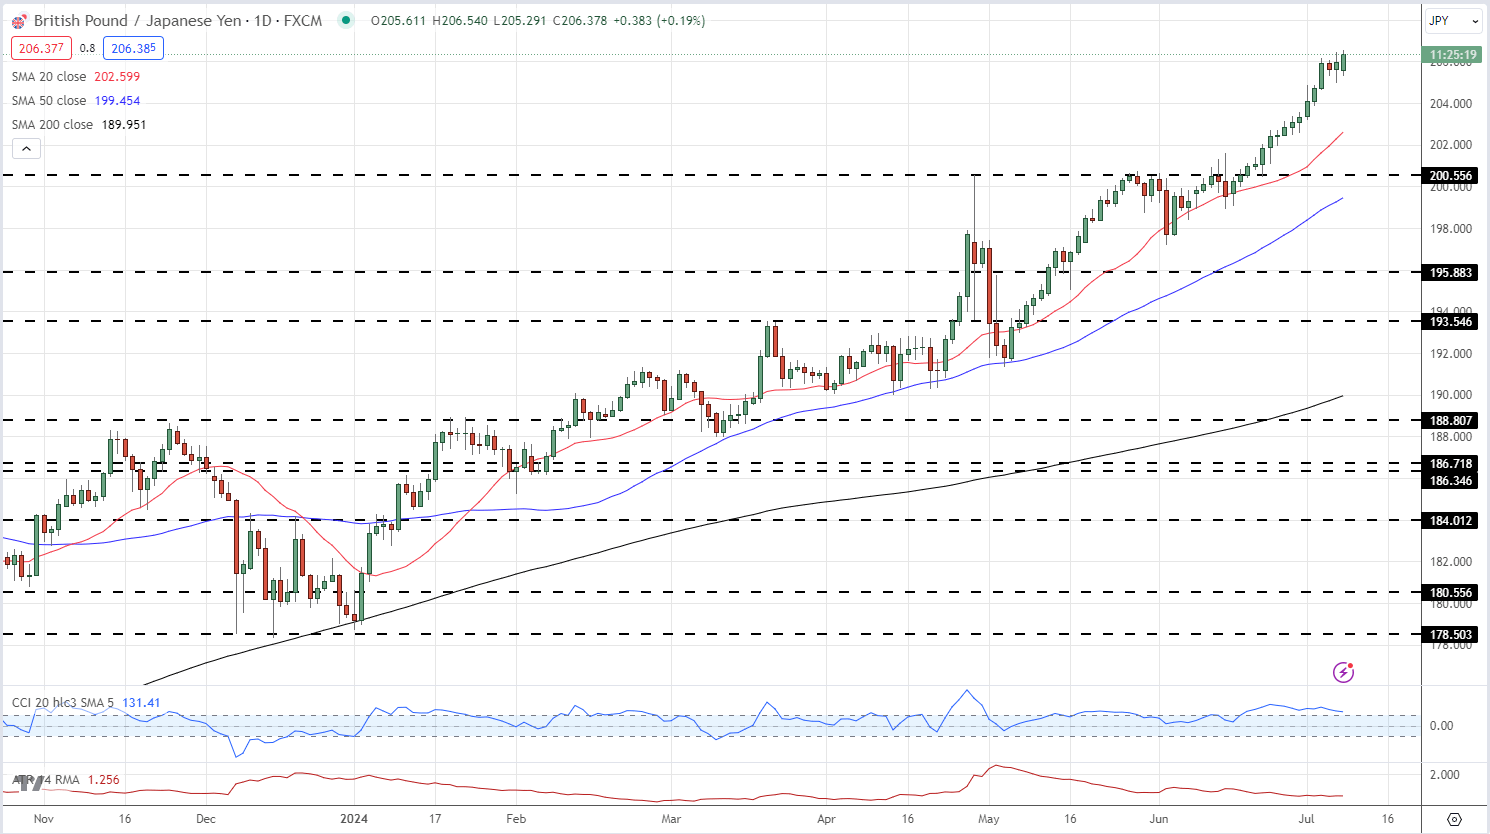
GBP/JPY: Lower Prices Ahead?

image3.png

Current retail trader data indicates 22.95% net-long positions, with a short-to-long ratio of 3.36 to 1. Net-long traders increased by 15.86% daily and 28.24% weekly. Net-short traders rose 0.53% daily but decreased 4.57% weekly.

Our contrarian approach to market sentiment suggests potential GBP/JPY price increases, given the predominantly short positions. However, the reduction in net-short positions over both daily and weekly timeframes signals a possible downward price reversal.

image4.png


Gold (XAU/USD) Slips After the PBoC Step Back from Buying for the Second Month

Gold (XAU/USD) Slips After the PBoC Step Back from Buying for the Second Month

Gold prices are under slight pressure as China’s central bank – the People’s Bank of China (PBoC) – holds off on purchases for the second straight month. This absence of a significant buyer – the PBoC have been a constant buyer of gold over the last 18 months – leaves the precious metal susceptible to profit-taking after last week’s NFP-inspired rally. The precious metal traded at a six-week high last Friday at just under $2,400/oz. but has drifted lower today after the weekend news.

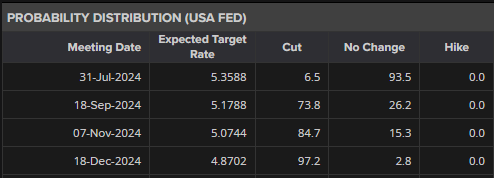
US interest rate cut expectations nudged higher at the end of last week after the latest US Jobs Report suggested a hiring slowdown. While the headline NFP number was slightly higher than expected, the prior month’s revisions, and the increase in the jobless rate to 4.1%, more than outweighed the headline beat. There is now a 74% probability of a 25bp cut at the September 18th FOMC meeting with a further quarter-point cut priced in by the end of the year.

US Dollar Unchanged on Mixed US NFPs, Gold Grabs a Small Bid

image1.png

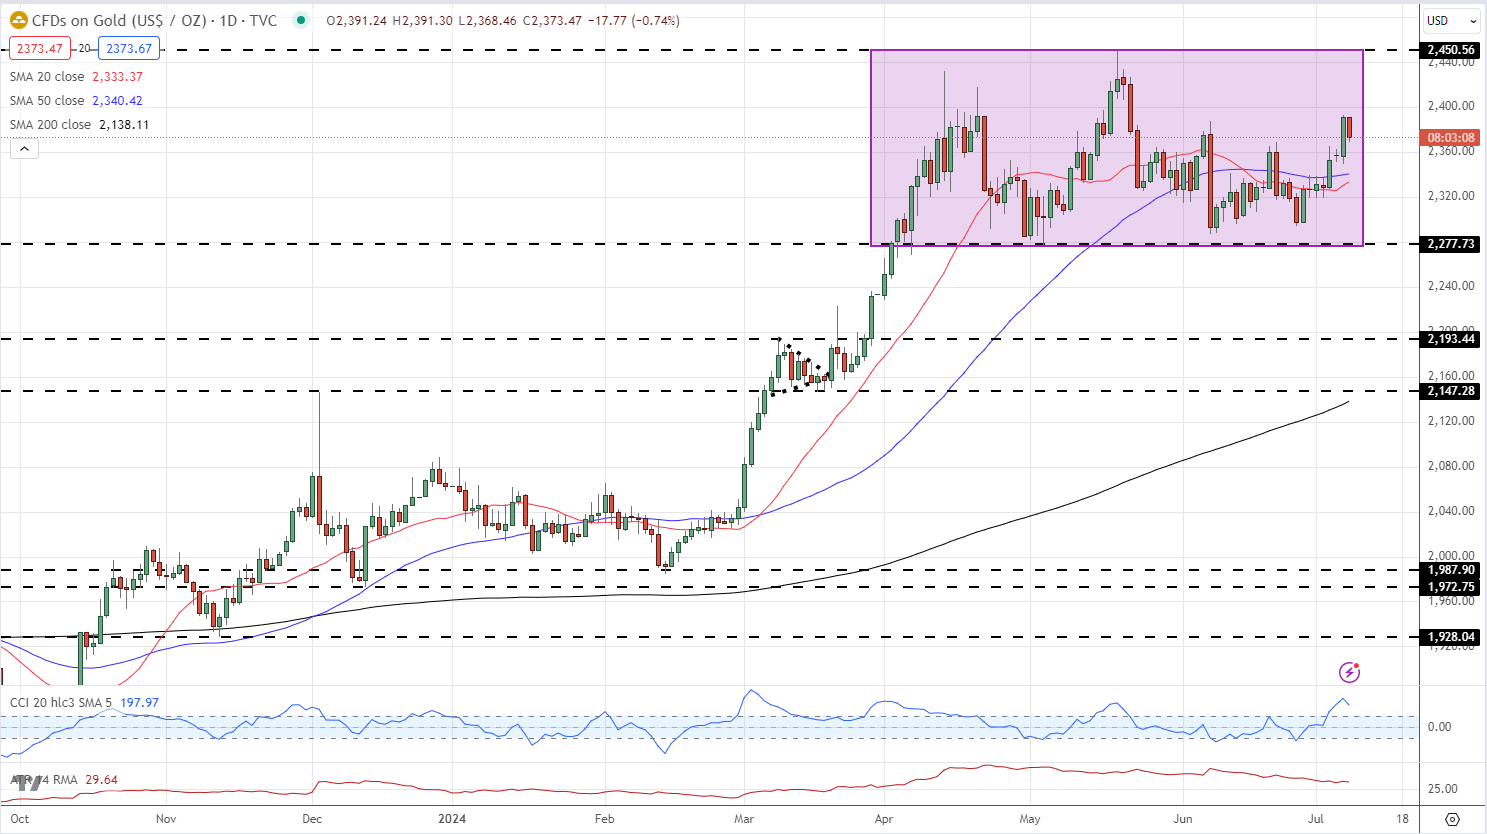
Gold remains rangebound and is currently sitting in the middle of a multi-month range. The 20- and 50-day simple moving averages remain supportive, while a clean break above $2,287/oz. would leave range resistance at $2,450/oz. under threat. A break below the two moving averages would leave $2,320/oz. as the next level of interest.

Gold Daily Price Chart

image2.png

Retail trader data shows 51.73% of traders are net-long with the ratio of traders long to short at 1.07 to 1.The number of traders net-long is 7.45% higher than yesterday and 14.76% lower than last week, while the number of traders net-short is 2.83% higher than yesterday and 17.61% higher than last week.

We typically take a contrarian view to crowd sentiment, and the fact traders are net-long suggests Gold prices may continue to fall. Positioning is more net-long than yesterday but less net-long from last week. The combination of current sentiment and recent changes gives us a further mixed Gold trading bias.


British Pound, FTSE Steady After Labour Landslide, US NFPs Now Key

British Pound, FTSE Steady After Labour Landslide, US NFPs Now Key

The Labour Party will be handed the keys to No.10 Downing Street later this morning after winning the UK general election by a record margin. With only a handful of seats still to be declared, Labour has already won 410 of the 650 seats available, over 200 more than at the last election in 2019. The incumbent Conservative party are currently polling just 119 seats, down 248 seats from the previous election. While Labour was expected to win the election by a large margin, the Conservative rout, including the loss of many of the parties ‘big hitters’ is seen as a major shift in UK politics.

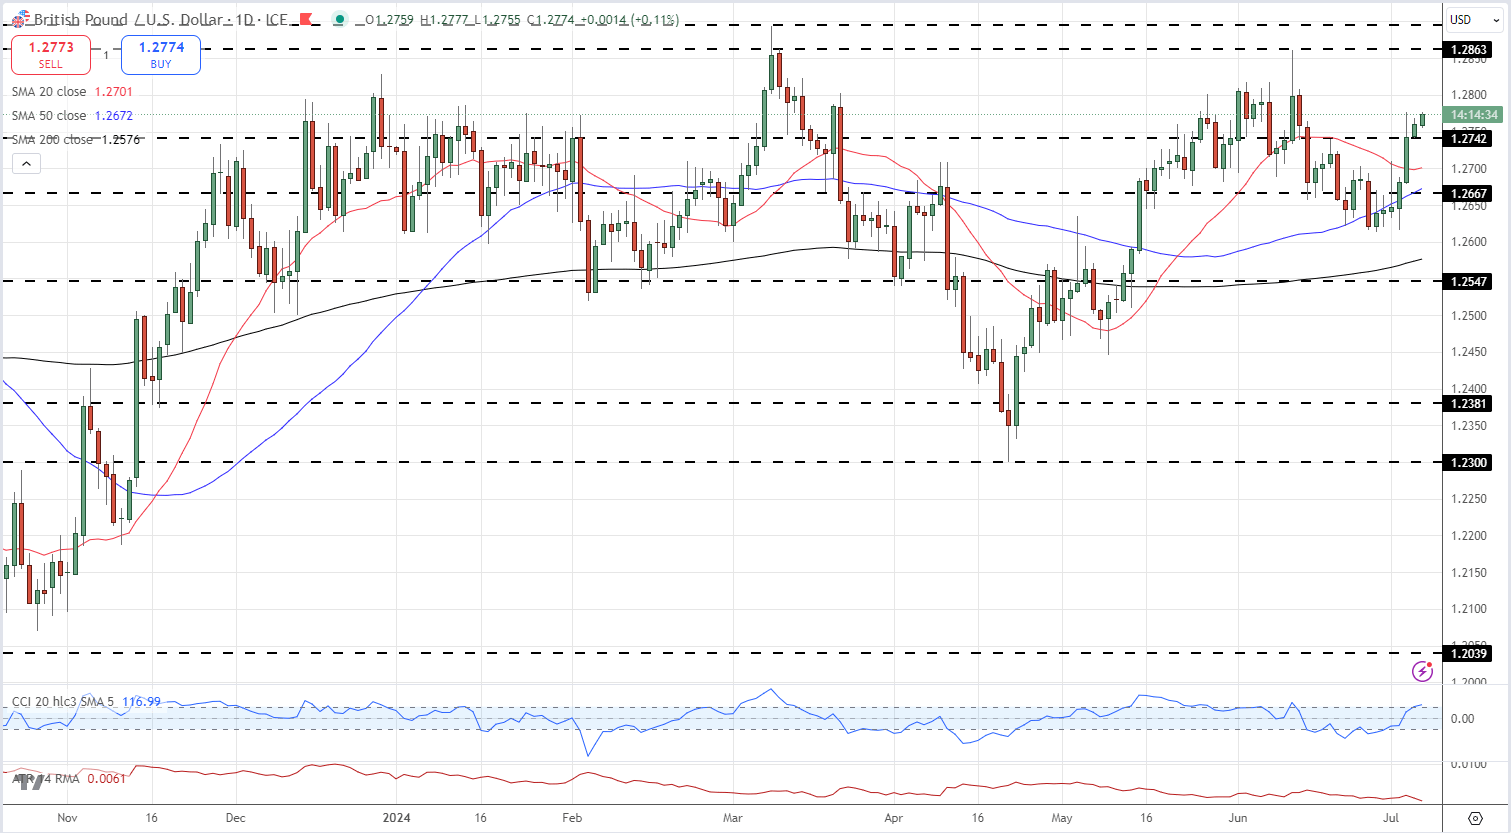
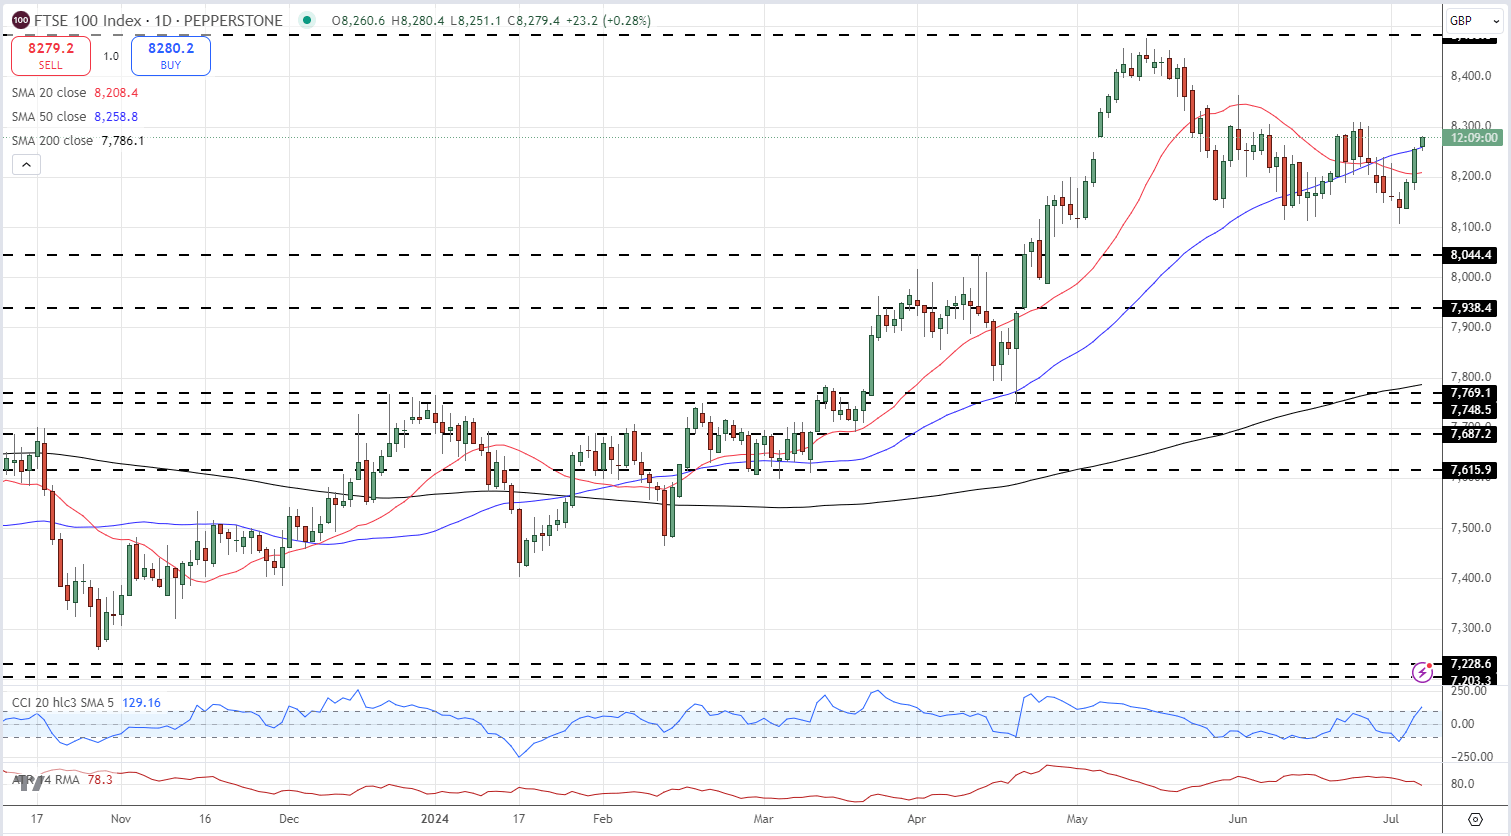
UK asset markets have been pricing in a large Labour majority ever since the general election was called and today’s lacklustre opening moves reflect this. The British Pound is barely changed against a range of other currencies, while the FTSE 100 is currently around 0.2% stronger. Financial markets like political certainty and this will likely shore up markets ahead of any major policy announcements.

GBP/USD Daily Price Chart

image1.png

FTSE 100 Daily Price Chart

image2.png

image3.png

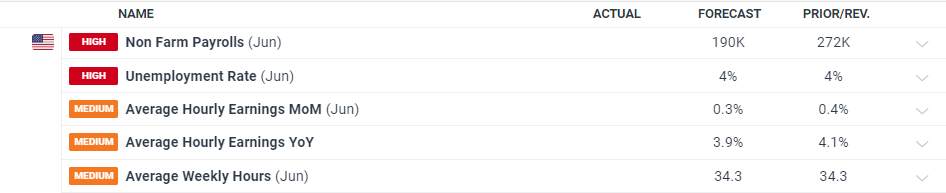
Later in today’s session, the latest US Jobs Report (NFPs) will be released, a monthly data point that is closely watched across the market. The US Labor Department is forecast to 190k new jobs created in June, down from a hefty 272k seen in May. So far this year, three of the first four employment reports have seen their initial estimate revised lower, while last year eight out of the 12 initial estimates were revised lower.

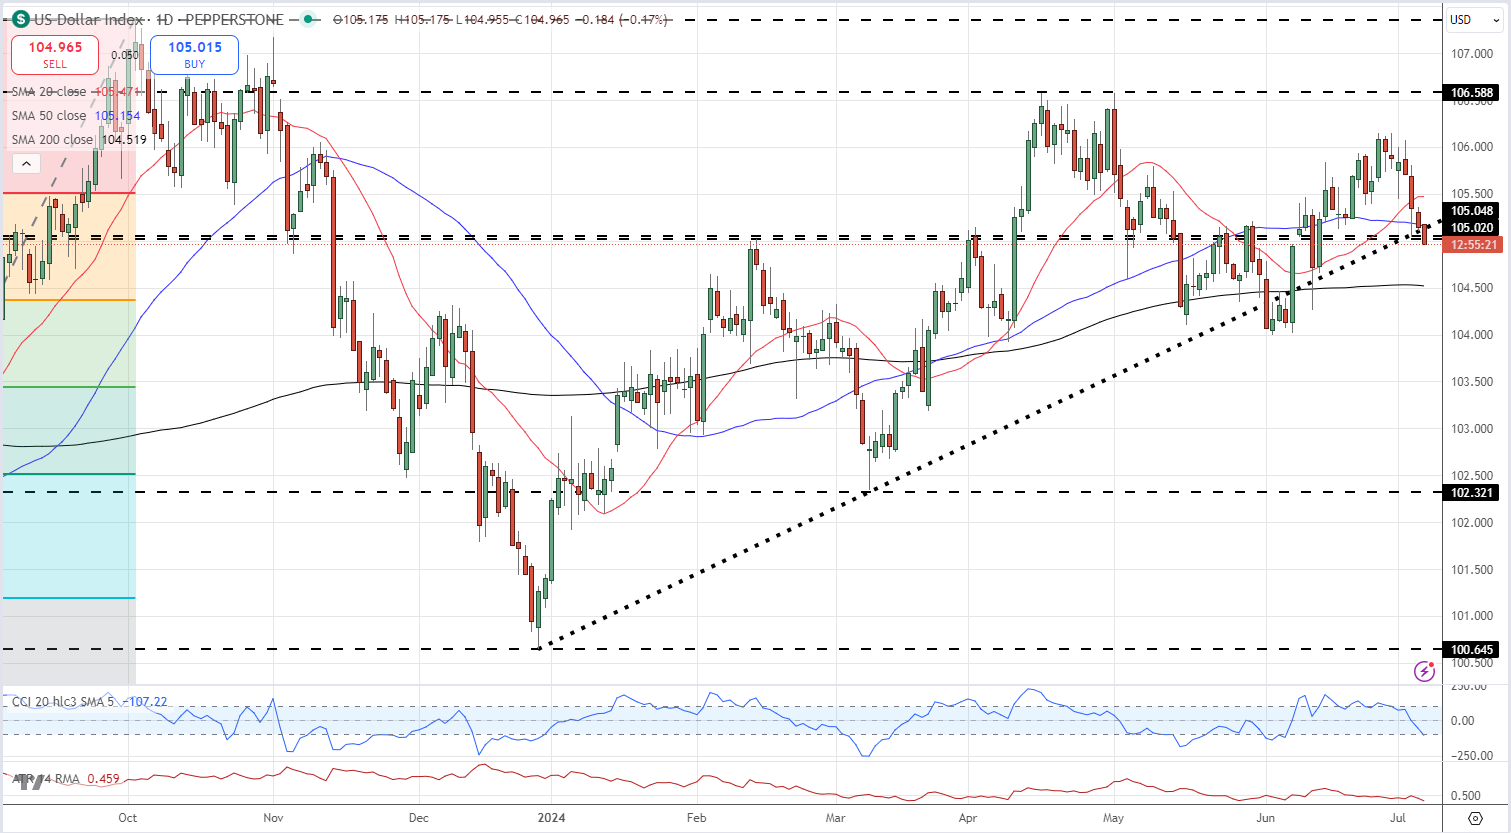
The US dollar index is currently testing trend support, a prior swing high, and both the 20- and 50-day simple moving averages. A lower-than-expected NFP reading today could see the DXY test the 200-dsma just above 104.50.

US Dollar Index Daily Chart

image4.png

How to Combine Fundamental and Technical Analysis

How to Combine Fundamental and Technical Analysis

Fundamental and technical analysis can complement one another

Fundamental and technical analysis can be combined to provide a holistic trading strategy. Traders often compare the differences between fundamental and technical analysis, however blending the two can have positive benefits. Although there are no hard facts as to which style of analysis is superior, combining the two may lead to more definitive trade choices. This article will explore various ways how to combine fundamental and technical analysis using practical examples.

Ways to combine fundamental and technical analysis

There are numerous ways of combining fundamental and technical analysis. Below are examples of how three different technical analysis methods can be combined with fundamental analysis to provide richer insights including:

  1. Combining range bound trading with fundamental analysis
  2. Combining breakout trading with fundamental analysis
  3. Using oscillators with fundamental analysis

Range bound trading with fundamental analysis

Range bound trading attempts to identify a price channel of a market, by which a trader uses to buy at the lower trendline support and sell at the higher trendline resistance.

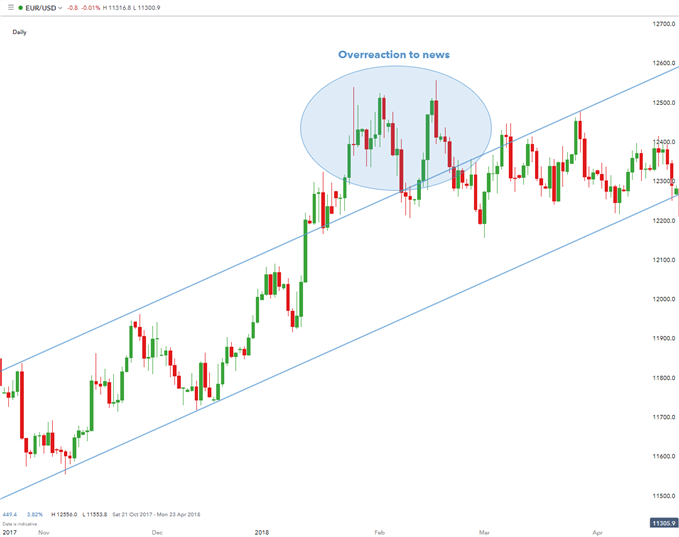
The chart below shows a strong bullish (upward) trend on EUR/USD. In a strong up-trending market, traders are looking to enter or buy at the lowest possible level to maximize on the strategy. However, news events can disrupt a range bound market. In this case, the trader would look to avoid open trades around the time of the news release (poor ‘retail sales’ and ‘durable goods orders’ figures). The chart shows clearly this disruption as indicated, after which the price level returns to preceding range bound levels.

fundamental news trading

Breakout trading with fundamental analysis

A breakout trade strategy involves capitalising on prices of an instrument moving outside of a predefined trading range; often catalysed by news events.

While range traders should remain cautious when going into news releases (since additional volatility could pierce support and/or resistance with which they are using to set their stops), they can still look to take advantage of overreactions to news. Traders in these situations would want to wait for news or data to cause price to reach support and/or resistance – and once a test of either of these levels are put in – could look to buy or sell accordingly. Traders can look to trade breakouts with any of the prescribed mechanisms of support and resistance, with the anticipation that news releases could bring in the wanted volatility to a) trigger into the trade b) move the trade closer to the trader’s profit target (limit).

Using oscillators with fundamental analysis

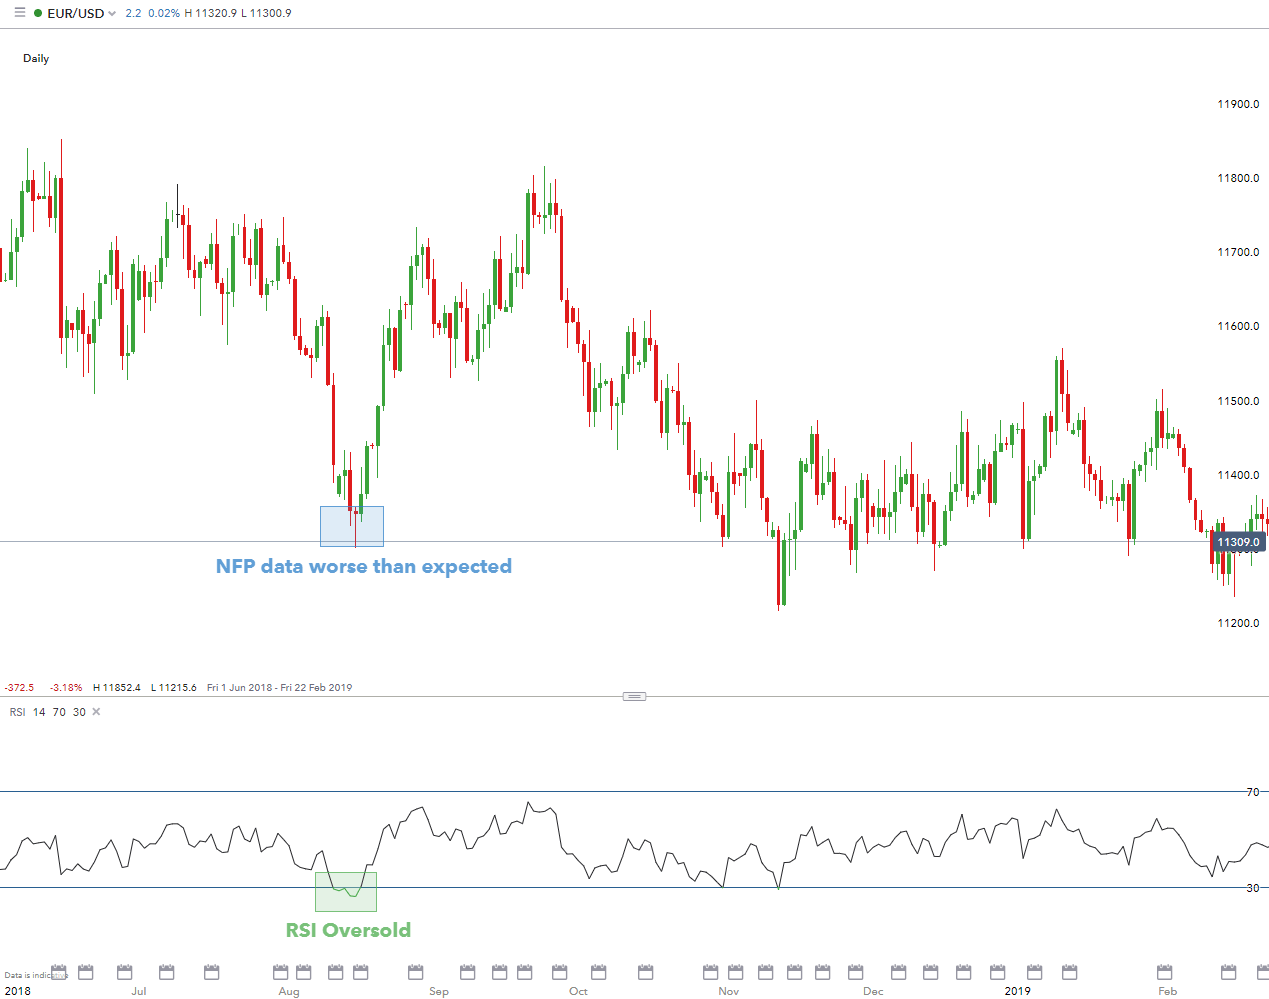
fundamental trading with indicators

Oscillators are a frequently used technical instruments, usually to discover short-term overbought/oversold conditions. In the chart above, I have included an example of using an RSI indicator (technical indicator) in conjunction with a Non-farm Payroll (fundamental indicator) data release, one of the most significant fundamental indicators in US history. The NFP figure was lower than estimates, which caused the USD to weaken as depicted by the strong bullish move on EUR/USD. When NFP is due to be released and you expect it to be lower than estimates based on recent events in the US, then this would mean EUR/USD could become more volatile so potentially a good choice to sell and vice versa. Oscillators can further assist with entry and exit points and their respective timing.

Combining Fundamental and Technical Analysis: A Summary

Technical analysis can be an extremely informative technique to analyse markets, but it is important to note that fundamentals do play a role in the broader picture. The above content has provided real world scenarios of combining technical and fundamental analysis.

What is Leverage in Forex? Forex Leverage Explained

What is Leverage in Forex? Forex Leverage Explained

Many people are attracted to forex trading due to the amount of leverage that brokers provide. Leverage allows traders to gain more exposure in financial markets than what they are required to pay for. Traders of all levels should have a solid grasp of what forex leverage is and how to use it responsibly. This article explains forex leverage in depth, including how it differs to leverage in stocks, and the importance of risk management.

Leverage in forex fulchrum example showing margin and full trade size

What is leverage in forex trading?

Leverage in forex is a useful financial tool that allows traders to increase their market exposure beyond the initial investment (deposit). This means a trader can enter a position for $10,000 worth of currency and only need $1000, in a ten-to-one leverage scenario. However, it is essential to know that gains AND losses are magnified with the use of leverage. In adverse market scenarios, a trader using leverage might even lose more money than they have as deposit.

Leverage of ten-to-one means that traders can gain exposure to a notional value or trade size, ten times more than the deposit/margin that is required to fund the trade. This can be thought of in a similar fashion to putting a 10% deposit down on a house; you gain access to the entire house while only funding 10%of the full value.

Leverage is usually expressed as a ratio:

Leverage expressed in words Leverage expressed as a ratio
Ten-to-one 10:1
Thirty-to-one 30:1
Fifty-to-one 50:1

The amount of forex leverage available to traders is usually made available through your broker and the amount of leverage will vary according to regulatory standards that preside in different regions.

Leverage in forex vs leverage in shares

Forex leverage differs to the amount of leverage that is offered when trading shares. This is due to the fact that the major FX pairs are liquid and typically exhibit less volatility than even the most frequently traded shares. As a result, hedging risk and getting in and out of trades is more manageable in the $5.1 trillion a day FX market.

How is forex leverage calculated?

Traders require the following to calculate leverage:

  • The notional value of the trade (trade size)
  • The margin percentage

Brokers often provide traders with a margin percentage to calculate the minimum equity needed to fund the trade. Margin and deposit can be used interchangeably. Once you have the margin percentage, simply multiply this with the trade size to find the amount of equity needed to place the trade.

Equity = margin percentage x trade size

To calculate leverage, simply divide the trade size by the required equity.

Leverage = trade size/ equity

Forex leverage example

Below is a typical example of how to calculate leverage using the above formulas:

  • Trade size: 10 000 units of currency (one mini contract on USD/JPY with a trade size equal to $10 000)
  • Margin percentage: 10%

Equity = margin percentage x trade size

0.1 x $10 000

=$1 000

Leverage = trade size/ equity

$10 000 / $1 000

= 10 times or 10:1

The example highlights the basics of how forex leverage is used when entering a trade. However, it must be noted that traders should not simply calculate the minimum amount needed to enter a trade and then fund the account with that exact amount. Traders must be mindful of margin calls if the position moves in the opposite direction, bringing the account equity below an acceptable level determined by the broker.

Trading forex with leverage has the potential to produce large losses. We have calculated a typical scenario of how the use of excessive leverage can impact a trading account and tabulated the results.

3 Things I Wish I Knew When I Started Trading Forex

3 Things I Wish I Knew When I Started Trading Forex

Trading forex – what I learned

  • Trading forex is not a shortcut to instant wealth.
  • Excessive leverage can turn winning strategies into losing ones.
  • Retail sentiment can act as a powerful trading filter.

Everyone comes to the forex market for a reason, ranging between solely for entertainment to becoming a professional trader. I started out aspiring to be a full-time, self-sufficient forex trader. I had been taught the ‘perfect’ strategy. I spent months testing it and backtests showed how I could make $25,000-$35,000 a year off of a $10,000 account. My plan was to trade forex for a living and let my account compound until I was so well off, I wouldn’t have to work again in my life. I was dedicated and I committed myself to the plan 100%.

Sparing you the details, my plan failed. It turns out that trading 300k lots on a $10,000 account is not very forgiving. I lost 20% of my account in three weeks. I didn’t know what hit me. Something was wrong. Luckily, I stopped trading at that point and was fortunate enough to land a job with a forex broker. I spent the next couple of years working with traders around the world and continued to educate myself about the forex market. It played a huge role in my development to be the trader I am today. Three years of profitable trading later, it’s been my pleasure to join the team at DailyFX and help people become successful or more successful traders.

The point of me telling this story is because I think many traders can relate to starting off in this market, not seeing the results that they expected and not understanding why. These are the three things I wish I knew when I started trading Forex.

1) Forex is not a get rick quick opportunity

Contrary to what you’ve read on many websites across the web, Forex trading is not going to take your $10,000 account and turn it into $1 million. The amount we can earn is determined more by the amount of money we are risking rather than how good our strategy is. The old saying “It takes money to make money” is an accurate one, Forex trading included.

But that doesn’t mean it is not a worthwhile endeavor; after all, there are many successful Forex traders out there that trade for a living. The difference is that they have slowly developed over time and increased their account to a level that can create sustainable income.

I hear about traders all the time targeting 50%, 60% or 100% profit per year, or even per month, but the risk they are taking on is going to be pretty similar to the profit they are targeting. In other words, in order to attempt to make 60% profit in a year, it’s not unreasonable to see a loss of around 60% of your account in a given year.

“But Rob, I am trading with an edge, so I am not risking as much as I could potentially earn” you might say. That’s a true statement if you have a strategy with a trading edge. Your expected return should be positive, but without leverage, it is going to be a relatively tiny amount. And during times of bad luck, we can still have losing streaks. When we throw leverage into the mix, that’s how traders attempt to target those excessive gains. Which in turn is how traders can produce excessive losses. Leverage is beneficial up to point, but not when it can turn a winning strategy into a loser.

2) Leverage can be a winning strategy to lose money

This is a lesson I wish I had learned earlier. Excessive leverage can ruin an otherwise profitable strategy.

Let’s say I had a coin that when heads was hit, you would earn $2, but when tails was hit, you would lose $1. Would you flip that coin? My guess is absolutely you would flip that coin. You’d want to flip it over and over. When you have a 50/50 chance between making $2 or losing $1, it’s a no-brainer opportunity that you’d accept.

Now let’s say I have the same coin, but this time if heads is hit, you would triple your net worth; but when tails was hit, you would lose every possession you own. Would you flip that coin? My guess is you would not because one bad flip of the coin would ruin your life. Even though you have the exact same percentage advantage in this example as the example above, no one in their right mind would flip this coin.

The second example is how many Forex traders view their trading account. They go “all-in” on one or two trades and end up losing their entire account. Even if their trades had an edge like our coin flipping example, it only takes one or two unlucky trades to wipe them out completely. This is how leverage can cause a winning strategy to lose money.

3) Using sentiment as a guide can tilt the odds in your favor

The 3rd lesson I’ve learned should come as no surprise to those that follow my articles… using the IG client sentiment tool (IGCS). I’ve written many articles about this topic. It’s the best tool I’ve ever used and is still a part of almost every trading strategy I am using, present day.

IGCS is a free tool that tells us how many traders are long compared to how many traders are short each major currency pair. It’s meant to be used as a contrarian index where we want to do the opposite of what everyone else is doing. Using it as a direction filter for my trades has turned my trading career completely around.