How to Trade Forex News: An Introduction

How to Trade Forex News: An Introduction

Major economic data has the potential to drastically move the forex market. It is this very movement, or volatility, that most newer traders seek when learning how to trade forex news. This article covers the major news releases, when they occur, and presents the various ways traders can trade the news.

Why Trade the News on Forex?

Traders are drawn to forex news trading for different reasons but the biggest reason is volatility. Simply put, forex traders are drawn to news releases for their ability to move forex markets. ‘News’ refers to economic data releases such as GDP and inflation, and forex traders tend to monitor such releases considered to be of ‘high importance’.

The largest moves tend to follow a ‘surprise’ in the data – where the actual data contrasts what was expected by the market – the good news here is that you don’t have to hold a PhD in Economics because our economic calendar already provides economist expectations.

Furthermore, news releases are set at pre-determined dates and times allowing traders enough time to prepare a solid strategy.

Traders that can effectively manage the risks of volatility, at the predetermined time of the news release, are well on their way to becoming consistent traders.

The Impact of Major News Releases on the Forex market

Just before a major news release, it is common to witness lower trading volumes, lower liquidity and higher spreads, often resulting in big jumps in price. This is because large liquidity providers, much like retail traders, do not know the outcome of news events prior to their release and look to offset some of this risk by widening spreads.

While large price movements can make trading major news releases exciting, it can also be risky. Due to the lack of liquidity, traders could experience erratic pricing. Such erratic pricing has the potential to cause a huge spike in price that shoots through a stop loss in the blink of an eye, resulting in slippage.

Additionally, the wider spread could place traders on margin call if there isn’t enough free margin to accommodate this. These realities surrounding major news releases could result in a short trading career if not managed properly through prudent money management such as incorporating stop losses or guaranteed stop losses (where available).

In general, major currency pairs will have lower spreads than the less traded emerging market currencies and minor currency pairs. Therefore, traders may look to trade the majors EUR/USD, USD/JPY, GBP/USD, AUD/USD and USD/CAD to mention a few.
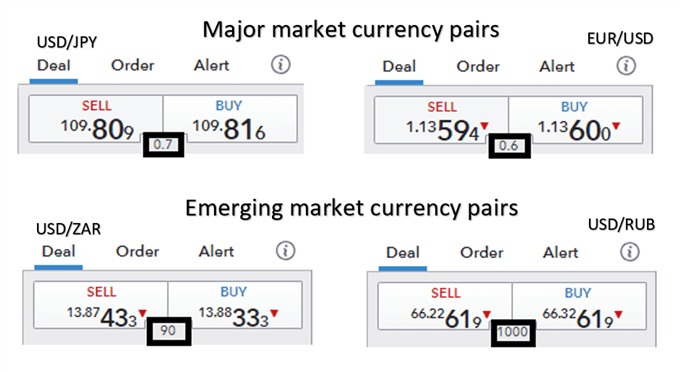
General forex spreads between majors and emerging markets

Traders need to be well prepared ahead of time – with a clear idea of what events they want to trade and when they occur. It’s also important to have a solid trading plan in place.

“Don’t think about what the market’s going to do; you have absolutely no control over that. Think about what you’re going to do if it gets there. In particular, you should spend no time at all thinking about those rosy scenarios in which the market goes your way, since in those situations, there’s nothing more for you to do. Focus instead on those things you want least to happen and on what your response will be.” – William Eckhardt

Which Major Forex News Releases to Trade?

When learning how to trade news, traders must be aware of the major news events that affect the forex market, that can be monitored closely using an economic calendar.

US economic data is so influential within global currency markets that it is generally seen as the most important news. It is important to note that not all news releases lead to increased volatility. Rather, there are a limited number of major news releases that have previously produced the greatest potential to move the market.

The table below summarizes the major US economic releases alongside some of the most important non-US data releases from around the world.

Major news releases (US and rest of world):

Economic data release Time (EST) Description
Non-farm payrolls (NFP) 8:30am – monthly release (first Friday after the month ends) Represents the net changes in employment jobs
US Gross domestic product (GDP) 8:30am – quarterly release Gauges the monetary value of all goods and services produced within the US over a specified period
US Federal Reserve Bank Federal funds rate 1:00pm – scheduled 8 times a year Interest rate at which depository institutions lend and borrow to other institutions, overnight
Australian cash rate 10:30pm (First Tuesday of the month except January) Interest rate charged on overnight loans between financial intermediaries
Australian employment change 7:30pm – monthly release (about 15 days after month ends) Change in number of employed people during the previous month
European Central Bank refinancing rate 7:45am – 8 times a year Interest rate on the main refinancing operations offering liquidity to the financial system
Bank of England official bank rate 7:00am – monthly release Interest rate that the BOE lends to financial institutions (overnight)
Bank of Canada overnight rate 10:00am – 8 times a year Overnight rate that major financial institutions borrow and lend between themselves
Canadian employment change 8:30am – monthly (about 8 days after month ends) Measures the change in the number of employed people in the previous month
Reserve Bank of New Zealand official cash rate 9.00pm – scheduled 7 times a year Interest rate at which banks borrow and lend to other banks, overnight

Key Tools & Resources to Trade Forex News

DailyFX provides a one-stop-shop for all your forex related data and news releases:

  • Economic calendar: Know when major data like the US Non-Farm-Payroll, GDP, ISM, PPI and CPI figures are due to be released.
  • Central Bank Calendar: Central Bank interest rate decisions can have profound effect on the financial markets. Get to know when they are scheduled.
  • Real time news feed: Stay up to date with breaking news, as it happens, with updates from our top analysts. Similarly, get all the major stories of the day plus analysis by following our market news.

Managing risk when trading news and events

The importance of prudent risk management cannot be overstated during volatile periods that follow a news release.

The use of stops is highly recommended but in this case, traders may want to consider using guaranteed stops (where available) over normal stops. Guaranteed stops do come with a fee so be sure to check this with your broker; however, this fee can oftentimes end up being insignificant in relation to the amount of slippage that can occur in such volatile periods.

Additionally, traders should also look to reduce their normal trade size. Volatile markets can be a trader’s best friend but also have the potential to reduce account equity significantly if left unmanaged. Therefore, in addition to placing guaranteed stops, traders can look to reduce their trade sizes to manage the emotions of trading.

3 Approaches to forex news trading

There are a number of approaches traders can adopt when developing a forex news trading strategy which depend on the timing of the trade relative to the news release.

Many traders like to trade in the moment and make decisions as and when an announcement happens – using an economic calendar to plan ahead. Others prefer to enter the market in less volatile conditions ahead of a release or announcement. To summarize, forex news trading fits into one of the categories below:

  1. Trading before the news release
  2. Trading on the news release
  3. Trading after the news release

1. Trading before the news release  

Trading forex news before the release is beneficial for traders looking to enter the market under less volatile conditions. In general, traders who are more risk averse gravitate towards this approach looking to capitalize on the quieter periods before the news release by trading ranges or simply trading with the trend. Discover strategies on how to trade before the news release.

2. Trading during a release

These forex news trading strategies are not for the faint hearted as it involves entering a trade as the news breaks or in the moments that immediately follow. This is at a time when the market is at its most volatile which underscores the importance of having a clear strategy and well-defined risk management. Equip yourself with strategies to navigate the volatility associated with forex news trading at the release.


3. Trading after the news release

Trading post-release involves entering the trade after the market has had some time to digest the news. Often the market, through price action, provides clues on its future direction – presenting traders with great opportunity.

Retail Trader Sentiment Update: GBP/USD, AUD/USD, USD/JPY Latest

Retail Trader Sentiment Update: GBP/USD, AUD/USD, USD/JPY Latest

AUD/USD:

Retail trader data reveals that 78.72% of traders are net-long, with a ratio of 3.70 long traders for every short trader. The number of net-long traders has increased by 5.45% since yesterday and 34.21% since last week. Conversely, net-short traders have decreased by 14.05% since yesterday and 49.63% since last week.

Taking a contrarian view to crowd sentiment, the predominance of net-long traders suggests AUD/USD prices may continue to fall. The increase in net-long positions both daily and weekly strengthens this bearish outlook for AUD/USD.

AUD/USD Sentiment Chart

GBP/USD:

Retail trader data shows that 37.63% of traders are net-long, with a ratio of 1.66 short traders for every long trader. Net-long traders have increased by 2.27% since yesterday and 9.89% since last week. Net-short traders have decreased by 8.01% since yesterday and 11.81% since last week.

While a contrarian view to crowd sentiment suggests GBP/USD prices may continue to rise due to the majority being net-short, recent changes in sentiment indicate a potential downward reversal in the current GBP/USD price trend.

GBP/USD Sentiment Chart

USD/JPY:

Retail trader data indicates that 41.56% of traders are net-long, with a ratio of 1.41 short traders for every long trader. Net-long traders have increased by 4.29% since yesterday and 8.00% since last week. Net-short traders have decreased by 7.01% since yesterday and 16.85% since last week.

Although a contrarian view to crowd sentiment suggests USD/JPY prices may continue to rise due to the majority being net-short, recent changes in sentiment warn of a potential downward reversal in the current USD/JPY price trend.

USD/JPY Sentiment Chart

Retail Trader Sentiment Update: GBP/USD, AUD/USD, USD/JPY Latest

Retail Trader Sentiment Update: GBP/USD, AUD/USD, USD/JPY Latest

AUD/USD:

Retail trader data reveals that 78.72% of traders are net-long, with a ratio of 3.70 long traders for every short trader. The number of net-long traders has increased by 5.45% since yesterday and 34.21% since last week. Conversely, net-short traders have decreased by 14.05% since yesterday and 49.63% since last week.

Taking a contrarian view to crowd sentiment, the predominance of net-long traders suggests AUD/USD prices may continue to fall. The increase in net-long positions both daily and weekly strengthens this bearish outlook for AUD/USD.

AUD/USD Sentiment Chart

GBP/USD:

Retail trader data shows that 37.63% of traders are net-long, with a ratio of 1.66 short traders for every long trader. Net-long traders have increased by 2.27% since yesterday and 9.89% since last week. Net-short traders have decreased by 8.01% since yesterday and 11.81% since last week.

While a contrarian view to crowd sentiment suggests GBP/USD prices may continue to rise due to the majority being net-short, recent changes in sentiment indicate a potential downward reversal in the current GBP/USD price trend.

GBP/USD Sentiment Chart

USD/JPY:

Retail trader data indicates that 41.56% of traders are net-long, with a ratio of 1.41 short traders for every long trader. Net-long traders have increased by 4.29% since yesterday and 8.00% since last week. Net-short traders have decreased by 7.01% since yesterday and 16.85% since last week.

Although a contrarian view to crowd sentiment suggests USD/JPY prices may continue to rise due to the majority being net-short, recent changes in sentiment warn of a potential downward reversal in the current USD/JPY price trend.

USD/JPY Sentiment Chart

How to Control Greed When Trading

How to Control Greed When Trading

Greed is a natural human emotion that affects individuals to varying degrees. Unfortunately, when viewed in the context of trading, greed has proven to be a hindrance more often than it has assisted traders.

Greed can very easily turn good trades into bad ones and bad trades into worse trades. This article provides a number of tips to control greed and how to stop it interfering with your trading success.

What is greed in trading and how does it impact trader success?

Greed can be described as an intense desire for something and often manifests as the intense desire for wealth. This can easily get out of hand when the market moves against traders but is equally likely to negatively influence trading decisions on winning trades.

Examples of greed when trading:

  • ‘Doubling down’ on losing trades
  • Adding capital to winning positions
  • Over-leveraging

Greed can alter your mental state, harnessing your focus to maximise utility/happiness/wealth. The desire for these things often results in traders placing trades they otherwise would never have thought of executing.

Furthermore, greed poses a threat to the trading account. Doubling down, adding too much capital to winning positions, and over-leveraging can quickly result in a margin call or can deplete account equity.

Top example of how greed impacts trading

The chart below provides an example of the negative influence of greed. The chart shows a scenario where a trader enters a long position in EUR/USD (without a stop) after the large green candle, hoping that that market moves higher. The market moves lower and places the trader into a losing position. Greed may entice the trader to not only maintain the existing position but to open a new long position when the market shows signs of turning around (the second blue arrow).

The idea of buying at this relatively low point and turning a losing trade into a winner can overwhelm traders. Furthermore, such greed can blind traders to the degree that it is possible to trade in the opposite direction to the trend without even noticing.

example of greed in trading EUR/USD

Greed is often accompanied by other emotions, such as fear. Fear appears many times in a trader’s journey which is why it is essential to learn how to manage fear from the onset.

How to control greed when trading

Fortunately, greed can be controlled and overcome like all emotions. With time and the necessary discipline, it is possible to execute trades without greed getting in the way.

Greed can be seen as the opposite of discipline. Individuals that are disciplined very seldomly fall into the greed trap as they have some sort of plan and stick to it. Trading plans and trading journals are a great way to keep traders on the right path and not be tempted to enter trades that deviate from the plan.

Traders should also consider setting strict stop losses and target a number of pips to the upside before entering a trade. This is referred to as the risk to reward ratio and was found to be the single most important trait of successful traders.

It’s important to remember that managing and dealing with greed is not something that will be resolved over the next couple of trades. However, traders that are conscious of how greed can negatively influence trading and implement the above points as part of a trading regimen, will be taking positive steps toward the goal of “greed free” trading.

Stop being greedy

Apple Q3 Earnings Preview: a Closer Look at Earnings Forecasts and China Market Strategy

Apple Q3 Earnings Preview: a Closer Look at Earnings Forecasts and China Market Strategy

When will Apple report its latest earnings?

Apple is scheduled to report its third quarter (Q3) earnings on Thursday, August 1, 2024.

Key Financial Metrics

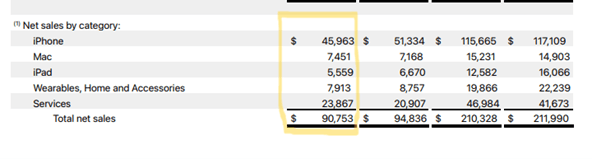
Last quarter (Q2), Apple reported a revenue beat of $90.75 billion vs. $90.01 expected and an EPS beat of $1.53 vs. $1.50 estimated. The company announced that the board had authorised $110 billion in share repurchases, a 22% increase over the previous year’s $90 billion. Providing a further sweetener, the company authorised a 25-cent dividend, a combination that sent the share price soaring 7% in after-hours trading.

The company reported the following key numbers:

  • iPhone revenue fell nearly 10% to $45.96 billion vs $46.00 billion expected
  • Mac revenue increased 4% to $7.5 billion vs $6.86 billion expected
  • iPad revenue of $5.6 billion vs $5.91 billion expected. Apple has not released a new iPad since 2022.
  • Services revenue increased 14.2% to $23.9 billion vs the $23.37 billion expected. The Services segment includes subscriptions like iCloud Storage, App Store and Apple Music.
  • The Wearables or Other Products section, which includes Air Pods and Apple Watches, fell over 10% to $7.9 billion

Net Sales by Category for Q2 highlighted

Market performance in greater China

Apple’s sales in Greater China, its third largest market, were off 8% to $16.37 billion. However, the number exceeded analysts’ estimates of $15.25 billion, easing worries that the iPhone was losing market share to homegrown products like Huawei.

Net Sales by Reportable Segment Chart

Stock Performance

In its Q2 Earnings call, Apple did not provide formal guidance for Q3. However, CEO Tim Cook, on a post-earnings call, indicated that overall sales would grow in the “low single digits during the June quarter.

Key Financials – Summary

Wall Street‘s expectations for the upcoming results are as follows.

  • EPS: $1.34 vs $1.53 per share previous quarter
  • Revenue: $84.3 billion vs $90.75 billion

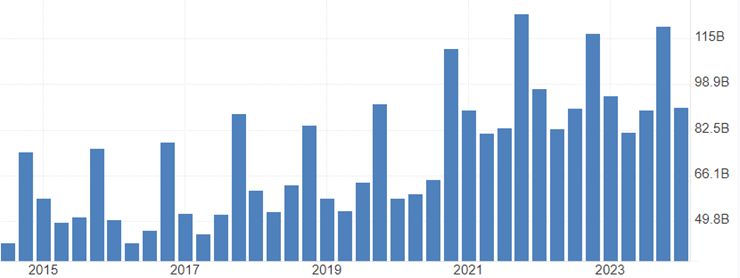
Apple Sales Revenue

Key Metrics and Insights to Watch out for

iPhone performance: Apple faces challenges in China and has offered discounts to compete with rivals like Huawei. Sales are expected to fall again this quarter to $37.7bn from $45.96bn in Q2.

Mac sales: The Mac business is expected to perform well, with shipments rising 20.8% year-over-year, outpacing the broader PC market.

Services growth: Apple’s digital services business is anticipated to continue its strong performance, driven by higher AppStore sales and increased uptake of subscription services.

Gross margins: The company’s gross margins are expected to rise due to a favourable sales mix of premium products and higher service sales.

AI developments: Updates on Apple’s new generative AI software, Apple Intelligence, are expected to drive a record device upgrade cycle, boosting iPhone and iPad sales and prices.

China market: Given recent headwinds, Apple’s performance in China, one of its largest markets, will be closely watched.

Guidance for Q4: Apple has not provided official guidance since 2020. However any insights into projections for the upcoming quarter will be important, particularly around Apple Intelligence and the expected upgrade cycle from Apple Intelligence.

Apple Technical Analysis

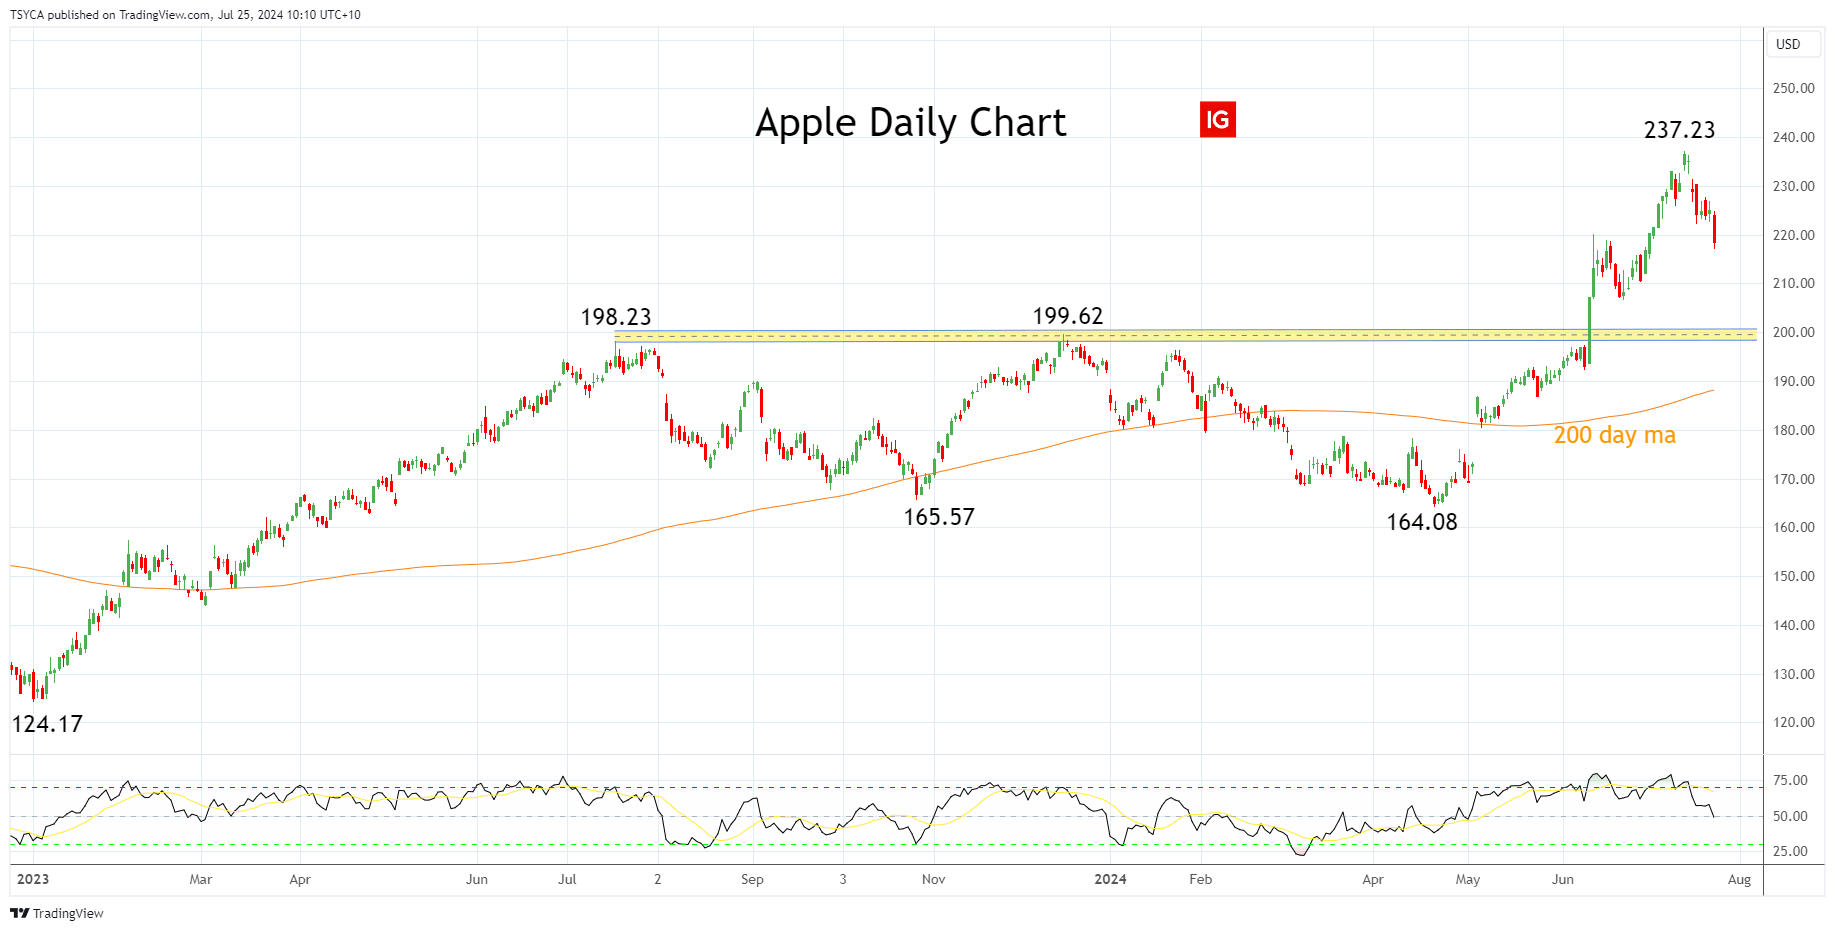
Apple’s share price enjoyed a 60% gain from its early January 2023 low of $124.17 to its high of $199.62 in December 2023 before spending the next five months consolidating gains in a range between $200 and $165.00.

Apple’s Q2 earnings update in early May, followed by its WWDC on June 10, was the catalyst for the break above $200 to its mid-July high of $237.23. Since that point, Apple’s share price has corrected 8.50% lower. If the pullback deepens, we expect Apple’s share price to be well supported by buyers between $210 and $200 looking for a push towards $250/$270 in due course.

Aware that if Apple’s share price were to see a sustained break below $200/$190, it would negate the bullish outlook and warn that a deeper pullback is underway,

Apple Daily Chart

Summary

Apple is scheduled to report its third quarter (Q3) earnings on Thursday, August 1, 2024. We favour buying dips in Apple’s share price towards support at $210/200, looking for a move towards $250/$270 in due course.

Source Tradingview. The figures stated are as of July 25, 2024. Past performance is not a reliable indicator of future performance. This report does not contain and is not to be taken as containing any financial product advice or financial product recommendation.

AUD Technical Analysis: Aussie Dollar Takes a Hit on Weaker Market Sentiment

AUD Technical Analysis: Aussie Dollar Takes a Hit on Weaker Market Sentiment

Aussie Dollar Takes a Hit on Weaker Market Sentiment – SPX, AUD Lower

Overnight FX moves reveal the Japanese yen as the major winner while the Australian dollar makes up last place within a group of popular currencies. The Australian dollar has plunged over the last 10 days as broader market sentiment has soured. Naturally, the FX market favours safe haven currencies under such conditions while shifting out of high-beta currencies like the Aussie. The AUD/JPY chart depicts the unfolding situation.

Overnight FX Performance

A graph of different colored lines  Description automatically generated

AUD/JPY

The FX outlook for the Australian dollar and Japanese yen have changed – more so for the yen than the Aussie but the overarching macroeconomic environment appears to have shifter. The Aussie dollar has previously enjoyed a spate of strength as the Reserve Bank of Australia has had to contemplate possibly hiking interest rates at a time when major central banks are about to start cutting or have already started lowering their policy rates. However, with US equities selling off and the Bank of Japan preparing to hike rates and taper their bond purchases, AUD/JPY has made a sharp and consistent reversal.

AUD/JPY failed to close higher than the 107.40 on the weekly chart despite trading above the November 2007 level. That marked what appears to be a top, with the pair declining nearly 10% since. 98.50 appears as the next notable level of support.

AUD/JPY Monthly Chart

A graph of a stock market  Description automatically generated

The daily chart shows the extend of the decline, with 10 down days over the last 11 trading days split evenly down the middle by one solitary green candle. More notable is the recent bearish acceleration which has catapulted the pair into oversold territory where AUD/JPY may decide to take a breather and bank some profits in the process.

The pair currently tests the 200-day simple moving average (SMA), with the 98.70 level next in sight. In the meantime, a daily close below the 200 SMA would suggest that bearish momentum has not yet run its course. Chasing such fast moving markets offers up sub-optimal risk to reward setups. Instead, a shorter-term correction would be more constructive before assessing a bearish continuation of deeper pullback. A correction towards 102.85, which appears less likely, would present an opportunity to reassess the bearish trend.

AUD/JPY Chart

A graph with different colored lines  Description automatically generated

AUD/USD

AUD/USD has declined each of the last nine trading days including today if we are to close in the red. A September rate cut is a growing possibility for the Fed and recent encouraging inflation data has only supported this view. Tomorrow, US PCE could either add further evidence of this or muddy the water ahead of next week’s Fed meeting. Analyst estimates suggest we’ll get a minor improvement in the figure with anything but an upward surprise likely to maintain the current AUD/USD downtrend trend.

Similarly to AUD/JPY, AUD/USD presents a sharp bearish reversal offering sub-optimal bearish setups from current levels. Instead, a shorter-term pullback/consolidation around 0.6580 could provide some clarity ahead of the next move, whether that be a bearish continuation or deeper pullback. Support rests at 0.6460 now that the pair has registered a close below the 200 SMA on the daily candle. Resistance appears at 0.6580, the 200 SMA and 0.6644.

AUD/USD Daily Chart

A screenshot of a graph  Description automatically generated

AUD/NZD

On the bullish side of the Aussie dollar, AUD/NZD appears less vulnerable to a move to the downside. In truth, commodity currencies like the Aussie and the Kiwi dollar tend to decline in unison, somewhat explaining the limited move to the downside.

The pair remains within a longer-term uptrend with the recent decline looking to test Aussie bulls. AUD/NZD immediately tests the June 2023 high of 1.1052. A daily close below this level may entertain a larger move towards the zone of interest around 1.0930 where prior upward momentum collapsed during 2023. The pair is also recovering from overbought territory, suggesting bullish momentum is likely to come under further pressure. Resistance remains up at the recent spike high of 1.1150.

AUD/NZD Daily Chart

A screenshot of a graph  Description automatically generated


How to Read a Candlestick Chart

How to Read a Candlestick Chart

What is a candlestick chart?

A candlestick chart is simply a chart composed of individual candles, which traders use to understand price action. Candlestick price action involves pinpointing where the price opened for a period, where the price closed for a period, as well as the price highs and lows for a specific period.

Price action can give traders of all financial markets clues to trend and reversals. For example, groups of candlesticks can form patterns which occur throughout forex charts that could indicate reversals or continuation of trends. Candlesticks can also form individual formations which could indicate buy or sell entries in the market.

The period that each candle depicts depends on the time-frame chosen by the trader. A popular time-frame is the daily time-frame, so the candle will depict the open, close, and high and low for the day. The different components of a candle can help you forecast where the price might go, for instance if a candle closes far below its open it may indicate further price declines.

Boost your chart patterns expertise with our interactive quiz!

Our Forex Trading Patterns Quiz will test your knowledge of some of the most important trading patterns. Take the test today by clicking on the link and raise your technical analysis game!

Interpreting a candle on a candlestick chart

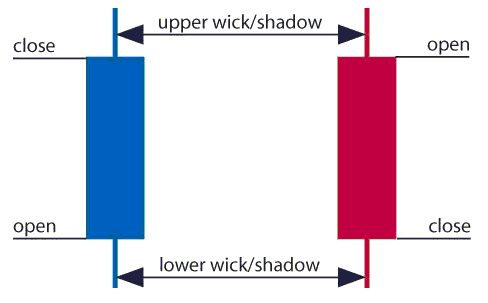
The image below represents the design of a typical candlestick. There are three specific points (open, close, wicks) used in the creation of a price candle. The first points to consider are the candles’ open and close prices. These points identify where the price of an asset begins and concludes for a selected period and will construct the body of a candle. Each candle depicts the price movement for a certain period that you choose when you look at the chart. If you are looking at a daily chart each individual candle will display the open, close, upper and lower wick of that day.

A red and a blue candlestick with open and close wicks

Open price:

The open price depicts the first price traded during the formation of the new candle. If the price starts to trend upwards the candle will turn green/blue (colors vary depending on chart settings). If the price declines the candle will turn red.

High Price:

The top of the upper wick/shadow indicates the highest price traded during the period. If there is no upper wick/shadow it means that the open price or the close price was the highest price traded.

Low Price:

The lowest price traded is the either the price at the bottom of the lower wick/shadow and if there is no lower wick/shadow then the lowest price traded is the same as the close price or open price in a bullish candle.

Close Price:

The close price is the last price traded during the period of the candle formation. If the close price is below the open price the candle will turn red as a default in most charting packages. If the close price is above the open price the candle will be green/blue (also depends on the chart settings).

The Wick:

The next important element of a candlestick is the wick, which is also referred to as a ‘shadow’. These points are vital as they show the extremes in price for a specific charting period. The wicks are quickly identifiable as they are visually thinner than the body of the candlestick. This is where the strength of candlesticks becomes apparent. Candlesticks can help traders keep our eye on market momentum and away from the static of price extremes.

Direction:

The direction of the price is indicated by the color of the candlestick. If the price of the candle is closing above the opening price of the candle, then the price is moving upwards and the candle would be green (the color of the candle depends on the chart settings). If the candle is red, then the price closed below the open.

Range:

The difference between the highest and lowest price of a candle is its range. You can calculate this by taking the price at the top of the upper wick and subtracting it from the price at the bottom of the lower wick. (Range = highest point – lowest point).

Having this knowledge of a candle, and what the points indicate, means traders using a candlestick chart have a clear advantage when it comes to distinguishing trendlines, price patterns and Elliot waves.

Bar Chart vs Candlestick Chart

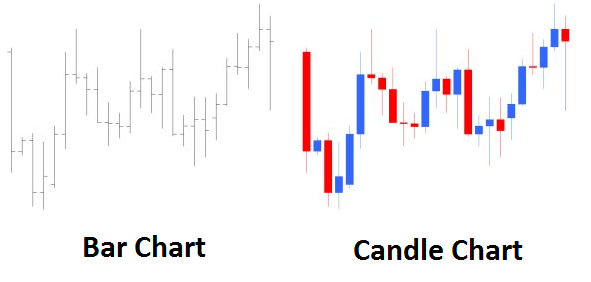
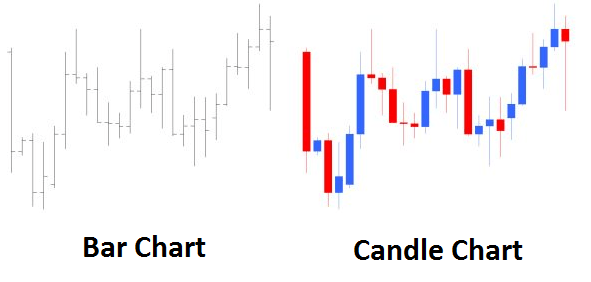
As you can see from the image below, candlestick charts offer a distinct advantage over bar charts. Bar charts are not as visual as candle charts and nor are the candle formations or price patterns. Also, the bars on the bar chart make it difficult to visualize which direction the price moved.

Difference between bar chart and candle chart

How to read a candlestick chart

There are various ways to use and read a candlestick chart. Candlestick chart analysis depends on your preferred trading strategy and time-frame. Some strategies attempt to take advantage of candle formations while others attempt to recognize price patterns.

Interpreting single candle formations

Individual candlesticks can offer a lot of insight into current market sentiment. Candlesticks like the Hammer, shooting star, and hanging man, offer clues as to changing momentum and potentially where the market prices maytrend.

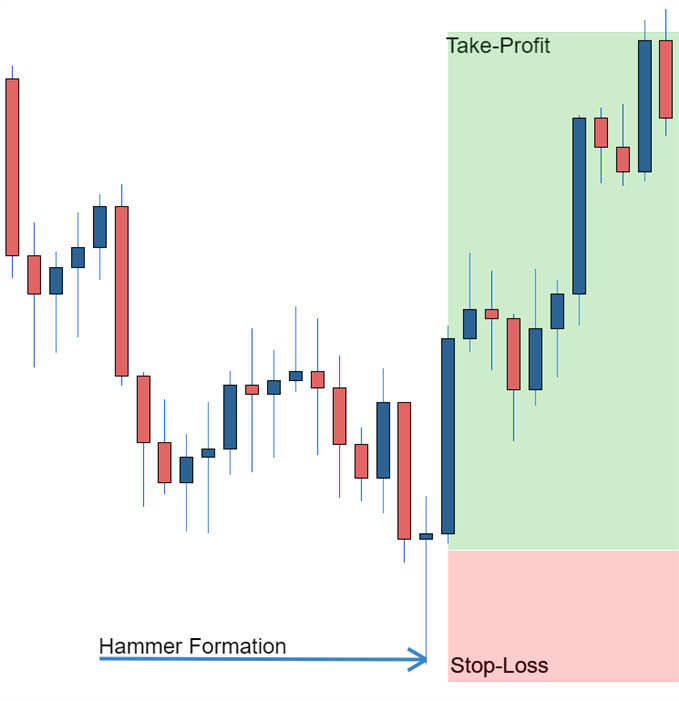
As you can see from the image below the Hammer candlestick formation sometimes indicates a reversal in trend. The hammer candle formation has a long lower wick with a small body. Its closing pricing is above its opening price. The intuition behind the hammer formation is simple, price tried to decline but buyers entered the market pushing the price up. It is a bullish signal to enter the market, tighten stop-losses or close out a short position.

Traders can take advantage of hammer formations by executing a long trade once the hammer candle has closed. Hammer candles are advantageous because traders can implement ‘tight’ stop-losses (stop-losses that risk a small amount of pips). Take-profits should be placed in such a way as to ensure a positive risk-reward ratio. So, the take-profit is larger than the stop-loss.

Hammer formation showing stop loss

Recognizing price patterns in multiple candles

Candlestick charts help traders recognize price patterns that occur in the charts. By recognizing these price patterns, like the bullish engulfing pattern or triangle patterns you can take advantage of them by using them as entries into or exit signals out the market.

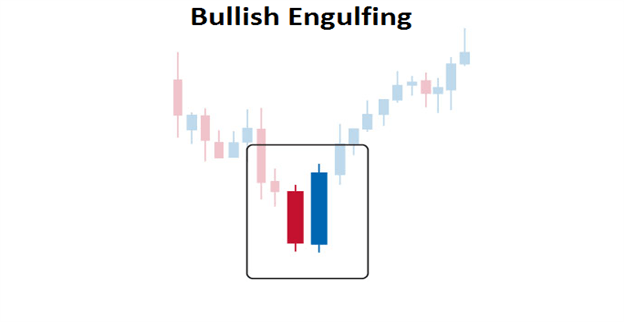
For example, in the image below we have the bullish engulfing price pattern. The bullish engulfing is a combination of a red candle and a blue candle that ‘engulfs’ the entire red candle. It is an indication that it could be the end of a currency pairs established weakness. A trader would take advantage of this by entering a long position after the blue candle closes. Remember, the price pattern only forms once the second candle closes.

As with the hammer formation, a trader would place a stop loss below the bullish engulfing pattern, ensuring a tight stop loss. The trader would then set a take-profit. For more forex candlestick charts check our forex candlesticks guide where we go in depth into the advantages of candlestick charts as well as the strategies that can be implemented using them.

Bullish engulfing pattern

Tesla stock price slumps after Q2 earnings​​​​​​​

Tesla stock price slumps after Q2 earnings​​​​​​​

​​​Profit slump and financial performance​Tesla’s second-quarter profits for 2024 plummeted by 45%, with net income falling to $1.47 billion, well below analysts’ expectations of $1.9 billion. The electric vehicle giant faced headwinds from slower sales, increased costs due to employee layoffs, and significant investments in artificial intelligence infrastructure.

​Despite these challenges, revenues rose 2% to $25.5 billion, narrowly exceeding expectations. This growth was primarily driven by record performance in the energy storage business and an unusually large sum of regulatory credits related to emissions requirements.

​​Operational costs and margins

​Operating expenses soared 39% during the quarter, reaching almost $3 billion. This increase was partly due to restructuring and legal costs associated with the company’s decision to cut 10% of its workforce in April.

​Tesla’s gross margin, a closely watched financial metric, fell to 18% in the quarter, down from a peak of 29.1% in the first quarter of 2022. Without the record $890 million in regulatory credit revenues, the automotive gross margin would have dropped to 14.6%.

​​Strategic focus on autonomy and robotics

​Elon Musk, Tesla’s CEO, has shifted the company’s focus towards developing autonomous technologies and robotics. The unveiling of Tesla’s “robotaxis” has been postponed from August to October, with Musk claiming that this project could potentially increase Tesla’s valuation to $5 trillion.

​ ​The company is also prioritising the development of Optimus, an autonomous humanoid robot. Musk stated that these robots are already performing tasks in Tesla factories, with limited production for consumer use expected to begin in 2026.

​​Market position and delivery numbers

​Despite the challenges, Tesla delivered nearly 444,000 EVs in the second quarter. While this represents a 4.7% year-over-year decrease, it’s an improvement from the first quarter’s 387,000 deliveries. This performance was sufficient to maintain Tesla’s position as the largest EV company ahead of China’s BYD.

​​Recent developments and stock performance

​Tesla has had an eventful year, with shareholders reapproving Musk’s $56 billion pay award and backing a proposal to reincorporate the company in Texas. Musk has also emerged as a prominent supporter of former president Donald Trump in the upcoming US election.

​However, these developments haven’t bolstered investor confidence. Tesla’s stock has fallen 8% in the past 12 months, and its market capitalisation has almost halved from its peak of $1.2 trillion in November 2021.

​​Company rankings & analyst consensus

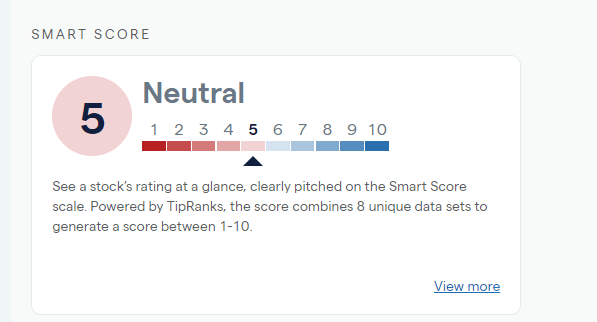
​Tesla currently has a neutral rating of 5 on the Smart Score ranking, indicating caution among investors about the outlook.

​Source: IG

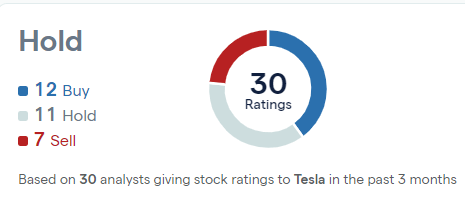
​Of 30 analysts currently covering the stock, 12 have ‘buy’ rankings, with 11 ‘holds’ and 7 ‘sells’.

​​Tesla broker ratings chart

​Tesla stock price – technical analysis

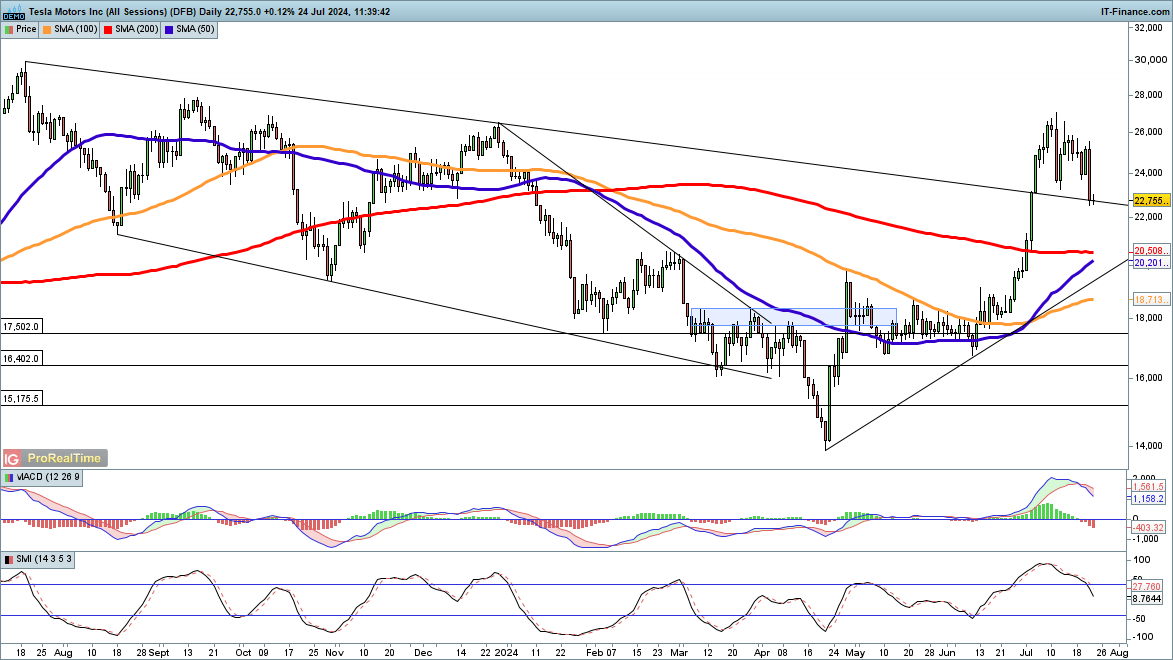
​The price dropped sharply in the wake of results last night, pushing the stock down 16% from the highs seen earlier in July.

​The price is now testing previous trendline resistance from the July 2023 highs, which it broke above around four weeks ago. Tesla has rallied over 60% from the April lows, so some further consolidation or losses would not be surprising.

​However, with the 50-day simple moving average (SMA) likely to cross over the 200-day SMA in the near future it appears we could be witnessing a trend change, where dips become buying opportunities.

​TSLA chart 240724

Japanese Yen’s Comeback: Analyzing the Recent Market Shift

Japanese Yen’s Comeback: Analyzing the Recent Market Shift

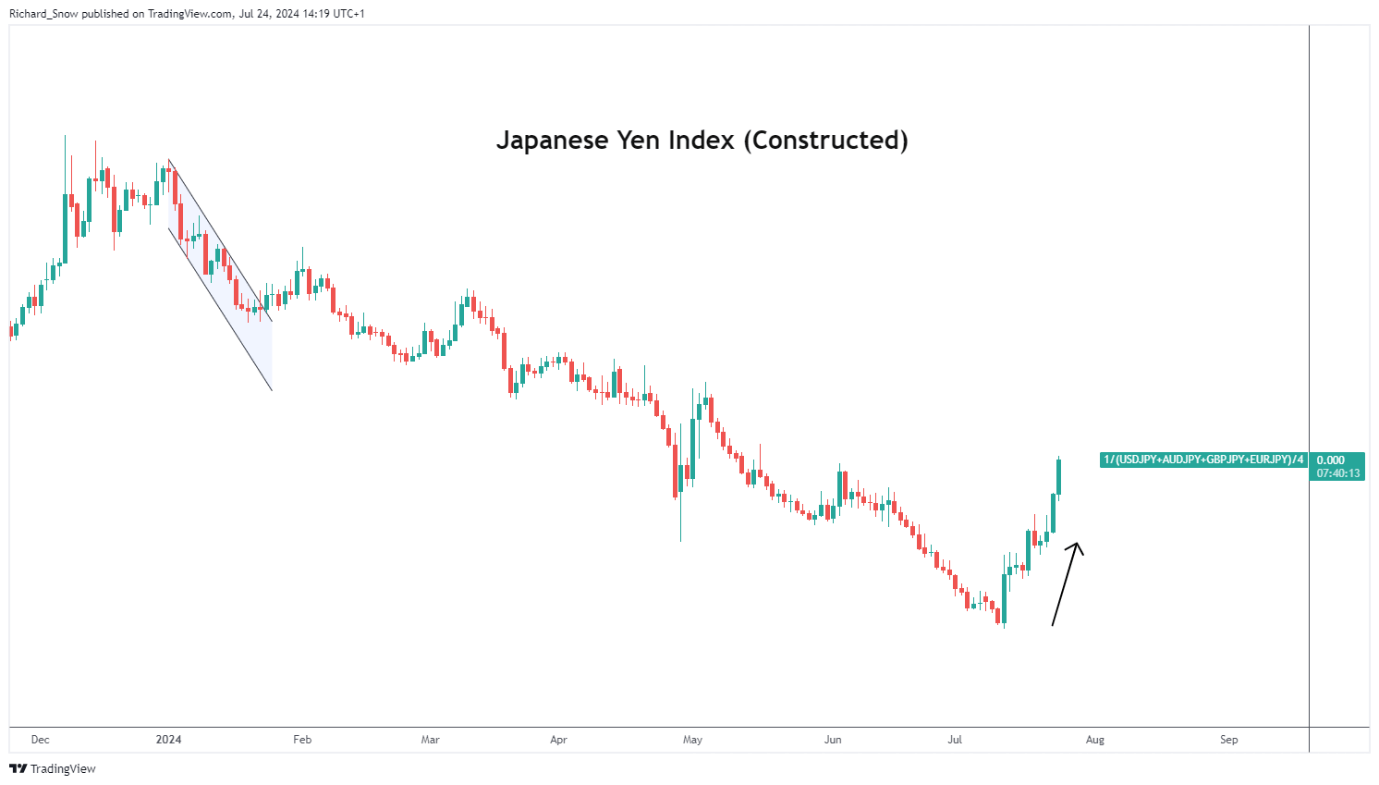
The Yen Makes up More Ground Against the Dollar

The Japanese yen appreciated against a basket of major currencies on Wednesday, one week ahead of the much-anticipated Bank of Japan (BoJ) meeting. The BoJ mentioned in their June meeting that details around reducing their balance sheet will be made available at the end of this month after disappointing market hopefuls last month.

Japan is in the slow process of policy normalisation whereby it is expected to hike rates to a neutral that is neither stimulatory nor restrictive – said to be anywhere between 0.5% and 1.5% – but is weighing up encouraging inflation data against less than stellar consumption data.

It is hoped that reduced taxes and higher wages would stimulate a rise in local consumption and household sentiment to such a degree that the inflation target of 2% is likely to be breached consistently.

Japanese Index (Equal-Weighting in USD/JPY, GBP/JPY, AUD/JPY, EUR/JPY)

A graph with red and blue lines  Description automatically generated

USD/JPY Technical Analysis

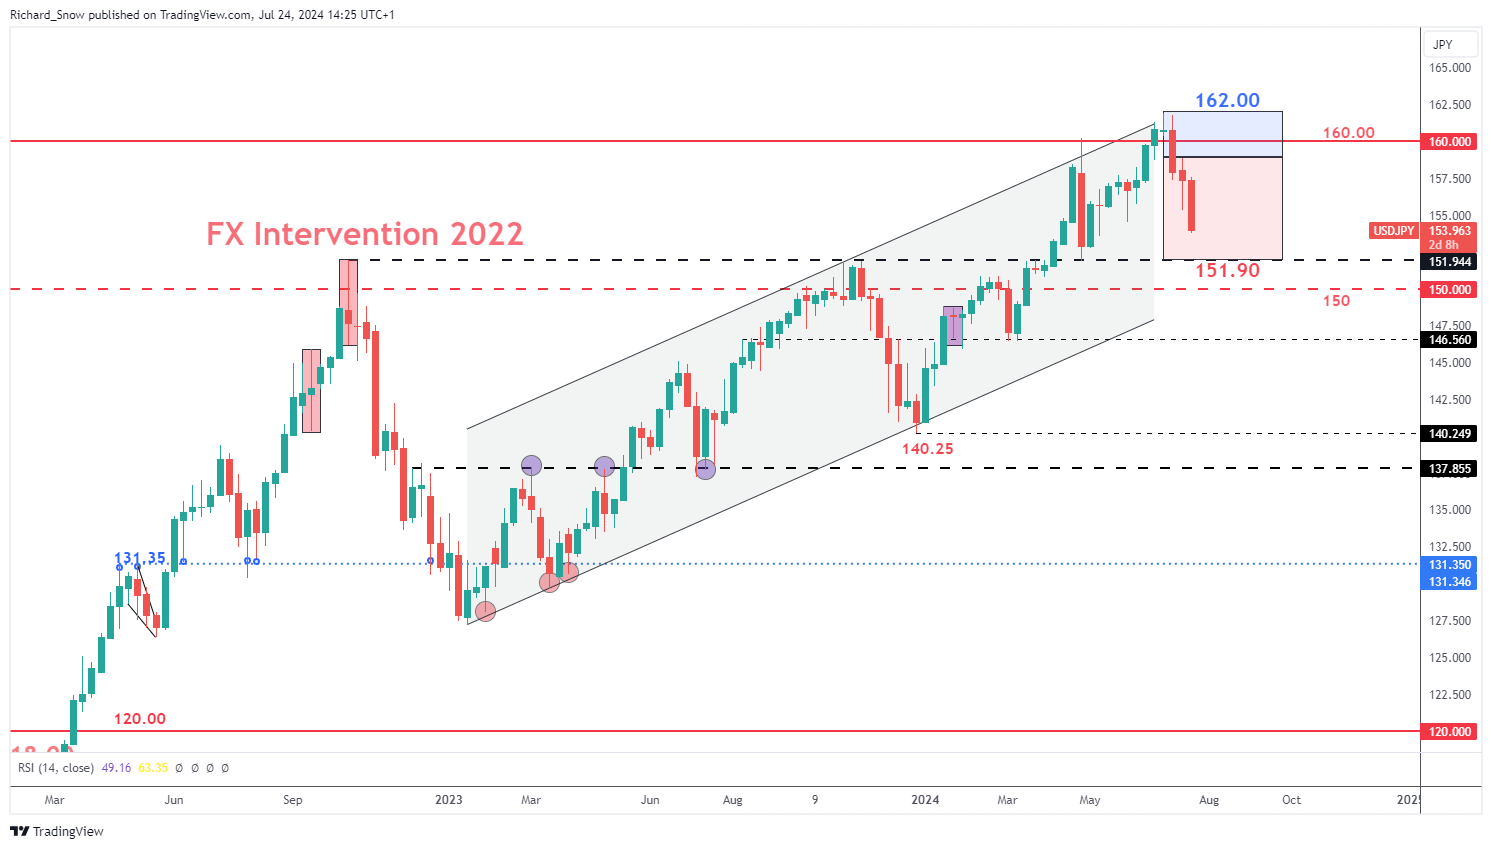
The weekly USD/JPY chart reveals the anticipated Q3 trading range, highlighting both the upward drift at the start of the quarter, followed by the much-anticipated move lower as the yen claws back significant losses. The next level of significance is the 151.90 level of support which market the moment Tokyo decided to intervene in the FX market back in 2022. Get the full insight of surrounding the many factors influencing the yen in our comprehensive Q3 forecast:

USD/JPY Weekly Chart

A graph of stock market  Description automatically generated

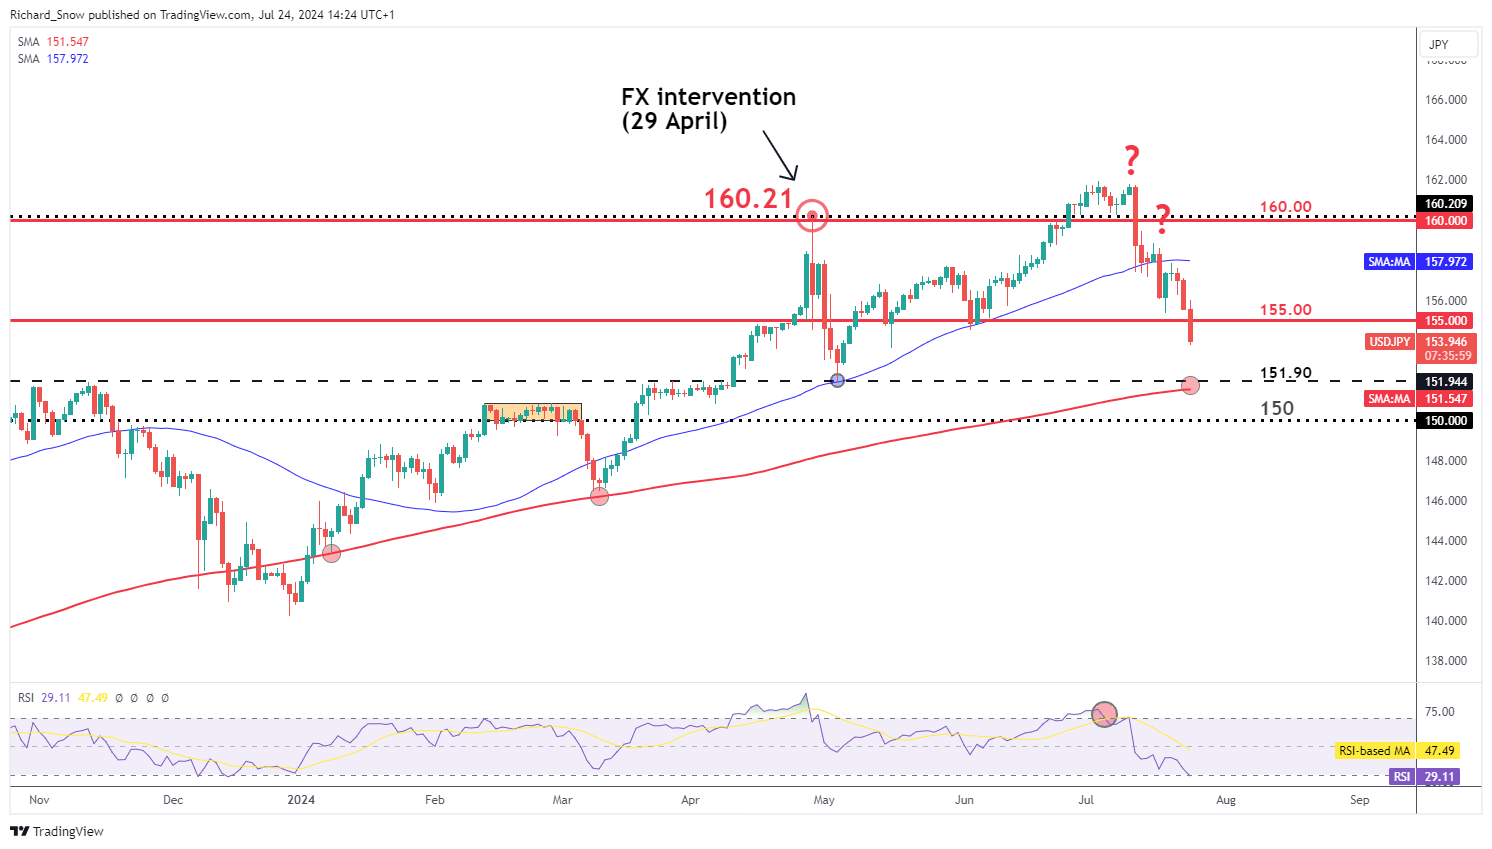
The daily USD/JPY chart shows the recent progress made by the yen, aided by a weaker US dollar and suspected FX intervention from FX officials. Markets have been wrong-footed by Japanese officials as it appears mass yen purchases are being carried out after good news such as lower than expected US inflation. This is in contrast to previous mass yen purchases which were deployed in a reactionary fashion after bad news for the yen like hotter than expected US inflation or economic growth.

The daily chart shows the oversold conditions that hinted at shorter-term bearish reversal which ultimately materialised. Since then, the pair has been riding the bearish wave lower, tagging the 160.00 and 155.00 markers on the way down.

This week’s US PCE data could extend the move if inflation surprises to the downside although, a print in line with expectations may continue the general move just at a slower pace. 151.90 and 150 flat present the next levels of support with the 200-day SMA in between the two levels – providing the next big test for yen bulls.

USD/JPY Daily Chart

A graph of stock market  Description automatically generated

BoJ to Decide if Weak Consumption is Likely to Delay Inflation Goal

Next week Wednesday the BoJ will have to decide if recent uninspiring consumption figures are likely to stand in the way of the committee’s inflation goal. Markets expect a 62% chance of a rate hike of 0.1% to move the needle ever so slightly towards the neutral rate. The Bank will also provide greater detail around its plans to reduce its balance sheet by reducing the quantity of Japanese Government Bonds it purchases each month. Previously the BoJ sought to contain government borrowing costs to help stimulate the economy through fiscal spending initiatives. Now that the inflation and wages trend upwards, the Bank can afford to allow yields to rise. Higher yields often result in currency appreciation, especially against currencies linked to central banks that are now engaged in a rate cutting cycle.

Market-implied probability of a 0.1% hike at next week’s BoJ meeting

How to Trade with Long Wick Candles

How to Trade with Long Wick Candles

Long Wicks Can Provide Valuable Trading Signals

Long wick candles are recurrent within the forex market. This makes understanding the meaning behind these candles invaluable to any trader to comprehend the market dynamics during a specific period.

Trading candle wicks is often overlooked due to its simplicity but appreciating this concept can be a great addition to a trader’s repertoire. This article will outline:

  • What are long wick candles?
  • How to identify a long wick candle on forex charts
  • What does a long wick tell us in forex?

hat are long wick candles?

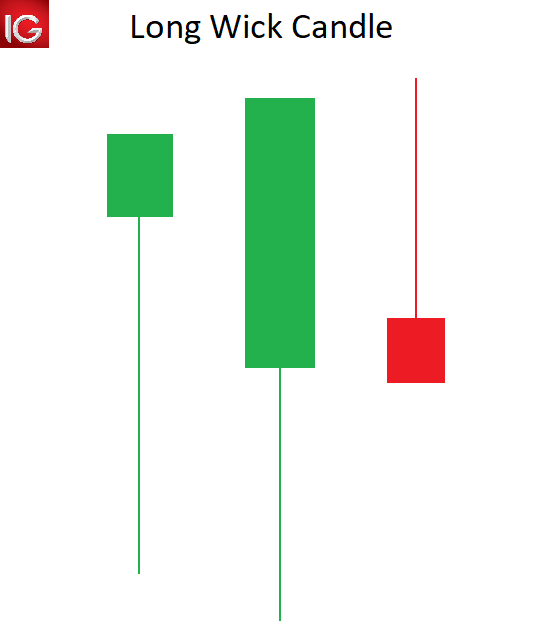
Long wick candles are type of candlestick that have a long wick attached to the candle body. The candle body can be positive or negative, making the long wick appropriate for any type of candlestick.

The length of the candle wick specifies the high and low of price movement within a designated time period. Understanding and trading candlestick wicks can provide forex traders with key tradeable opportunities.

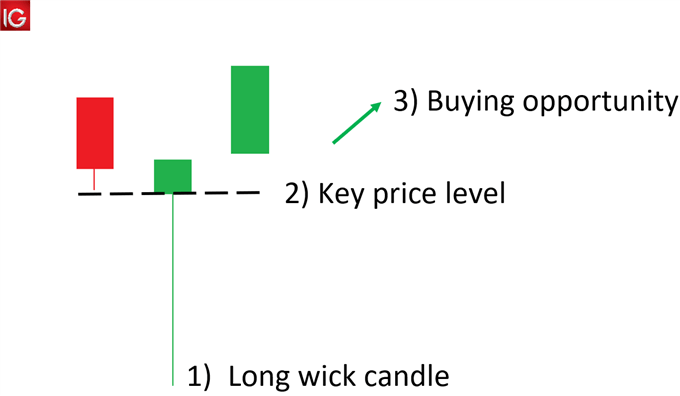
long wicks candle

How to identify a long wick candle on forex charts

  1. Locate long wicks above/below a candle that is disproportionately longer than that of the surrounding wicks.
  2. Use price action to identify key price levels that may coincide with the long wick, signalling levels of support/resistance.
  3. Use the long wicks and key levels to detect potential trade opportunities.

identifying the long wick candle

What does a long wick indicate in forex?

A long wick candle, like shooting stars, gravestone Doji’s and hammers are part of a “family” of reversal candlesticks. Let’s explore an example:

NZD/JPY Long Wick Candles

The chart below shows NZD/JPY on a weekly time frame. Highlighted in blue illustrates long candle wicks prior to a reversal in price movement. In other words, if the longer wick is below the body of the candle, price tends to move up.

Conversely, if the longer wick is above the body of the candle, price tends to move down. These extended wicks (those that are longer relative to other wicks on the chart) provide valuable information for the trader.

trading the long wick candle

A long wick that extends below a candle signifies that sellers were able to push the price down significantly. However, bulls were able to drive price back up showing buyers strength. Since bulls overpowered the selling pressure by bears, there exists the potential that their strength will carry forward leading to an upwards movement in price. The same principal would apply for long wicks appearing above the candle – in the opposite direction.

How can a trader use long wicks in their trading

The first step when utilizing long wicks is to identify the trend (as mentioned above). If the trend is down, seeing a candle (or several candles) with long wicks on the top points to a stronger potential for price to move down in the direction of the market.

Continuing with the downtrend example, if the pair retraces (moves against the trend) and stalls at a level of resistance or a Fibonacci level, traders will look for long wicks at the tops of the candles forming along that resistance line for two reasons:

  1. Those long wicks indicate the potential for the pair to trade to the downside back in the direction of the trend.
  2. The top of that extended wick provides a very prudent level for a trader to place their stop. The rationale for that stop placement being that buyers pushed price to the top of that wick but could not push it beyond that point. Hence, placing the stop just above that wick is a level that has a lower likelihood of getting hit.

There is often confusion amongst traders as to which time frame of chart this strategy can be applied to. For day traders, they may look at 5- or 10-min time frame charts. Swing traders on the other hand may look at other intraday charts like 2-hour or 4-hour charts.

Are you keen to learn about different trading strategies? Learn more about the top 8 forex trading strategies

Taking note of long wicks forming at levels of support or resistance, especially when they signal movement in the direction of the daily trend, can create a beneficial “edge” for the trader.