Australian Dollar Tested Yearly Highs: Analysis For USD/JPY, EUR/USD, AUD/USD, NZD/USD

Australian Dollar Tested Yearly Highs: Analysis For USD/JPY, EUR/USD, AUD/USD, NZD/USD

USD/JPY Settled Close To The 144.00 Level

USD/JPY
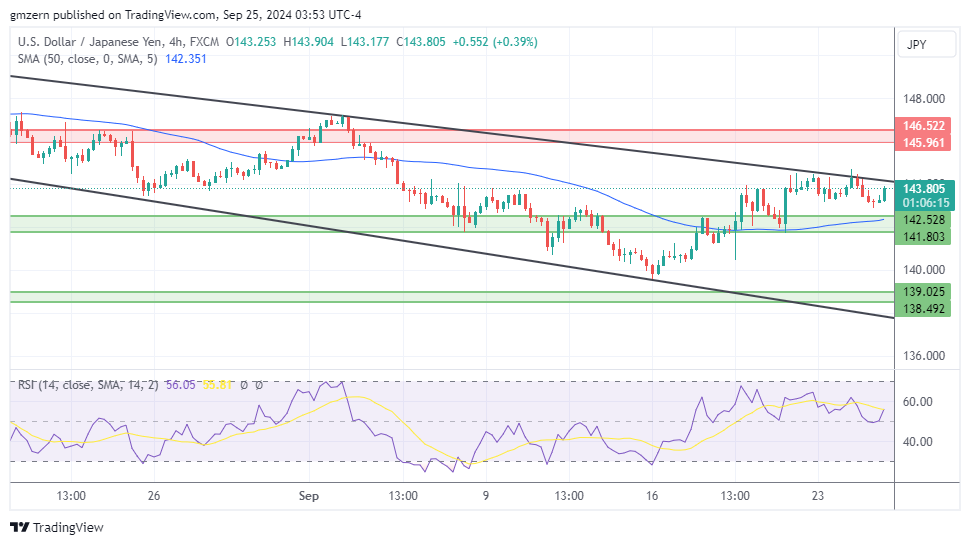
USD/JPY 250924 4h ChartUSD/JPY remains stuck near the 144.00 level as traders wait for additional catalysts. Today, traders will have a chance to take a look at the New Home Sales report for August. The report is expected to show that New Home Sales decreased by 5.1% month-over-month in August.

A move above the 144.00 level will open the way to the test of the nearest resistance at 146.00 – 146.50.

Experts trade the markets with IC Markets

Trading Derivatives carries a high level of risk to your capital and you should only trade with money you can afford to lose. Trading Derivatives may not be suitable for all investors, so please ensure that you fully understand the risks involved, and seek independent advice if necessary. A Product Disclosure Statement (PDS) can be obtained either from this website or on request from our offices and should be considered before entering into a transaction with us. Raw Spread accounts offer spread

EUR/USD Tests Resistance At 1.1185 – 1.1200

EUR/USD
EUR/USD 250924 4h ChartEUR/USD tests resistance at 1.1185 -1.1200 as traders stay bullish. There are no important economic reports scheduled to be released in the Euro Area today, so traders will stay focused on general market sentiment.

RSI is in the moderate territory, so there is plenty of room to gain momentum in case the right catalysts emerge. If EUR/USD settles above the 1.1200 level, it will move towards the next resistance level, which is located in the 1.1280 – 1.1290 range.

AUD/USD Pulled Back From Yearly Highs

AUD/USD
AUD/USD 250924 4h ChartAUD/USD tested yearly highs but lost momentum and pulled back amid profit-taking. Traders focused on the Monthly CPI Indicator, which pulled back from 3.5% in July to 2.7% in August. Analysts expected that Monthly CPI Indicator would drop to 2.8%.

From the technical point of view, AUD/USD is trying to settle above the resistance at 0.6890 – 0.6900. In case this attempt is successful, AUD/USD will move towards the next resistance level, which is located in the 0.6960 – 0.6970 range.

NZD/USD Moved Lower As Precious Metals Markets Declined

NZD/USD
NZD/USD 250924 4h ChartNZD/USD pulled back after an unsuccessful attempt to settle above the 0.6350 level. Traders focused on the pullback in precious metals markets, which was bearish for commodity-related currencies.

In case NZD/USD pulls back below the 0.6300 level, it will head towards the nearest support, which is located in the 0.6235 – 0.6250 range. On the upside, a move above the resistance at 0.6360 – 0.6370 will open the way to the test of the next resistance level at 0.6450 – 0.6460.

Silver (XAG) Daily Forecast: Will $31.65 Support Hold Amid Risk-On Market Sentiment?

Silver (XAG) Daily Forecast: Will $31.65 Support Hold Amid Risk-On Market Sentiment?

Market Overview

Silver (XAG/USD) has sharply dropped, retreating from its early morning high of $32.28 to $31.78. This decline follows a growing risk-on market sentiment, where investors, feeling more optimistic, are shifting their focus from safe-haven assets like silver toward riskier investments.

A contributing factor is China’s recent stimulus measures, encouraging investments in other markets such as stocks and bonds and reducing demand for silver.

Experts trade the markets with IC Markets

Trading Derivatives carries a high level of risk to your capital and you should only trade with money you can afford to lose. Trading Derivatives may not be suitable for all investors, so please ensure that you fully understand the risks involved, and seek independent advice if necessary. A Product Disclosure Statement (PDS) can be obtained either from this website or on request from our offices and should be considered before entering into a transaction with us. Raw Spread accounts offer spread

However, silver remains supported by a weakening U.S. dollar and global uncertainties. The Federal Reserve’s plans for aggressive monetary easing are putting pressure on the dollar, making silver more attractive to investors looking for alternatives.

China’s Stimulus and Impact on Silver Demand

The People’s Bank of China (PBOC) recently cut the reserve requirement ratio (RRR) by 50 basis points and lowered the seven-day repo rate from 1.7% to 1.5%. These measures stimulate economic growth, creating a risk-friendly environment that draws investments away from safe-haven assets like silver.

Despite the temporary dip in demand, silver remains a key investment amid ongoing global uncertainties. Investors are cautious, and the need for security keeps silver in demand, particularly in turbulent economic conditions.

U.S. Dollar Weakness Supports Silver Prices

On the U.S. side, the dollar’s decline has bolstered silver prices. The CME Group’s FedWatch Tool indicates a 75% probability of a 0.50% rate cut by the Federal Reserve in November. Lower interest rates make silver, a non-yielding asset, more appealing in comparison to bonds.

Additionally, U.S. economic data has shown signs of weakness, with Consumer Confidence falling to 98.7 in September, down from 105.6 in August, and a decline in manufacturing activity. These factors are likely to continue supporting silver in the coming months.

Short-Term Forecast

Silver (XAG/USD) faces downside pressure after falling to $31.78. Immediate support at $31.68 could break, pushing prices toward $31.51, while resistance sits at $32.24.

Silver (XAG/USD) Price Forecast: Technical Outlook

Silver – Chart
Silver – ChartSilver (XAG/USD) is trading at $31.78, down 0.98%, as it struggles to break above the key pivot point at $31.89. If silver fails to hold current support at $31.68, it could see further downside towards $31.51 and $31.33.

On the upside, immediate resistance is $32.24, followed by $32.47 and $32.71. The 50-day EMA at $31.40 is a crucial support level, while the 200-day EMA at $30.67 suggests a long-term bullish trend remains intact.

A break below $31.68 could trigger more profit-taking, especially after the 23.6% Fibonacci retracement level at $31.89 was violated. In summary, silver remains bearish, below $32, with a break above signalling renewed bullish momentum.

Australian Inflation Rate Slides to 2.7% in August and into the RBA Target Range

Australian Inflation Rate Slides to 2.7% in August and into the RBA Target Range

Aussie Inflation Puts the RBA in the Spotlight

On Wednesday, September 25, Australian inflation figures influenced buyer demand for the AUD/USD pair. The Australian Monthly CPI Indicator fell from 3.5% in July to 2.7% in August.

Experts trade the markets with IC Markets

Trading Derivatives carries a high level of risk to your capital and you should only trade with money you can afford to lose. Trading Derivatives may not be suitable for all investors, so please ensure that you fully understand the risks involved, and seek independent advice if necessary. A Product Disclosure Statement (PDS) can be obtained either from this website or on request from our offices and should be considered before entering into a transaction with us. Raw Spread accounts offer spread

  • Housing (+2.6%), food and non-alcoholic beverages (+3.4%), and alcohol and tobacco (+6.6%) were the largest contributors.
  • Automotive fuel prices were 7.6% down from August 2023, while electricity prices tumbled 17.9%. Electricity prices were down because of Commonwealth Energy Relief Fund rebates and State Government rebates.
  • The CPI, excluding volatile items and holiday travel, fell from 3.7% in July to 3.0% in August.

AUD/USD Breakout and Inflation Impact on the RBA Rate Path

The softer-than-expected inflation figures could fuel speculation of a Q4 2024 RBA rate cut. On Tuesday, RBA Governor Michele Bullock stated during the press conference that the Monthly CPI Indicator will be important as it captures some services data.

However, she also stated that, while headline inflation may approach the target range, it might not reflect underlying inflation trends. Furthermore, the RBA Rate statement also highlighted that Board members expect inflation to temporarily decline. The forecasts indicate that inflation will not return sustainably to the target until 2026, supporting the AUD/USD breakout toward $0.70.

AUD/USD on a Breakout Despite the Monthly CPI Indicator

The AUD/USD responded to the inflation figures, briefly rising to a high of $0.68963 before falling to a low of $0.68441.

AUD/USD reaction to inflation numbers.
AUDUSD 250924 30 Minute Chart

US Economic Calendar: New Home Sales in Focus

Later in the session on Wednesday, economists expect new home sales will slide by 5.1% in August after surging by 10.6% in July.

A larger-than-expected decline could fuel concerns about consumer sentiment and the US economy. Economists consider housing sector data a barometer for the US economy. Weaker demand for new homes could affect house prices, consumer confidence, and private consumption.

A more marked fall in new home sales may push the AUD/USD toward $0.70.

new home sales trends a litmus test of the US economy.
FX Empire

Short-Term Forecast for AUD/USD

Near-term AUD/USD trends will hinge on the RBA Financial Stability Review on Thursday and Friday’s US Personal Income and Outlays Report.

Concerns about financial stability and the latest inflation figures could further fuel expectations of a Q4 2024 RBA rate cut. However, softer US inflation and weaker personal income/spending could fuel bets on multiple Q4 2024 Fed rate cuts, supporting an AUD/USD move toward $0.70.

Investors should closely monitor central bank signals and economic indicators, which will likely influence AUD/USD trends. Monitor the real-time data, news updates, and expert commentary to adjust your trading strategies.

AUD/USD Technical Analysis

Daily Chart Highlights AUD/USD Breakout

The AUD/USD holds comfortably above the 50-day and 200-day EMAs, following Tuesday’s breakout, affirming the bullish price signals.

A breakout from the morning high of $0.69081 could give the bulls a run at $0.69500. Furthermore, a return to $0.69500 may signal a move toward the $0.70 level.

Traders should consider central bank commentary and US economic indicators, as these will affect AUD/USD price movements.

Conversely, a drop to the $0.68500 level could give the bears a run at the $0.68006 support level. A break below the $0.68006 support level may signal a fall toward the $0.67500 level.

With a 14-period Daily RSI reading of 69.20, the Aussie dollar could return to the morning high of $0.69081 level before entering overbought territory.

AUD/USD Daily Chart sends bullish price signals.
AUDUSD 250924 Daily Chart
Oil News: Futures Eye Breakout as Chinese Stimulus and Geopolitical Risks Shake Markets

Oil News: Futures Eye Breakout as Chinese Stimulus and Geopolitical Risks Shake Markets

Crude Oil Prices Rebound as Market Eyes Key Resistance Levels

Crude oil prices edged higher on Tuesday, continuing a rally after a brief two-day dip. Light crude futures are currently testing a critical resistance zone at $72.21, eyeing further upside momentum.

Daily Light Crude Oil FuturesThe 50-day and 200-day moving averages—positioned at $72.48 and $72.97 respectively—are key technical barriers. A breakout above these levels could shift intermediate and long-term market trends. The current price movement reflects a combination of speculative buying and short-covering, driven by rising geopolitical tensions and market positioning.

Experts trade the markets with IC Markets

Trading Derivatives carries a high level of risk to your capital and you should only trade with money you can afford to lose. Trading Derivatives may not be suitable for all investors, so please ensure that you fully understand the risks involved, and seek independent advice if necessary. A Product Disclosure Statement (PDS) can be obtained either from this website or on request from our offices and should be considered before entering into a transaction with us. Raw Spread accounts offer spread

Chinese Stimulus Sparks Optimism in Oil Markets

One of the key drivers behind the recent rise in oil prices has been China’s announcement of a major monetary stimulus package. As the world’s largest crude importer, China’s economic health significantly impacts global oil demand. On Tuesday, the People’s Bank of China introduced its largest stimulus package since the COVID-19 pandemic, aimed at countering economic deflation and meeting growth targets.

This broader-than-expected package includes funding boosts and rate cuts, leading traders to bet on stronger oil demand from China in the coming months. Tony Sycamore, an analyst at IG Markets, noted, “The crude oil market has been looking desperately towards Chinese authorities for further easing measures to counter the economic slowdown.”

However, for oil’s rally to be sustained, analysts caution that China’s monetary efforts need to be paired with fiscal policies to spur internal demand. According to Kelvin Wong from OANDA, “China’s accommodative policies must be backed by fiscal support to truly lift demand.”

Middle East Tensions Add Risk Premium to Oil

Ongoing geopolitical tensions in the Middle East have also added a risk premium to crude prices. Israeli airstrikes on Hezbollah sites in Lebanon, which escalated this week, have heightened concerns about potential disruptions in oil supply from the region. While there is no immediate threat to production, the volatility in the region keeps traders on alert, as any escalation could tighten global supply.

Hurricane Helene Threatens U.S. Oil Supply

In addition to geopolitical risks, a developing tropical disturbance in the Gulf of Mexico poses another threat to crude supplies. Expected to become a hurricane named Helene, the system is projected to make landfall in Florida later this week. This would mark the eighth named storm of the 2024 Atlantic hurricane season. The storm’s potential impact on oil production in the Gulf has contributed to upward pressure on prices.

Market Forecast: Bullish Outlook for Crude Prices

Given the combination of factors—rising geopolitical risks, China’s economic stimulus, and the looming threat of Hurricane Helene—crude oil prices are likely to maintain upward momentum in the near term. The market is now focused on whether prices can decisively break through the $72.48 and $72.97 resistance levels. If geopolitical risks escalate further or supply disruptions occur, oil prices could push even higher, with $75 as the next key target. Therefore, the short-term outlook for crude oil remains bullish.

TIA Price Surges 32% as Celestia Announces $100M Funding

TIA Price Surges 32% as Celestia Announces $100M Funding

Why is TIA Price Going Up?

Celestia’s TIA token price crossed $6.20 mark on Sept 24, up 32% in the last 24 hours as markets reacted to the layer-1 network’s successful $100 million funding round, led by Bain Capital Crypto.  How far can TIA price go?

Celestia Announces Fresh $100M Funding Round

On Sept 23, The Celestia Foundation announced that it has secured $100 million in a new funding round led by Bain Capital Crypto. This fresh capital injection raises the total funds for the modular layer-1 blockchain project to $155 million.

Experts trade the markets with IC Markets

Trading Derivatives carries a high level of risk to your capital and you should only trade with money you can afford to lose. Trading Derivatives may not be suitable for all investors, so please ensure that you fully understand the risks involved, and seek independent advice if necessary. A Product Disclosure Statement (PDS) can be obtained either from this website or on request from our offices and should be considered before entering into a transaction with us. Raw Spread accounts offer spread

Since launching its Mainnet Beta in October 2023, Celestia (TIA) has been pushing the boundaries of blockchain technology with its innovative modular architecture.

Unlike traditional monolithic Layer 1 blockchains, Celestia enables developers to build highly scalable, high-throughput applications across multiple virtual machines or rollup frameworks.

Celestia Foundation Announces $100M Funding Round |Celestia.orgCelestia’s latest technical roadmap outlines its ambition to scale block throughput to 1 gigabyte. If achieved, this would place Celestia far beyond the capabilities of legacy systems like Visa, which handles around 24,000 transactions per second (TPS). The platform is on track to deliver throughput comparable to running multiple Visa networks simultaneously.

“We’ve transitioned from the blockchain dial-up era to broadband, and now we aim to take it to the fiber optic level—all while maintaining verifiability and low latency.”

Celestia Co-founder Mustafa Al-Bassam.

Celestia’s ongoing innovation in the data availability layer continues to attract attention from both developers and investors as it targets groundbreaking improvements in blockchain scalability and performance.

TIA Price Surges 32% on Celestia’s $100M Funding Round

The announcement of Celestia’s $100 million funding round has had an immediate impact on its native token, TIA, which surged 32% in 24 hours.

Between September 23 and 24, TIA’s price climbed from $5.25 to $6.90, reflecting heightened investor confidence. The surge can be attributed to several factors tied to the announcement.

TIA Price Surges 32% After $100 Celestia Announced $100M Funding Round

TIA Price Surges 32% After $100 Celestia Announced $100M Funding RoundAt the time of writing on Tuesday, Sept 24, Celestia price has retraced towards the $6.19 level. However, bull traders could still shoot for more gains in the days ahead.

Firstly, capital injections of this magnitude often signal strong backing from reputable institutions, reassuring the market of a project’s long-term viability.

In this case, Bain Capital Crypto and other prominent investors endorsing Celestia’s roadmap for scaling blockchain throughput was a major validation, prompting swift bullish sentiment around TIA.

Secondly, such investments often create a halo effect in the crypto markets, where strategic funding rounds are viewed as catalysts for growth.

Investors anticipate that with more capital, Celestia will accelerate its development pipeline, directly enhancing the utility and demand for its native token. This speculative optimism drives short-term price gains as market participants seek to front-run the perceived value increase.

Overall, the rapid TIA price appreciation reflects both confidence in Celestia’s technological advancements and broader market dynamics that reward strong investment signals. However, whether these gains are sustained depends on the project’s execution in scaling throughput as promised.

TIA Price Forecast: More Gains Ahead if $6 Support Holds

Celestia’s TIA token crossed the $6.20 mark on September 24, experiencing a 32% surge within 24 hours following the announcement of a successful $100 million funding round, led by Bain Capital Crypto.

This surge reflects the market’s reaction to the bullish sentiment surrounding Celestia’s layer-1 scalability potential. How far can TIA price go?

The Relative Strength Index (RSI), which measures the speed and change of price movements, stands at 61.83, indicating bullish momentum but nearing overbought territory.

The RSI suggests that the rally could continue but also signals potential exhaustion if the indicator surpasses 70.

Celestia (TIA) price prediction | TIAUSD

Celestia (TIA) price prediction | TIAUSDSimultaneously, the Bollinger Bands, a volatility indicator, show that TIA’s price is currently above the upper band at $6.61, implying short-term overextension. When prices exceed the upper band, a pullback towards the middle band (currently near $4.90) often occurs. However, if TIA can maintain momentum above $6.20, a push toward $7.50 could be the next major target.

In conclusion, while TIA remains bullish in the short term, key levels at $6.20 support and $7.50 resistance will determine the next move. A dip below $5.50 could signal consolidation.

China Unleashes Stimulus: Will It Prevent a Global Slowdown or Fuel Inflation?

China Unleashes Stimulus: Will It Prevent a Global Slowdown or Fuel Inflation?

China’s unveiling of a wide-ranging stimulus package to reignite its slowing economy has reignited discussions about its potential impact on global markets and commodities. With measures ranging from interest rate cuts to easing mortgage burdens, the People’s Bank of China’s (PBOC) latest move is designed to stimulate consumer and business confidence. However, the question remains: Is this enough to sustain meaningful growth, or is it a temporary boost with inflationary risks and broader implications for the global economy?

Daily CSI 300 Index

China’s Stimulus: A Global Boost for Commodities?

China’s economy is deeply tied to global commodity demand, particularly in areas like oil, copper, and iron ore. As the world’s largest consumer of raw materials, any positive shift in China’s economic outlook tends to ripple through global commodity markets. The latest stimulus measures have already triggered a rally in oil and copper prices, with iron ore seeing its biggest intraday gain in over a year. While this is good news for commodity traders in the short term, the sustainability of this rally depends largely on how effectively China can implement these measures and foster real economic growth.

Experts trade the markets with IC Markets

Trading Derivatives carries a high level of risk to your capital and you should only trade with money you can afford to lose. Trading Derivatives may not be suitable for all investors, so please ensure that you fully understand the risks involved, and seek independent advice if necessary. A Product Disclosure Statement (PDS) can be obtained either from this website or on request from our offices and should be considered before entering into a transaction with us. Raw Spread accounts offer spread
Daily Copper (XCUUSD)The surge in commodity prices following China’s stimulus announcements highlights the fragile nature of the global market’s dependence on Chinese demand. However, many analysts caution that the impact may be fleeting unless further targeted measures, particularly in the property and infrastructure sectors, are enacted. As Jefferies economist Mohit Kumar noted, while the stimulus provides a “positive backdrop,” it may not fundamentally shift the outlook without more aggressive policy interventions.

Daily Iron Ore Spot

Potential Inflationary Pressures

While China’s economic recovery is crucial to stabilizing global markets, the potential inflationary effects cannot be ignored. Commodity price spikes, particularly in energy and metals, could fuel inflation globally. Countries already grappling with high inflation due to supply chain disruptions and geopolitical tensions may face further upward pressure on prices if China’s demand surges. This could complicate the efforts of central banks in countries like the U.S. and Europe, which are already trying to balance economic growth with inflation control.

A Sign of Global Economic Woes?

The need for such aggressive intervention from China is a stark reminder of the challenges the global economy faces. China’s economic struggles, particularly in the real estate sector, mirror broader concerns about slowing global growth. A deflationary trend had set in earlier this year, prompting fears of stagnation in the world’s second-largest economy. If China’s stimulus measures fail to gain traction, it could exacerbate global economic uncertainty, particularly for export-driven economies that depend on Chinese consumption.

In conclusion, while China’s latest stimulus package offers a glimmer of hope for global markets and commodities, its long-term effectiveness remains in question. The potential inflationary risks and broader economic challenges underscore the delicate balance that policymakers must strike to ensure a sustainable recovery without triggering unintended consequences.

Bitcoin Keeps at Heights, Litecoin Pushes Back From Resistance

Bitcoin Keeps at Heights, Litecoin Pushes Back From Resistance

Bitcoin Steady at 200-Day MA, Litecoin Tests Resistance at $67

The cryptocurrency market corrected 0.5% to levels from a day earlier to $2.22 trillion, continuing to settle at the top near the previous month’s peak. As quite expected, cryptocurrency selling intensified near the previous peak. The cryptocurrency market will need to rise another nearly 3% to validate the breaking of the multi-month downtrend.


Bitcoin‘s previous four daily candles and today’s candles show a very moderate end-of-day trend with relatively impressive intraday swings. The battle for the 200-day moving average continues. In this case, the former cryptocurrency is moving up more cautiously than the stock market.

Experts Trade Ethereum with IC Markets

Trading Derivatives carries a high level of risk to your capital and you should only trade with money you can afford to lose. Trading Derivatives may not be suitable for all investors, so please ensure that you fully understand the risks involved, and seek independent advice if necessary. A Product Disclosure Statement (PDS) can be obtained either from this website or on request from our offices and should be considered before entering into a transaction with us. Raw Spread accounts offer spread

Last week, Litecoin overcame the resistance of the descending channel, inside which it has been trading since May. However, selling intensified as it approached the horizontal resistance level just above $67, which turned the price downward for the fourth time in the last five weeks. A return of risk appetite in global markets will help validate the break of the downtrend, sending the price to $74 (+12%). Intensifying selloffs will force the price to look for support at $60 (-10%) as soon as possible.

Crypto News

According to CoinShares, investments in crypto funds rose by $321 million last week after inflows of $436 million a week earlier. Bitcoin investments were up $284 million, while Solana was up $3 million; Ethereum was down $29 million. Investments in funds with multiple crypto assets were up $54 million.

The inflow of funds last week was probably caused by the US Federal Reserve’s decision to cut the interest rate by 50 basis points at once. As a result, total assets under management (AUM) rose 9% to $9.5bn. Ethereum remains the exception, with outflows for the fifth week in a row. This is due to persistent outflows from Grayscale Trust and meagre inflows into the recently launched Ethereum-ETFs, CoinShares noted.

Larry Fink, CEO of BlackRock, said Bitcoin is a legitimate financial instrument that can diversify risk. In his view, it is an instrument that ‘people invest in as soon as they become fearful of the market.’

The average transaction fee on the Ethereum network rose to $3.98, almost fivefold from $0.85 in early September. Uniswap tops the ranking of the most gas-consuming apps.

US Dollar Price Forecast: DXY Nears $101; GBP/USD and EUR/USD Outlook

US Dollar Price Forecast: DXY Nears $101; GBP/USD and EUR/USD Outlook

Dollar Index Holds Steady Ahead of Key Economic Data

The Dollar Index (DXY) is trading near 100.90, holding steady as investors await critical U.S. economic data releases. Key figures, such as the S&P/CS Composite-20 HPI and CB Consumer Confidence, are due, potentially influencing market direction.

The Richmond Manufacturing Index is also expected to offer insights into economic health. Additionally, comments from FOMC Member Bowman could further impact market sentiment.

Experts trade the markets with IC Markets

Trading Derivatives carries a high level of risk to your capital and you should only trade with money you can afford to lose. Trading Derivatives may not be suitable for all investors, so please ensure that you fully understand the risks involved, and seek independent advice if necessary. A Product Disclosure Statement (PDS) can be obtained either from this website or on request from our offices and should be considered before entering into a transaction with us. Raw Spread accounts offer spread

US Dollar Index (DXY) – Technical Analysis 

The Dollar Index (DXY) is trading at $100.907, down slightly by 0.01%, as it hovers near its short-term support levels. The index is currently below the pivot point of $101.049, which suggests some bearish pressure in the market.

Immediate support is at $100.730, with further support levels at $100.509 and $100.227. Resistance is found at $101.228 and climbs higher toward $101.675.

Dollar Index Price Chart - Source: Tradingview
Dollar Index Price Chart
The 50-day EMA at $100.866 and the 200-day EMA at $100.950 are nearly converging, reflecting a period of consolidation.

A break above the pivot point could shift sentiment back to bullish, but if the index remains below $101.049, it may face further downside pressure in the near term.

Sterling Weakens After Disappointing PMI Data

The British pound (GBP) weakened slightly following the release of lower-than-expected Flash Manufacturing PMI at 51.5 and Flash Services PMI at 52.8. Both figures missed forecasts, raising concerns about the U.K.’s economic momentum.

Additionally, the CBI Industrial Order Expectations came in at -35, below expectations, adding to bearish sentiment for the pound.

GBP/USD Technical Forecast

The GBP/USD is trading at $1.33531, up 0.06%, showing a slight upward movement during the session. The price is holding above the 50-day EMA at $1.33204, which signals short-term bullish momentum.

Immediate resistance stands at $1.3366, with further levels at $1.34009 and $1.34424.

GBP/USD Price Chart - Source: Tradingview
GBP/USD Price Chart
On the downside, immediate support is at $1.32718, followed by $1.32339 and $1.31976.

The pivot point sits at $1.33081, a key level to watch. A sustained break above this could signal continued bullish momentum, while a drop below may increase selling pressure.

Euro Dips as German Business Climate Falls Short

The euro (EUR) softened after Germany’s ifo Business Climate index dropped to 85.4, below the forecast of 86.1, signaling weakening sentiment in Europe’s largest economy.

Investors are now eyeing the Belgian NBB Business Climate data and remarks from German Buba President Nagel for further economic direction.

EUR/USD Technical Forecast

The EUR/USD pair is trading at $1.11234, up 0.04%, showing modest gains during today’s session. The price sits just above the 50-day EMA at $1.11293, signalling mild bullish momentum.

Immediate resistance is at $1.11433, with further resistance levels at $1.11760 and $1.12039.

On the downside, immediate support is found at $1.10831, followed by $1.10679 and $1.10486.

EUR/USD Price Chart - Source: Tradingview
EUR/USD Price ChartIf EUR/USD stays above the pivot point of $1.11039, it could continue moving higher. However, a break below this key level could trigger sharper selling pressure.

Pound Sterling falls back as UK PMI fails to meet estimates

Pound Sterling falls back as UK PMI fails to meet estimates

The Pound Sterling (GBP) falls on Monday, driven by weaker-than-expected preliminary United Kingdom (UK) S&P Global Purchasing Managers’ Index (PMI) data for September and dismal market sentiment. The British currency underperforms against its major peers, except for the Euro (EUR), which has also been weighed down by the unexpected decline into contraction territory of the Eurozone PMI.

The UK Composite PMI came in at 52.9, down from 53.8 in August, suggesting that economic activity in the UK expanded at a slower pace. The indexes for both the manufacturing and the service sectors declined more than expected.

Still, the impact of the slower growth suggested by the PMI data is expected to remain limited considering comments from Chris Williamson, Chief Business Economist at S&P Global Market Intelligence, who appears to be upbeat on the overall economic outlook.

“A slight cooling of output growth across manufacturing and services in September should not be seen as too concerning, as the survey data are still consistent with the economy growing at a rate approaching 0.3% in the third quarter, which is in line with the Bank of England’s forecast,” Williamson said.

Going forward, the Pound Sterling’s valuation will be guided by market expectations over the Bank of England (BoE) interest-rate outlook. Traders expect the BoE to cut only once in the remaining two monetary policy meetings this year. The BoE kept its key borrowing rates unchanged at 5% last Thursday, with an 8-1 vote split, after cutting them by 25 basis points (bps) in August.

US Dollar Price Forecast: DXY Nears $101; GBP/USD and EUR/USD Outlook

US Dollar Price Forecast: Euro and UK PMIs Disappoint; GBP/USD and EUR/USD Outlook

Dollar Index Steady Ahead of Key PMI Releases

The U.S. Dollar Index remains stable as markets await crucial PMI data. Flash Manufacturing PMI is expected at 47.9, while Flash Services PMI is forecasted to come in at 55.7.

Traders are also eyeing speeches from FOMC members Goolsbee and Kashkari later in the day, which could provide further insights into the Federal Reserve’s policy direction.

Experts trade the markets with IC Markets

Trading Derivatives carries a high level of risk to your capital and you should only trade with money you can afford to lose. Trading Derivatives may not be suitable for all investors, so please ensure that you fully understand the risks involved, and seek independent advice if necessary. A Product Disclosure Statement (PDS) can be obtained either from this website or on request from our offices and should be considered before entering into a transaction with us. Raw Spread accounts offer spread

Any significant deviation from the expected PMI figures could trigger volatility in the dollar.

US Dollar Index (DXY) – Technical Analysis 

The Dollar Index (DXY) hovers around $100.772, showing no significant movement. The chart is at a critical pivot point of $100.934, and the next moves could provide clues on where it’s headed.

Immediate resistance is found at $101.201, with higher targets at $101.471 and $101.821.

On the downside, support is seen at $100.527, with further levels at $100.227 and $99.943, offering a potential safety net.

Dollar Index Price Chart - Source: Tradingview
Dollar Index Price Chart
The 50 EMA sits right at $100.933, indicating a crucial near-term threshold. Meanwhile, the 200 EMA is higher at $101.704, suggesting that longer-term trends remain more bearish.

A break above $100.934 would signal renewed bullish momentum, while a failure here keeps the outlook bearish. Watch these levels closely for cues.

Sterling Holds Steady as UK PMI Misses Expectations

The British pound held steady despite weaker-than-expected PMI data. The UK’s Flash Manufacturing PMI came in at 51.5, missing the forecast of 52.3, while the Services PMI dropped to 52.8, slightly below the anticipated 53.5.

While the figures indicate a minor slowdown, they remain in expansion territory, offering some support to the GBP.

GBP/USD Technical Forecast

The GBP/USD pair is currently trading at $1.32655 within an upward price channel. The immediate support level sits at $1.32186, while further downside support levels are $1.31672 and $1.31107.

On the upside, resistance stands at $1.33391, with further targets at $1.33799.

GBP/USD Price Chart - Source: Tradingview
GBP/USD Price Chart
The 50 EMA is at $1.32105, slightly below the current price, signalling short-term bullish momentum. The 200 EMA at $1.30845 shows long-term support, which aligns with the overall uptrend.

Despite a brief dip, the pair remains within the ascending channel, suggesting continued upward potential if support holds. The key to watch will be any break below $1.32186 for the potential downside.

Euro Slips as Eurozone PMI Data Misses Forecasts

The Euro faced downward pressure on Monday, with French and German Flash PMI figures coming in below expectations. French Manufacturing PMI fell to 44.0, below the forecast of 44.3, while Services PMI dropped sharply to 48.3 from a previous 53.0.

German Manufacturing PMI also disappointed at 40.3, reflecting ongoing weakness in the sector. The broader Eurozone Manufacturing PMI posted 44.8, below the expected 45.7.

Services PMI showed some resilience at 50.5 but still missed forecasts. These weak numbers heighten concerns over a potential economic slowdown across the Eurozone.

EUR/USD Technical Forecast

The EUR/USD shows short-term bearish momentum on the 4-hour chart, with the price near $1.10842. Immediate support lies at $1.10683, and a break lower could test $1.10334 and $1.10009.

On the upside, resistance stands at $1.11902, with the next targets at $1.12237 and $1.12800 if bulls regain control.

EUR/USD Price Chart - Source: Tradingview
EUR/USD Price Chart
The 50 EMA at $1.11175 is just above the current price, suggesting short-term weakness, while the 200 EMA at $1.10534 offers stronger support