
Stock Traders Bet on Another 50-Point Fed Cut – Are More S&P 500 Record Highs Ahead?

Stock Traders Bet on Another 50-Point Fed Cut – Are More S&P 500 Record Highs Ahead?

U.S. Stocks Rally as Markets Eye Another Fed Rate Cut

U.S. stock futures surged early Thursday, buoyed by optimism following the Federal Reserve’s recent decision to cut interest rates by 50 basis points. This marked the first rate reduction since the early days of the COVID-19 pandemic, signaling the Fed’s commitment to easing monetary policy to counter economic softening.
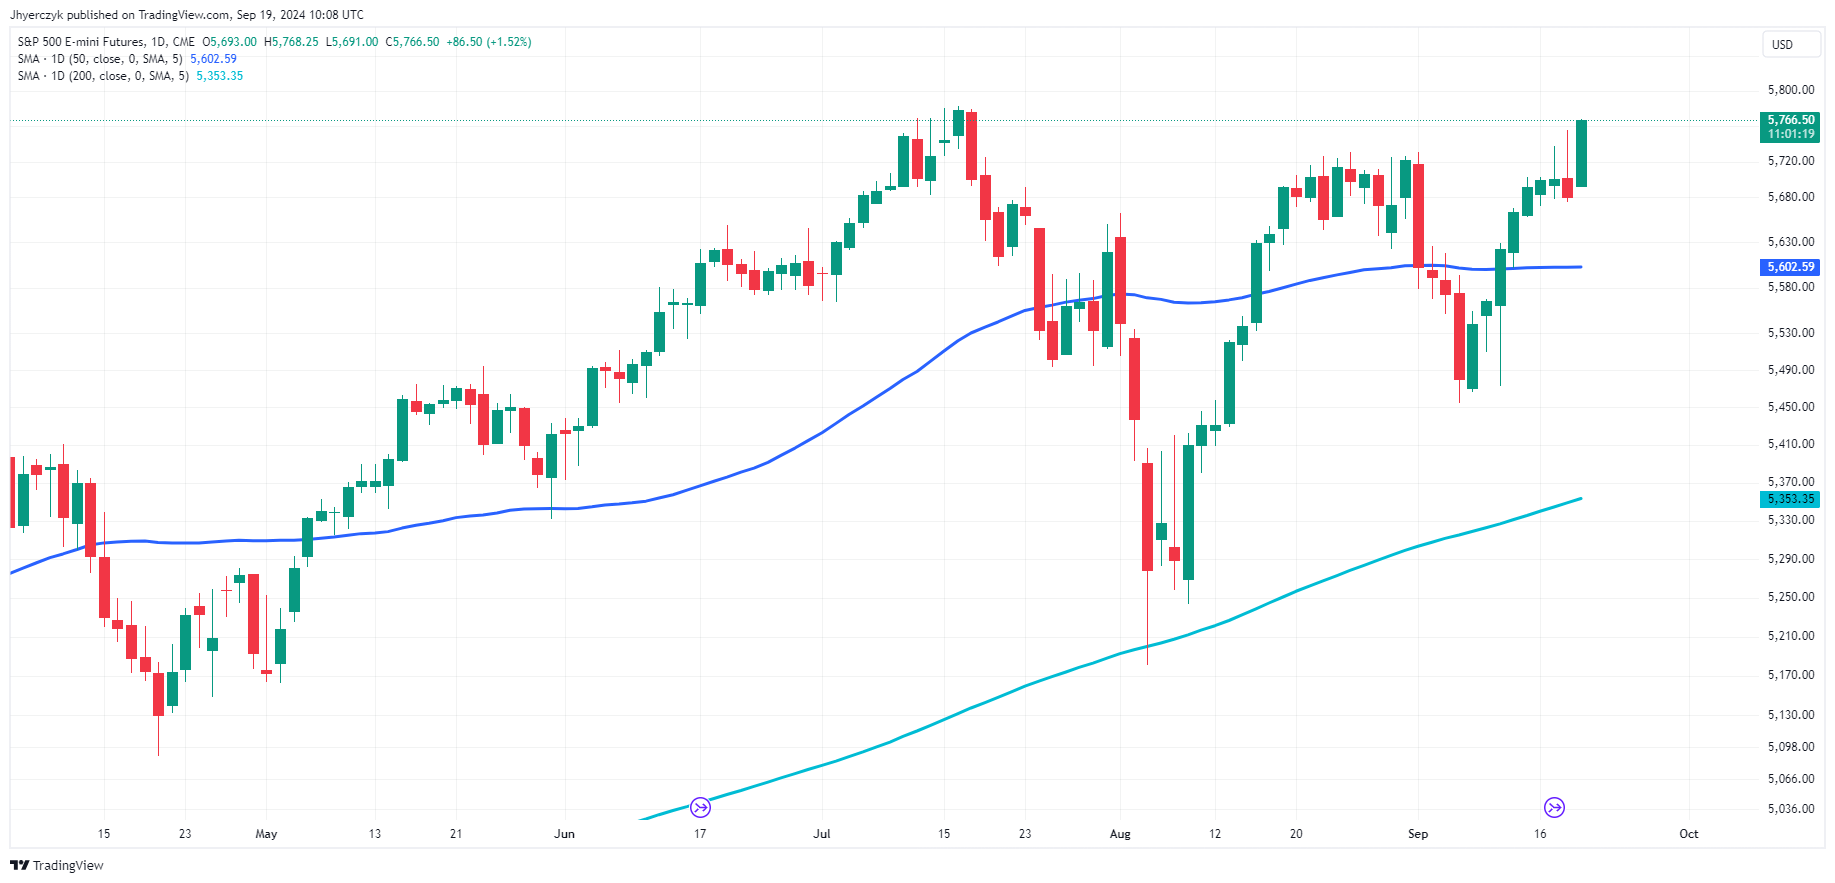
Daily E-mini S&P 500 Index

A Second 50 Basis Point Cut Possible?

Traders are speculating that if the Federal Reserve is willing to cut by 50 basis points now, it could do so again at its upcoming meetings in November or December. While Fed Chair Jerome Powell downplayed the possibility, saying, “this process evolves over time” and cautioning against pre-commitments, the market remains optimistic. The Fed’s “dot plot,” which maps out future interest rate expectations, indicates another 50 basis points of rate cuts could be on the table before the end of 2024.

Experts trade the markets with IC Markets

Trading Derivatives carries a high level of risk to your capital and you should only trade with money you can afford to lose. Trading Derivatives may not be suitable for all investors, so please ensure that you fully understand the risks involved, and seek independent advice if necessary. A Product Disclosure Statement (PDS) can be obtained either from this website or on request from our offices and should be considered before entering into a transaction with us. Raw Spread accounts offer spread

The central bank now sees the federal funds rate at 4.4% by the end of the year, down from the current range of 4.75%-5%. Powell’s comments suggested no rush, but with two more meetings left this year, the possibility of an aggressive cut still lingers.

Inflation and Employment Signals

The Fed cited confidence in inflation’s downward trend toward its 2% target as one reason for the recent cut. The post-meeting statement indicated that inflation risks are now more balanced, and the latest projections show inflation falling to 2.3% from 2.6% this year, with core inflation dropping to 2.6%. Meanwhile, the Fed raised its unemployment rate projection to 4.4%, acknowledging the slowdown in job gains.

However, Powell stressed that the Fed’s goal remains to curb inflation without triggering a significant rise in unemployment. With inflation easing and employment data holding steady, further rate cuts might be needed to maintain the balance the Fed desires.

Historical Context and Future Outlook

The Fed’s half-point cut, while significant, is not unprecedented. During the 2008 financial crisis and the early COVID-19 pandemic, the Fed used similar tools to stabilize the economy. Traders now believe that the Fed may replicate this strategy if the economic outlook doesn’t improve swiftly. The fact that inflation has moderated and the labor market remains soft suggests that the Fed may have room for another large cut.

Powell’s reluctance to pre-commit, however, keeps markets on edge. As more data on inflation and employment roll in, November’s meeting could still present a chance for another bold move. With the dot plot projecting rates to reach 3.4% in 2025 and 2.9% by 2026, the likelihood of further cuts is strong.

Market Forecast: Bullish Sentiment

Given the Fed’s actions and the market’s optimistic reaction, a bullish outlook seems to dominate. Stock markets have rallied on hopes of more rate cuts, and with inflation trending downward, investors are betting that looser monetary policy will continue to support economic growth and equity performance in the near term. If the Fed cuts another 50 basis points in November, we can expect a sustained rally in risk assets.

AUD/JPY moves above 96.00 after paring losses, possibly driven by improved risk sentiment

AUD/JPY moves above 96.00 after paring losses, possibly driven by improved risk sentiment

AUD/JPY trims its intraday losses, trading around 96.10 during the European hours on Wednesday. However, the AUD/JPY cross may hold losses as the Japanese Yen (JPY) receives support from the hawkish sentiment surrounding the Bank of Japan’s (BoJ) policy outlook.

Traders await the US Federal Reserve’s (Fed) interest rate decision scheduled to be released later in the North American session. The focus will shift toward the BoJ policy decision on Friday, with expectations of keeping rates unchanged while leaving the possibility open for further rate hikes.

Japanese Finance Minister Shunichi Suzuki stated on Tuesday that rapid foreign exchange (FX) fluctuations are undesirable. Suzuki emphasized that officials will closely monitor how FX movements affect the Japanese economy and people’s livelihoods. The government will continue to assess the impact of a stronger Japanese Yen and respond accordingly, according to Reuters.

The downside of the AUD/JPY cross could be restrained as the Australian Dollar (AUD) receives support from the Reserve Bank of Australia’s (RBA) hawkish stance on monetary policy outlook. RBA Governor Michele Bullock stated that it is premature to consider rate cuts due to persistently high inflation. Additionally, RBA Assistant Governor Sarah Hunter noted that while the labor market remains tight, wage growth appears to have peaked and is expected to slow further.

Investors are now awaiting Australia’s jobs data, including Employment Change and the Unemployment Rate for August, set to be released on Thursday. This report may provide insights into the health of the labor market and may influence expectations regarding the future direction of domestic monetary policy.

AUD/USD advances to over two-week high, 0.6800 mark in sight ahead of the Fed

AUD/USD advances to over two-week high, 0.6800 mark in sight ahead of the Fed

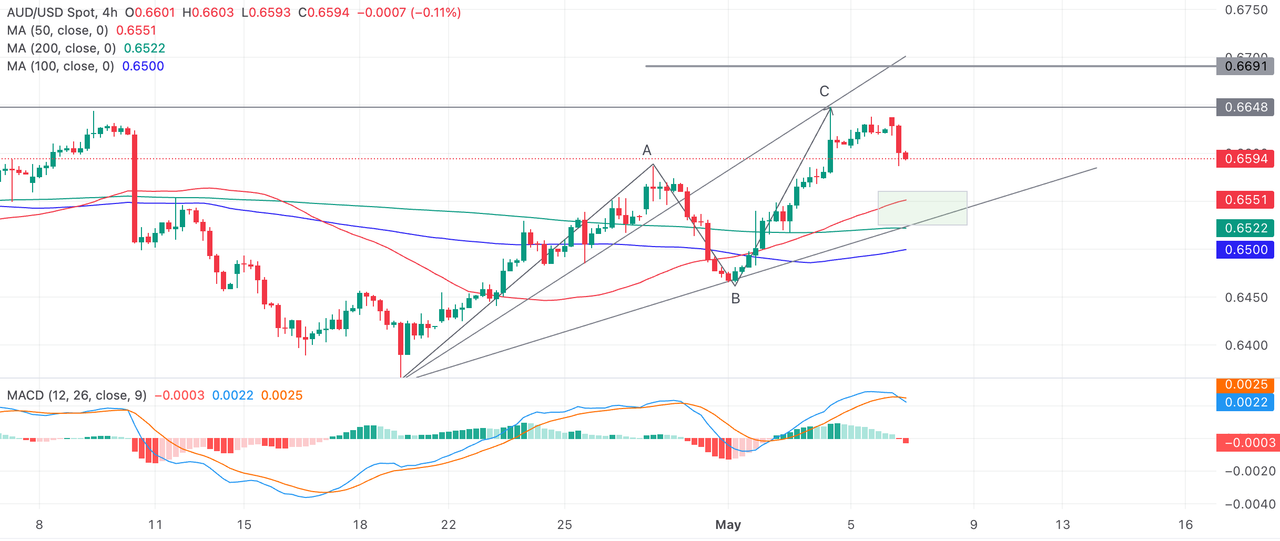
The AUD/USD pair scales higher for the third straight day – also marking the fifth day of a positive move in the previous six – and climbs to over a two-week high, around the 0.6775-0.6780 region during the early European session on Wednesday. The momentum is sponsored by the emergence of fresh US Dollar (USD) selling, which continues to be weighed down by dovish Federal Reserve (Fed) expectations.

In fact, the markets are currently pricing in a greater chance of an oversized 50 basis points (bps) Fed rate cut move at the end of a two-day policy meeting later today. This keeps a lid on the overnight recovery in the US Treasury bond yields, led by the upbeat US Retail Sales figures. Apart from this, a generally positive tone around the equity markets caps the USD recovery from its lowest level since July 2023 and acts as a tailwind for the AUD/USD pair.

The Australian Dollar (AUD), on the other hand, continues to draw support from the Reserve Bank of Australia’s (RBA) hawkish stance. The RBA Governor Michele Bullock reiterated last Thursday that bringing inflation down to the target band of 2-3% remains the central bank’s highest priority and it was premature to contemplate near-term rate cuts as inflation remained too high. This further contributes to the bid tone surrounding the AUD/USD pair.

That said, persistent worries about a slowdown in China – the world’s second-largest economy – might hold back traders from placing aggressive bullish bets around the China-proxy Aussie. Investors might also prefer to move to the sidelines and wait for the highly-anticipated FOMC monetary policy decision before positioning for an extension of the AUD/USD pair’s recent goodish rebound from the 200-day Simple Moving Average (SMA) support.

EUR/USD holds gains above 1.1100, Fed rate decision in focus

EUR/USD holds gains above 1.1100, Fed rate decision in focus

EUR/USD is defending minor gains above 1.1100 in the European morning on Wednesday. A broadly subdued US Dollar, amid increased bets of an outsized Fed rate cut and a cautiously optimistic market mood, underpins the pair. All eyes remain on the Fed policy verdict.

Further gains in EUR/USD should meet early resistance at the September top of 1.1155 (September 6), before hitting the 2024 peak of 1.1201 (August 26), and the 2023 high of 1.1275 (July 18).

Instead, the pair’s next downward target emerges at the September low of 1.1001 (September 11), which anticipates the temporary 55-day SMA at 1.0969 and the weekly low of 1.0881 (August 8). The critical 200-day SMA is at 1.0866 and comes ahead of the weekly low of 1.0777 (August 1) and the June low of 1.0666.

Meanwhile, the pair’s rising trend is expected to continue as long as it is above the important 200-day SMA.

The four-hour chart shows that the uptrend appears to have bumped into a decent hurdle ahead of 1.1150 so far. Against that, the initial resistance level remains at 1.1155, followed by 1.1190 and 1.1201. On the flip side, the 55-SMA at 1.1073 provides transitory support, seconded by the 200-SMA at 1.1038 and then 1.1001. The relative strength index (RSI) broke below the 60 yardstick.

EUR/USD gave away part of the strong upward momentum seen at the beginning of the week driven by renewed buying pressure on the US Dollar (USD) on Tuesday.

That said, the US Dollar Index (DXY) experienced some respite after three consecutive daily declines, coming close to the key 101.00 barrier level despite rising speculation for a 50-bps interest rate cut by the Federal Reserve (Fed) at its upcoming meeting on September 18.

According to the CME Group’s FedWatch Tool, the probability of a 50 basis point rate reduction now sits above 60%, up from nearly 30% just a week ago.

The Greenback‘s daily recovery was also underpinned by an acceptable rebound in US yields across different time frames, while 10-year bund yields also recorded decent gains after two straight days of losses.

Meanwhile, the European Central Bank (ECB) policymakers remained cautious about signaling another rate cut in October.

Still around the ECB, Board member Gediminas Simkus expressed his support on Friday for two additional interest rate cuts this year, along with “significantly” more in the future as inflation trends back toward the bank’s 2% target.

It’s important to note that the ECB’s decision to ease monetary policy last week was based on its assessment of inflation and economic dynamics. Although the bank did not signal a rate cut in October, it acknowledged that domestic inflation remains high. In her press conference, ECB President Christine Lagarde indicated that the diminishing impact of monetary policy restrictions should benefit the economy, projecting inflation to drop to 2% by 2025, while maintaining a cautious stance on future actions.

Looking ahead, if the Federal Reserve implements further or larger rate cuts, the policy divergence between the Fed and the ECB may narrow, potentially supporting EUR/USD. This is particularly likely as markets anticipate two more rate cuts from the ECB and around 100-125 basis points of easing from the Fed by year-end.

However, the U.S. economy is expected to outperform its European peer in the longer run, which could limit significant or sustained weakness in the US Dollar.

Finally, the latest CFTC report for the week ending September 10 revealed that speculators have reduced their net long positions in the euro to three-week lows around 81,400 contracts, while commercial traders, including hedge funds, have also cut their net short positions to multi-week lows amid a slight increase in open interest.

Japanese Yen Remains Volatile: Analysis For USD/JPY, EUR/USD, AUD/USD, NZD/USD

Japanese Yen Remains Volatile: Analysis For USD/JPY, EUR/USD, AUD/USD, NZD/USD

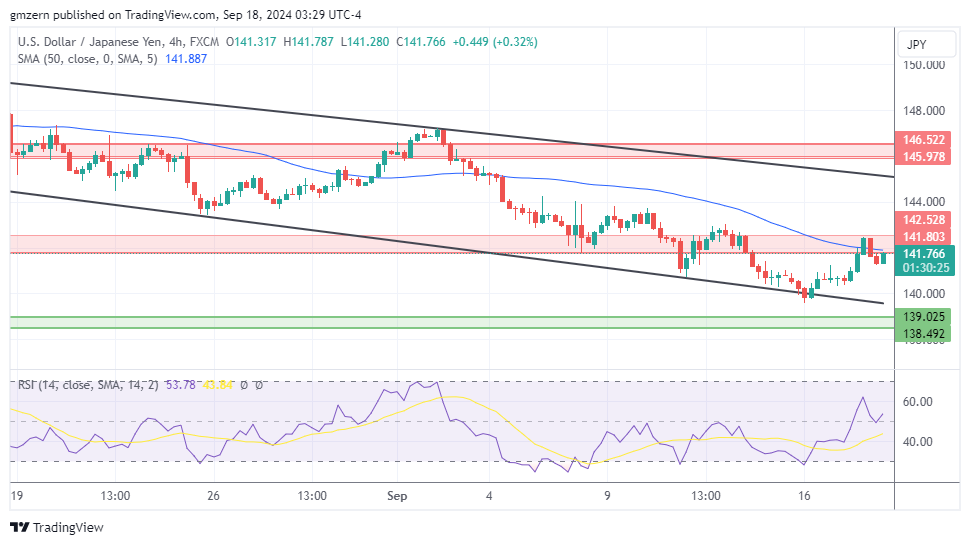
USD/JPY Attempts To Settle Above The Resistance At 141.80 – 142.50

USD/JPY

USD/JPY 180924 4h ChartUSD/JPY rebounded from recent lows and is trying to settle above the resistance at 141.80 – 142.50. Today, Fed will release its Interest Rate Decision, which will serve as the key driver for forex markets. Analysts expect that Fed will cut the rate from 5.5% to 5.25%. USD/JPY traders will also react to Powell’s comments, which may have a material impact on market dynamics. Traders will also have a chance to take a look at Building Permits and Housing Starts reports from the U.S., but it remains to be seen whether these reports will have any impact on USD/JPY.

Experts trade the markets with IC Markets

Trading Derivatives carries a high level of risk to your capital and you should only trade with money you can afford to lose. Trading Derivatives may not be suitable for all investors, so please ensure that you fully understand the risks involved, and seek independent advice if necessary. A Product Disclosure Statement (PDS) can be obtained either from this website or on request from our offices and should be considered before entering into a transaction with us. Raw Spread accounts offer spread

EUR/USD Gains Ground Ahead Of Inflation Data

EUR/USD

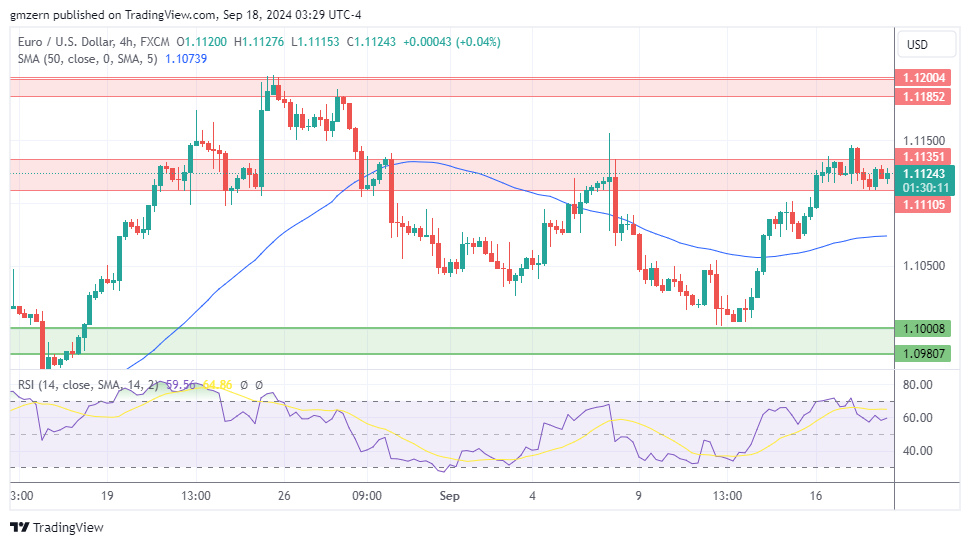
EUR/USD 180924 4h ChartEUR/USD gains some ground as traders prepare for the release of the final reading of the Euro Area Inflation Rate report. The report is expected to show that Euro Area Inflation Rate declined from 2.6% in July to 2.2% in August. From a big picture point of view, traders will stay focused on Fed decision.

EUR/USD continues its attempts to settle above the strong resistance level at 1.1110 – 1.1135. A move above 1.1135 will open the way to the test of the next resistance at 1.1185 – 1.1200.

AUD/USD Tests New Highs

AUD/USD

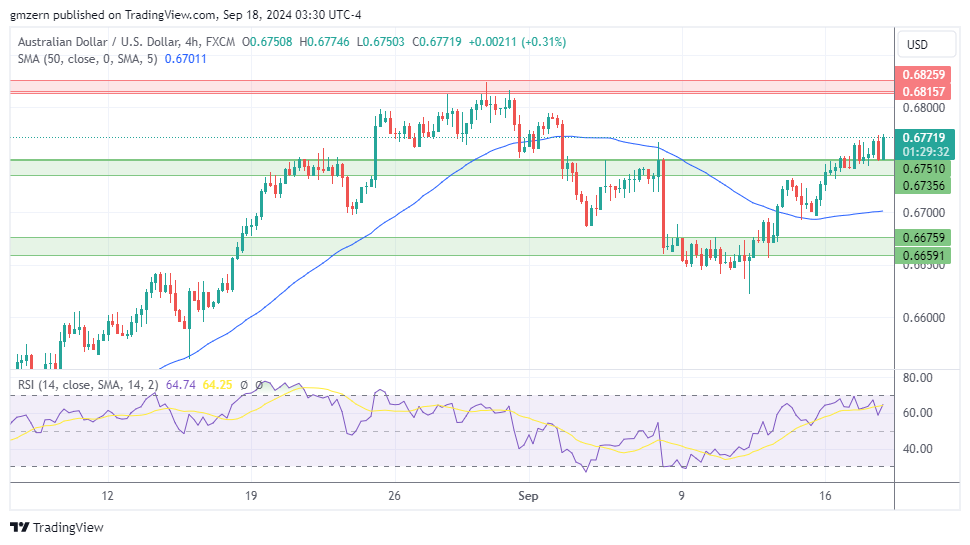
AUD/USD 180924 4h ChartAUD/USD is moving higher as traders focus on Westpac Leading Index report. The report showed that Leading Index declined by 0.1% month-over-month in August, compared to analyst forecast of 0%.

In case AUD/USD climbs above the 0.6770 level, it will head towards the nearest resistance level, which is located in the 0.6815 – 0.6825 range.

NZD/USD Gains Ground On Fed Day

NZD/USD

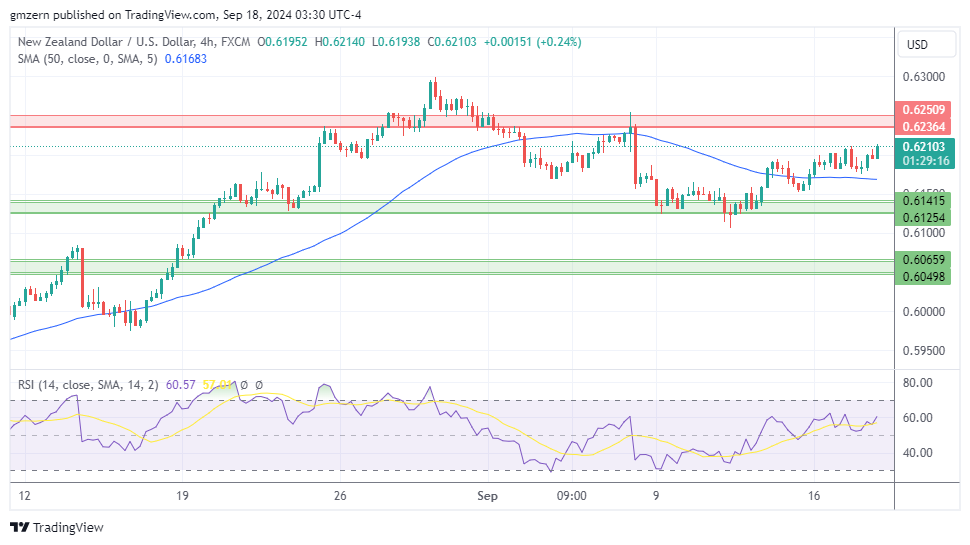
NZD/USD 180924 4h ChartNZD/USD is also moving higher amid rising demand for commodity-related currencies.

RSI remains in the moderate territory, so there is plenty of room to gain additional upside momentum in case the right catalysts emerge.

US Dollar Forecast: Fed’s 25 bps Rate Hike Expected; GBP/USD and EUR/USD Outlook

US Dollar Forecast: Fed’s 25 bps Rate Hike Expected; GBP/USD and EUR/USD Outlook

US Dollar Awaits Fed Decision

The US Dollar remains under pressure following mixed retail sales data. Core retail sales grew by 0.1%, below the expected 0.2%, while overall retail sales also increased by 0.1%, contrasting with the forecasted -0.2% decline.

Experts trade the markets with IC Markets

Trading Derivatives carries a high level of risk to your capital and you should only trade with money you can afford to lose. Trading Derivatives may not be suitable for all investors, so please ensure that you fully understand the risks involved, and seek independent advice if necessary. A Product Disclosure Statement (PDS) can be obtained either from this website or on request from our offices and should be considered before entering into a transaction with us. Raw Spread accounts offer spread

The FOMC statement and press conference could provide further direction for the dollar, particularly as traders look for guidance on future rate hikes or pauses.

US Dollar Index (DXY) – Technical Analysis 

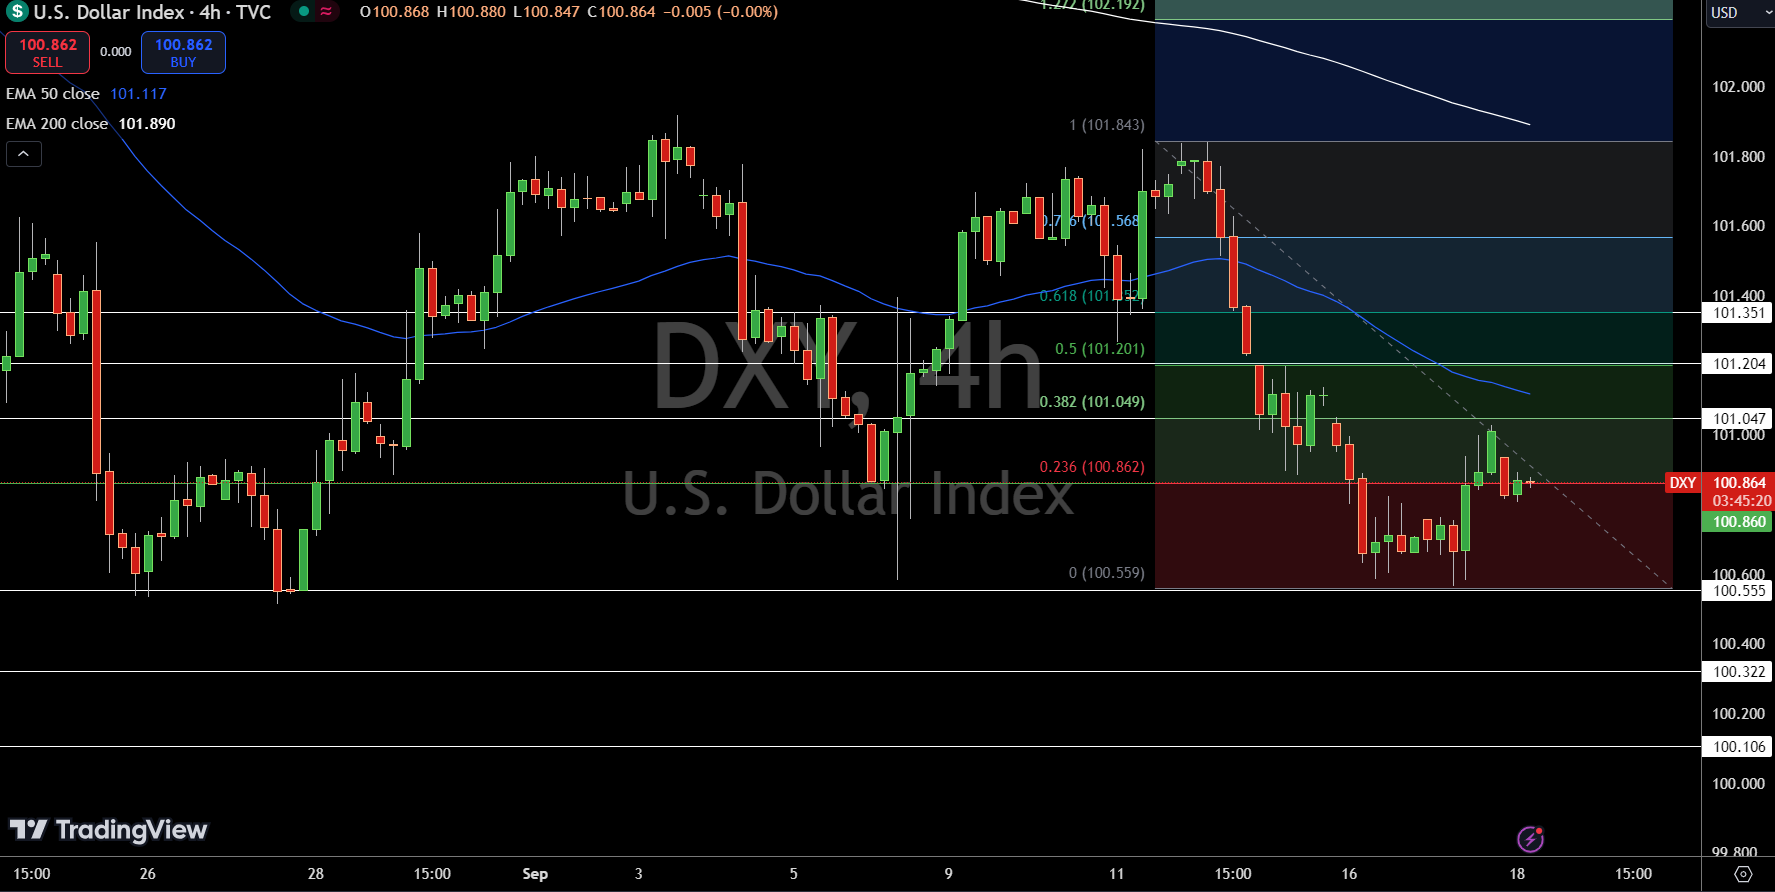
The Dollar Index (DXY) is trading at $100.864, down 0.16%, hovering right around its pivot point at $100.860. This indicates the index is at a critical juncture.

Immediate resistance sits at $101.047, followed by higher targets at $101.204 and $101.351. On the downside, key support levels to watch are $100.555, $100.322, and $100.106.

Dollar Index Price Chart - Source: Tradingview
Dollar Index Price Chart
The 50-day EMA at $101.117 suggests near-term bearish momentum, while the 200-day EMA at $101.890 reinforces a broader downtrend.

A break above the $100.860 pivot could shift momentum toward a bullish bias, but as long as prices remain below this level, the outlook remains bearish.

UK Inflation Steady at 2.2%, Sterling Holds Ground

The UK’s CPI remained steady at 2.2% year-over-year, in line with expectations. The stable inflation data kept the British Pound (GBP) relatively flat, as traders now focus on the upcoming Bank of England meeting for further clues on monetary policy.

Any signals of rate adjustments could influence the next moves in the currency market.

GBP/USD Technical Forecast

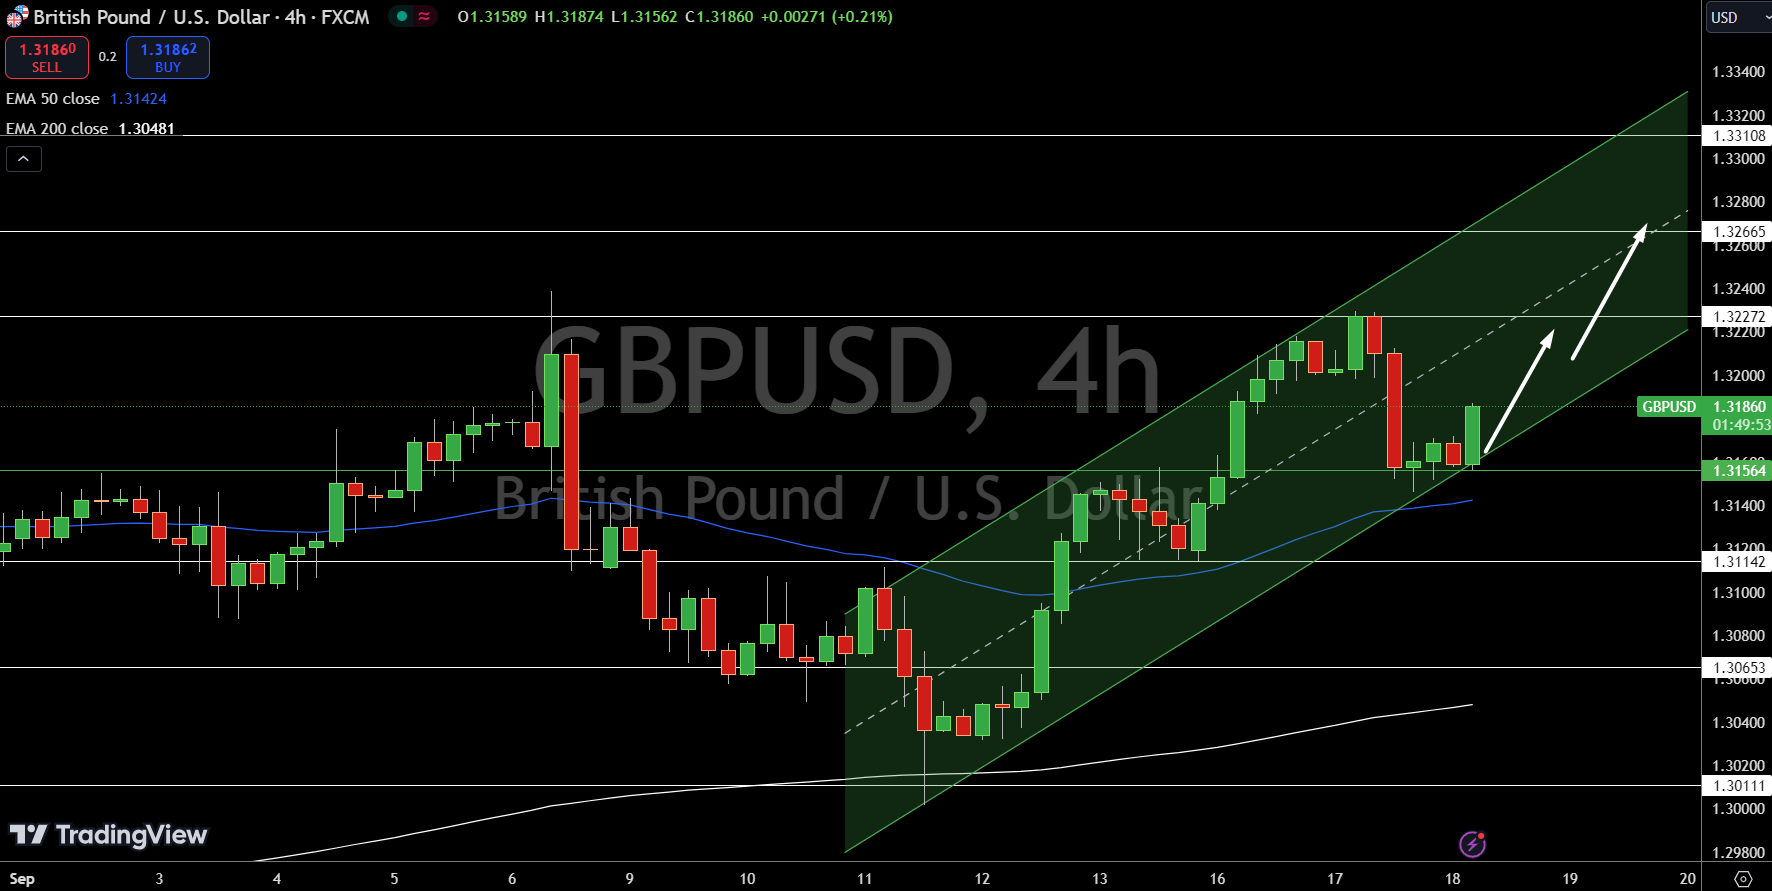
The GBP/USD is trading at $1.31860, holding steady just above the pivot point of $1.31564, indicating a potential continuation of its upward trend. Immediate resistance is seen at $1.32272, followed by $1.32665 and $1.33108.

On the downside, the first support sits at $1.31142, with further levels at $1.30653 and $1.30111.

GBP/USD Price Chart - Source: Tradingview
GBP/USD Price Chart
The 50-day EMA at $1.31424 supports the current bullish momentum, while the 200-day EMA at $1.30481 reinforces the longer-term uptrend.

As long as the pair stays above the $1.3156 pivot, the upward channel remains intact, suggesting more buying interest. A break below this level, however, could shift the bias towards selling.

Euro Steady as CPI Matches Forecast; Eyes on Buba Speech

The Euro (EUR) remains stable following the release of Final CPI, which held at 2.2% year-over-year, matching expectations. Core CPI also aligned at 2.8%.

Markets now shift focus to the upcoming speech from German Buba President Nagel, which could offer insights into future European Central Bank policy direction and impact the Euro’s outlook.

EUR/USD Technical Forecast

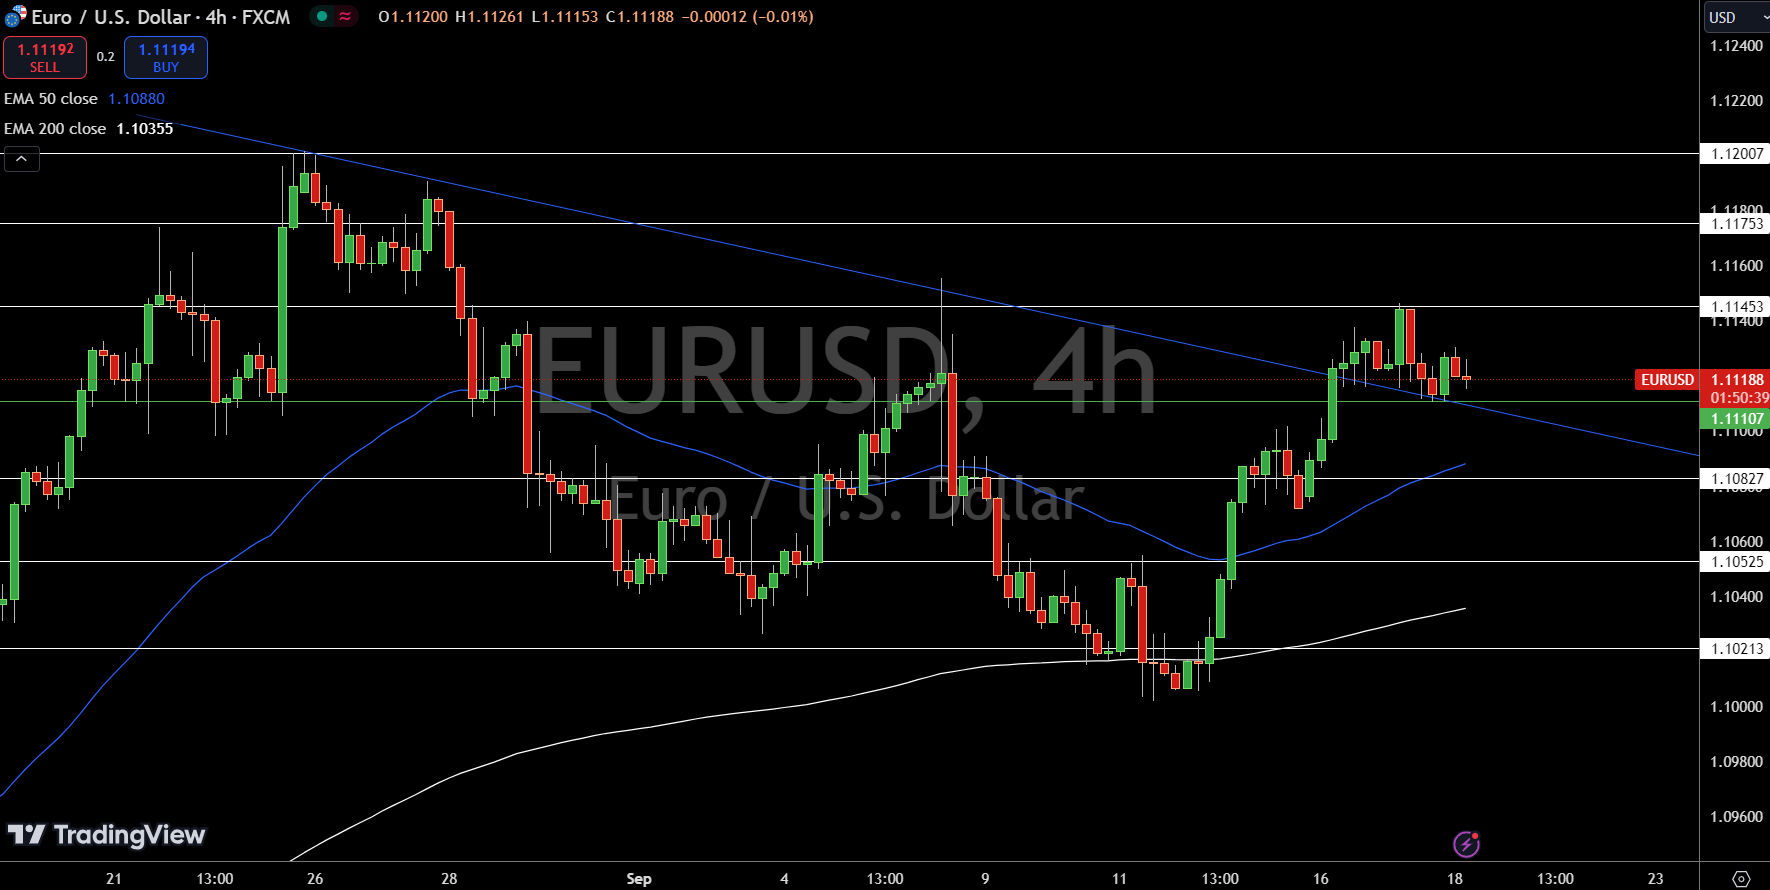
The EUR/USD pair is currently trading at $1.11188, up 0.08%, and hovering just above its pivot point at $1.11107, signaling potential bullish momentum. Immediate resistance is seen at $1.11453, with higher targets at $1.11753 and $1.12007.

On the downside, key support levels are at $1.10827, followed by $1.10525 and $1.10213.

EUR/USD Price Chart - Source: TradingView
EUR/USD Price ChartThe 50-day EMA at $1.10880 and the 200-day EMA at $1.10355 support a near-term bullish bias. A breakout above $1.1110 suggests buying opportunities, while a break below could trigger a sharp sell-off.

For now, the pair remains bullish above the $1.11107 pivot, with traders eyeing the next resistance level for confirmation of a stronger uptrend.

Gold (XAU) Daily Forecast: Will Fed Decisions Push Prices Beyond $2,585 Resistance?

Gold (XAU) Daily Forecast: Will Fed Decisions Push Prices Beyond $2,585 Resistance?

Market Overview

Gold prices continue to show positive momentum, trading around $2,575 but still below the near-record highs of $2,589-$2,590. The recent uptick in gold can be attributed to market speculation over an expected Federal Reserve interest rate cut, which has pressured the US dollar.

Experts trade the markets with IC Markets

Trading Derivatives carries a high level of risk to your capital and you should only trade with money you can afford to lose. Trading Derivatives may not be suitable for all investors, so please ensure that you fully understand the risks involved, and seek independent advice if necessary. A Product Disclosure Statement (PDS) can be obtained either from this website or on request from our offices and should be considered before entering into a transaction with us. Raw Spread accounts offer spread

Economic Data Adds to Gold’s Appeal

The US economy showed mixed signals, with retail sales in August rising 0.1%, marginally better than the expected 0.2% decline. While this initially caused a brief dollar rally, the momentum faded as dovish expectations surrounding the Federal Reserve persisted.

In the bond market, the 10-year US Treasury yield rebounded from a 16-month low, which limited the dollar’s recovery but kept gold prices steady.

Looking ahead, traders are keenly awaiting the Fed’s ‘dot plot’ and economic projections for clearer guidance. These could provide fresh insights into the Fed’s stance on future rate hikes or cuts, which will likely be pivotal for both gold prices and the US dollar.

Geopolitical Tensions Drive Safe-Haven Demand

In addition to the economic factors, geopolitical tensions continue to bolster demand for gold as a safe-haven asset. Recent events in the Middle East and rising global uncertainty have contributed to the metal’s appeal, as investors seek protection from potential market instability.

As the markets await the outcome of the upcoming FOMC meeting, both rate cut expectations and global tensions are likely to keep gold trading near elevated levels in the near term.

Short-Term Forecast

Gold prices hover around $2,575, supported by Fed rate cut expectations. Key resistance remains at $2,585; a break above this level could reignite bullish momentum.

Gold Prices Forecast: Technical Analysis

Gold – Chart
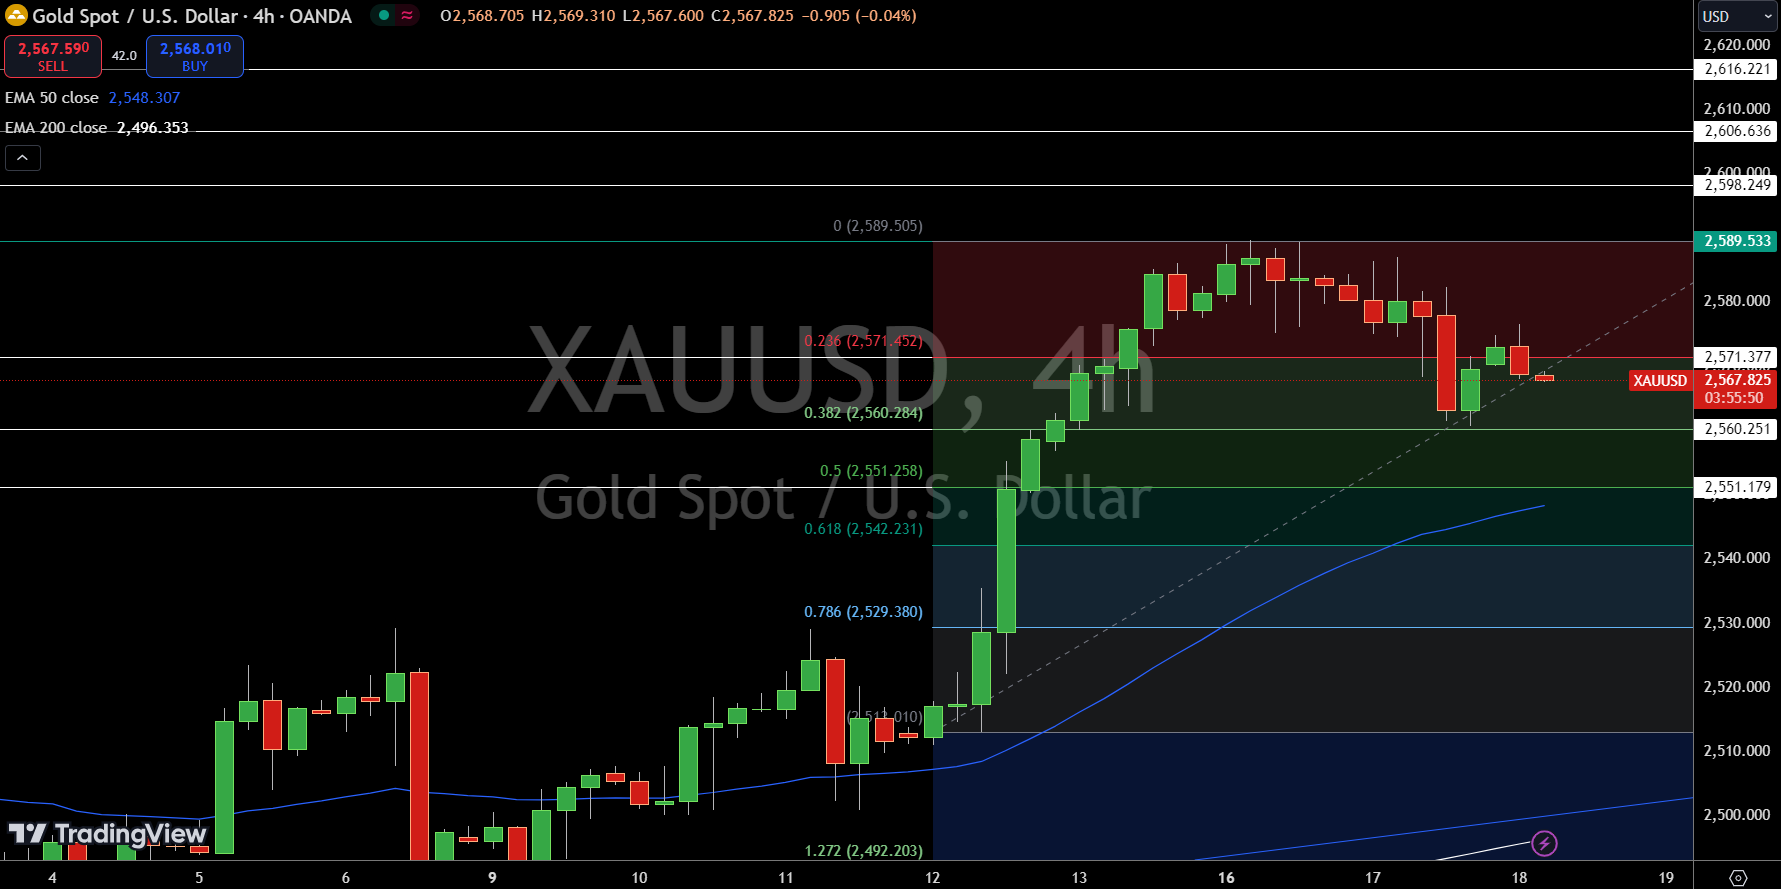
Gold – ChartGold (XAU/USD) is trading at $2,567.82, up 0.03%, hovering just below key levels of resistance and retracement zones. The price has already completed a 23.6% Fibonacci retracement at $2,571.38 and a 38.2% retracement at $2,563.25. These levels are now acting as critical support.

A break below the 38.2% level could send prices towards the next support zones at the 50% and 61.8% Fibonacci retracement levels, located around $2,550 and $2,542, respectively.

However, if Gold holds above the $2,560 level, buyers may step back in, driving prices toward the pivot point at $2,589.53. The 50-day EMA at $2,548.31 is offering additional support, while the 200-day EMA at $2,496.35 remains distant but important in the longer-term outlook.

UK Core Inflation Rises to 3.6% in August Sinking BoE Rate Cut Hopes

UK Core Inflation Rises to 3.6% in August Sinking BoE Rate Cut Hopes

Surprise Uptick in UK Core Inflation Jolts Markets Ahead of BoE Decision

On Wednesday, September 18, the UK Inflation Report drew investor interest as the Bank of England interest rate decision loomed.

The UK core annual inflation rate unexpectedly increased from 3.3% in July to 3.6% in August.

Experts trade the markets with IC Markets

Trading Derivatives carries a high level of risk to your capital and you should only trade with money you can afford to lose. Trading Derivatives may not be suitable for all investors, so please ensure that you fully understand the risks involved, and seek independent advice if necessary. A Product Disclosure Statement (PDS) can be obtained either from this website or on request from our offices and should be considered before entering into a transaction with us. Raw Spread accounts offer spread

Bank of England Interest Rate Path

Ahead of the inflation numbers, the consensus was for the Bank of England to hold interest rates steady at 5.0%.

The unexpected increase in the core inflation rate to 3.6% will likely leave the Bank of England in a holding pattern. Considering the August inflation numbers, Friday’s retail sales figures are now crucial. Strong UK retail sales figures could fuel demand-driven inflation, possibly delaying a BoE rate cut in Q4 2024.

GBP/USD Reaction to the July UK Inflation Report

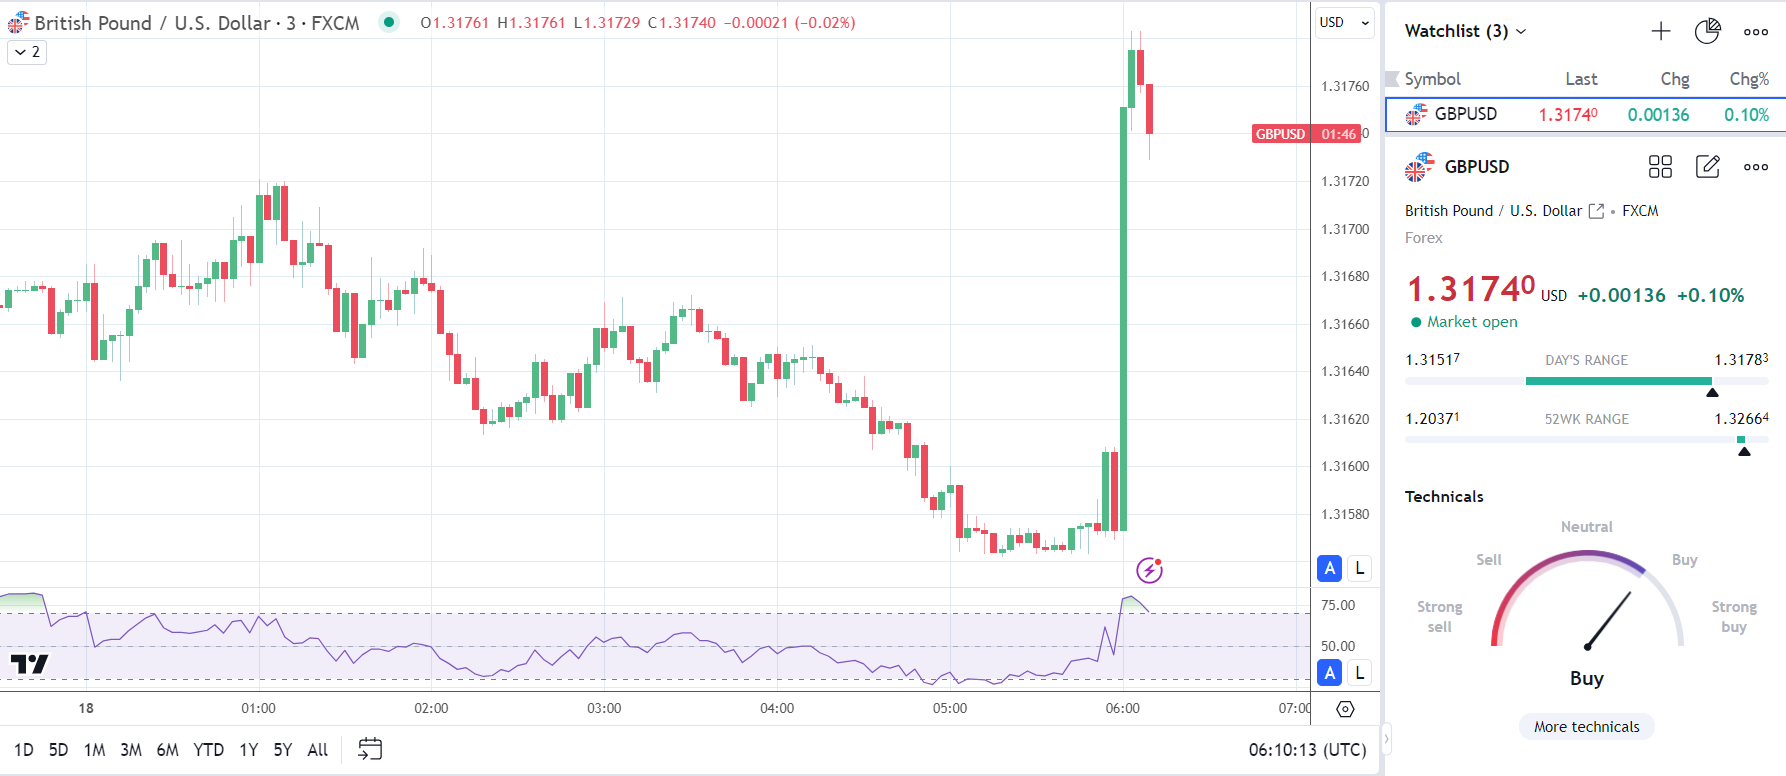
Ahead of the UK inflation report, the GBP/USD fell to a low of $1.31517 before climbing to a high of $1.31722.

However, immediately after the release of the inflation data, the GBP/USD rallied from $1.31573 to a high of $1.31783.

On Wednesday, September 18, the GBP/USD was up 0.10% to $1.31740.

GBP/USD rallies on uptick in core inflation.

GBPUSD 3-Minute Chart 180924

Up Next

Later in the session on Wednesday, the FOMC interest rate decision, economic projections, and press conference will be in focus. While the consensus is for a 25-basis point Fed rate cut, the CME FedWatch Tool gives a 65% chance of a 50-basis point Fed rate cut. The higher degree of uncertainty toward the Fed interest rate decision could expose the global markets to increased volatility.


US Retail Sales Rise 0.1% in August, Nonstore Retailers Up 7.8%, Fed Rate Cut Expected

US Retail Sales Rise 0.1% in August, Nonstore Retailers Up 7.8%, Fed Rate Cut Expected

U.S. Retail Sales Show Modest Growth in August

U.S. retail sales data for August 2024 came in stronger than expected, giving a slight boost to market sentiment. Despite concerns about a potential slowdown in consumer spending, retail sales showed resilience, reflecting steady economic activity.

August Retail Sales Increase by 0.1%

According to the Census Bureau, advance estimates for U.S. retail and food services sales in August reached $710.8 billion, marking a 0.1% increase from July 2024. This modest rise exceeded expectations, as economists had forecasted a 0.2% decline in spending. The year-over-year growth was also positive, with sales up by 2.1% compared to August 2023. Total sales for the June-August period were up 2.3% from the same time last year, indicating stable consumer demand.

Experts trade the markets with IC Markets

Trading Derivatives carries a high level of risk to your capital and you should only trade with money you can afford to lose. Trading Derivatives may not be suitable for all investors, so please ensure that you fully understand the risks involved, and seek independent advice if necessary. A Product Disclosure Statement (PDS) can be obtained either from this website or on request from our offices and should be considered before entering into a transaction with us. Raw Spread accounts offer spread

July’s retail sales were also revised upward, from a previously reported 1.0% increase to 1.1%, providing additional momentum to the retail sector.

Core Retail Sales Show Positive Growth

Excluding auto and gas sales, retail sales rose by 0.2% in August, though this was slightly below the consensus estimate of a 0.3% increase. The control group, which strips out more volatile categories and factors into the GDP calculation, grew by 0.3%, meeting market expectations. These figures suggest that the core components of retail spending remain healthy, contributing positively to overall economic growth.

Nonstore Retailers Lead Growth

Among the key segments, nonstore retailers, including e-commerce platforms, showed the strongest year-over-year growth, with an impressive 7.8% increase. Meanwhile, food services and drinking places rose by 2.7% from August 2023, signaling sustained consumer spending in the service sector.

Retail trade sales, which exclude food services, rose by 0.1% from July and 2.0% from the previous year, indicating steady demand across the broader retail market.

Fed Rate Cut Expectations Rise

The stronger-than-expected retail sales report comes at a critical time as the Federal Reserve begins its two-day policy meeting. Markets are pricing in a 67% probability of a 50 basis point rate cut, driven by signs of slowing labor market activity and easing inflation. This would be the first rate cut since 2020, with traders anticipating the Fed’s decision to be announced on Wednesday.

The better-than-expected retail sales data could influence the Fed’s decision, as robust consumer spending often mitigates the need for aggressive monetary easing. However, with inflation nearing the Fed’s 2% target, a rate cut seems likely to stimulate economic activity.

Market Forecast: Cautious Optimism

Given the slight increase in retail sales and ongoing strength in key sectors like nonstore retailers, the market outlook remains cautiously optimistic. While consumer spending has not surged, it remains steady, supporting a bullish stance in the short term. However, traders should closely monitor the Fed’s upcoming decision, as a larger-than-expected rate cut could further boost market sentiment.

Bitcoin Price Targets $70k as CME Group Hint 100% Chance of Fed Rate Cut

Bitcoin Price Targets $70k as CME Group Hint 100% Chance of Fed Rate Cut

Bitcoin Price Analysis:

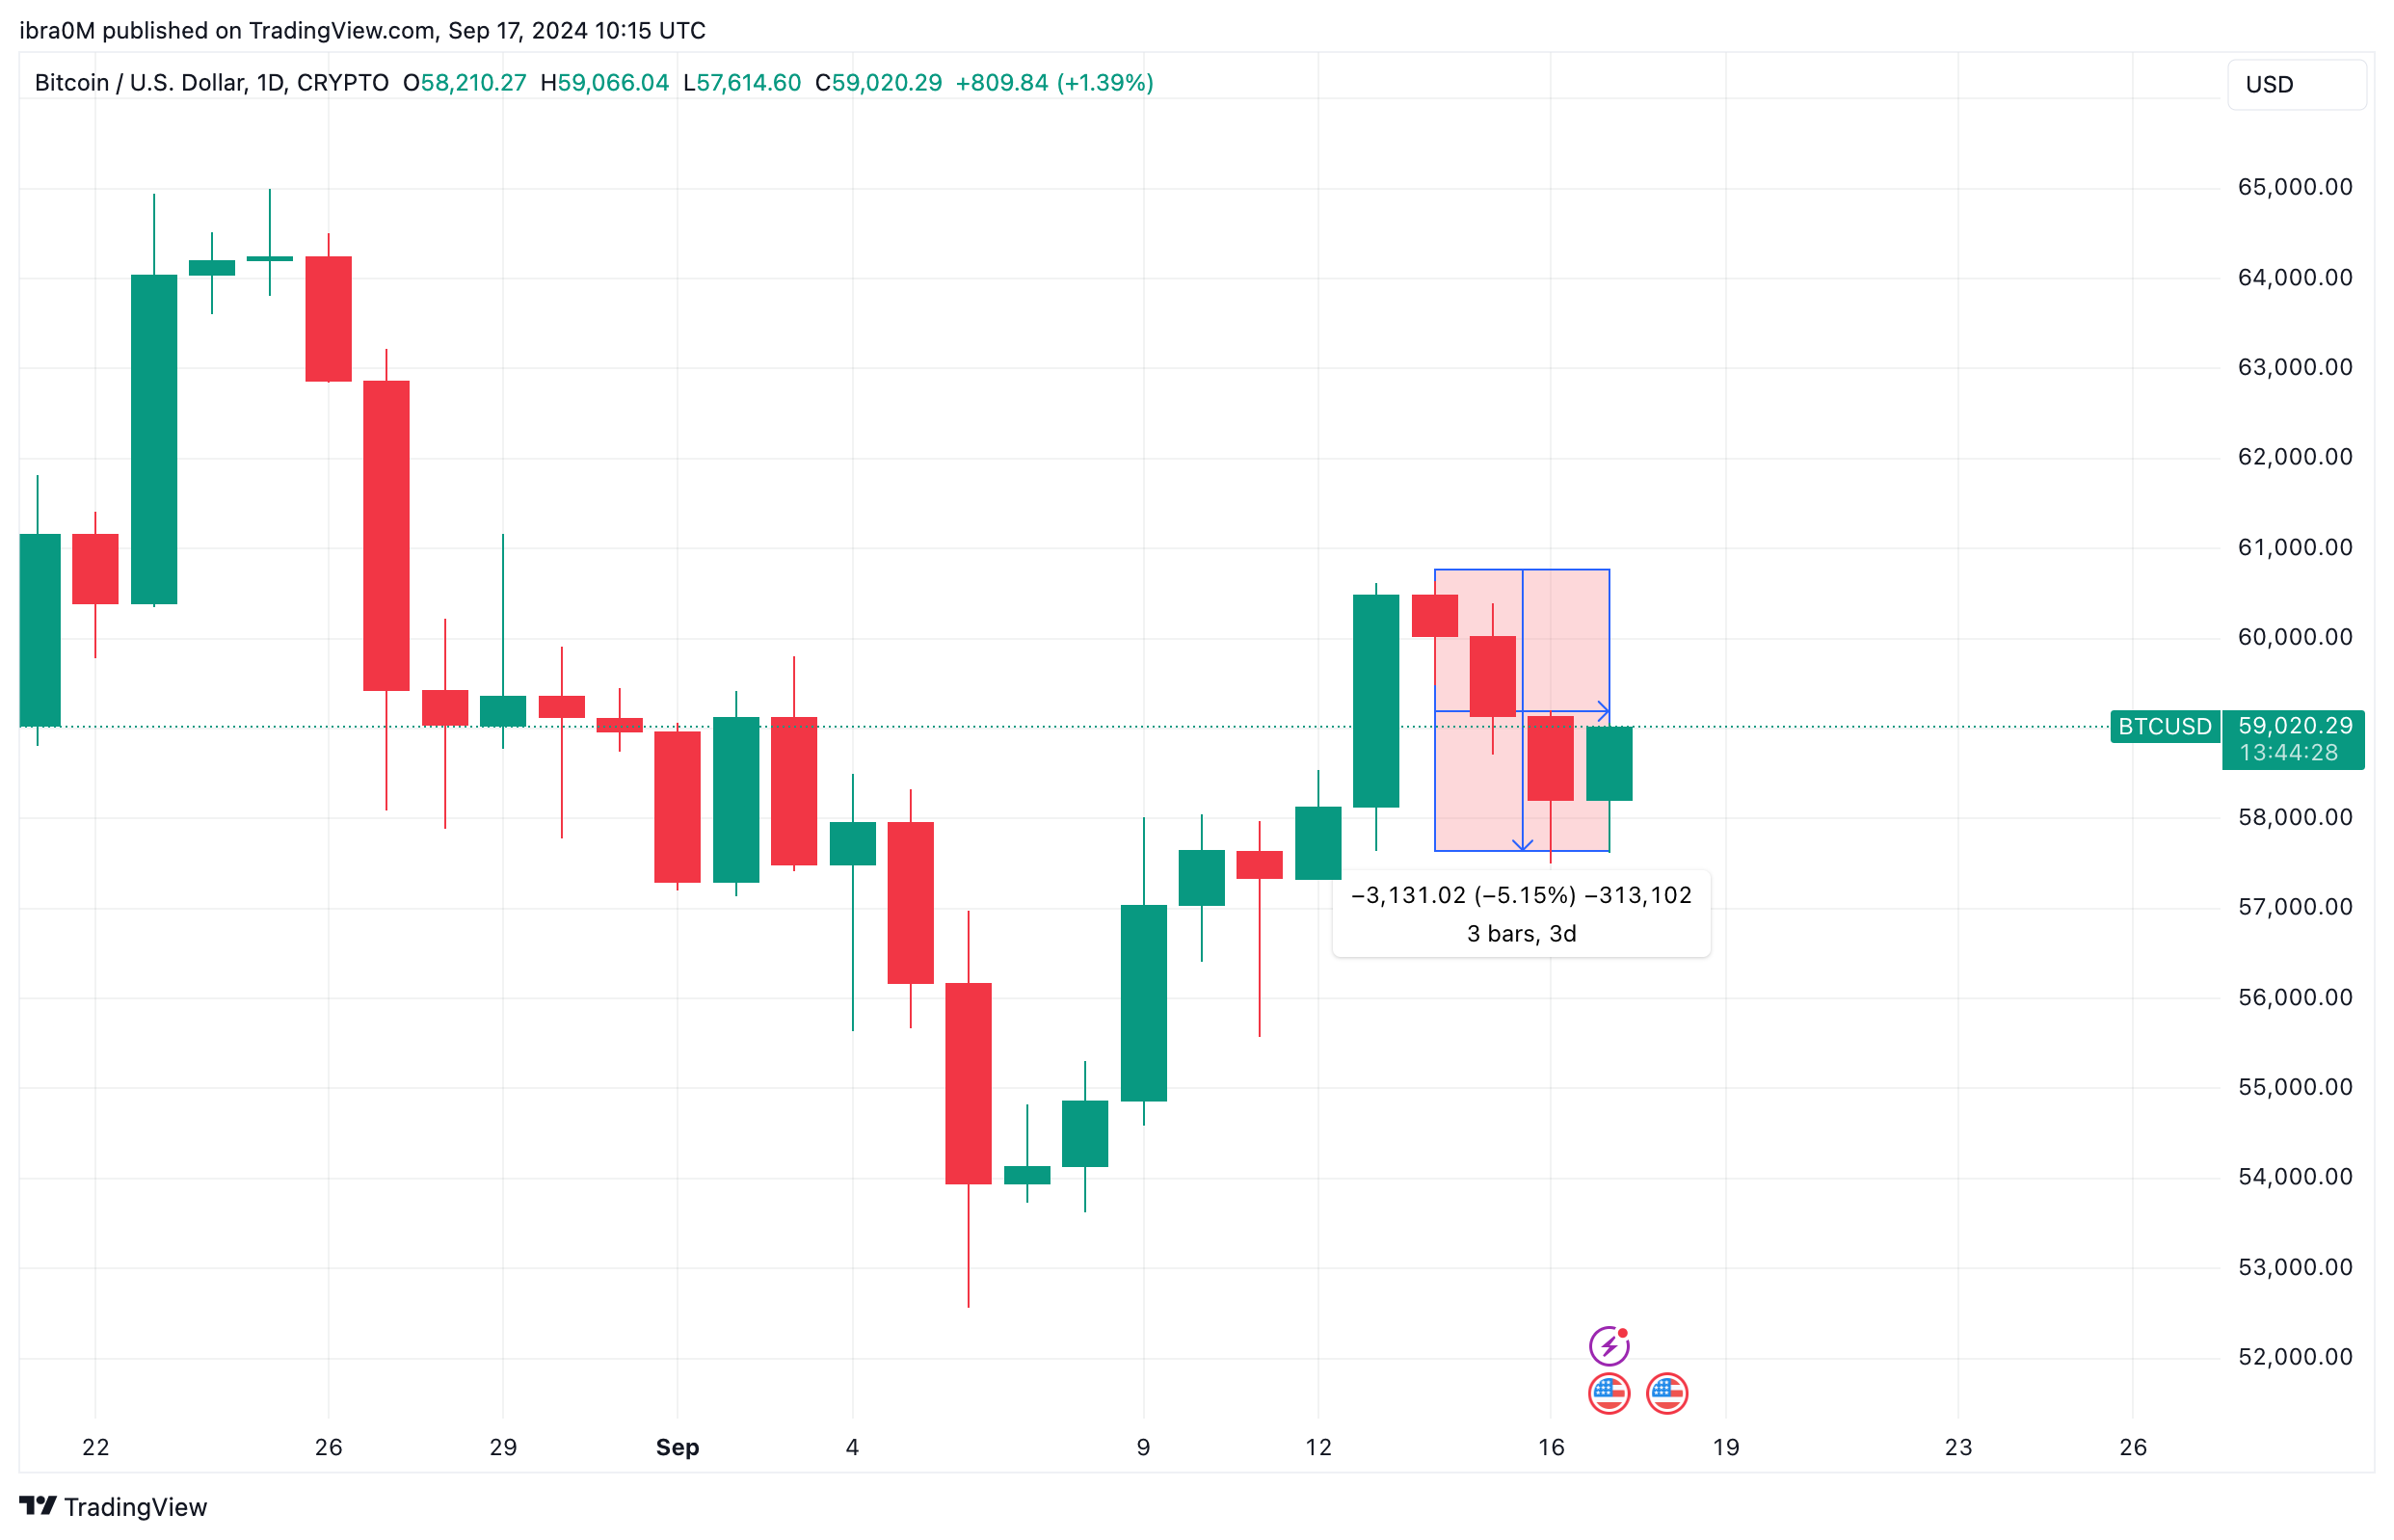
Bitcoin price fell as low as $57,614 on Tuesday Sept 17, down 5% within the last 3-days, but with Chicago Mercantile Exchange Group (CME) hinting, a 100% chance of a Fed rate cut, could this trigger a major breakout above $70,000?

Bitcoin Price Dips 3% as Bulls Sit-and-Watch

Bitcoin price action in the last two-weeks has been heavily influenced positive macroeconomic indicators. However, after testing new monthly timeframe peaks above $60,000, BTC failed to sustain the upward momentum.

Experts Trade Bitcoin with IC Markets

Trading Derivatives carries a high level of risk to your capital and you should only trade with money you can afford to lose. Trading Derivatives may not be suitable for all investors, so please ensure that you fully understand the risks involved, and seek independent advice if necessary. A Product Disclosure Statement (PDS) can be obtained either from this website or on request from our offices and should be considered before entering into a transaction with us. Raw Spread accounts offer spread

Amid growing anxiety ahead of the Fed Rate decision expected on Sept 18, BTC bull traders appear to be taking a sit-and-watch approach, leaving room for bears to force a mild correction.

Bitcoin Price Analysis | BTCUSD 

Bitcoin Price Analysis | BTCUSDSince hitting the monthly peak of $61,000 on Saturday, BTC price entered a steep downtrend. The chart above shows how BTC price has 5.15% between Sept 14 and Sept 17, the time of publication.

Barely 24-hours away from the US Fed Rate decision, the recent BTC price action shows that bull have scaled back on the buying pressure, likely waiting on the Fed decision to decide their next moves.

CME Groups Hints 100% Chance of USA Fed Rate Cut

While the official verdict is still up in the air, the Chicago Mercantile Group (CME), one of the largest institutional trading exchanges in the world, having hinted that the US Fed is highly likely to cut rates on Sept 18.

Chicago Mercantile Group (CME) | FedWatch  

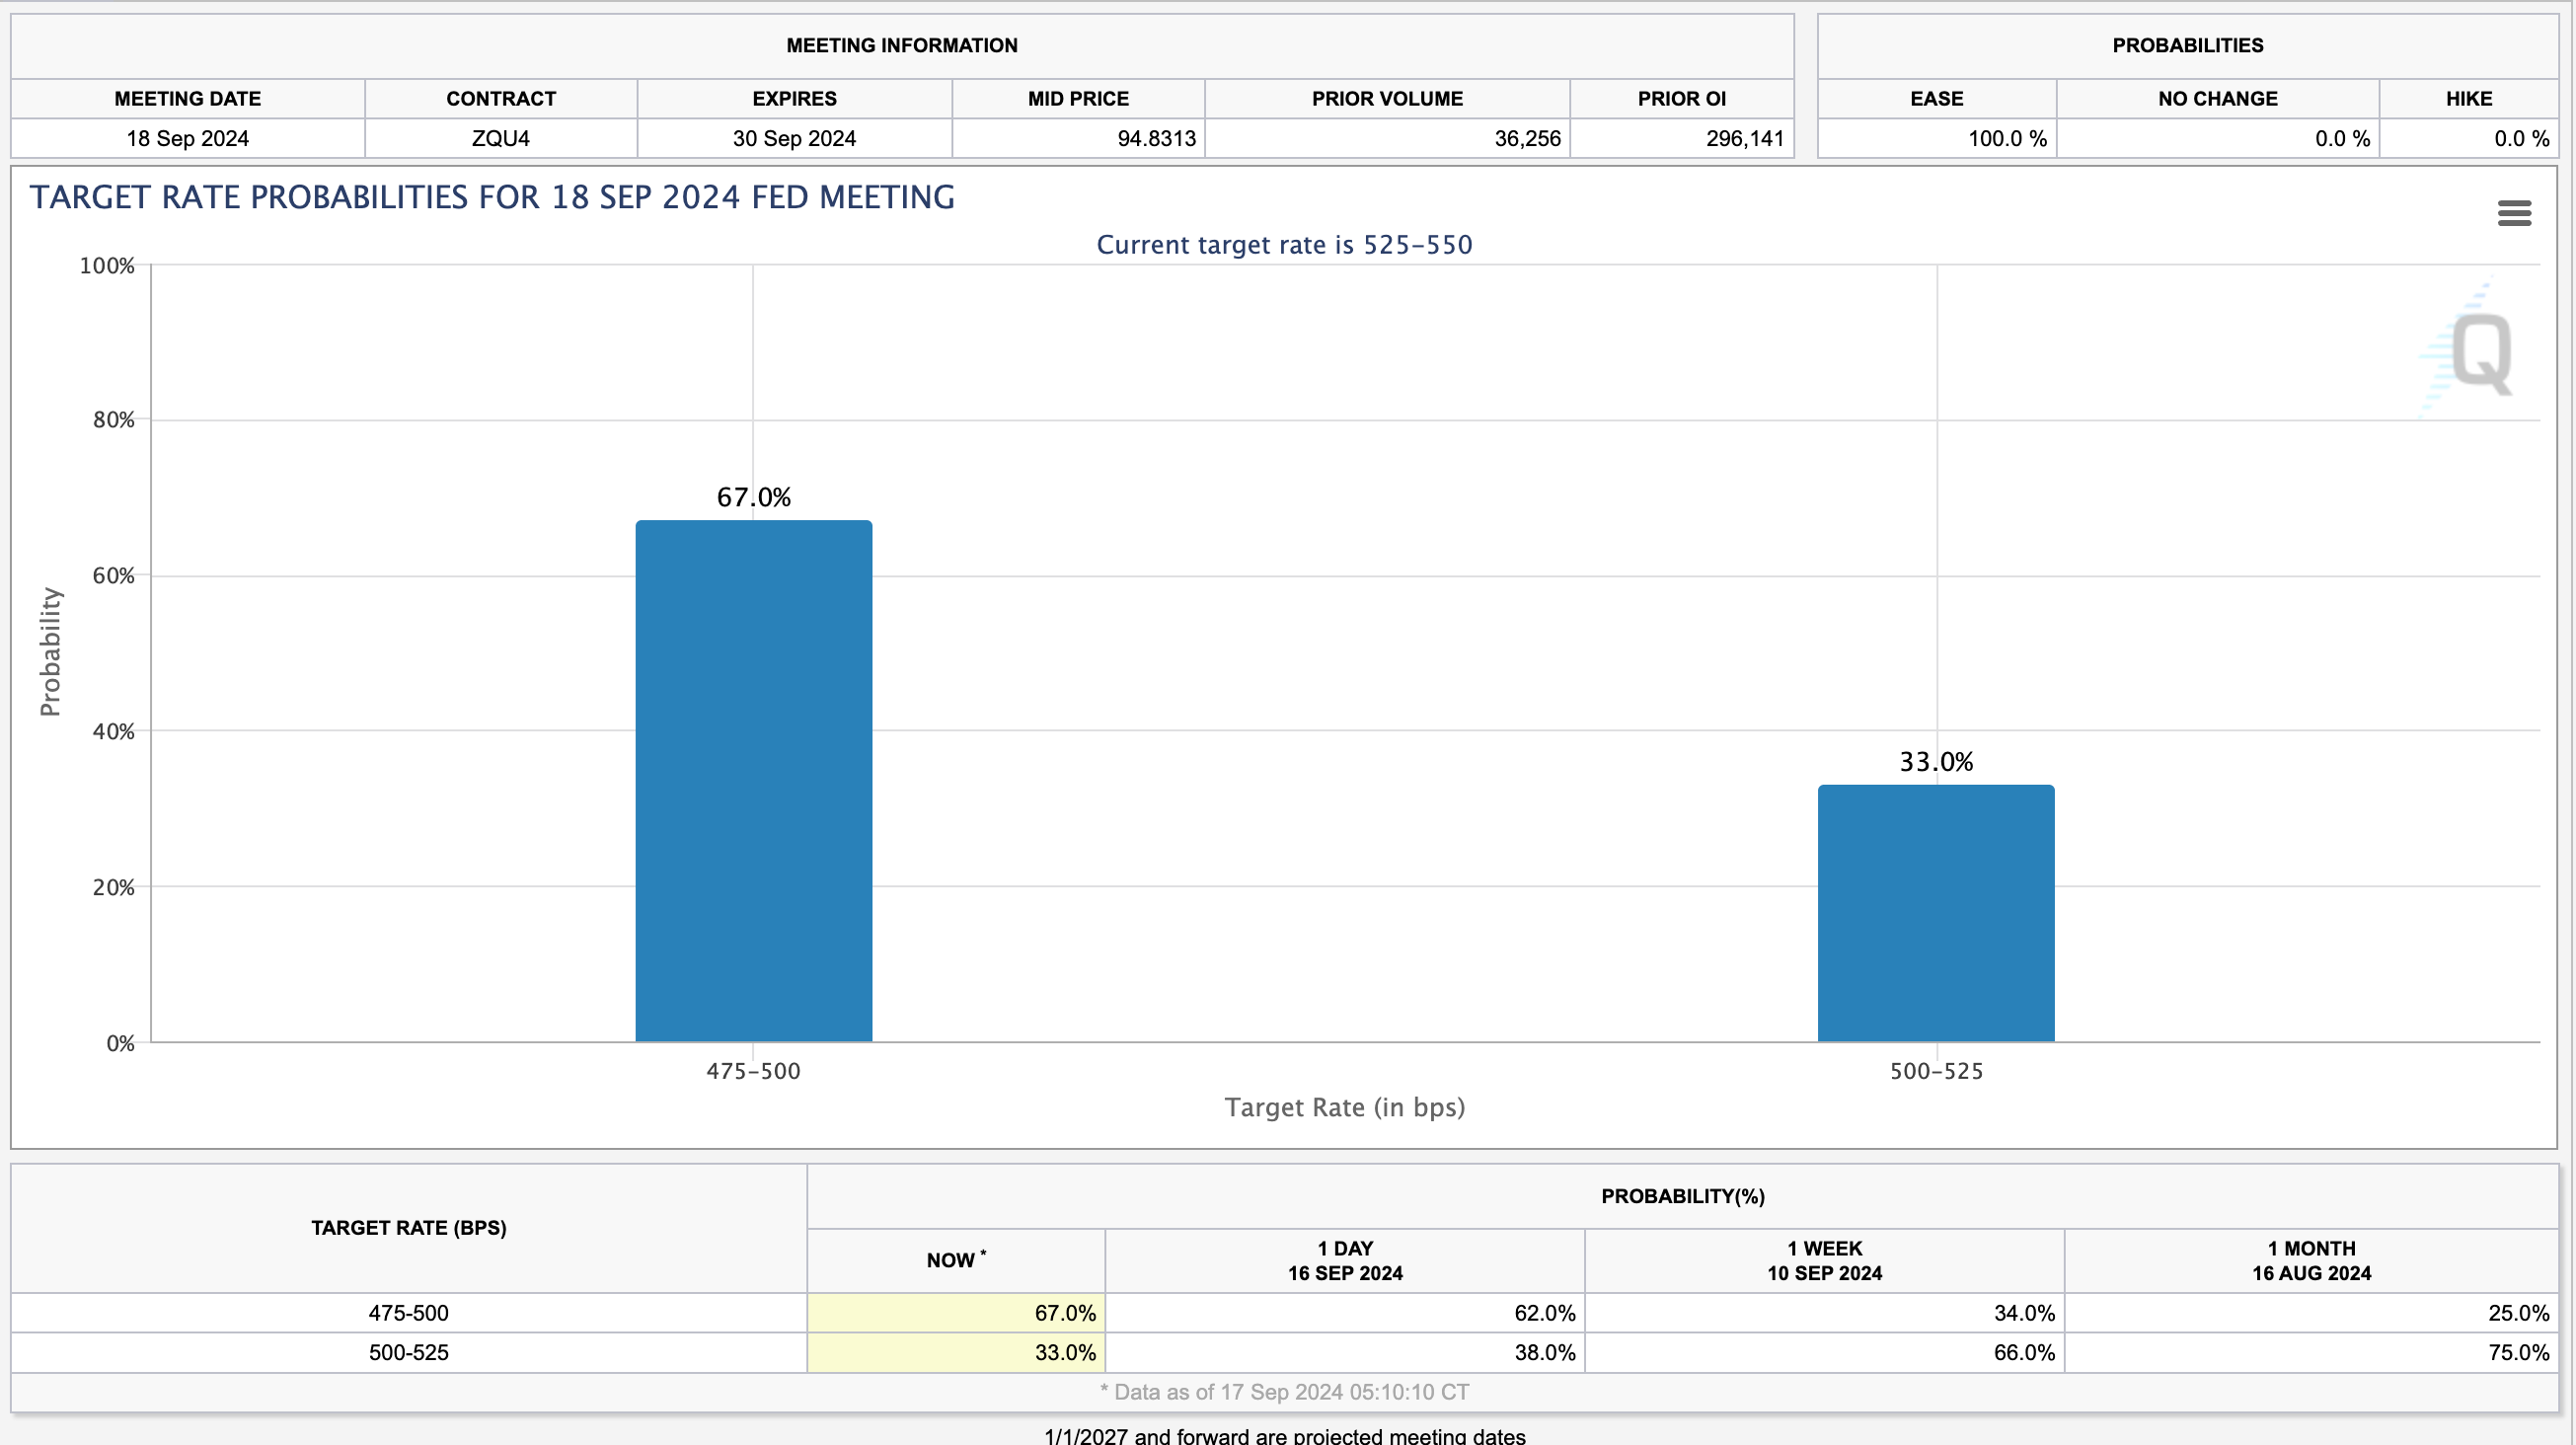
Chicago Mercantile Group (CME) | FedWatch ToolAccording to analysts at Chicago Mercantile Group (CME), there’s a 100% chance of a rate cut on September 18. This overwhelming expectation suggests that the market is pricing in a more favorable interest rate environment. .

A rate cut could be highly bullish for risk assets, including cryptocurrencies. Lower interest rates reduce the cost of borrowing, increase liquidity, and encourage more speculative investments.

With less incentive to park money in traditional, yield-bearing assets, investors could flock to more volatile and potentially high-reward sectors like crypto. Historically, such actions have been linked to periods of increased inflow into digital assets, especially Bitcoin.

More so, the chart shows that 67% of investors anticipate the target rate will drop to 475-500 basis points, while 33% expect a smaller cut to 500-525 basis points

If the Federal Reserve cuts rates to the 475-500 basis point range, as CME’s chart suggests is 67% likely, Bitcoin could see even stronger upward momentum. This more aggressive rate cut would inject additional liquidity into the economy, making capital cheaper and encouraging more speculative investments.

With such a cut, investors may perceive heightened inflation risks, further pushing them toward assets that are seen as stores of value, such as Bitcoin. Additionally, lower interest rates often weaken the U.S. dollar, enhancing BTC’s appeal as an alternative asset.

A weaker dollar could lead to increased demand for BTC from both institutional and retail investors seeking to hedge against potential currency devaluation.

Bitcoin Price Forecast: $61,000 Retest Could Trigger More Gains

Despite the recent 5% correction in the last 3 days, Bitcoin’s short-term trading indicators remain bullish.

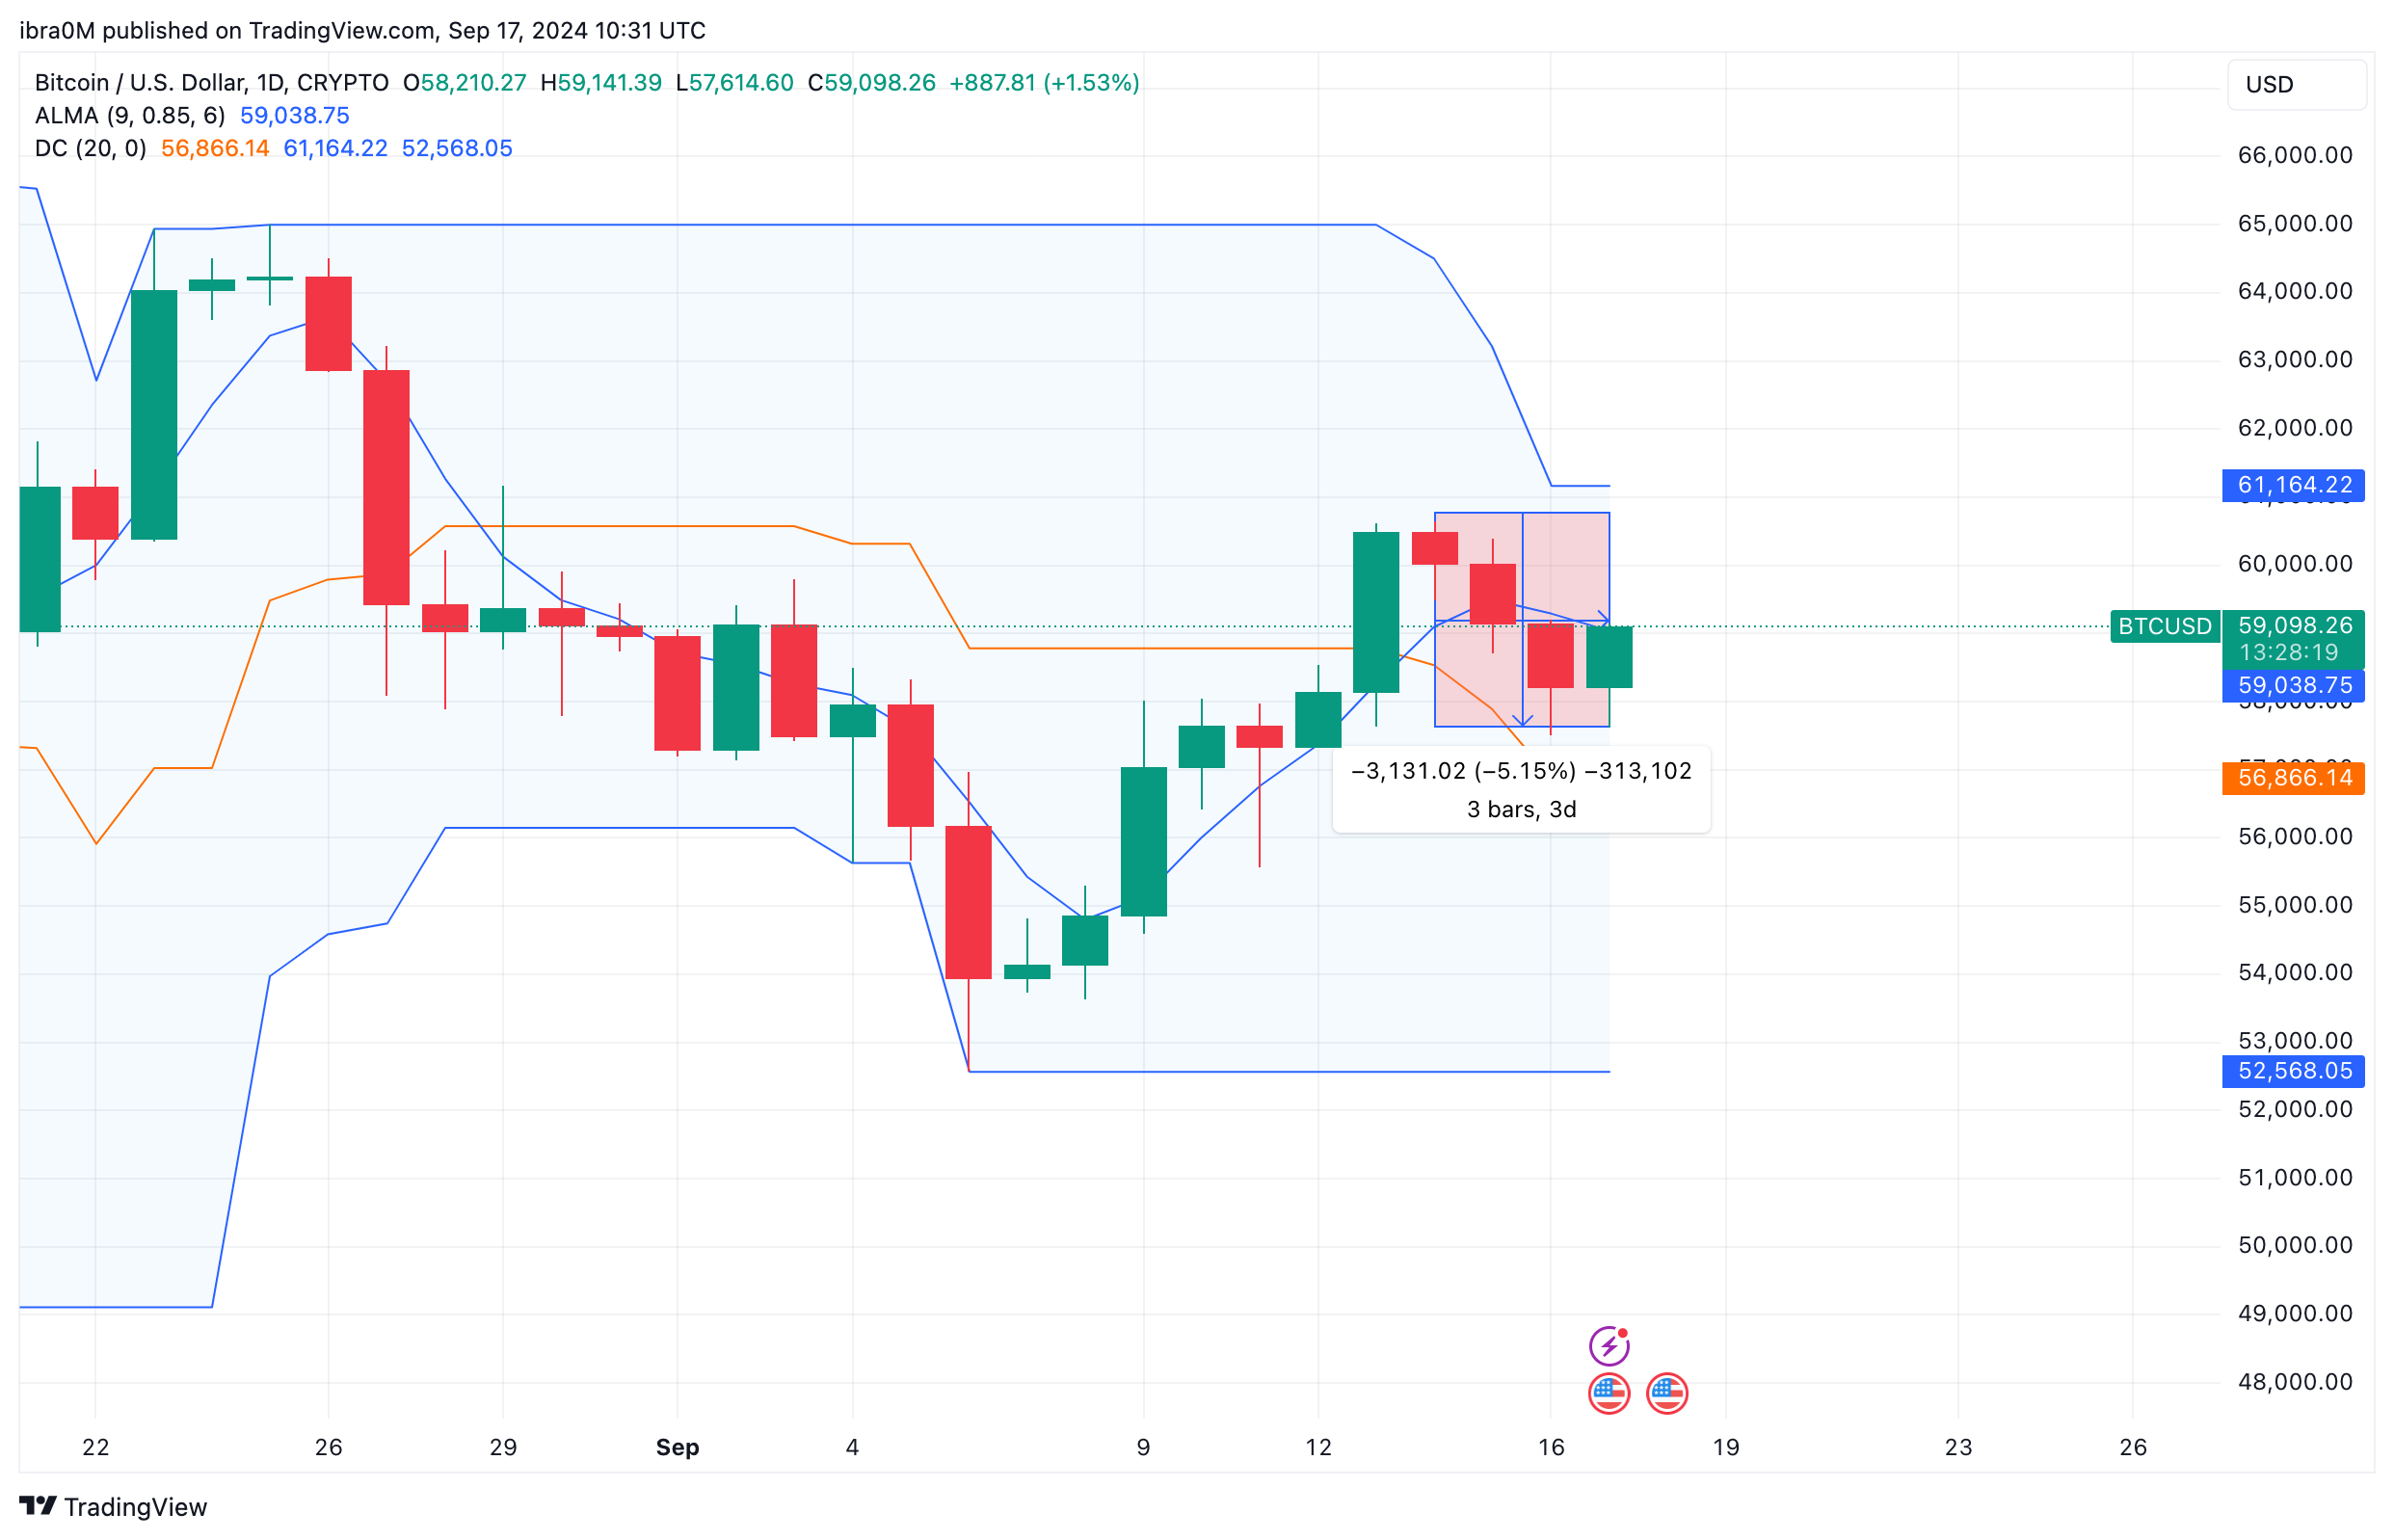
Currently, BTC is trading comfortably above the critical support level of $56,866, reflecting resilience after the pullback. The Donchian Channel, particularly, highlights that Bitcoin is still within a broader bullish trend, with the upper boundary of $61,164 marking the next significant resistance level.

Bitcoin Price Prediction | BTCUSD 

Bitcoin Price Prediction | BTCUSDThe Donchian Channel’s upper boundary aligns with the $61,164 resistance, hinting at a potential retest of this level. A successful breakout could trigger a stronger bullish rally, driving the price towards $63,000. Meanwhile, ALMA’s slope suggests that speculative activity has fueled recent gains, but the positive price action could gain further strength if macroeconomic catalysts, such as the anticipated US Fed rate cut, come into play.

If the rate cut occurs, this could reinforce the bullish sentiment and catalyze an accelerated breakout above $61,000. Support levels to watch closely are $56,866 and a lower support at $52,568. As investors await the Fed’s decision, the bullish momentum may persist, keeping BTC poised for a potential surge.