XRP News Today: XRP Rallies on Grayscale Trust News, ETF Speculation Soars

XRP News Today: XRP Rallies on Grayscale Trust News, ETF Speculation Soars

XRP Hits a September Monthly High

On Thursday, September 12, XRP surged by 5.04%, reversing a 1.02% loss from the previous day to close at $0.5625. During the session, XRP climbed to a September high of $0.5897 before pulling back below the $0.57 level. Significantly, XRP outperformed compared to the broader crypto market, which advanced by 1.47% to a total market cap of $2.003 trillion.

Grayscale Launches Grayscale XRP Trust

On September 12, Grayscale Investment announced the launch of Grayscale XRP Trust. The Grayscale XRP Trust is one of the first securities that invests and derives its value from XRP price trends. The Trust allows investors to receive XRP-fueled returns without directly buying and storing token.

Experts Trade Ethereum with IC Markets

Trading Derivatives carries a high level of risk to your capital and you should only trade with money you can afford to lose. Trading Derivatives may not be suitable for all investors, so please ensure that you fully understand the risks involved, and seek independent advice if necessary. A Product Disclosure Statement (PDS) can be obtained either from this website or on request from our offices and should be considered before entering into a transaction with us. Raw Spread accounts offer spread

Grayscale XRP Trust uses the CoinDesk Ripple Price Index (XRX) as its benchmark. The Index uses real-time prices from multiple trading platforms to derive a spot price.

In a statement, Grayscale Head of Product and Research Rayhaneh Sharif-Askary said,

“We believe Grayscale XRP Trust gives investors exposure to a protocol with an important real-world use case. By facilitating cross-border payments that take just seconds to complete, XRP has the potential to transform the legacy financial infrastructure.”

Grayscale Fuels XRP-spot ETF Speculation

The announcement fueled speculation about the possibility of an XRP-spot ETF market. Previously, Grayscale converted its Bitcoin (BTC) and Ether (ETH) Trusts to Exchange Traded Funds.

In August 2023, Grayscale successfully appealed against the SEC’s decision to reject converting the Grayscale Bitcoin Trust into a BTC-spot ETF, the Grayscale Bitcoin Trust (GBTC). The Grayscale victory opened the door to the US BTC and ETH-spot ETF markets.

Based on past events, progress toward an XRP-spot ETF could push XRP toward the $0.75 level. In November 2023, inaccurate reports of BlackRock (BLK) filing an XRP-spot ETF application sent XRP to $0.7503 before retreating below the $0.60 level.

XRP-spot ETF could fuel XRP breakout.

XRPUSD Reaction to Nov 2023 BlackRock FUDThe Grayscale announcement came at a pivotal time. Uncertainty about SEC plans to appeal rulings in the SEC vs. Ripple case leaves XRP below the $0.60 level.

Price trends remain dependent on whether the SEC appeals rulings in the Ripple case. If the SEC appeals, XRP may drop below $0.40. Conversely, XRP could target $1.00 if the SEC does not file an appeal notice, mirroring the market’s response to the Programmatic Sales of XRP ruling.

XRP reaction to court rulings.

XRPUSD Reaction to Court RulingsInvestors should closely monitor appeal-related news, which could significantly impact price trends. Stay updated with our latest news and analysis to manage your exposure to XRP and the broader crypto market.

XRP Price Action

XRP Weekly Chart sends bullish price signals.

XRPUSD 130924 Weekly Chart

Daily Chart

XRP hovered above the 50-day and 200-day EMAs, sending bullish price signals.

A break above the $0.5739 resistance level would support a move toward the September 12 high of $0.5897. Furthermore, a return to $0.5897 could give the bulls a run at the $0.60 handle and the August high of $0.6434.

SEC activity, SEC vs. crypto case-related updates require consideration.

Conversely, a break below the 50-day and 200-day EMA’s could signal a bullish trend reversal, possibly signaling a drop to the $0.50 level.

With a 14-day RSI reading of 50.68, XRP may return to $0.60 before entering overbought territory.

Daily Chart affirms the bullish price signals.
XRPUSD 130924 Daily Chart
New Payment Service for Clients in Ghana, Kenya, and Nigeria

New Payment Service for Clients in Ghana, Kenya, and Nigeria

Dear Clients,

LiteFinance is excited to introduce a new deposit service specifically for traders from Ghana, Kenya, and Nigeria. Our new bank transfer option offers a convenient way to make deposits and withdrawals in NGN, while the mobile payment option allows to make deposits and withdrawals in KES and GHS easily.

Deposit and Withdrawal Limits

Country Deposits Withdrawals
Ghana Min — 163.50 GHS / Max — 40,000 GHS Min — 29 GHS / Max — 2,000,000 GHS
Kenya Min — 1,290 KES / Max — 250,000 KES Min — 80 KES / Max — 250,000 KES
Nigeria Min — 1,000 NGN / Max — 50,000,000 NGN Min — 100 NGN / Max — 50,000,000 NGN

Transaction Fees

Country Deposit Fee Withdrawal Fee
Ghana               0%* 6 GHS per transaction
Kenya 70 KES per transaction
Nigeria 100 NGN per transaction

* LiteFinance covers the deposit fees as part of our loyalty program.

Benefits

  • Convenient and secure transactions.
  • Competitive exchange rates.
  • Zero deposit fees.

If you have any questions or need further assistance, please do not hesitate to contact our support team.

We are committed to providing our clients with the best trading experience. Enjoy seamless banking with our new local bank transfer and mobile payments service.

Thank you for choosing LiteFinance.

Best regards,

LiteFinance Team

New Payment Service for Clients in Ghana, Kenya, and Nigeria

AUD/USD fails ahead of 0.6700 mark, stalls its recovery from multi-week low set on Wednesday

AUD/USD fails ahead of 0.6700 mark, stalls its recovery from multi-week low set on Wednesday

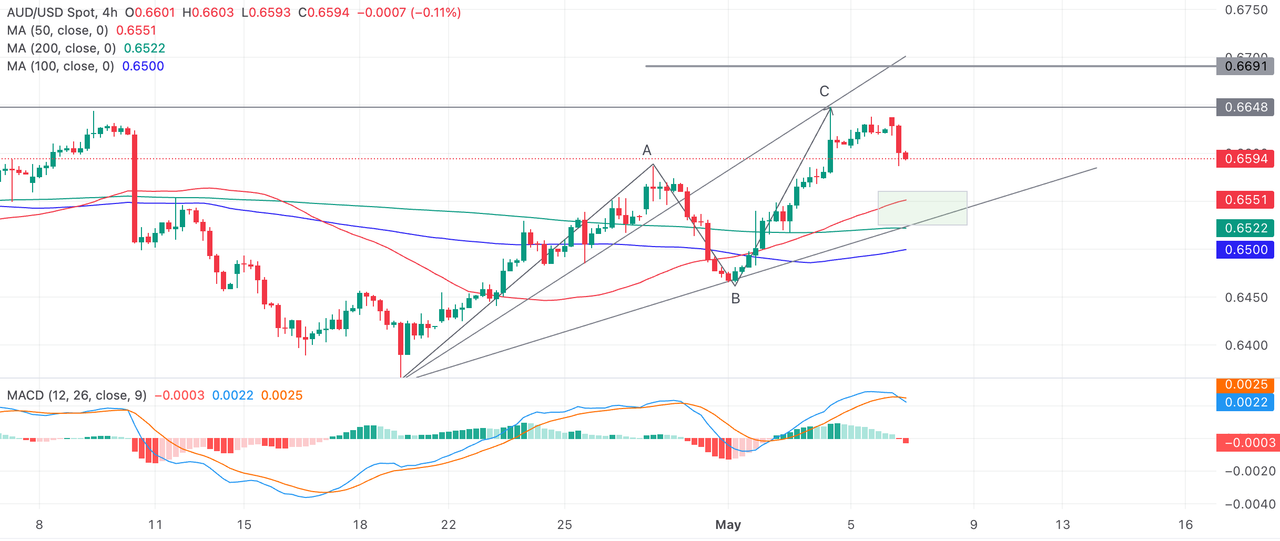
The AUD/USD pair retreats around 40 pips from the vicinity of the 0.6700 mark, or a fresh weekly high set earlier this Thursday and drops to a daily low during the first half of the European session. Spot prices, for now, seem to have stalled the recovery from a four-week trough touched on Wednesday and currently trade around the 0.6670-0.6665 region, nearly unchanged for the day.

Reports that China will cut interest rates on $5 trillion mortgages as soon as this month to try and bolster consumption activity revive concerns about a slowdown in the world’s second-largest economy. This, in turn, weighs on antipodean currencies, including the Australian Dollar (AUD), which, along with a modest US Dollar (USD) strength, turn out to be key factors behind the sharp intraday downfall.

The crucial US Consumer Price Index (CPI) report released on Wednesday indicated that consumer prices in the US are easing overall. That said, the core CPI suggests that the underlying inflation remains sticky and dashed hopes for a larger rate cut by the Federal Reserve (Fed) next week. This leads to an uptick in the US Treasury bond yields and lifts the Greenback back closer to the monthly peak.

Investors, however, seem convinced that the US central bank will begin its policy-easing cycle and lower borrowing costs by 25 basis points at each of the three remaining policy meetings in 2024. This, along with the upbeat market mood, keeps a lid on any further gains for the safe-haven buck and offers some support to the risk-sensitive Aussie. Traders now look to the US Producer Price Index (PPI) for a fresh impetus.

European Central Bank set to resume interest rates cuts in September

European Central Bank set to resume interest rates cuts in September

The European Central Bank (ECB) interest rate decision will be announced alongside the publication of the staff’s updated economic projections following the September monetary policy meeting due on Thursday at 12:15 GMT.

ECB President Christine Lagarde’s press conference will follow, beginning at 12:45 GMT, where she will deliver the prepared statement on monetary policy and respond to media questions. The ECB announcements are likely to rock the Euro (EUR) against the US Dollar (USD).

What to expect from the European Central Bank interest rate decision?

After standing pat on interest rates in July, the ECB is widely expected to reduce key rates by 25 basis points (bps) at its September policy meeting. The interest rates on the main refinancing operations, the marginal lending facility, and the deposit facility will likely be lowered to 4.0%, 4.25%, and 3.50%, respectively.

In June’s post-policy meeting press conference, ECB President Christine Lagarde said that “we are determined not to have a predetermined rate path. September decision is wide open.” “September projections, plus other data, will be taken into account,” Lagarde added.

The accounts of the July ECB meeting showed that September “was widely seen as a good time to re-evaluate” the level of monetary policy restriction.

Since the July meeting, the Eurozone inflation cooled off significantly, returning closer to the central bank’s 2.0% target.

Eurostat’s preliminary data showed on August 30 that the Harmonised Index Of Consumer Prices (HICP) across the currency bloc rose 2.2% over the year in August, marking the lowest annual inflation rate since July 2021. Meanwhile, the Euro area negotiated wages increased at an annual pace of 3.55% in Q2 2024 after rising 4.74% in the first quarter of this year.

The ECB accounts combined with a sharp decline in the pace of wage growth, cooling inflation and weakening Euro area business activity indicate that a rate reduction is a given on Thursday.

Therefore, the ECB’s communication on the path forward and its outlook on inflation and growth will hold the key for the market’s pricing of the future rate cuts and the Euro’s (EUR) next directional move.

Previewing the ECB meeting, TD Securities analysts said: “A 25bps cut is a near-certainty. What matters will be guidance beyond September, where there’s strong pressure on both sides. Wage growth and services inflation remain strong (emboldening the hawks), while growth indicators are flagging softer (emboldening the doves).” “Lagarde is unlikely to rule out an October cut, but quarterly cuts are likely more consistent with the new projections,” the analysts added.

How could the ECB meeting impact EUR/USD?

Heading into the ECB showdown, the Euro is clinging to recovery gains, with EUR/USD reversing from monthly lows of 1.1020. The pair’s fate hinges on the ECB’s outlook on interest rates beyond September.

ECB President Christine Lagarde is likely to stick to the bank’s data-dependent stance and refrain from giving a certain response on the next rate cut move. Unless the policy statement, or Lagarde, hints at more rate reduction coming in the final quarter of this year, the EUR/USD recovery is seen gathering further traction.

Conversely, the Euro could come under renewed selling pressure if the staff projections show downward revisions to both the inflation and economic growth outlook. Meanwhile, Lagarde’s increased confidence in the disinflation progress could also revive Euro sellers. These factors could double down on the dovish expectations, fuelling the resumption of the recent EUR/USD downtrend.

Dhwani Mehta, Asian Session Lead Analyst at FXStreet, offers a brief technical outlook for EUR/USD:

“EUR/USD maintains its bearish streak, especially after the Relative Strength Index (RSI) indicator returned below the 50 level on the daily chart. If sellers flex their muscles, the immediate support of the 50-day SMA at 1.0964 will be tested. Further south, the pair could aim for the strong demand area near 1.0870, where the 100-day SMA and the 200-day SMA coincide.”

“On the upside, the pair needs to find acceptance above the 21-day Simple Moving Average (SMA) at 1.1082 on a daily closing basis to sustain the recovery toward the September 6 high of 1.1155, above which the 1.1200 psychological level will challenge bearish commitments.”

AUD/JPY trades around 95.00 after paring intraday gains

AUD/JPY trades around 95.00 after paring intraday gains

AUD/JPY trims its intraday gains, still trading higher around 95.10 during the European session on Thursday. The Australian Dollar (AUD) appreciated against its peers, driven by improved risk-on sentiment amid rising odds of the Federal Reserve (Fed) beginning its easing cycle with a 25-basis points interest rate cut in September.

However, the Aussie Dollar receives downward pressure as China, one of Australia’s key trading partners, is reportedly set to cut interest rates on $5 trillion worth of mortgages as soon as this month. According to Bloomberg, several Chinese banks are already finalizing preparations for these mortgage rate adjustments, which could take effect as early as September.

Australia’s Consumer Inflation Expectations eased to 4.4% in September, down slightly from August’s four-month high of 4.5%. This decline highlights the central bank’s efforts to strike a balance between bringing inflation down within a reasonable timeframe and maintaining gains in the labor market.

The former Reserve Bank of Australia (RBA) Governor Bernie Fraser criticized the current RBA board for being overly focused on inflation at the expense of the job market. Fraser suggested that the Board should lower the cash rate, warning of “recessionary risks” that could have severe consequences for employment.

The Japanese Yen (JPY) remains subdued following the remarks from the Bank of Japan (BoJ) board member Naoki Tamura. Tamura stated that there is “no preset idea on the pace of further rate hikes.” Unlike in the US and Europe, Japan’s rate hikes are expected to proceed more gradually. The exact timing for when short-term rates in Japan might reach 1% will depend on the economic and price conditions at that time.

EUR/USD hovers above 1.1000 ahead of ECB policy announcements

EUR/USD hovers above 1.1000 ahead of ECB policy announcements

EUR/USD is gyrating in a tight range above 1.1000 in Asian trading on Thursday. Traders assess the latest US CPI inflation data, bracing for the ECB policy announcements amid a positive risk sentiment and sustained US Dollar strength.

The EUR/USD pair extended its weekly decline to 1.1001 on Wednesday, bouncing just modestly ahead of the close. The pair is heading into the Asian opening trading around the 1.1020 level, with an overall bearish stance.

The daily chart for the EUR/USD pair shows that the risk remains skewed to the downside. The pair further extended its slump below a now flat 20 Simple Moving Average (SMA) while the 100 SMA is losing steam a few pips above a flat 200 SMA, both far below the current level. Technical indicators, in the meantime, have pared their slides but remain well into negative levels, far from suggesting downward exhaustion.

Technical readings in the 4-hour chart support another leg south. The 20 SMA gains downward traction below a flat 100 SMA, while EUR/USD bounced modestly after testing the 200 SMA. Finally, technical indicators have bounced from near oversold readings but remain below their midlines and lack directional strength. A break through the 1.1000 level will likely force buyers to give up and encourage sellers, with the pair then aiming to retest the 1.0900 threshold.

Financial markets turned risk-averse following the release of the United States (US) Consumer Price Index (CPI), as the figures weighed down the odds for a Federal Reserve (Fed) 50 basis points (bps) interest rate cut when it meets next week. The US Bureau of Labor Statistics reported that the CPI rose by 2.5% on a yearly basis in August, easing from 2.9% in July, while the core annual figure printed at 3.2%, unchanged from the previous month. Additionally, the core monthly index increased by 0.3%, worse than the 0.2% advance anticipated.

Speculative interest hoped for further easing in price pressures and a more aggressive Fed. As a result, stock markets plunged, with Wall Street posting sharp losses after the opening. Nevertheless, the three major indexes recovered ahead of the close and trimmed most of their early losses. The US Dollar, however, retained a good bunch of its gains across the FX board.

Investors will now focus on the European Central Bank (ECB). The ECB will announce its decision on monetary policy early on Thursday, and is widely anticipated to cut the three main interest rates by 25 bps each. Policymakers will act not only because of easing price pressures but also because of mounting concerns about a potential recession in the Eurozone. Of course, officials will not put that in words, but they will repeat that they will remain vigilant and data-dependent.

Gold (XAU) Daily Forecast: Bullish Bias Holds Above $2,512 Despite Strong USD

Gold (XAU) Daily Forecast: Bullish Bias Holds Above $2,512 Despite Strong USD

Market Overview

Gold prices (XAU/USD) rose on Thursday, climbing to $2,516, with an intraday high of $2,519. Despite this momentum, the precious metal remains below its all-time peak.

The rise in US Treasury bond yields, fueled by diminishing expectations of aggressive rate cuts by the Federal Reserve, has created headwinds for gold, traditionally a non-yielding asset.

Experts trade the markets with IC Markets

Trading Derivatives carries a high level of risk to your capital and you should only trade with money you can afford to lose. Trading Derivatives may not be suitable for all investors, so please ensure that you fully understand the risks involved, and seek independent advice if necessary. A Product Disclosure Statement (PDS) can be obtained either from this website or on request from our offices and should be considered before entering into a transaction with us. Raw Spread accounts offer spread

As a result, the US Dollar (USD) edged closer to its monthly high, dampening the potential for significant gold price gains.

Impact of CPI Data on Gold and Interest Rate Expectations

Gold’s recent price action reflects market adjustments following the latest Consumer Price Index (CPI) report. The CPI data for August revealed a 0.2% monthly increase, with the annual inflation rate slowing to 2.5%—its lowest since February 2021.

Meanwhile, core CPI, excluding volatile food and energy prices, rose by 0.3% in August, meeting market expectations at 3.2% year-over-year. The data prompted investors to reassess the likelihood of a large Federal Reserve rate cut.

Markets now predict an 87% chance of a 25-basis-point cut at the upcoming Fed meeting on September 17-18, up from 71% prior to the CPI release. The decreased odds of a more substantial rate cut have lifted Treasury bond yields, adding pressure on gold prices.

The upcoming Producer Price Index (PPI) report is expected to provide additional insights into inflationary pressures, although its impact may be limited.

Risk-On Sentiment and China’s Economic Outlook Weigh on Gold

In addition to rate-cut expectations, a shift toward risk-on sentiment could reduce demand for safe-haven assets like gold. China’s economic struggles, including deflation risks and a growing trade surplus, have contributed to this sentiment.

Morgan Stanley’s Chief China Economist, Robin Xing, highlighted the potential need for major stimulus measures to address China’s debt-deflation problem.

These developments could further limit gold’s upside, as investor confidence rises and riskier assets become more attractive. Despite these headwinds, gold’s resilience reflects underlying economic uncertainties that continue to support its appeal as a safe-haven asset in volatile markets.

Short-Term Forecast

Gold prices are holding steady above $2,512, but momentum could shift if support breaks. Watch for resistance at $2,539 to gauge potential upside.

Gold Prices Forecast: Technical Analysis

Gold – Chart
Gold – ChartGold (XAU/USD) is trading at $2,516, up by 0.22% as it holds above the critical support level of $2,512.17. The immediate resistance sits at $2,539.43, and a break above this could propel the price toward the next resistance level of $2,548.82.

However, failure to hold the $2,512 support could trigger a sell-off, pushing prices towards the next support at $2,485.44. The 50-day Exponential Moving Average (EMA) at $2,507.22 is providing solid support, while the 200-day EMA at $2,475.18 indicates a broader bullish outlook.

Overall, gold’s technical setup remains cautiously bullish, but a break below $2,512 could shift the momentum.

XRP News Today: US Politics and SEC Appeal Speculation Pressuring Ripple Prices

XRP News Today: US Politics and SEC Appeal Speculation Pressuring Ripple Prices

XRP Ends Four-Day Winning Streak

On Wednesday, September 11, XRP declined by 1.02%, reversing a 0.20% gain from the previous day to close at $0.5355. However, XRP saw heavier losses than the broader crypto market, which declined by 0.73% to a total market cap of $1.974 trillion.

On Tuesday, September 10, Democrat Vice President Kamala Harris and Republican front-runner Donald Trump faced off in a Presidential Debate. There were no references to crypto during the debate, disappointing the crypto market.

Experts trade the markets with IC Markets

Trading Derivatives carries a high level of risk to your capital and you should only trade with money you can afford to lose. Trading Derivatives may not be suitable for all investors, so please ensure that you fully understand the risks involved, and seek independent advice if necessary. A Product Disclosure Statement (PDS) can be obtained either from this website or on request from our offices and should be considered before entering into a transaction with us. Raw Spread accounts offer spread

Trump, who has been wooing the crypto vote since May, remained silent on the topic, even after his earlier statements, including: “If you like crypto in any form… if you’re in favor of crypto, you better vote Trump.”

XRP reacted to the debate, falling to a session low of $0.5235 as polls indicated that Harris outperformed Trump. CNN conducted a poll, asking voters,

“Regardless of which candidate you support, who do you think (did/is likely to do) the better job in the presidential debate?”

Before the debate, voters were evenly split on who would be likely to do a better job in the debate. However, 63% of voters believed Harris did a better job after the debate.

Crypto Community vs. Senator Elizabeth Warren

While the Presidential Debate took center stage, the crypto community also focused on Senator Elizabeth Warren. On Wednesday, Gemini co-founder Tyler Winklevoss reacted to a campaign email from Senator Warren, stating,

“Elizabeth Warren’s latest campaign email couldn’t be more dishonest. She claims the crypto industry’s upset because she “called for fair regulations,” when she’s been waging an unlawful war against it and the 50m Americans who own crypto. Vote for John E Deaton to end the madness.”

In the campaign email, Senator Warren wrote,

“We just discovered that conservative, crypto-funded groups are starting to place six-figure ads against me – spreading misinformation to voters to prop up my Republican opponent. Some of the funders behind these ads are crypto investors like the Winklevoss brothers – Yes those guys from The Social Network – because they’re upset that I’ve called for fair regulations around the industry that protect working people.”

Senator Warren referenced the Digital Asset Anti-Money Laundering Act, which proposes banking-style anti-money laundering and countering the financing of terrorism (CFT) frameworks for the digital asset space.

In December 2023, Senator Roger Marshall admitted that he and Senator Warren drafted the bill with the help of the American Bankers Association. In the same month, Senator Warren invited CEOs from the largest US banks to attend a Banking Committee hearing on Capitol Hill, where JPMorgan CEO Jamie Dimon famously said,

“If I was the government, I would close it down.”

Senator Warren is up against CryptoLawUS founder John E Deaton for the Massachusetts Senate. In contrast to Senator Warren, Deaton represented 75,000 XRP holders in the SEC vs. Ripple case, contributing to the Programmatic Sales of XRP ruling.

As investors consider US political developments, the lingering threat of an SEC appeal in the Ripple case remains an XRP headwind.

Price trends are likely to depend on whether the SEC appeals rulings in the Ripple case. If the SEC appeals, XRP may drop below $0.40. Conversely, XRP could target $1.00 if the SEC does not file an appeal notice, mirroring the market’s response to the Programmatic Sales of XRP ruling.

Price trends hinge on SEC appeal plans.
XRPUSD Reaction to Court RulingsInvestors should closely monitor appeal-related news, which could significantly impact XRP price trends. Stay updated with our latest news and analysis to manage your exposure to XRP and the broader crypto market.

XRP Price Action

XRP Weekly Chart sends bearish near-term price signals.
XRPUSD 120924 Weekly Chart

Daily Chart

XRP remained below the 50-day and 200-day EMAs, confirming bearish price trends.

A breakout from the 200-day EMA could give the bulls a run at the 50-day EMA. Furthermore, a break above the 50-day EMA would signal a bearish trend reversal, supporting a move toward the $0.5739 resistance level.

SEC activity, SEC vs. crypto case-related updates require consideration.

Conversely, a drop below the $0.50 level could indicate a fall to the top trend line.

With a 14-day RSI reading of 42.60, XRP may drop below $0.50 before entering oversold territory.

Daily Chart sends bearish price signals.
XRPUSD 120924 Daily Chart
Japanese Yen Pulls Back: Analysis For USD/JPY, EUR/USD, AUD/USD, NZD/USD

Japanese Yen Pulls Back: Analysis For USD/JPY, EUR/USD, AUD/USD, NZD/USD

USD/JPY Attempts To Settle Above 143.00

USD/JPY
USD/JPY 120924 4h ChartUSD/JPY continues to move away from recent lows as traders focus on the rebound in Treasury yields. The yield of 2-year Treasuries climbed back above the 3.65% level, while the yield of 10-year Treasuries settled near 3.68%.

If USD/JPY settles above the 143.00 level, it will move towards the 50 MA at 143.83. RSI is in the moderate territory, so there is enough room to gain momentum in case the right catalysts emerge.

Experts trade the markets with IC Markets

Trading Derivatives carries a high level of risk to your capital and you should only trade with money you can afford to lose. Trading Derivatives may not be suitable for all investors, so please ensure that you fully understand the risks involved, and seek independent advice if necessary. A Product Disclosure Statement (PDS) can be obtained either from this website or on request from our offices and should be considered before entering into a transaction with us. Raw Spread accounts offer spread

EUR/USD Is Flat As Traders Wait For ECB Decision

EUR/USD
EUR/USD 120924 4h ChartEUR/USD is flat as traders wait for the main event of the week. Today, the ECB will release its Interest Rate Decision. Analysts expect that the ECB will cut the interest rate from 4.25% to 4%. Today, traders had a chance to take a look at Germany’s Wholesale Prices report, which showed that Wholesale Prices declined by 0.8% month-over-month in August. Most likely, the report will not have a major impact on market dynamics as traders will stay focused on the ECB decision.

In case EUR/USD pulls back below the nearest support at 1.0980 – 1.1000, it will move towards the next support level, which is located in the 1.0885 – 1.0900 range.

AUD/USD Continues To Rebound After The Recent Pullback

AUD/USD
AUD/USD 120924 4h ChartAUD/USD gains ground amid rising demand for commodity-related currencies. Oil prices continued to rebound as traders focused on Hurricane Francine, while gold moved back towards the $2520 level.

In case AUD/USD manages to settle above the 50 MA at 0.6704, it will head towards the nearest resistance level at 0.6735 – 0.6750.

NZD/USD Pulled Back Below 0.6150

NZD/USD
NZD/USD 120924 4h ChartNZD/USD made an attempt to settle above the 0.6165 level but lost momentum and pulled back below 0.6150. Today, traders focused on the Food Inflation report, which showed that Food Inflation increased by 0.4% year-over-year in August.

From the technical point of view, NZD/USD must climb above the 0.6165 level to have a chance to gain sustainable upside momentum in the near term.


US Dollar Forecast: Eyes on ECB Rate Decision, EUR/USD and GBP/USD Outlook

US Dollar Forecast: Eyes on ECB Rate Decision, EUR/USD and GBP/USD Outlook

US Dollar Index Holds Firm as Inflation Eases, PPI Data in Focus

The US Dollar Index (DXY) remains steady at 101.76 after softer-than-expected inflation data, with Core CPI rising 0.3% and CPI y/y easing to 2.5%. These figures reduced expectations of aggressive rate cuts by the Federal Reserve.

Investors now shift their attention to the upcoming Core PPI and Unemployment Claims reports.

Experts trade the markets with IC Markets

Trading Derivatives carries a high level of risk to your capital and you should only trade with money you can afford to lose. Trading Derivatives may not be suitable for all investors, so please ensure that you fully understand the risks involved, and seek independent advice if necessary. A Product Disclosure Statement (PDS) can be obtained either from this website or on request from our offices and should be considered before entering into a transaction with us. Raw Spread accounts offer spread

Both are expected to provide further clues on inflationary pressures and the strength of the labor market. If PPI data comes in lower than expected, the dollar may face selling pressure, while stable unemployment claims could provide some support.

US Dollar Index (DXY) – Technical Analysis 

Dollar Index Price Chart - Source: Tradingview
Dollar Index Price Chart
The Dollar Index (DXY) is currently trading at $101.76, down slightly by 0.04%. The pivot point is set at $101.635, which is a crucial level for determining short-term momentum. Immediate resistance stands at $101.915, with additional barriers at $102.086 and $102.268.

On the downside, key support levels are found at $101.453, followed by $101.271 and $101.057. Both the 50-day and 200-day Exponential Moving Averages (EMA) hover around $101.548 and $101.634, reinforcing a cautious bullish outlook.

If the DXY holds above $101.635, the trend remains positive. However, a break below this support could trigger a sharper selling wave.

Sterling Weakens After Disappointing GDP and Trade Data

For the UK, GDP m/m remained stagnant at 0.0%, below the expected 0.2%. Additionally, the goods trade balance widened to £-20.0 billion, signaling slower economic activity. Industrial production fell by -0.8% versus an expected rise of 0.3%, further dampening sentiment around the sterling.

Construction output also contracted by -0.4%, missing expectations. These weak figures suggest that the UK economy may be facing headwinds, raising concerns about potential challenges for the Bank of England in its future monetary policies.

GBP/USD Technical Forecast

GBP/USD Price Chart - Source: Tradingview
GBP/USD Price Chart
The GBP/USD pair is trading at $1.30448, up a modest 0.03%. The pivot point sits at $1.3049, serving as a critical level to watch. Immediate resistance is at $1.3104, with further levels at $1.3143 and $1.3189.

On the downside, key support is found at $1.3013, followed by $1.2975 and $1.2942. The 50-day and 200-day Exponential Moving Averages (EMA) both sit at $1.3085, indicating a critical resistance zone.

If the price remains above $1.3049, the trend holds a bullish bias, but a break below this level could trigger a sharp decline. Keep an eye on the $1.3049 level for short-term direction, as it will dictate near-term momentum.

Euro Slips as ECB Rate Decision Looms Amid Weak German Data

For Euro (EUR), the German WPI m/m dropped by -0.8%, significantly missing the forecast of 0.1%, signaling weakening inflationary pressures. Additionally, Italy’s unemployment rate fell slightly to 7.1%, offering some respite to the Eurozone outlook.

However, the key focus is now on the European Central Bank (ECB), which is expected to cut the Main Refinancing Rate to 3.65% vs. 4.25%. The ECB press conference later today will be crucial for setting the tone on future monetary policy, with traders closely watching for signs of further tightening or dovish shifts.

EUR/USD Technical Forecast

EUR/USD Price Chart - Source: Tradingview
EUR/USD Price Chart
The EUR/USD pair is currently trading at $1.10156, showing a slight uptick of 0.04%. On the technical front, the pivot point stands at $1.10062, serving as the key level to watch. Immediate resistance is at $1.10498, with further levels at $1.10707 and $1.10867.

On the downside, support comes in at $1.09826, followed by $1.09628 and $1.09446. The 50-day Exponential Moving Average (EMA) sits at $1.10412, while the 200-day EMA at $1.10574 suggests the pair is flirting with bearish territory.

If the price stays above $1.10062, the outlook remains cautiously bullish, but a break below this pivot could signal sharp selling pressure ahead.