German Factory Orders Unexpectedly Rise by 2.9% in July on Large Orders

German Factory Orders Unexpectedly Rise by 2.9% in July on Large Orders

German Factory Orders Surprise to the Upside

On Thursday, September 5, the German economy faced increased scrutiny following the recent private sector PMI reports.

Factory orders unexpectedly surged by 2.9% in July, following an increase of 4.6% in June.

Experts trade the markets with IC Markets

Trading Derivatives carries a high level of risk to your capital and you should only trade with money you can afford to lose. Trading Derivatives may not be suitable for all investors, so please ensure that you fully understand the risks involved, and seek independent advice if necessary. A Product Disclosure Statement (PDS) can be obtained either from this website or on request from our offices and should be considered before entering into a transaction with us. Raw Spread accounts offer spread

According to data from Destatis,

  • New orders in other vehicle construction (aircraft, ships, trains, military vehicles) surged 86.5% in July.
  • Orders for the manufacture of electrical equipment jumped 18.6%.
  • However, orders across the mechanical engineering sector slid by 6.1%.
  • Excluding large orders, incoming orders were down 0.4%.

Looking at the broader sectors of the German economy:

  • Orders across the capital goods sector increased by 3.5% in July, while the intermediate goods sector saw orders up 4.4%.
  • The consumer goods sector reported a 5.8% fall in new orders.
  • Orders from overseas advanced by 5.1%, with orders from within the Eurozone increasing by 5.9%.
  • New orders from outside the Eurozone rose by 4.6%.
  • However, domestic orders remained unchanged.
  • From May to July 2024, factory orders were 1.0% higher than in the previous three months.

The July increase in factory orders contrasted with weaker new order trends in the Manufacturing PMI surveys, easing recession risks. According to August’s HCOB Manufacturing PMI survey, inflows of new work fell at the sharpest rate since November 2023, with new export orders also falling markedly. The Manufacturing PMI fell from 43.2 in July to 42.4 in August.

German Factory Orders and the ECB Rate Path

Survey-based economic indicators from Germany suggested an increasing risk of a deep economic recession.

However, the factory order figures paint a rosier picture of the German economy. The upbeat factory order data may ease fears of a lengthy German recession. Nonetheless, the numbers are unlikely to influence the ECB rate path. The ECB remains primarily focused on the services sector and inflation.

EUR/USD Reaction to the Factory Order Slide

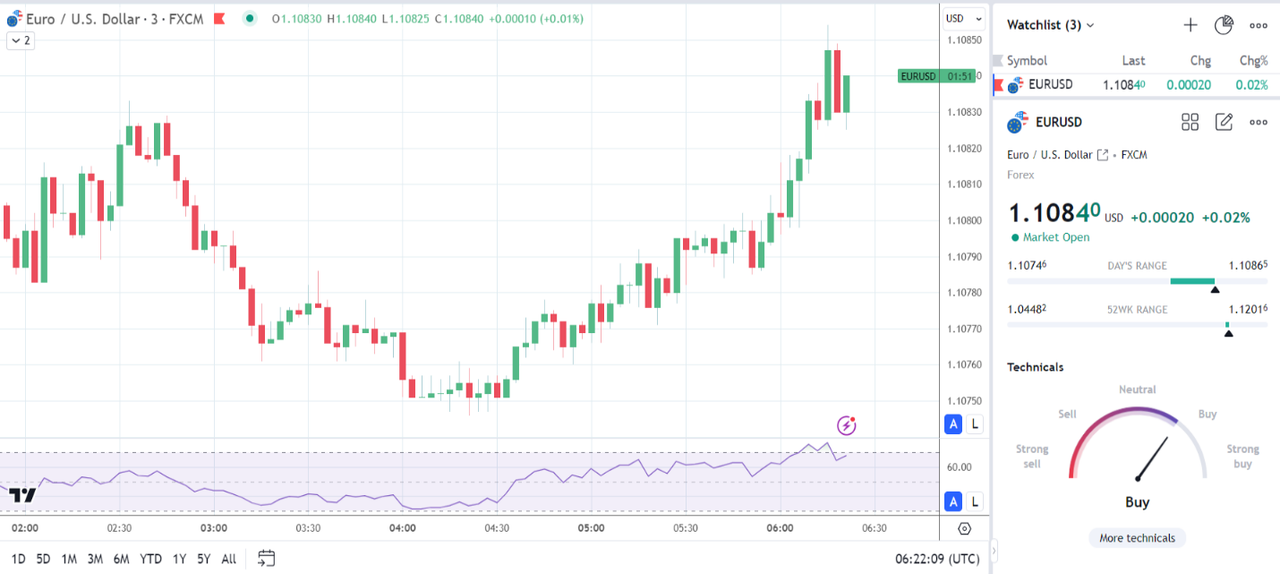
Before the factory order report, the EUR/USD climbed to a high of $1.10865 before falling to a low of $1.10746.

In response to the factory order figures, the EUR/USD dipped to a low of $1.10796 before rising to a high of $1.10854.

On Thursday, the EUR/USD was up 0.02% to $1.10840.

A graph on a white background Description automatically generated

Looking Ahead

Later in the session on Thursday, the US labor market and services sector will draw investor interest.

Economists expect the ADP to report an increase in employment of 145k in August, following a 122k rise in July. Tighter labor market conditions could boost wages, supporting consumer spending that contributes over 60% to the US economy.

Furthermore, economists forecast the US ISM Services PMI to slip from 51.4 in July to 51.1 in August. An unexpected pickup in services sector activity could further ease US recession fears as it accounts for over 70% of the US economy. Easing fears of a US recession and expectations of a September Fed rate cut could boost demand for riskier assets.
Dollar Index Struggles Near $101.35 as Markets Eye ADP Employment Data

Dollar Index Struggles Near $101.35 as Markets Eye ADP Employment Data

Market Overview

The EUR/USD pair is holding steady after a series of mixed European PMI data. Spanish Services PMI came in slightly lower at 54.6 vs. 54.8 expected, while Germany’s Services PMI held at 51.2, matching forecasts.

On the U.S. side, the July trade deficit remained unchanged at -$78.8 billion, while JOLTS Job Openings dropped to 7.67 million, falling short of the expected 8.09 million, signaling potential labor market softness. U.S. factory orders rose 5%, above forecasts of 4.7%.

Experts trade the markets with IC Markets

Trading Derivatives carries a high level of risk to your capital and you should only trade with money you can afford to lose. Trading Derivatives may not be suitable for all investors, so please ensure that you fully understand the risks involved, and seek independent advice if necessary. A Product Disclosure Statement (PDS) can be obtained either from this website or on request from our offices and should be considered before entering into a transaction with us. Raw Spread accounts offer spread

Events Ahead

Investors are eyeing Thursday’s ADP Non-Farm Employment Change, expected at 144K. Unemployment Claims are forecast at 231K.

Additionally, the ISM Services PMI at 51.3 may influence both U.S. 10-year bond yields and the Dollar Index (DXY), which recently traded at 101.24.

These data points could impact EUR/USD, with traders anticipating volatility based on employment and service sector performance.

US Dollar Index (DXY)

Dollar Index Price Chart - Source: Tradingview
Dollar Index Price Chart
The Dollar Index (DXY) is trading at $101.243, slightly down by 0.03%, signaling some short-term weakness. The 4-hour chart shows that DXY has dropped below its pivot point of $101.360, indicating a bearish sentiment. Immediate resistance lies at $101.578, followed by $101.864 and $102.120.On the downside, key support is found at $101.032, with further levels at $100.781 and $100.541. The 50-day Exponential Moving Average (EMA) at $101.491 and the 200-day EMA at $101.775 are adding to the downward pressure.

Unless the price breaks back above $101.360, the trend remains bearish. A break above this pivot could shift momentum toward a more bullish outlook. For now, caution is advised as the DXY trends lower.

US 10-year Bond Yields

US10 Year Bond Yields- Source: Tradingview

US10 Year Bond YieldsThe US 10-year Treasury yield is currently sitting around 3.76%, after a recent drop from 3.88%. This decline in yield reflects a shift toward safer assets, which often leads to a lower yield on bonds as demand rises.

For the US dollar, a falling yield can signal that investors are seeking safety, usually causing some weakening in the dollar’s strength. When Treasury yields decline, it generally reduces the appeal of holding US dollars because it signals lower returns on investments tied to US interest rates.

If this trend continues, it could indicate further pressure on the US dollar in global markets, especially against other major currencies. Key levels to watch include support at 3.73% and resistance near 3.83%.

EUR/USD Technical Forecast

EUR/USD Price Chart - Source: Tradingview

EUR/USD Price ChartEUR/USD is currently trading at $1.10873, up 0.05% on the 4-hour chart. The pair has broken above a key resistance level at $1.10748, which now acts as a crucial support.

Both the 50-day and 200-day Exponential Moving Averages, at $1.10719 and $1.10616 respectively, are reinforcing this support zone. Immediate resistance is seen at $1.11104, followed by $1.11320 and $1.11583.

If the price stays above $1.10748, we could see further bullish momentum. However, a drop below this level might signal a bearish reversal, with key supports at $1.10571 and $1.10330.

For now, the bias remains slightly bullish above $1.10748, with a possible upside toward $1.11104.

Silver (XAG) Daily Forecast: Bearish Sentiment Below $28.40 as China Growth Slows

Silver (XAG) Daily Forecast: Bearish Sentiment Below $28.40 as China Growth Slows

Silver prices declined, trading around $28.31, with an intra-day low of $28.21. Concerns over China’s economic outlook primarily fuel the drop. As a leading global silver exporter, China’s slowing economy has raised worries about reduced industrial demand for the metal.

Bank of America Global Research recently revised its GDP growth forecast for China from 5.0% to 4.8% for 2024, indicating ongoing economic challenges. Weaker industrial usage, combined with a downgraded growth outlook, will likely weigh on silver prices in the near term.

Experts trade the markets with IC Markets

Trading Derivatives carries a high level of risk to your capital and you should only trade with money you can afford to lose. Trading Derivatives may not be suitable for all investors, so please ensure that you fully understand the risks involved, and seek independent advice if necessary. A Product Disclosure Statement (PDS) can be obtained either from this website or on request from our offices and should be considered before entering into a transaction with us. Raw Spread accounts offer spread

China’s Economic Data Signals Weakness

Recent data from China underscores a weakening economy. The Services Purchasing Managers’ Index (PMI) dropped to 51.6 in August from 52.1 in July, missing the forecast of 52.2. This signals a slower pace of growth in the services sector, adding to broader concerns about the country’s economic recovery.

Bank of America’s revised GDP forecasts, which also downgraded 2025 growth to 4.5%, further highlight the potential for lower demand for silver, especially given China’s role as a major player in global industrial metal consumption.

This slowdown adds significant downward pressure on silver prices, as industrial demand could continue to weaken.

Fed Rate Cut Speculation Offers Silver Support

On the U.S. front, growing speculation around a Federal Reserve interest rate cut may provide some support for silver. Recent U.S. economic data, including a weaker-than-expected JOLTS job report, has increased the likelihood of more aggressive monetary easing.

According to the CME FedWatch tool, there is a 43% chance of a 50 basis points (bps) rate cut at the Fed’s next meeting in September. Additionally, market participants are eagerly awaiting Friday’s U.S. Nonfarm Payrolls (NFP) report, which is expected to show 161,000 new jobs.

A weaker jobs report could drive the U.S. dollar lower, making silver more attractive as a non-yielding asset.

Short-Term Forecast

Silver (XAG/USD) remains bearish below $28.40, struggling to break key resistance. A breakout could trigger bullish momentum, but failure may lead to declines toward $28.08.

Silver (XAG/USD) Price Forecast: Technical Outlook

Silver – Chart
Silver
Silver (XAG/USD) is trading at $28.31, up 0.15%, but still faces resistance around the $28.40 mark, which coincides with a key downward trendline. This trendline has been acting as a barrier to further upside, and it’s crucial for silver to break above it to sustain its current momentum.

The 50-day Exponential Moving Average (EMA) sits at $28.48, adding additional resistance, while the 200-day EMA at $28.82 suggests that the broader trend remains bearish unless these levels are breached.

Immediate support can be found at $28.08, with further downside at $27.78 and $27.44. A break below $28.08 could lead to further declines, while a break above $28.40 would signal a potential bullish reversal.

In summary, silver remains bearish, below $28.40, but a breakout could shift sentiment to the upside.

Gold (XAU) Daily Forecast: Fed Rate Cut Speculation Fuels Rally Near $2,500

Gold (XAU) Daily Forecast: Fed Rate Cut Speculation Fuels Rally Near $2,500

Market Overview

Gold prices (XAU/USD) maintained upward momentum, trading firmly around the $2,500 level on Wednesday and reaching an intra-day high of $2,506. This bullish run is driven by increasing market expectations for a more aggressive interest rate cut by the Federal Reserve (Fed) in September, following a sharp decline in U.S. job openings to a three-and-a-half-year low.

Economic uncertainties and cautious sentiment among investors are also boosting the demand for gold as a safe-haven asset.

Experts trade the markets with IC Markets

Trading Derivatives carries a high level of risk to your capital and you should only trade with money you can afford to lose. Trading Derivatives may not be suitable for all investors, so please ensure that you fully understand the risks involved, and seek independent advice if necessary. A Product Disclosure Statement (PDS) can be obtained either from this website or on request from our offices and should be considered before entering into a transaction with us. Raw Spread accounts offer spread

Despite the favourable backdrop, traders remain cautious ahead of Friday’s U.S. Nonfarm Payrolls (NFP) report, a key economic indicator that could significantly influence market sentiment.

Attention is now focused on upcoming U.S. economic data, including Thursday’s ADP employment report, Weekly Jobless Claims, and ISM Services PMI, all expected to provide short-term trading opportunities and deeper insights into the Fed’s likely course of action.

US Dollar Weakens as Fed Rate Cut Speculation Grows

The U.S. dollar has faced downward pressure amid growing speculation that the Federal Reserve may implement a more substantial rate cut in September. The latest U.S. labor market report revealed that job openings fell to 7.673 million in July, the lowest level since January 2021. June’s figures were also revised lower, further signaling a weakening job market.

Additionally, the Fed’s Beige Book report showed a decline in economic activity in nine out of twelve U.S. regions in August, compared to just five regions in mid-July. This economic slowdown, coupled with comments from Fed officials suggesting that the current restrictive policy may not be needed much longer, has fueled speculation of a significant rate cut.

The CME Group’s FedWatch Tool indicates a 45% probability of a 50-basis-point rate reduction at the Fed’s September 17-18 meeting.

Bond Yields Decline, Supporting Gold Prices

The dovish outlook on U.S. monetary policy has driven the yield on two-year U.S. Treasury bonds to its lowest level since May 2023, with the 10-year yield also dropping to its lowest point since July.

Lower bond yields and a weaker U.S. dollar have provided additional support for gold, which remains an attractive investment during times of economic uncertainty. As global equity markets soften, gold continues to benefit as a non-yielding, safe-haven asset.

In the coming days, economic reports and market data will further clarify the trajectory of U.S. monetary policy, with investors closely watching for signals that could push gold prices even higher.

Short-Term Forecast

Gold (XAU/USD) remains bullish, hovering near $2,500. A break above $2,506.59 could lead to further gains, while a drop below $2,498 may trigger a short-term correction.

Gold Prices Forecast: Technical Analysis

Gold – Chart
Gold – ChartGold (XAU/USD) is trading at $2,497.38, up by 0.08%, showing bullish momentum. The precious metal is testing key resistance near the $2,500 mark, with the 50-day Exponential Moving Average (EMA) at $2,497.78 acting as a pivotal support level.

If prices can break through immediate resistance at $2,506.59, we could see a continuation toward the next targets at $2,515.34 and $2,525.45. However, if gold falls below its pivot point at $2,498.18, it may encounter immediate support at $2,486.66, with further downside risks toward $2,479.35.

Gold maintains a bullish outlook, but staying above $2,498 is crucial to sustaining this upward trend.

Oil News: Crude Oil Prices Slide as Bearish Sentiment Takes Hold – Key Levels Broken

Oil News: Crude Oil Prices Slide as Bearish Sentiment Takes Hold – Key Levels Broken

Crude Oil Prices Remain Under Pressure Amid Bearish Sentiment

Light crude oil futures fell on Wednesday, extending losses from the previous session as prices plunged to their lowest level since February 8. The market continues to trend downward, with key support levels at $71.46, $70.50, and $69.50 being broken, signaling further weakness in oil prices.

The 52-week range for crude oil stands between $63.21 and $83.66, but prices are now trading below significant technical levels. The market is struggling under the 50% to 61.8% Fibonacci retracement zone ($73.44 to $71.02), and both the 200-day and 50-day moving averages are acting as resistance, at $74.26 and $76.45, respectively.

Experts trade the markets with IC Markets

Trading Derivatives carries a high level of risk to your capital and you should only trade with money you can afford to lose. Trading Derivatives may not be suitable for all investors, so please ensure that you fully understand the risks involved, and seek independent advice if necessary. A Product Disclosure Statement (PDS) can be obtained either from this website or on request from our offices and should be considered before entering into a transaction with us. Raw Spread accounts offer spread

At 10:26 GMT, Light Crude Oil futures are trading $69.42, down $0.42 or -0.60%.

Daily Light Crude Oil

Libyan Oil Developments and Global Supply

Despite bearish momentum, traders remain cautious about potential supply disruptions. Reports of a possible resolution to Libya’s political turmoil have triggered a sell-off. Libya’s legislative bodies reached an agreement to appoint a new central bank governor within 30 days, potentially leading to the resumption of crude exports. Libya’s oil production has been severely impacted, dropping from 1.28 million barrels per day (bpd) in July to just 591,000 bpd as of August 28. The resumption of Libyan oil exports could bring additional supply to the market, adding further pressure on prices.

In contrast, news of ongoing attacks on oil tankers in the Red Sea, attributed to the Houthi group in Yemen, was largely ignored by traders. Although the attacks emphasize the risk of further disruptions, the market remains focused on bearish developments.

Weak Demand Outlook Weighs on Prices

The global demand outlook continues to drag on oil prices. Weak economic data from China, the world’s largest oil importer, and the U.S. have raised concerns about sluggish fuel demand. China’s manufacturing activity hit a six-month low in August, and the U.S. Institute for Supply Management’s report showed subdued factory output. Although China’s oil imports rebounded in August to 11.02 million bpd from July’s 9.97 million bpd, the overall demand picture remains weak for the first eight months of the year.

Additionally, OPEC’s production fell to 26.36 million bpd in August, driven mainly by the decline in Libyan output. Despite this reduction, oil prices have not responded positively, as investors are more focused on demand concerns rather than supply disruptions. Further supply increases, such as the planned OPEC+ production hike in October, could add downward pressure on prices.

Market Forecast

In the short term, the outlook for crude oil remains bearish. Prices are trading below key technical levels, and negative sentiment around demand from China and the U.S. dominates market movements. While potential developments in Libya may temporarily halt the price decline, they are unlikely to reverse the broader downtrend. Traders should watch for any unexpected developments from OPEC+ or geopolitical events that could trigger a short squeeze, but for now, the market remains vulnerable to further downside risk.

Dollar Index (DXY) Faces Pressure as US Treasury Yields Hold Below 3.85%

Dollar Index (DXY) Faces Pressure as US Treasury Yields Hold Below 3.85%

Market Overview

Tuesday’s economic data had mixed results for the U.S. and Europe. The ISM Manufacturing PMI for the U.S. came in lower than expected at 47.2, below the forecast of 47.5, signaling continued contraction in the manufacturing sector.

However, ISM Manufacturing Prices were stronger at 54.0, indicating rising costs. On the European side, Spanish and Italian Services PMIs missed expectations, while France and Germany’s numbers remained in line with forecasts.

Experts trade the markets with IC Markets

Trading Derivatives carries a high level of risk to your capital and you should only trade with money you can afford to lose. Trading Derivatives may not be suitable for all investors, so please ensure that you fully understand the risks involved, and seek independent advice if necessary. A Product Disclosure Statement (PDS) can be obtained either from this website or on request from our offices and should be considered before entering into a transaction with us. Raw Spread accounts offer spread

Events Ahead

Looking forward, the EUR/USD pair will likely be influenced by upcoming economic reports, including the Eurozone’s PPI and the U.S. JOLTS Job Openings, which are forecasted to drop slightly to 8.09M.

Additionally, U.S. 10-year bond yields remain elevated, which could bolster the Dollar Index (DXY), currently near 101.68.

A widening U.S. trade deficit, expected at -$78.8B, might also impact market sentiment, potentially driving further volatility in EUR/USD.

US Dollar Index (DXY)

Dollar Index Price Chart - Source: Tradingview
Dollar Index Price Chart
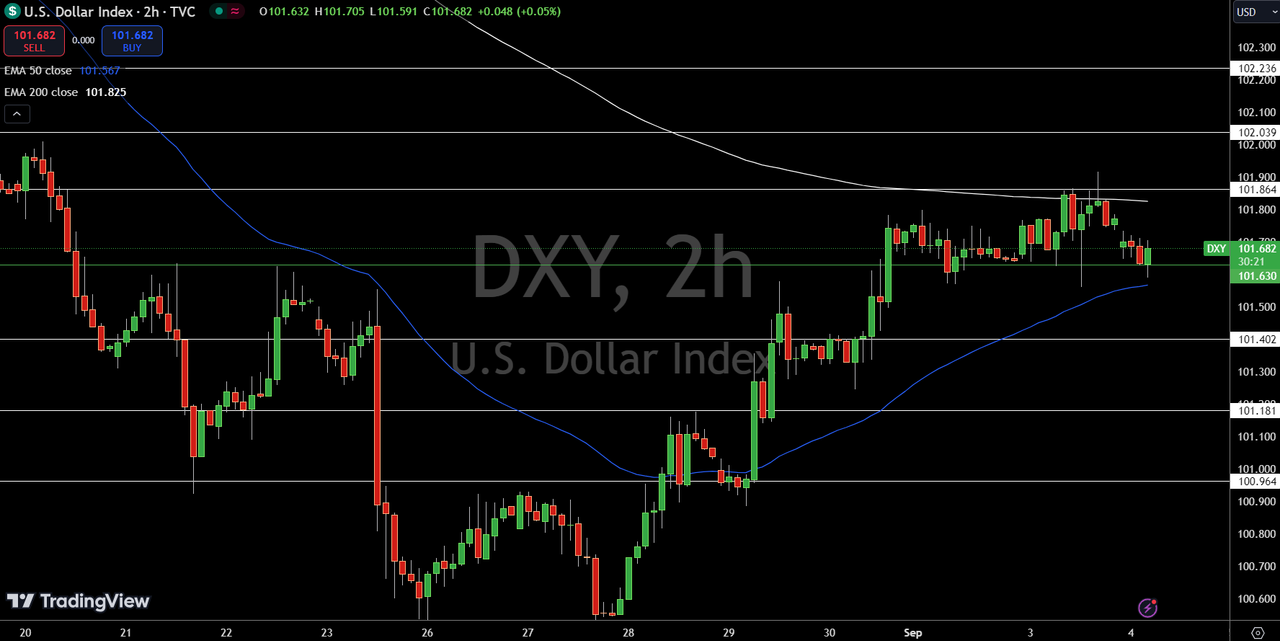
The Dollar Index (DXY) is trading at $101.684, down 0.09% on the 4-hour chart. The pivot point sits at $101.630, with immediate resistance at $101.864 and further levels at $102.039 and $102.236. On the downside, support is seen at $101.402, followed by $101.181 and $100.964.

The 50-day Exponential Moving Average (EMA) at $101.567 is offering support, suggesting potential for a bullish reversal if the price stays above the pivot. However, a break below $101.630 could trigger further selling pressure.

US 10-year Bond Yields

US10 Year Bond Yields- Source: Tradingview
US10 Year Bond YieldsThe U.S. 10-year Treasury yield is consolidating around 3.83% after a drop from 3.90%, indicating some uncertainty in bond markets. The 50-day EMA at 3.85% is providing immediate resistance, while the 200-day EMA at 3.88% signals a more significant barrier to any upside.

If yields break below 3.80%, we could see further declines toward 3.76%. This decline in yields often correlates with a weaker U.S. dollar, as lower yields reduce demand for dollar-denominated assets.

Conversely, if yields bounce above the 3.85% level, the U.S. dollar could see renewed strength, making it more attractive to investors globally.

EUR/USD Technical Forecast

EUR/USD Price Chart - Source: Tradingview
EUR/USD Price ChartThe EUR/USD is currently trading at $1.1094, up 0.06% on the 4-hour chart, but facing strong resistance. The pivot point is at $1.10596, with immediate resistance at $1.10884, followed by $1.11110 and $1.11317.

On the downside, support is seen at $1.10330, with further levels at $1.10112 and $1.09854. The 50-day EMA sits at $1.10693, while the 200-day EMA aligns closely at $1.10599.

The downward channel presents significant resistance, keeping a bearish bias below $1.10596. If EUR/USD breaks above this pivot level, we could see bullish momentum resume.

Silver (XAG) Daily Forecast: Can China’s Rising Demand Break Silver’s Downward Trend?

Silver (XAG) Daily Forecast: Can China’s Rising Demand Break Silver’s Downward Trend?

Market Overview

Silver (XAG/USD) is facing challenges in rebounding from early losses, currently trading around $27.92 after hitting an intra-day low of $27.88.

This decline is largely due to a stronger US dollar and increased expectations for aggressive Federal Reserve rate cuts, spurred by mixed economic data.

Experts trade the markets with IC Markets

Trading Derivatives carries a high level of risk to your capital and you should only trade with money you can afford to lose. Trading Derivatives may not be suitable for all investors, so please ensure that you fully understand the risks involved, and seek independent advice if necessary. A Product Disclosure Statement (PDS) can be obtained either from this website or on request from our offices and should be considered before entering into a transaction with us. Raw Spread accounts offer spread

Traders are now closely watching key reports, including Wednesday’s JOLTS Job Openings and the Fed’s Beige Book, as well as Friday’s highly anticipated August Nonfarm Payrolls (NFP) data.

These releases could shape market expectations about the timing and magnitude of potential Fed policy shifts.

China’s Rising Silver Demand Could Push Prices Higher

On a more positive note, China’s growing demand for silver could support future price gains. According to the Shanghai Metals Exchange, silver prices in China are about 10% higher than in the West, signaling robust domestic demand.

In the last year, Chinese silver imports have surged, with imports exceeding 400 tons in both June and July, compared to the previous year’s monthly average of 200 tons.

China’s booming solar panel industry and tech sector are driving this increased demand, and as global production falls short of demand, analysts warn of a potential “silver squeeze.”

If silver continues to be under-supplied, this could push prices higher, impacting industries such as electronics and solar energy, particularly in Western markets.

Short-Term Forecast

Silver remains under bearish pressure, trading below $28.09. Key support is at $27.54, with resistance at $28.66. A break above $28.09 could shift sentiment to bullish.

Silver (XAG/USD) Price Forecast: Technical Outlook

Silver - Price Chart
Silver (XAG/USD) is trading at $27.92, down 0.43%, reflecting continued bearish sentiment. The 4-hour chart shows silver struggling to hold above the pivot point at $28.09. Immediate resistance sits at $28.66, with further resistance levels at $28.98 and $29.42. On the downside, support is found at $27.54, followed by $27.24 and $26.92.Technical indicators suggest a bearish outlook. The 50-day Exponential Moving Average (EMA) at $28.65 and the 200-day EMA at $28.90 are acting as significant resistance, reinforcing downward pressure.

The downward channel is also maintaining a bearish bias. If prices remain below $28.09, we could see further declines. However, a break above this level might signal a bullish reversal.

The Crypto Cap Sinks Below $2 Trillion

The Crypto Cap Sinks Below $2 Trillion

Pressure on the crypto market returned on Tuesday and intensified on Wednesday morning, with capitalisation falling 4.8% to $1.98 trillion. This is below the psychological support line that attracted buyers for most of August and is the lowest level since 8 August. The nature of the decline early in the day suggests another wave of stop orders during a period of reduced liquidity, so it is too early to say that the $2 trillion support has been breached.

On Tuesday, bitcoin sellers took the initiative first on the approach to $60,000 and then at $59,000, supported by the growing sell-off in traditional markets. Bitcoin fell to $55.5K at the peak of the decline, before stabilising at $56.4K. Current levels acted as support during the May and July declines, but the trend of lower local lows sets up a reversal at $54K at the earliest.


Like other altcoins, Ethereum‘s local high was on August 24th, two days before bitcoin reversed and interrupted a corrective rebound. Technically, a retest of the 5 August lows around $2100 is now more likely.

Crypto News

Former BitMEX CEO Arthur Hayes attributes Bitcoin’s fall to a lack of liquidity. He estimates that this situation will continue as long as the US Treasury’s four-week T-bill rate is lower than the Reverse Repo Rate (RRP). Currently, the spread is minus 0.92%.

QCP Capital, citing seasonality, says it makes strategic sense to accumulate bitcoin in September and then take profits in October or near the end of the year. September has historically been negative for all asset classes, including BTC. October has been the opposite—in eight of the last nine years, the top cryptocurrency has gained an average of 22.9%.

The developers of BNB Smart Chain (BSC) reported on the growth of the ecosystem on the fourth anniversary of the launch of the core network. The number of daily active users of BSC reached 1.2 million and of opBNB 2.7 million.

The decentralised forecasting platform Polymarket has been integrated into the Bloomberg Terminal, according to its founder Shane Coplan.

AUD/USD: Corrective pullback finds interim support – OCBC

AUD/USD: Corrective pullback finds interim support – OCBC

The Australian Dollar’s (AUD) double-top bearish reversal gets underway, OCBC FX strategists Frances Cheung and Christopher Wong note.

Further downside towards 0.6640 is possible

“Pair was last at 0.6715 levels. Bullish momentum on daily chart faded while RSI fell. Recent pullback may have found an interim support at 0.67 (21 DMA). Decisive break may open room for further downside towards 0.6640. Resistance at 0.6730, 0.6790.”

“2Q GDP released this morning was largely in line with estimates while services PMI held up. With domestic data out of the way. AUD should revert to taking cues from equity sentiments and USD moves in the coming sessions.”

US: Soft landing still in sight – Danske Bank

US: Soft landing still in sight – Danske Bank

Economic growth is slowing mostly in line with our expectations, but we think recession risks remain low. We make only marginal adjustments to our forecast profile and see 2024 GDP growth at 2.5% (from 2.3%) and 2025 at 1.5% (unchanged), Danske Bank macro analysts note.

Fed to reach a terminal policy rate of 3.00-3.25%

“Potential output continues to grow at a brisk pace, supported by increases in labour supply, solid productivity growth and fiscal policy driven demand for manufacturing investments.”

“Risks to the outlook remain somewhat skewed to the downside. The current low savings rate indicates that consumers’ buffers remain weak. Slow monetary policy pass-through and high share of fixed rate mortgages suggest that rate cuts will not provide a rapid boost to economic growth, if the outlook deteriorates faster than we expect.”

“Inflation forecasts have been adjusted modestly lower. We see headline inflation averaging 2.9% in 2024 (from 3.2%) and 2.2% in 2025 (from 2.5%) and core inflation at 3.3% in 2024 (from 3.4%) and 2.4% in 2025 (from 2.6%). We now expect the Fed to cut interest rates by 25bp at every meeting from September until June 2025 (prev. only every other meeting from September), followed by two final cuts in H2 2025 (terminal rate 3.00-3.25%; prev. 3.75-4.00%).”