Asia Day Ahead: Gold at March 2023 low, USD/JPY Hovers Below Key 150.00 Level

Asia Day Ahead: Gold at March 2023 low, USD/JPY Hovers Below Key 150.00 Level

A slight breather in the Treasury yields rally allowed Wall Street to turn in a positive session overnight, while VIX retraced for the second straight day after nearing its key psychological 20 level, which are generally looked upon as the divide between stable or more stressful periods. The rate-sensitive Nasdaq 100 index found room for greater relief (+0.8%) and if it manages to close at or above the current level today, that could help form a weekly bullish pin bar to kickstart next week.

Overnight, the final read for US 2Q gross domestic product (GDP) offered mixed views. A significant downward revision in consumer spending (0.8% vs previous 1.7%) may question how far the current economic resilience may last, but at least for now, the weakness was masked by an upward revision to business fixed investment (7.4% vs previous 6.1%). Overall, that supported a still-resilient 2Q growth expansion of 2.1%, in line with expectations.

Ahead, the US PCE price index data will be on watch, which is expected to display stronger growth in headline inflation (3.5% vs previous 3.3%), but further moderation in the core aspect (3.9% vs previous 4.2%). If it turns out as expected, this may mark a new low in core PCE inflation since October 2021 and provides some validation for current rate expectations that the Fed may not follow through with its last rate hike in November/December.

One to watch may be the SPDR S&P Semiconductor ETF, which managed to defend the neckline of a head-and-shoulder formation on the daily chart, while its daily Moving Average Convergence/Divergence (MACD) is attempting for a bullish crossover. A series of resistance still lies ahead for the sector to overcome, with the daily Relative Strength Index (RSI) still trading below the 50 level as an indication of sellers in control. On the upside, immediate resistance may stand at the 200.00 level, while any failure to defend the neckline may pave the way to retest the 174.00 level next.
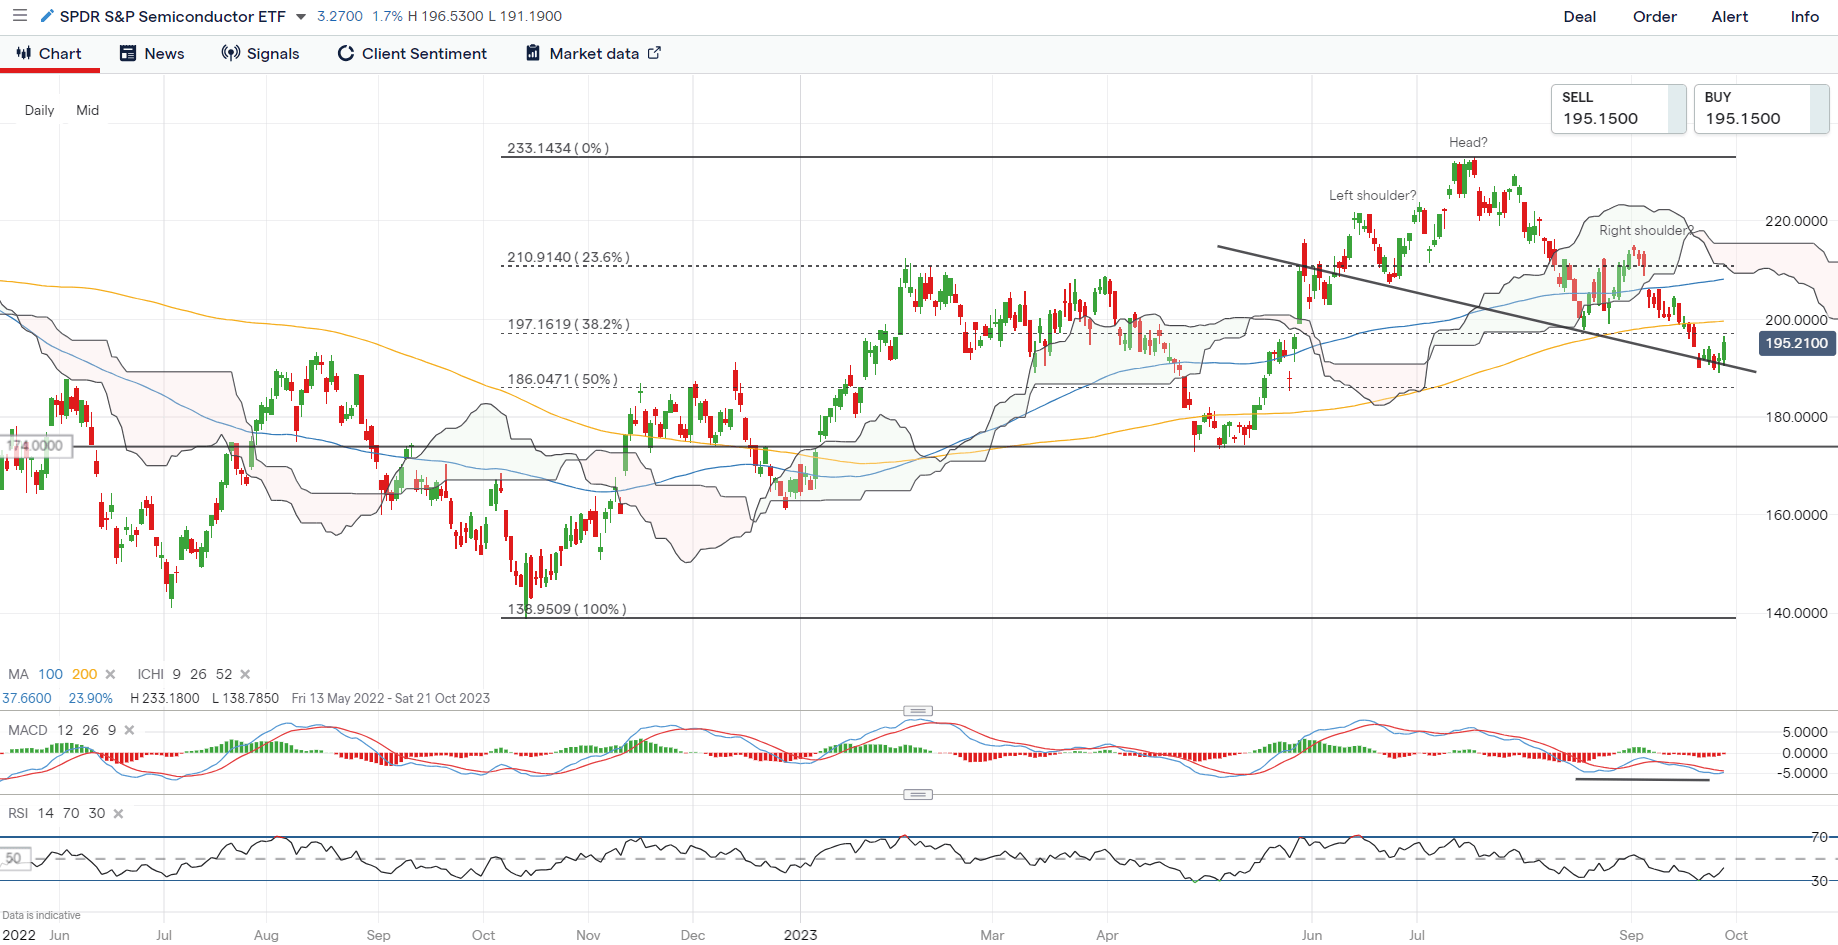
image1.png

Asia Open

Asian stocks look set for a slight positive open, with Nikkei +0.02%, ASX +0.28% and NZX +0.45% at the time of writing. Given that several markets are closed for holiday today (China and Taiwan closed for Mid-Autumn Festival, South Korea closed for Chuseok), overall sentiments could be more subdued, despite lower bond yields and a weaker US dollar providing room for some near-term relief.

Economic data this morning saw a lower-than-expected core consumer price index (CPI) read in Tokyo (2.5% vs 2.6% forecast), which is generally looked upon as a precursor to the nationwide inflation number. Tokyo’s headline inflation has also turned in softer at 2.8% from previous 2.9%, registering its lowest level since September 2022. The still-declining growth trend in core inflation may not provide the conviction for the Bank of Japan’s (BoJ) ‘sustainable 2% inflation’ condition for a policy pivot just yet, although rate expectations remain firm that the central bank may be forced to abandon its negative interest rate policy in 1Q 2024.

The USD/JPY continues to trade within an upward channel pattern for now, supported by widening US-Japan bond yield differentials in light of the ongoing policy divergence between both central banks. But as the pair nears the key psychological 150.00 level, which marked the Japanese authorities’ intervention efforts back in October 2022, market watchers has grown more wary that they may pull the trigger once more, with the heavy net-short positioning in Japanese yen speculative bets potentially accelerating any move to the downside for the USD/JPY. The 150.00 level remains a key resistance to overcome, while on the downside, the 148.00 may serve as immediate support to hold, followed by the 145.80 level.
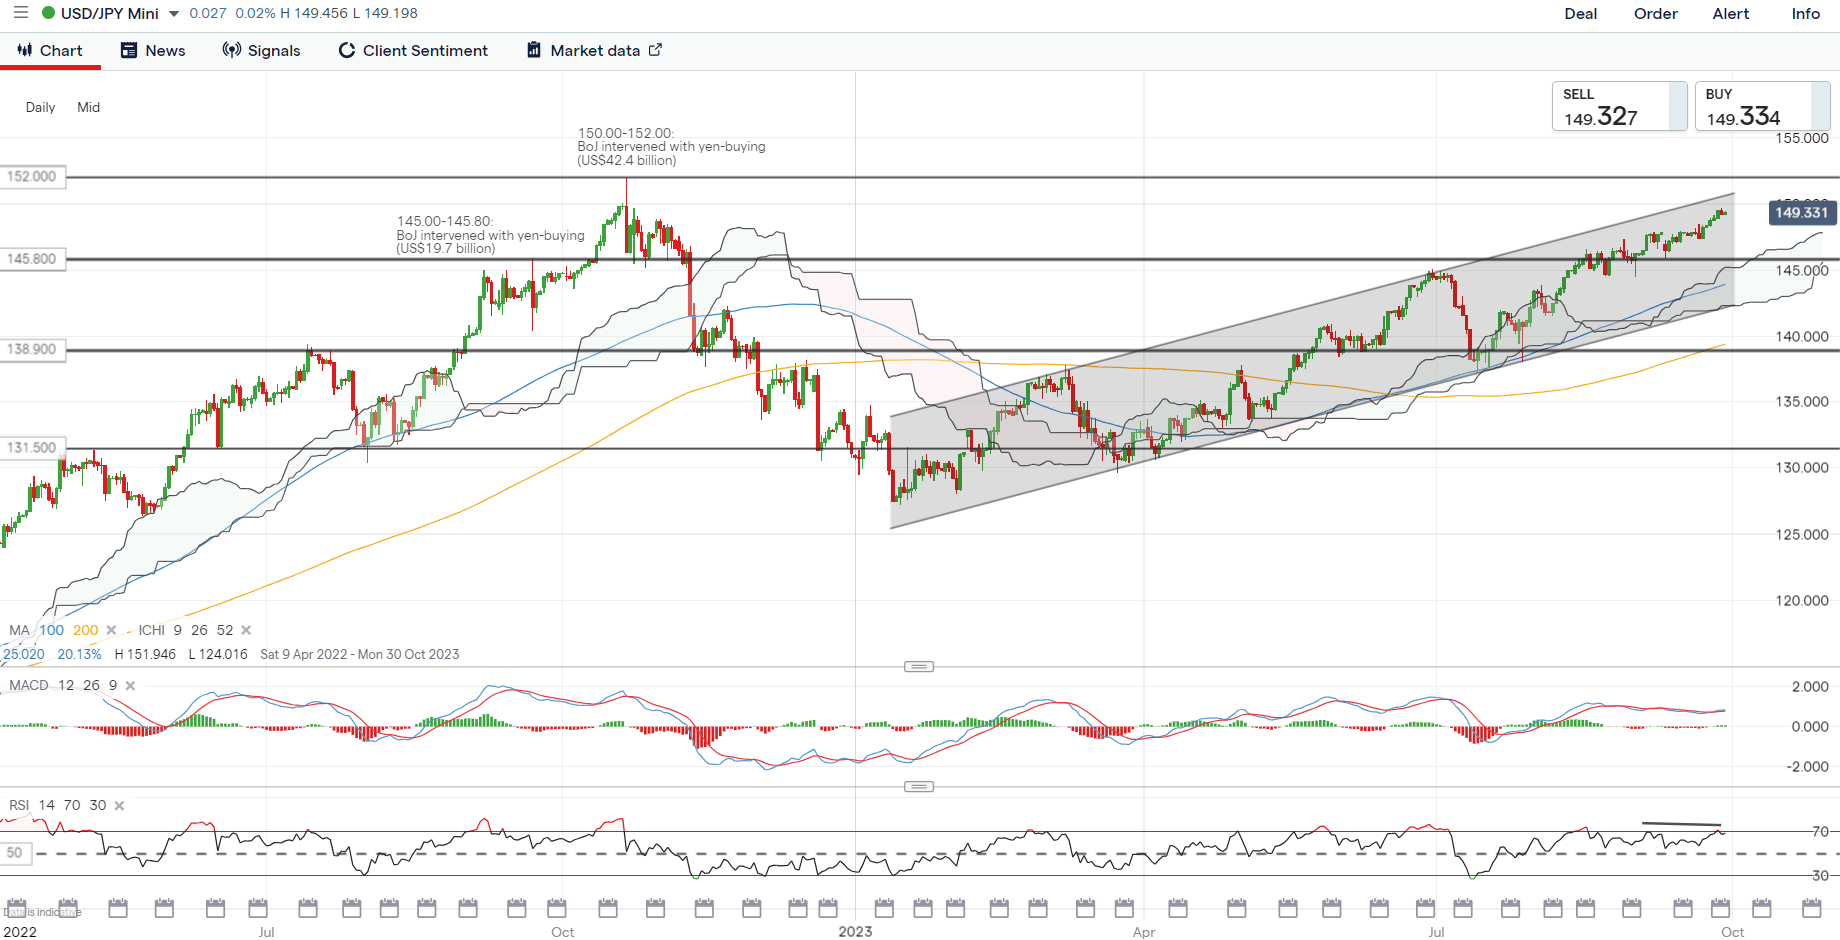
image2.png

On the watchlist: Gold prices at March 2023 low

Despite some cooling in the US Treasury yields rally and a weaker US dollar overnight, gold prices did not manage to gain much traction overnight, hovering around its lowest level since March 2023. Near-term technical conditions in oversold levels may translate to an attempt to stabilise ahead, but the broader trend remains downward bias, given the formation of lower highs and lower lows since May 2023.

To reinforce sellers in broader control for now, its weekly RSI continues to trade below the 50 level. Any relief may leave the resistance level at the US$1,900 level on watch for buyers to overcome, with more conviction for buyers potentially having to come from a move back above its 100-day MA.
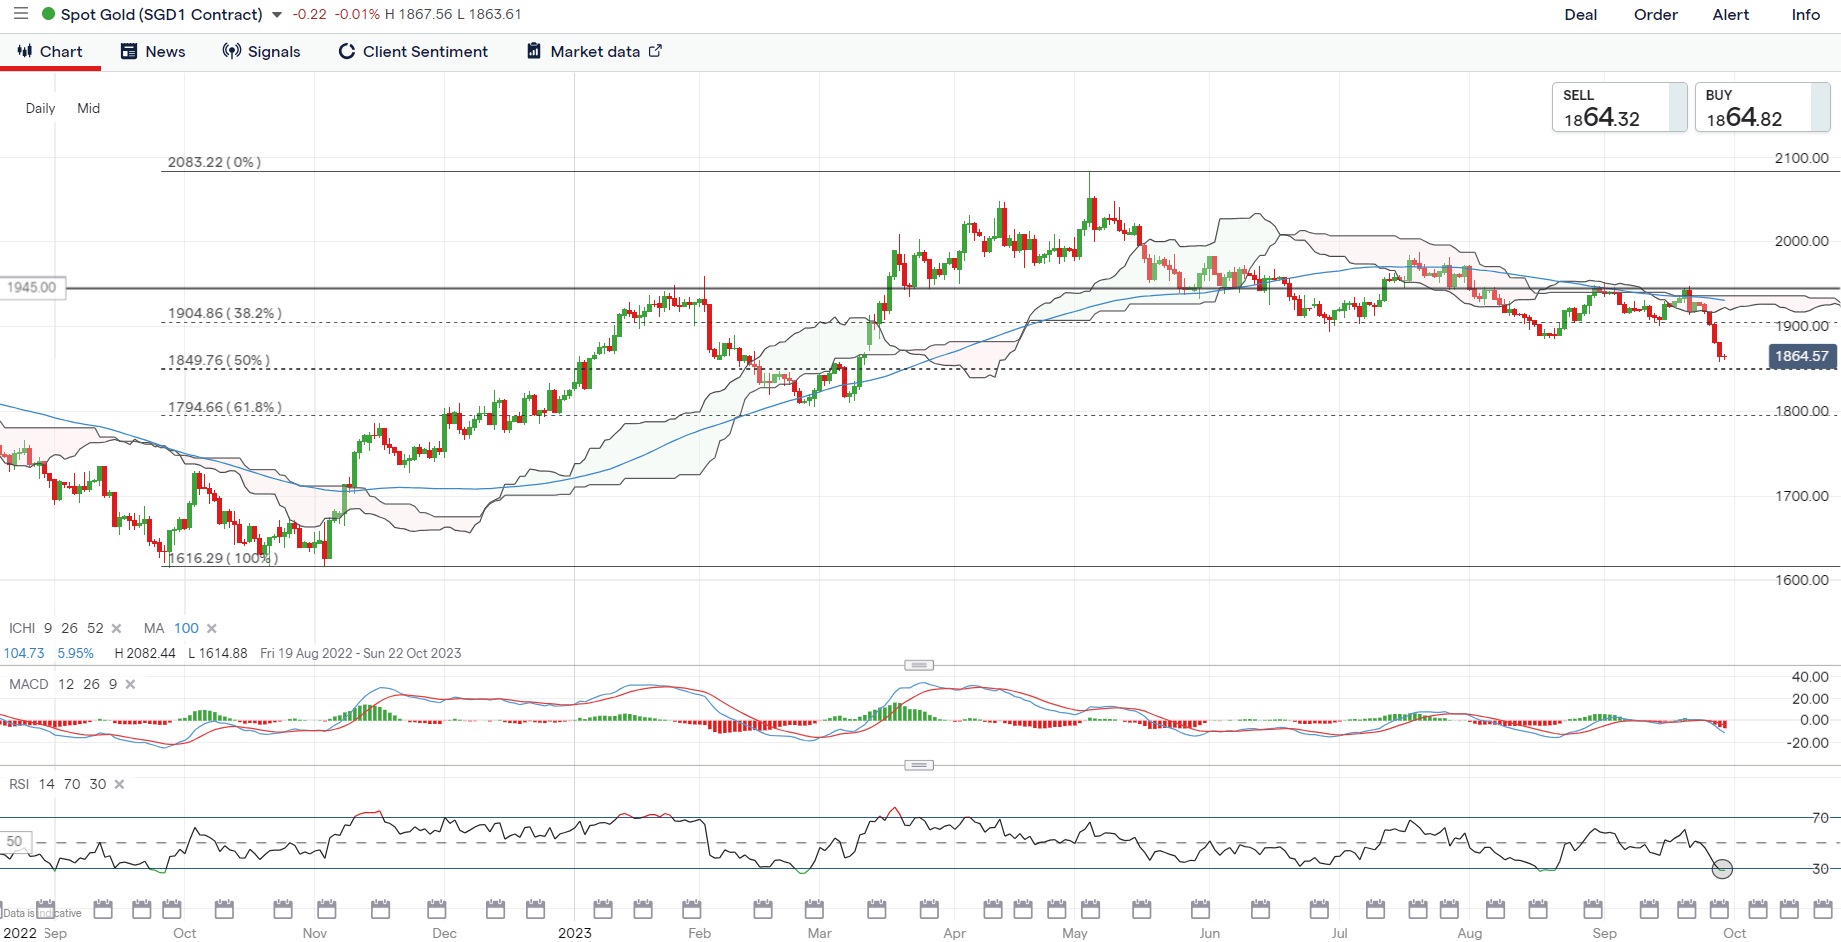
image3.png

How Do the US Dollar, Gold, S&P 500, and More Trade at the Onset of Recessions?

How Do the US Dollar, Gold, S&P 500, and More Trade at the Onset of Recessions?

The onset of recessions in the United States typically results in reoccurring financial market trading patterns. While not all of them will be the same, we can look back and see how key assets have performed. This is a special report that analyzes how the US Dollar, gold, S&P 500, Australian Dollar and 10-year Treasury yield traded during the first 3 months of economic downturns.

The length and severity of each recession will vary. This means the usual reaction you might expect from an asset during the onset of a downturn will not always repeat perfectly. For example, during the 2000s housing crash, the US entered a recession in Q4 of 2007. While the stock market declined during these 3 months as one might have expected, peak market volatility occurred much later towards the end of 2008.

Before diving into this topic, I need to set the ground rules, starting with the definition of a recession. In this study, I will be using a GDP-based recession indicator, which attempts to assign dates to downturns based on a mathematical model. This is as opposed to the NBER’s Business Cycle Dating Committee playbook, which can at times be subjective. You can learn more about the indicator I am referencing here.

This definition is also different from the widely referenced two consecutive quarters of negative growth, which is unofficial and often too simplistic, failing to capture other economic trends. For example, in 2022, the economy experienced 2 quarters of negative growth in Q1 and Q2. But, the labor market outperformed.

For analyzing the US and Australian Dollars, I will be using a correlation-weighted currency index instead of an exchange rate. This helps us capture the broader direction of a currency against the world rather than any individual unit. Otherwise, comparing AUD/USD with the DXY Dollar Index runs the risk of placing too much emphasis on the greenback.

Average Snapshot

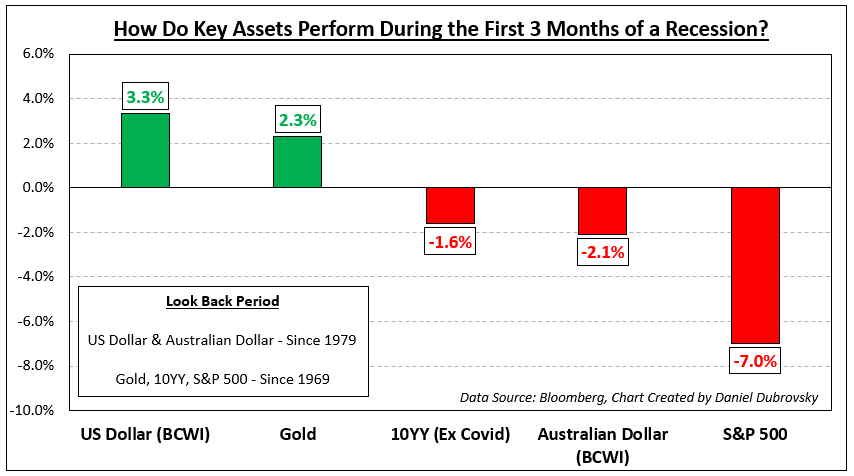
The chart below is a snapshot of how these assets performed during the onset of recessions ordered from best performing to the worst. The sequence is as follows: US Dollar, gold, 10-year Treasury yield, Australian Dollar and S&P 500. The availability of currency data meant I could only look back to 1979. For the rest of the assets, I was able to look back to 1969. The remainder of this article breaks down the individual performance beginning with the US Dollar.

Average Snapshot

US Dollar

Looking back to recessions since 1979, which adds up to 6, the Bloomberg Correlation-Weighted US Dollar Index rose 3.3% on average in the first 3 months of economic downturns. That is not to say each time it climbed. The up/down ratio is 50%. But, as you can see in the chart below, when the dollar rallies, it tends to do so strongly. During periods when the currency fell, the downside reaction was much weaker. This should come as little surprise. In the currency spectrum, the US Dollar functions as a haven given its status as the world’s reserve currency.

US Dollar

Gold

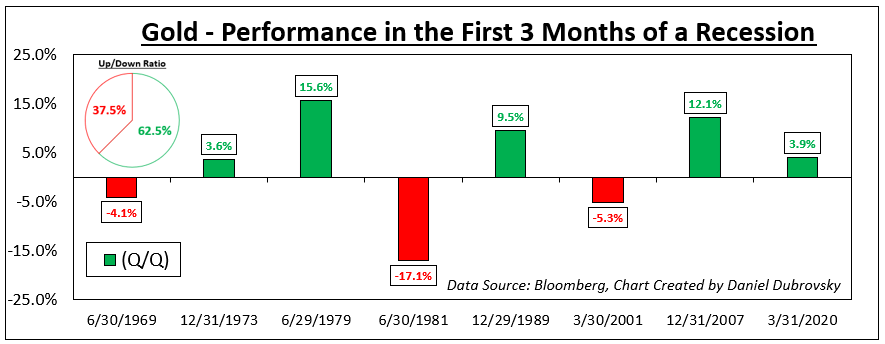
Meanwhile, gold also tends to perform decently at the onset of recessions going back to 1969. On average, the yellow metal returned +2.3% with a win/loss ratio of about 62.5%. Like the US Dollar, the wins were stronger than your average losses, excluding the early 1980s recession (-17.1%). Does this make gold a haven? Remember that gold is not as liquid as a currency. XAU/USD tends to function as an anti-fiat instrument. When the return on cash dwindles, which is what usually happens during recessions, gold becomes relatively more attractive and vice versa.

Gold

10-Year Treasury Yield

From this point forward, we are moving on to assets that underperform. Since 1969, the 10-year Treasury yield has declined by -1.6% on average during the onset of recessions (excluding Covid, which was a major negative outlier that skews the mean). Factoring in Covid though, the up/down ratio is about 29%. Bonds tend to receive a high amount of demand during economic uncertainty due to perceived safety, pushing up the price at the cost of yields.

10-Year Treasury Yield

Australian Dollar

Looking at the Bloomberg Correlation-Weighted Australian Dollar Index, the Aussie returned on average -2.1% during the first 3 months of a US recession since 1979. AUD also has a depressingly low win/loss rate of 16.7%. In currency markets, the Aussie is known for its sentiment-linked status, often closely following equities. Australia’s economy is closely tied to the global business cycle due to commodity exports, making it important to watch growth in the United States. When the latter sneezes, the world can catch a cold, driving up market volatility and negatively impacting the Australian Dollar.

Australian Dollar

S&P 500

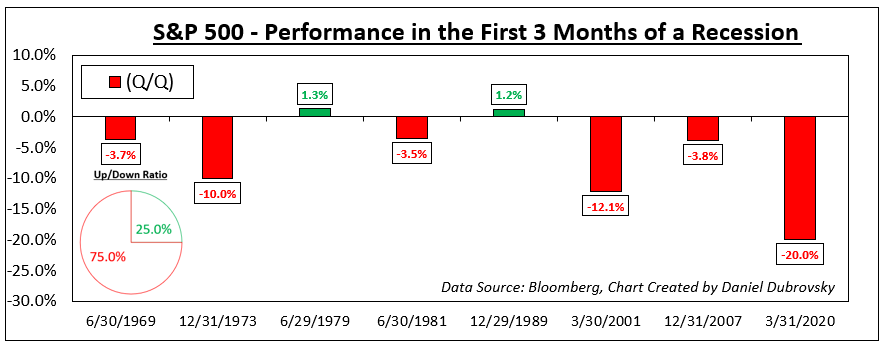
Finally, we arrive at the S&P 500, which is one of the key US benchmark stock indices. Unsurprisingly, the S&P 500 has returned on average -7.0% at the onset of recessions since 1969. But, unlike the Australian Dollar, the win/loss ratio is slightly better at 25%. This is unsurprising. Depending on the severity of the recession, uncertainty plays a key role in how much the stock market declines and how fast it does.

Recessions raise the risk that companies can go out of business and/or lay off workers, resulting in stock market crashes. Often, a bubble popping can lead to a recession, such as the dotcom bust in the early 2000s and the housing market leading in 2008. There are also leading indicators of a recession that you might be interested to learn about.

S&P 500


The Federal Reserve Bank: A Forex Trader’s Guide

The Federal Reserve Bank: A Forex Trader’s Guide

What is the Federal Reserve?

The Federal Reserve is the central bank of the United States. It was founded to create a stable, flexible monetary and financial system for the nation. Its general duties are to set monetary policy and oversee effective economic operation, ultimately serving the public interest.

To meet these top-level directives, the Fed performs five general functions:

  1. Promote maximum employment, stable pricing and moderate interest rates long term
  2. Reduce risk where possible to create a stable financial system
  3. Develop safety within financial institutions
  4. Champion safety within payment and settlement systems
  5. Advocate consumer protection through a supervisory stance.

To execute day-to-day operations, the nation is divided up into 12 Federal Reserve Districts, each of which is served by a separately incorporated Reserve Bank. These districts and member banks operate independently while being supervised by the Federal Reserve Board of Governors.

Who owns the Fed?

The Fed is both a private and public institution. The Board of Governors is a government agency, while the banks themselves are structured like private corporations – member banks hold stock and earn dividends.

Who is the Federal Reserve chairman?

As of August 2019, the chairman of the Federal Reserve is Jerome Powell, who has served in this office since February 5, 2018. He is the 16th person to have held the position and will serve a four-year term. Before his appointment, Mr Powell served as a member of the Board of Governors from May 25, 2012. He also currently serves as Chairman of the Federal Open Market Committee, which looks after monetary policy.

Which banks make up the Fed?

The 12 Federal Reserve Districts, each with their own Reserve Bank, are:

  • Boston
  • New York
  • Philadelphia
  • Cleveland
  • Richmond
  • Atlanta
  • Chicago
  • St. Louis
  • Minneapolis
  • Kansas
  • Dallas
  • San Francisco

How is the Fed held accountable to its functions?

The Fed is accountable to the public, as well as to the US Congress. The Chair and Federal Reserve officials testify in front of Congress, while the system of setting monetary policy is designed to be clear and transparent. In the interests of accountability, the Federal Open Market Committee (FOMC) will publish statements following all annual meetings. All financial statements are audited independently once a year to ensure financial accountability as well.

Key Economic Mandates of the Federal Reserve System

US monetary policy is the core mandate of the Federal Reserve bank. The statutory objectives of this monetary policy are outlined by the Congress and are:

  • Maximum employment: The monetary policy set out by theFOMC should ensure unemployment remains low, working to boost the economy where needed so that businesses thrive, make a profit and hire more staff to grow
  • Price stability: The Fed defines price stability as an inflation rate of 2% in the long term
  • Moderate long-term interest rates: This works alongside price stability – when an economy is stable, long-term interest rates remain at a moderate level

The Fed aims to achieve its monetary policy through its influence over interest rates and the general financial climate. This can lead to volatility of the US Dollar, ahead of Fed announcements and changes to policies.

Federal Open Market Committee

Monetary policy is set by the Federal Open Market Committee (FOMC), which oversees the open market operations of the Federal Reserve System. They set a target for the federal funds rate at FOMC meetings; this is the interest rate that they want banks to offer to each other for overnight loans. While the FOMC doesn’t control the rate, it can influence it in three main ways:

  • Open market operations. This means the buying and selling of government bonds on the open market – selling bonds decreases monetary supply with the aim of increasing interest rates. Buying bonds puts money back into the economy, with the aim of decreasing interest rates
  • Discount rate. This is the rate that banks pay to borrow money from the Fed. When this rate is lower, then it is also more likely the federal funds rate will be lower too
  • Reserve requirements. Banks need to hold a certain percentage of customers’ deposits to cover withdrawals – this is the reserve requirement. When these are raised, banks can’t loan as much money and must ask for higher interest rates. When lowered, banks can loan more money and ask for lower interest rates.

How Does the Federal Funds Rate Affect the US Dollar?

The Fed’s interest rate, also known as the Fed funds rate, is set by the Board of Governors of the Federal Reserve System. The current interest rate and the expectations of future interest rate changes can both affect the value of the US Dollar. If traders anticipate a change in interest rates based on announcements from the Board of Governors, this can cause the Dollar to appreciate or depreciate in value against other currencies.

This table sets out the way in which market expectations and rate changes can affect the value of the dollar:

Market expectations Actual Results Resulting FX Impact
Rate Hike Rate Hold Depreciation of currency
Rate Cut Rate Hold Appreciation of currency
Rate Hold Rate Hike Appreciation of currency
Rate Hold Rate Cut Depreciation of currency

Find out more about the impact of interest rates on the foreign exchange market.

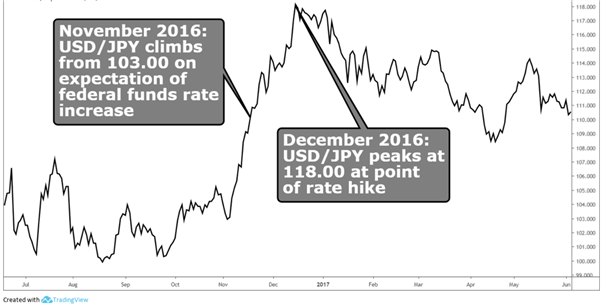
As you can see in the chart below, the Dollar strengthened against the Yen in the leadup to the Fed’s interest rate announcement in December 2016 because it was widely expected that the fed funds rate would increase. The pair peaked at around 118.371 on the day of the announcement, December 14, 2016.

USD/JPY chart before and after Fed hikes in 2016

Chart to show the impact of Fed hikes on USD/JPY

How to Trade the Fed Monetary Policy Decisions

In order to prepare for Fed rate change decisions, traders should follow these two key steps:

  1. Keep up with news from the Fed. The FOMC holds eight regular meetings a year, where policies and interest rates are discussed and agreed upon. Keeping up with news ahead of these meetings is the best way to make predictions about interest rates, and whether to buy or sell the US dollar
  2. Keep with news from the markets. Rest assured that it won’t just be you speculating on interest rates – ahead of Federal Reserve meetings and announcements, many forex traders will be watching what happens very closely. Keep an eye out for others’ predictions and forecasts, and stay well informed enough that you can have your own opinions and add your own logic to that of others

No method of predicting interest rate decisions can ever be completely accurate and surprises do occur. It’s always important to protect yourself when trading forex, so make sure you place stops in advance to ensure you keep your losses to a minimum should the markets move against you.

Remember to stick to your trading plan and never place a trade where you wouldn’t be able to afford the losses. Trades can go both ways. No matter how sure you feel that they will work in your favour, there’s always the chance that they might not.

GBP/USD Price Forecast: Pound Rallies on Positive UK GDP Report

GBP/USD Price Forecast: Pound Rallies on Positive UK GDP Report

GBPUSD FUNDAMENTAL BACKDROP

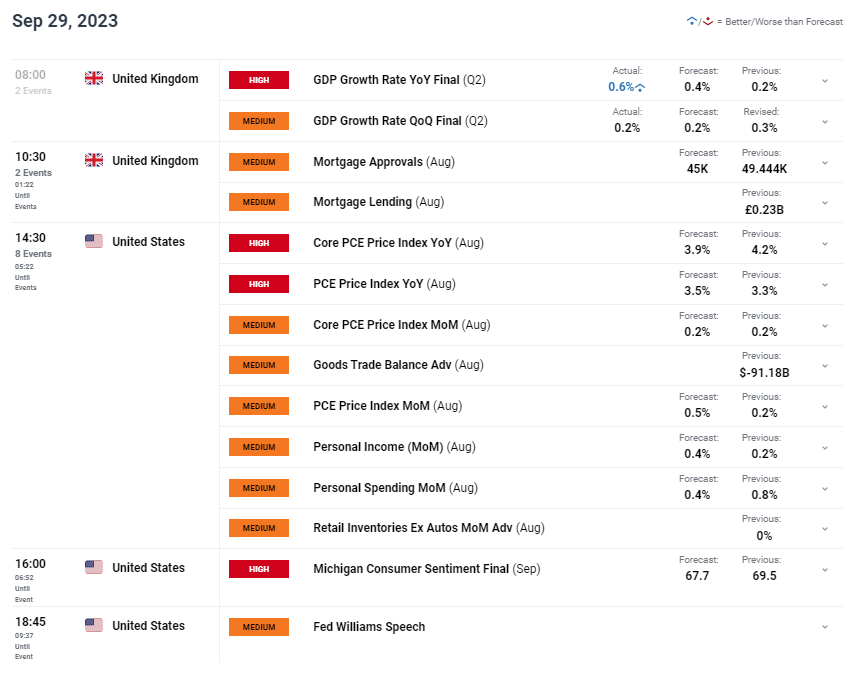
The British pound found some respite this Friday morning from both the US dollar and the local UK GDP release (see economic calendar below). UK GDP beat estimates on the headline YoY print as well as the business investment metric. An overall positive report that was driven by the production sector from an output point of view as well as an uptick in household savings ratio and disposable income. After the recent gloomy UK economic outlook, these figures bring some positivity with the UK’s Chancellor Hunt stating that “Today’s GDP data once again proves doubters wrong”.

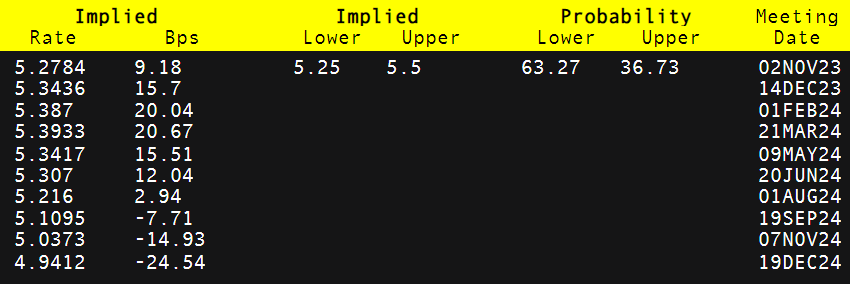
The resultant impact on Bank of England (BoE) expectations (refer to table below) has been slightly repriced in favor of a higher peak and lesser interest rate cuts by year end 2024. The culmination of which has bolstered GBP in early trade.

BANK OF ENGLAND INTEREST RATE PROBABILITIES

image1.png

The US added to cable’s upside due to recent Fed officials (Barking & Goolsbee) highlighting concerns around the central bank being too aggressive in their monetary policy stance and possibly overshooting on rate hikes. This is in stark contrast to the hawkish Neel Kashkari who favored an additional hike while opting for no rate cuts in 2024.

The day ahead is filled with potential market moving data with the focus on the PCE price index (fed’s preferred measure of inflation). The release will definitely provide short-term volatility pre and post-announcement and will give traders clues as to the next steps in the Fed’s decision making. Michigan consumer sentiment is expected to drop inline with the CB consumer confidence report earlier this week but an upside surprise could assist in dollar upside. Finally, the Fed’s Williams is scheduled to speak and it will be interesting to see whether or not he prefers the dovish or hawkish narrative.

GBP/USD ECONOMIC CALENDAR (GMT +02:00)

image2.png

TECHNICAL ANALYSIS

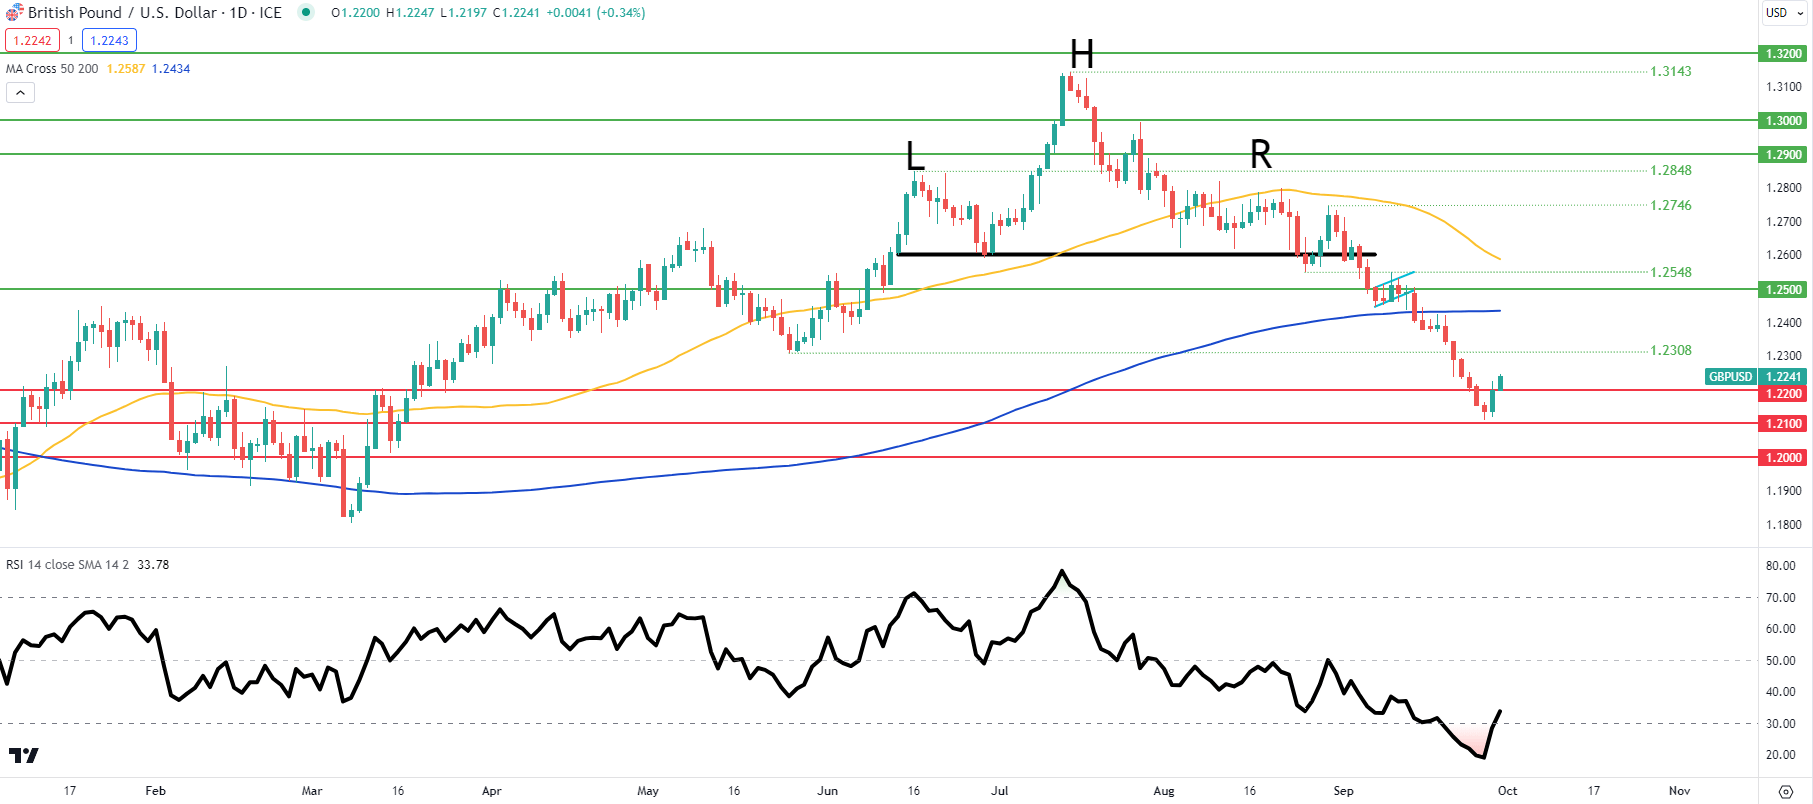
GBP/USD DAILY CHART

image3.png

Price action on the daily cable chart above shows bulls peering above the 1.2200 psychological handle while moving out of the oversold zone reflected by the Relative Strength Index (RSI). Upcoming data will provide a short-term directional bias as to whether or not the pound can continue this run or will it be short-lived.

Natural Gas Prices Forecast: EIA Storage Data Reveals Market Pulse

Natural Gas Prices Forecast: EIA Storage Data Reveals Market Pulse

A Glimpse into NatGas Market Dynamics

The anticipation in the market is palpable as traders keenly await today’s US government weekly storage report for US natural gas futures. If the consensus holds true, we could be looking at a build of 90 Bcf – a significant jump from last week’s 64 Bcf.

Current data from the EIA reveals that working gas in storage is at 3,269 Bcf, sitting comfortably within the five-year historical range. Stocks were 410 Bcf higher than last year at this time and 183 Bcf above the five-year average of 3,086 Bcf.

Trading Derivatives carries a high level of risk to your capital and you should only trade with money you can afford to lose. Trading Derivatives may not be suitable for all investors, so please ensure that you fully understand the risks involved, and seek independent advice if necessary. A Product Disclosure Statement (PDS) can be obtained either from this website or on request from our offices and should be considered before entering into a transaction with us. Raw Spread accounts offer spreads from 0.0 pips with a commission charge of USD $3.50 per 100k traded. Standard account offer spreads from 1 pips with no additional commission charges. Spreads on CFD indices start at 0.4 points. The information on this site is not directed at residents in any country or jurisdiction where such distribution or use would be contrary to local law or regulation.

Changing Weather and its Implications

While the southern US basks in warmth, the rest of the country will experience milder temperatures. According to NatGasWeather, this translates to a generally low demand for gas over the coming week.

Market Recap: Treading Highs and Lows

Wednesday was a testament to the volatile nature of gas futures, as they soared nearly 4% to touch a one-week high. The price movement was attributed to heightened demand forecasts and a slip in daily production. On a more granular level, futures for November stood at $2.90 per mmBtu, reflecting the market’s recent inertia and reduced volatility.

Supply and Demand Dilemma

September saw an average gas output in the US’s lower 48 states drop slightly to 102.0 bcfd. Despite this, meteorologists predict warmer than usual weather for early October, hinting at mild demand. Interestingly, US gas demand is forecasted to inch upwards, supported by an increase in LNG and pipeline exports.

Market Sentiment and Outlook

The gas futures market reflects a cautious optimism. Recent trends, especially the resilience shown on Wednesday, suggest slightly bullish sentiment. However, external factors such as weather conditions and global demand dynamics could influence future trajectories.

In other words, during the “shoulder season”, where huge storage builds are possible, we’re not expecting any major prices spikes to the upside unless there is corresponding bullish news like an unexpected jump in LNG demand.

Technical Analysis

Daily Natural GasThe current daily price of natural gas stands at $2.893, slightly higher than the previous day’s close at $2.899. This indicates a modest uptick in the commodity’s value.

In terms of moving averages, the 200-Day moving average is at $2.795, while the 50-Day moving average is slightly lower at $2.668. The current price is above both these averages, suggesting a potential bullish trend.

The 14-Day RSI reading of 60.31 falls into the neutral zone, indicating balanced momentum. It’s worth noting that readings below 50 suggest weakened momentum, while values above 50 signify stronger momentum.

Examining support and resistance levels, we find minor support at $2.892 and main support at $2.699. On the upside, there’s minor resistance at $3.002, while there’s no main resistance level currently defined.

Considering the trend lines, breaking above the resistance at $2.843 could trigger an acceleration to the upside, while a drop below the support at $2.619 might lead to a downside acceleration.

In conclusion, the technical analysis suggests a cautiously bullish sentiment for natural gas. The current price trading above both moving averages and a neutral RSI indicate potential upward momentum. However, market participants should closely monitor support and resistance levels and trend lines for potential trend shifts.

Additionally, keep in mind that we just rolled from the October to November futures contract so it may take a few days for technical traders to absorb the new prices.

US Dollar Index News: DXY Retreats from 10-Month High Amid Euro’s Rebound

US Dollar Index News: DXY Retreats from 10-Month High Amid Euro’s Rebound

U.S. Dollar & Euro Dynamics

The U.S. Dollar Index has retreated slightly from a 10-month peak as the Euro found support from positive German inflation data. The index reached 106.84, its highest level since last November, before steadying around 106.075. Meanwhile, the Euro recovered from its January low of 1.0482 to touch 1.0537, spurred by optimism around Germany’s inflation report.

German Inflation Outlook

Germany witnessed its inflation rate drop to the lowest since Russia’s invasion of Ukraine, a potential sign of easing high inflation pressures. The harmonized annual inflation in September was reported at 4.3%, a dip from August’s 6.4%. Interestingly, Germany’s core inflation, which strips out volatile components like food and energy, was pegged at 4.6% in September, compared to 5.5% in August.

Trading Derivatives carries a high level of risk to your capital and you should only trade with money you can afford to lose. Trading Derivatives may not be suitable for all investors, so please ensure that you fully understand the risks involved, and seek independent advice if necessary. A Product Disclosure Statement (PDS) can be obtained either from this website or on request from our offices and should be considered before entering into a transaction with us. Raw Spread accounts offer spreads from 0.0 pips with a commission charge of USD $3.50 per 100k traded. Standard account offer spreads from 1 pips with no additional commission charges. Spreads on CFD indices start at 0.4 points. The information on this site is not directed at residents in any country or jurisdiction where such distribution or use would be contrary to local law or regulation.

U.S. Monetary Policy & Yield Movement

The U.S. 10-year benchmark yields scaled new heights at 4.462% – the highest mark since October 2007. Federal Reserve officials, including the Bank of Minneapolis President Neel Kashkari, hint at further rate hikes in response to the resilient U.S. economic data. This anticipation, coupled with Fed Chair Jerome Powell’s impending speech, is set to provide more clarity on the U.S. monetary policy’s trajectory.

Japanese Yen & Oil Prices

The dollar/yen exchange rate remains sensitive, especially with the yen nearing a significant level of 150 per dollar. This has sparked speculation of potential interventions by the Japanese authorities, akin to measures taken last year. Additionally, escalating oil prices, which recently recorded their highest close of 2023, are adding pressure on the Japanese currency.

Short-term Forecast

The dollar’s recent strength appears sustainable given the robust U.S. economic indicators, but the European economy’s potential rebound, led by positive signs from Germany, could lend some respite to the Euro. Markets should closely monitor Fed communications and Japanese currency interventions for potential short-term volatility. The overall sentiment leans bullish for the U.S. dollar.

Technical

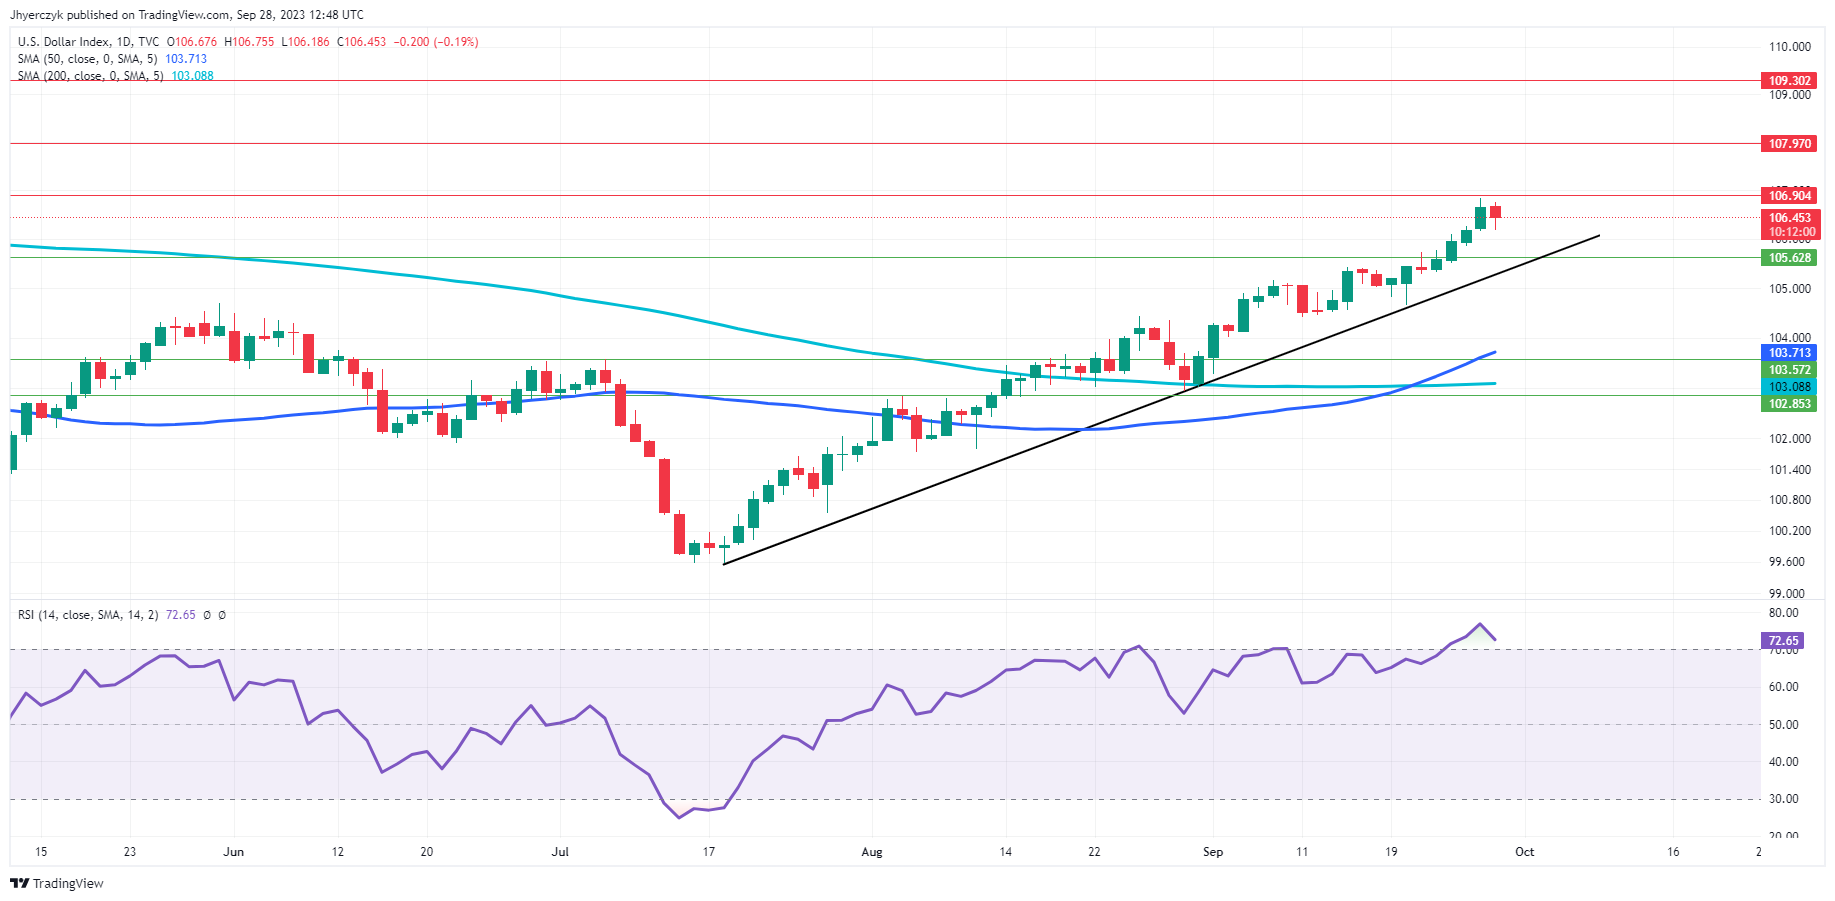
Daily US Dollar Index (DXY)The US Dollar Index (DXY) currently trades at 106.466, residing above both the 50-Day moving average of 103.714 and the 200-Day moving average of 103.089, indicating a bullish trend. This is further emphasized by its position above the trend line support of 105.31.

With a 14-Day RSI at 73.11, the market is in overbought territory, which could signal a short-term retracement or consolidation.

However, the fact that the DXY remains between the minor resistance of 106.904 and the major resistance of 107.970 suggests room for potential upside before encountering significant barriers.

In this context, the overall market sentiment leans bullish, but traders should remain vigilant for potential corrections due to overbought conditions.

EUR/USD Forecast – Euro Attempts to Recover

EUR/USD Forecast – Euro Attempts to Recover

Euro vs US Dollar Technical Analysis

The euro has rallied a bit during the session here on Thursday, as the market has been in an oversold condition, so it does make a certain amount of sense that we would bounce from the crucial 1.05 level. The 1.05 level of course is a large, round, psychologically significant figure, in an area where we’ve seen some action in the past. By bouncing the way we have, it probably will set up a nice selling opportunity given enough time, especially as we have the GDP numbers coming out, and of course interest rates in America continue to be very strong, and they look like they are ready to continue ripping higher over the longer term. That being said, we have an oversold condition that the market is trying to work off.

Trading Derivatives carries a high level of risk to your capital and you should only trade with money you can afford to lose. Trading Derivatives may not be suitable for all investors, so please ensure that you fully understand the risks involved, and seek independent advice if necessary. A Product Disclosure Statement (PDS) can be obtained either from this website or on request from our offices and should be considered before entering into a transaction with us. Raw Spread accounts offer spreads from 0.0 pips with a commission charge of USD $3.50 per 100k traded. Standard account offer spreads from 1 pips with no additional commission charges. Spreads on CFD indices start at 0.4 points. The information on this site is not directed at residents in any country or jurisdiction where such distribution or use would be contrary to local law or regulation.

The so-called “death cross” that is getting ready to occur is a longer-term bearish signal, and I do think that a lot of traders will be paying close attention to it. This is when the 50-Day EMA crosses below the 200-Day EMA, setting off longer-term algorithms. That being said, the markets don’t go in one direction forever, so I do think that this rally is something that you need to pay attention to. I think it offers a nice selling opportunity on signs of exhaustion, and to be honest, it would not surprise me at all to see this market fall apart yet again, but people are more likely than not taking a bit of profit heading into these important economic announcements.

Currently, the euro would have to trade above the 1.07 level to convince me that something’s going on as far as a longer-term recovery. On the downside, if we get a daily close below the 1.05 level, that opens up a move down to the 1.0250 level, and then possibly even parity over the longer term. Keep in mind that this is more about the US dollar than anything else, so pay attention to interest rates in the United States as they are by far the biggest mover of markets at the moment.

GDP Growth Rate Meets Analyst Estimates, Traders Stay Focused On Fed Policy Outlook

GDP Growth Rate Meets Analyst Estimates, Traders Stay Focused On Fed Policy Outlook

On September 28, U.S. released the final reading of the second-quarter GDP Growth Rate report. The report indicated that GDP Growth Rate was 2.1%, in line with the analyst consensus.

GDP Price Index declined from 4.1% in the first quarter to 1.7% in the second quarter, compared to analyst consensus of 2%.

Today, traders also had a chance to take a look at the Initial Jobless Claims report, which indicated that 204,000 Americans filed for unemployment benefits in a week. Analysts expected Initial Jobless Claims of 215,000.

Continuing Jobless Claims increased from 1.66 million to 1.67 million, mostly in line with the analyst consensus.

Treasury yields tested new highs after the release of the GDP report. The report met analyst estimates and showed that U.S. economy remained in a decent shape, providing Fed with an opportunity to push rates even higher.

U.S. Dollar Index rebounded towards the 106.50 level as traders focused on rising Treasury yields.

Gold declined towards session lows near the $1870 level. Strong dollar and high Treasury yields are bearish for gold and other precious metals that pay no interest.

SP500  pulled back towards the 4270 level as traders reacted to rising Treasury yields. Fed policy outlook remains the key driver for markets. If traders continue to prepare for a potential rate hike, SP500 will remain under material pressure.

Oil Prices Forecast: OPEC Production Cuts Drive WTI Futures Above $95

Oil Prices Forecast: OPEC Production Cuts Drive WTI Futures Above $95

Surge in U.S. Oil Prices

U.S. oil prices reached a new peak in over a year early Thursday, as West Texas Intermediate crude futures (WTI) soared above $95 per barrel. This rise was triggered by a significant decline in U.S. crude stocks and mounting concerns about limited global supplies due to OPEC+ production cuts spearheaded by Saudi Arabia.

Crude Stocks and Demand

Recent data reveals that U.S. crude stocks plummeted by 2.2 million barrels last week, a figure vastly surpassing the predicted 320,000-barrel drop. The Cushing, Oklahoma storage hub has also seen its stockpile decrease by 943,000 barrels, nearing historic low levels. This decline in reserves at Cushing has been attributed to robust refining and export demands, raising concerns about the quality and sufficiency of remaining oil.

Trading Derivatives carries a high level of risk to your capital and you should only trade with money you can afford to lose. Trading Derivatives may not be suitable for all investors, so please ensure that you fully understand the risks involved, and seek independent advice if necessary. A Product Disclosure Statement (PDS) can be obtained either from this website or on request from our offices and should be considered before entering into a transaction with us. Raw Spread accounts offer spreads from 0.0 pips with a commission charge of USD $3.50 per 100k traded. Standard account offer spreads from 1 pips with no additional commission charges. Spreads on CFD indices start at 0.4 points. The information on this site is not directed at residents in any country or jurisdiction where such distribution or use would be contrary to local law or regulation.

OPEC+’s Role and Supply Outlook

OPEC+, led by Saudi Arabia and Russia, has curtailed production by 1.3 million barrels a day until the year-end. As global oil prices soar, there are speculations about a possible reconsideration of these supply cuts in the group’s upcoming October 4th meeting. These reductions, coupled with additional export restrictions proposed by Russia, hint at a tight global energy market in the foreseeable future.

Broader Impacts

The recent surge in energy prices has also stimulated oil and gas activity in three key U.S. states, according to a survey by the Federal Reserve Bank of Dallas. Furthermore, initiatives like Russia’s recent export restrictions, aimed at stabilizing domestic fuel prices, further emphasize the global narrative of tightening oil supply.

Market Response and Forecast

Despite last week’s dip in prices, the market remains bullish, primarily driven by concerns over limited supplies as winter approaches. Analysts are divided with some sensing the market is overextended and foreseeing a potential correction. Yet, the overarching sentiment leans towards higher oil prices, at least in the short-term, given the prevailing supply constraints and growing demand.

Technical Analysis

Daily Light Crude Oil FuturesBased on the tools on analytical tools on the chart provided for Light Crude Oil Futures, the current daily price of 94.55 shows an appreciation from the previous day, sitting between the minor resistance at 92.49 and the main resistance at 97.67.

Although above both the 200-day and 50-day moving averages, suggesting an ongoing bullish trend, the 14-Day RSI reading of 79.31 indicates overbought conditions.

This could imply potential future price adjustments. However, predicting the exact directionality poses challenges with momentum so strong. Presently, market sentiment leans bullish, but traders should remain wary of possible pullbacks, especially given the elevated RSI.

Dax Index: Soaring Rates and Slipping Stocks – Dax’s Tightrope

Dax Index: Soaring Rates and Slipping Stocks – Dax’s Tightrope

DAX Wednesday Overview

On Wednesday, the DAX slipped by 0.25%. Following a 0.97% slide on Tuesday, the DAX ended the day at 15,218.

Bets on Higher-for-Longer Rates Reversed Early Gains

Industrial profit numbers from China supported a positive start to the mid-week session. However, weaker consumer confidence numbers from Germany weighed on buyer appetite. The influential German GfK Consumer Climate indicator fell from -25.6 to -26.5 for October.

Trading Derivatives carries a high level of risk to your capital and you should only trade with money you can afford to lose. Trading Derivatives may not be suitable for all investors, so please ensure that you fully understand the risks involved, and seek independent advice if necessary. A Product Disclosure Statement (PDS) can be obtained either from this website or on request from our offices and should be considered before entering into a transaction with us. Raw Spread accounts offer spreads from 0.0 pips with a commission charge of USD $3.50 per 100k traded. Standard account offer spreads from 1 pips with no additional commission charges. Spreads on CFD indices start at 0.4 points. The information on this site is not directed at residents in any country or jurisdiction where such distribution or use would be contrary to local law or regulation.

Notably, the propensity to save increased despite income expectations steadying. The consumer propensity to save signaled a pullback in consumer spending, further impacting the German services sector.

Market sentiment toward ECB monetary policy goals continued to test buyer appetite. Investor bets on the ECB keeping interest rates higher for a prolonged period remained a headwind.

ECB money supply and lending statistics also influenced investor sentiment.

Significantly, overnight deposits slumped by 11.9% in August. The higher interest rate environment diverted depositors to term deposit products, impacting money supply, a leading indicator for a recession.

The slump in money supply and a curb on bank lending added to the gloomy mood. The latest numbers from the ECB showed a modest 1.0% increase in private sector loans in August versus 1.3% in July.

US economic indicators fueled a late pick up in US Treasury yields. Core durable goods orders beat forecasts, supporting the more hawkish Fed interest rate path. Fed uncertainty delivered a mixed session for the US equity markets.

On Wednesday, the NASDAQ Composite Index and the S&P 500 saw gains of 0.22% and 0.02%. The Dow declined by 0.20%.

The Wednesday Market Movers

Siemens AG and Siemens Energy AG were among the front runners, gaining 3.29% and 2.27%, respectively. Dip buyers jumped in after heavy losses in recent sessions.

Bank stocks were also higher, with Deutsche Bank and Commerzbank rising by 2.42% and 0.84%, respectively.

However, Daimler Trucking was among the worst performers, sliding by 2.50%.

German Inflation and the ECB Economic Bulletin in Focus

German inflation figures for September will draw investor interest later today. Softer inflation figures may ease investor jitters over a higher-for-longer ECB interest rate path.

Economists forecast the German annual inflation rate to soften from 6.1% to 4.6%. However, the numbers may need fall below sub-4% to materially ease pressure on the ECB from keeping rates elevated.

Ahead of the inflation numbers, the ECB Economic Bulletin also needs consideration. ECB views on the economy, inflation, and monetary policy will influence buyer appetite.

Investors must also monitor ECB commentary. ECB Executive Board members Andrea Enria and Elizabeth McCaul are on the calendar to speak today. A shift from the higher-for-longer script may ease selling pressure.

US Jobless Claims in Focus

US labor market numbers will be in focus later today. Another unexpected fall in jobless claims would fuel bets on a December Fed rate hike. Economists forecast initial jobless claims to increase from 201k to 215k. The markets will likely consider sub-220k acceptable to support the hawkish Fed interest rate path.

Second-quarter US GDP numbers are also due out but will likely play second fiddle to the labor market numbers.

The DAX and NASDAQ mini were up 30 and 0.5 points this morning. However, it could be a testy session for the DAX. Government bond yields will need tracking throughout the session. 10-year US Treasury yields climbed higher this morning before easing back.

Short-Term Forecast

Softer German inflation numbers would ease selling pressure. However, elevated US Treasury yields on a more hawkish Fed rate path remain a headwind. Movement over the remainder of the week hinges on US jobless claims and US inflation and consumption numbers tomorrow.

DAX Technical Indicators

Daily Chart

The DAX sat below the 50-day and 200-day EMAs, affirming bearish price signals. A fall below 15,200 would support a DAX move to the 15,058 support level. Lower-than-forecast US jobless claims, and hotter-than-predicted German inflation would impact risk appetite.

However, a break above the 15,245 resistance level would bring the 15,459 resistance level and 200-day EMA into view.

The 14-Daily RSI reading of 31.21 supports a DAX fall below 15,200 support level before entering oversold territory.

DAX Daily Chart sends bearish price signals.

DAX 280923 Daily Chart

4-Hourly Chart

The DAX, sitting below the 50-day and 200-day EMAs, reaffirms bearish price signals. A DAX break above the 15,245 resistance level would support a move toward the 15,459 resistance level.

However, a fall below 15,200 would give the bears a run at the 15,058 support level.

The 26.65 RSI reading indicates the DAX is in the oversold territory.

4-Hourly Chart affirms bearish price signals.
DAX 280923 4-Hourly Chart