DAX Index: The ECB and China Dampen DAX Amid Rate Hike Risks

DAX Index: The ECB and China Dampen DAX Amid Rate Hike Risks

DAX Monday Overview

On Monday, the DAX declined by 0.98%. After a 0.09% loss on Friday, the DAX ended the day at 15,406.

German Business Sentiment Overshadowed by China and the ECB

German business sentiment beat forecasts on Monday but failed to impress. Business sentiment across the services sector deteriorated for a sixth month, with business sentiment across the construction sector the worst since January 2009.

Trading Derivatives carries a high level of risk to your capital and you should only trade with money you can afford to lose. Trading Derivatives may not be suitable for all investors, so please ensure that you fully understand the risks involved, and seek independent advice if necessary. A Product Disclosure Statement (PDS) can be obtained either from this website or on request from our offices and should be considered before entering into a transaction with us. Raw Spread accounts offer spreads from 0.0 pips with a commission charge of USD $3.50 per 100k traded. Standard account offer spreads from 1 pips with no additional commission charges. Spreads on CFD indices start at 0.4 points. The information on this site is not directed at residents in any country or jurisdiction where such distribution or use would be contrary to local law or regulation.

One highlight was a pickup in the German Ifo Business Expectations Index, which rose from 82.7 to 82.9.

However, the EUR/USD fell by 0.49% on the session, with bond yields rising in response to ECB commentary.

Francois Villeroy de Galhau reportedly spoke about the risks of doing too much and too little. While erring on the side of caution, the Governor of the Bank of France left the door ajar for further rate hikes.

ECB President Lagarde noted that interest rates may have peaked but will likely remain high until the ECB tames inflation.

The higher-for-longer interest rate theme and the risk of further rate hikes dampened demand for riskier assets.

Risk aversion from China spilled over to the European session, adding to the gloomy mood.

However, the US equity markets avoided another session in negative territory. Investors brushed aside weaker US economic indicators and the threat of a US government shutdown.

The Chicago Fed National Activity Index unexpectedly fell from 0.7 to -0.16. Economists forecast an increase to +0.15.

On Monday, the S&P 500 and the NASDAQ Composite Index saw gains of 0.40% and 0.45%, respectively. The Dow rose by 0.13%.

The Monday Market Movers

Auto stocks were among the worst performers. BMW and Mercedes Benz Group saw losses of 2.01% and 1.41%. Volkswagen and Continental declined by 1.07% and 0.95%, respectively, with Porsche falling by 0.82%.

The higher-for-longer ECB interest rate outlook and macroeconomic headwinds weighed on the auto sector and the broader market.

ECB Chief Economist Philip Lane in the Spotlight

Market sensitivity to ECB commentary has intensified following the dovish ECB rate hike on September 14.

ECB Chief Economist Philip Lane speaks at a Joint European Central Bank – Banque de France – Centre for Economic Policy Research Conference.

Investors will likely respond to comments about the economic outlook, inflation, and monetary policy. A hint at higher interest rates would spook the markets.

US Consumer Confidence a US Economy Litmus Test

Later today, the US CB Consumer Confidence Index will garner investor interest. Economists forecast the Index to decline from 106.1 to 105.9 in September. However, a larger-than-expected decline would signal a possible pullback in consumer spending.

Recent US economic indicators have shown early cracks in the US economy. A slump in consumer confidence would weigh on the appetite for riskier assets.

However, investors should also monitor FOMC commentary. A hawkish Fed and a weakening US macroeconomic environment would raise the prospects of a hard landing.

On the political front, investors should also monitor talks from Capitol Hill and the increasing threat of a US government shutdown.

This morning, the DAX and NASDAQ mini were down 22 and 65 points, respectively. Losses across the Asian equity markets contributed to the pullback. China’s economic woes and hawkish central bank commentary are headwinds.

Short-Term Forecast

The near-term bearish trend will likely remain intact. Jitters over the Chinese economy and hawkish ECB and Fed commentary remain headwinds. The ongoing threat of a US government shutdown is another curveball for investors to consider. A shift in ECB forward guidance and easing fears of a hard landing would support a pickup in buyer appetite.

DAX Technical Indicators

Daily Chart

The DAX sat below the 50-day and 200-day EMAs, sending bearish price signals. A return to sub-15,400 would support a DAX move to the 15,245 support level. A hawkish ECB Chief Economist would weigh on buyer appetite.

However, a break above the 15,459 resistance level and 200-day EMA would support a move toward the 15,619 resistance level. US consumer confidence figures must ease fears of a slump in consumption but avoid fueling bets on a Fed rate hike to support a breakout session.

The 14-Daily RSI reading of 36.17 supports a DAX fall to the 15,245 support level before entering oversold territory.

DAX Daily Chart sends bearish price signals.
DAX 260923 Daily Chart

4-Hourly Chart

The DAX, sitting below the 50-day and 200-day EMAs, reaffirms bearish price signals. A DAX fall to sub-15,400 would support a break below the 15,245 support level.

However, a break above the 15,459 resistance level would give the bulls a run at the 15,500.

The 33.15 RSI reading indicates a DAX fall to sub-15,400 before entering oversold territory.

4-Hourly Chart affirms bearish price signals.
DAX 260923 4-Hourly Chart
EUR/USD Forecast: ECB Hawkishness Meets US Consumer Confidence

EUR/USD Forecast: ECB Hawkishness Meets US Consumer Confidence

Monday Overview

The EUR/USD experienced volatility on Monday, touching a high of $1.06556 and a low of $1.05751, eventually closing the day with a 0.49% fall at $1.05930,

ECB Chief Economist Philip Lane to Guide the EUR

ECB commentary has been hawkish despite concerns about a euro area recession. On Monday, ECB President Lagarde supported the higher-for-longer interest rate path to tame inflation.

Trading Derivatives carries a high level of risk to your capital and you should only trade with money you can afford to lose. Trading Derivatives may not be suitable for all investors, so please ensure that you fully understand the risks involved, and seek independent advice if necessary. A Product Disclosure Statement (PDS) can be obtained either from this website or on request from our offices and should be considered before entering into a transaction with us. Raw Spread accounts offer spreads from 0.0 pips with a commission charge of USD $3.50 per 100k traded. Standard account offer spreads from 1 pips with no additional commission charges. Spreads on CFD indices start at 0.4 points. The information on this site is not directed at residents in any country or jurisdiction where such distribution or use would be contrary to local law or regulation.

The increasing risk of a euro area recession, fueled by the ECB, leaves the EUR/USD on the back foot.

ECB Chief Economist Philip Lane will guide the EUR. Lane speaks at a Joint European Central Bank – Banque de France – Centre for Economic Policy Research Conference.

The EUR/USD will be sensitive to economic and inflation outlooks, even though investors could stomach the higher-for-longer mantra. There is also the threat of the Chief Economist supporting further rate hikes.

However, German, French, and Eurozone inflation figures will be in focus this week. A marked softening in inflation pressures could ease pressure on the ECB to maintain interest rates for higher and avoid a hard landing.

US Consumer Confidence to Dictate the Pre-Inflation Path

Later today, the CB Consumer Confidence Index will be in focus. Economists forecast the Index to fall modestly from 106.1 to 105.9. Steady consumer confidence levels would support consumption and demand-driven inflation. While a positive consumption outlook is bullish for the economy, the Fed may have to push interest rates higher.

Higher interest rates reduce disposable income and spending, thereby easing demand-driven inflationary pressures.

With consumer confidence in focus, FOMC member commentary also needs consideration. Dovish FOMC comments about the economy and monetary policy would fuel buyer appetite for the EUR/USD.

Short-Term Forecast:

The US dollar remains in the driving seat. However, a slump in consumer confidence ahead of the euro area and US inflation figures could fuel fears of a US hard landing. A less hawkish outlook toward the US economy would narrow the monetary policy and macroeconomic divergence toward the EUR.

EUR/USD Price Action

Daily Chart

The EUR/USD remained below the 50-day and 200-day EMAs, sending bearish price signals.

Better-than-expected US consumer confidence figures would support a EUR/USD fall to the $1.05230 support level. However, ECB Chief Economist Philip Lane must talk about a gloomy economic outlook and the need for higher rates to signal a EUR/USD sell-off.

If EUR/USD returns to $1.06, it would give the bulls a run at the $1.06342 resistance level.

The 14-period Daily RSI at 30.06 shows the EUR/USD on the oversold boundary.

EUR/USD Daily Chart sends bearish price signals.
EURUSD 260923 Daily Chart

4-Hour Chart

The EUR/USD remains below the 50-day and 200-day EMAs, reaffirming the bearish price signals. A fall to $1.0550 would support a EUR/USD fall to the $1.05230 support level.

However, a return to $1.06 would give the bulls a run at the $1.06342 resistance level.

The 14-period 4-Hourly RSI at 32.34 supports a EUR/USD fall to $1.0550 before entering oversold territory.

4-Hourly Chart affirms bearish price signals.
EURUSD 260923 4 Hourly Chart
Silver Prices Forecast: XAG/USD Stumbles Amid Soaring Dollar and Treasury Yields

Silver Prices Forecast: XAG/USD Stumbles Amid Soaring Dollar and Treasury Yields

Silver and the Strong Dollar

Silver (XAG/USD) prices have taken a hit this Tuesday, with the U.S. dollar and Treasury yields on the rise. Traders are now keeping their eyes peeled for a crucial consumer inflation report, as it could give some indicators on what the Federal Reserve might do next regarding interest rates. Meanwhile, the market’s hanging around its one-month range midpoint, but the noticeable low trading volume may be raising some eyebrows among buyers.

At 06:55, Silver (XAG/USD) is trading $22.86, down $0.69 or -2.92%. December Comex Silver futures are at $23.11, down $0.275 or -1.18%.

Trading Derivatives carries a high level of risk to your capital and you should only trade with money you can afford to lose. Trading Derivatives may not be suitable for all investors, so please ensure that you fully understand the risks involved, and seek independent advice if necessary. A Product Disclosure Statement (PDS) can be obtained either from this website or on request from our offices and should be considered before entering into a transaction with us. Raw Spread accounts offer spreads from 0.0 pips with a commission charge of USD $3.50 per 100k traded. Standard account offer spreads from 1 pips with no additional commission charges. Spreads on CFD indices start at 0.4 points. The information on this site is not directed at residents in any country or jurisdiction where such distribution or use would be contrary to local law or regulation.

ANZ Analysts Weigh In

“Silver’s in a tough spot right now,” say ANZ analysts. “It’s grappling with the looming rise in U.S. interest rates reducing its allure and a slowing Chinese economy dampening industrial demand.”

SPDR Gold Trust’s Impact

It seems demand for silver is also under pressure due to the latest from the SPDR Gold Trust, the world’s leading gold-backed exchange-traded fund, which announced a 0.1% dip in its holdings on Monday—hitting its lowest since January 2020.

The Fed and Market Speculations

The Federal Reserve’s signals of sticking to higher interest rates for a while have shaken up investor expectations and stirred the market. Everyone’s now bracing for another potential rate hike in November or December, aligned with the Fed’s recent statements and the remaining meetings this year.

Government Shutdown Concerns

Tensions are mounting over the possible U.S. government shutdown, set to kick in on October 1 if the ongoing federal budget talks hit a dead end. Investors are on the edge, closely watching various economic signs and the Fed’s favored inflation gauge, along with upcoming housing sector data, to make sense of where the economy’s heading.

Bearish Outlook for Silver

In the short run, unless there’s some major economic shake-up and the current worries subside, the mood around silver is looking pretty bearish. Any new key economic data and resulting Federal Reserve actions will play a crucial role in shaping market attitudes and movements in the upcoming months.

Technical Analysis

4-Hour Silver (XAG/USD)Silver (XAG/USD) has seen a slight decline, moving from 22.96 to its current 4-hour price at 22.91. The metal is currently trading below both the 50 and 200-4H moving averages, indicating a bearish sentiment.

Specifically, it sits below the 23.17 (50-4H MA) and even further beneath the 23.71 (200-4H MA), making these areas resistance. The 14-4H RSI stands at 36.85, suggesting weakened momentum, but it’s not yet in the oversold territory.
Main support is established between 22.70 and 22.28, while the major resistance looms at the 25.00 to 25.27 range. Given these factors, the short-term outlook for Silver appears bearish, with key levels and indicators reinforcing this sentiment.

Gold Prices Forecast: XAU/USD Prices Waver Amid Rising Dollar, Treasury Yields

Gold Prices Forecast: XAU/USD Prices Waver Amid Rising Dollar, Treasury Yields

Market Dynamics and Gold Prices

Gold (XAU/USD) prices are lower on Tuesday as the U.S. dollar and Treasury yields rose, causing investors to eagerly anticipate a pivotal consumer inflation report for indications on prospective Federal Reserve actions regarding interest rates this year. The market is currently hovering around the midpoint of its one-month range, and a noticeable lack of volume may signal concerns for buyers.

Trading Derivatives carries a high level of risk to your capital and you should only trade with money you can afford to lose. Trading Derivatives may not be suitable for all investors, so please ensure that you fully understand the risks involved, and seek independent advice if necessary. A Product Disclosure Statement (PDS) can be obtained either from this website or on request from our offices and should be considered before entering into a transaction with us. Raw Spread accounts offer spreads from 0.0 pips with a commission charge of USD $3.50 per 100k traded. Standard account offer spreads from 1 pips with no additional commission charges. Spreads on CFD indices start at 0.4 points. The information on this site is not directed at residents in any country or jurisdiction where such distribution or use would be contrary to local law or regulation.

The Dollar and Treasury Yields Influence

The dollar has reached a 10-month high, and the 10-year Treasury yields have ascended to a 16-year peak, impacting the value of non-interest-paying bullion, which is denominated in dollars. The strengthened U.S. dollar and higher interest rates diminish the appeal of gold, a non-interest-bearing asset, thus impacting its demand and price stability.

Federal Reserve’s Stance and Investor Sentiment

The Federal Reserve’s indication of maintaining higher interest rates for an extended period has caused shifts in investor expectations and market movements. Investors are now factoring in the possibility of another rate hike to be announced in either November or December, based on the recent pronouncements and scheduled meetings of the Federal Reserve this year.

Potential Government Shutdown and Economic Indicators

The looming potential of a U.S. government shutdown, scheduled to begin on October 1 if there’s no resolution in the federal budget negotiations, continues to heighten tensions and market instability. Investors are keeping a close watch on various economic indicators and the Federal Reserve’s preferred inflation gauge, the personal consumption expenditure price index, as well as upcoming data from the housing sector, to gauge the economic trajectory.

Short-Term Forecast

In the short term, unless significant breakthroughs occur in the economic landscape, and prevailing concerns are alleviated, the market sentiment for gold remains bearish. The prospective release of pivotal economic data, and any ensuing policy adjustments by the Federal Reserve, will be critical determinants in shaping investor sentiment and market movements in the coming months.

Technical Analysis

4-Hour Gold (XAU/USD)Gold (XAU/USD) is currently experiencing a modest decline in its 4-hour price, positioned at $1911.80, slightly beneath its recent close of $1914.72. Notably, the precious metal is trading below both its 200-4H and 50-4H moving averages, marked at $1918.60 and $1923.45 respectively, signaling a potential bearish trend.

The 14-4H RSI reading stands at 35.78, indicative of a weakened momentum, verging on the oversold territory.
With a clear Main Support Area between $1893.07 and $1885.79 and a Resistance Area ranging from $1946.99 to $1954.88, the prevailing market sentiment for Gold (XAU/USD) leans bearish in the short term.

NASDAQ Index, SP500, Dow Jones Forecasts – Major Indices Attempt To Rebound

NASDAQ Index, SP500, Dow Jones Forecasts – Major Indices Attempt To Rebound

SP500
SP500 250923 4h ChartSP500 is trying to rebound after the recent pullback. Treasury yields test new highs, which is bearish for stocks. However, SP500 is moving higher, driven by rising demand for energy stocks. Today, traders had a chance to take a look at the Dallas Fed Manufacturing Index report. The report indicated that Dallas Fed Manufacturing Index declined from -17.2 in August to -18.1 in September, compared to analyst consensus of -10. The disappointing report did not put pressure on stocks as traders used the recent pullback as an opportunity to enter long positions at attractive levels.

At this point, the rebound looks technical. There are no material positive catalysts, while Treasury yields are moving higher. SP500 needs to climb back above the resistance at 4335 – 4350 to have a chance to gain sustainable upside momentum.

Trading Derivatives carries a high level of risk to your capital and you should only trade with money you can afford to lose. Trading Derivatives may not be suitable for all investors, so please ensure that you fully understand the risks involved, and seek independent advice if necessary. A Product Disclosure Statement (PDS) can be obtained either from this website or on request from our offices and should be considered before entering into a transaction with us. Raw Spread accounts offer spreads from 0.0 pips with a commission charge of USD $3.50 per 100k traded. Standard account offer spreads from 1 pips with no additional commission charges. Spreads on CFD indices start at 0.4 points. The information on this site is not directed at residents in any country or jurisdiction where such distribution or use would be contrary to local law or regulation.

NASDAQ

NASDAQ
NASDAQ is also moving higher in today’s trading session. RSI has recently moved back into the moderate territory as demand for tech stocks increased. However, the current rebound is not strong as traders remain worried about rising Treasury yields.

From the technical point of view, NASDAQ found support near the 14,560 – 14,680 level. A move above 14,800 will signal that NASDAQ may gain additional upside momentum.

Dow Jones

Dow Jones
Dow Jones 250923 4h ChartDow Jones remains under pressure as traders wait for catalysts. Dow and Chevron, which are up by more than 1%, are the only notable gainers in the Dow Jones index today.

From the technical point of view, Dow Jones is slowly moving towards the nearest support level, which is located in the 33,600 – 33,700 range.

DAX, EU Stocks Update: ECB Officials Have Their Say as Equities Turn Lower

DAX, EU Stocks Update: ECB Officials Have Their Say as Equities Turn Lower

ECB Officials Have Their Say: Villeroy, Schnabel and Lagarde

First up this morning was the Governor of the Bank of France, Francois Villeroy de Galhau whose words jolted European markets early in the session. Villeroy, who is thought to be slightly on the hawkish side of central, reiterated that the risks of doing too much or too little are more symmetrical. However, he did state that more can still be done if needed.

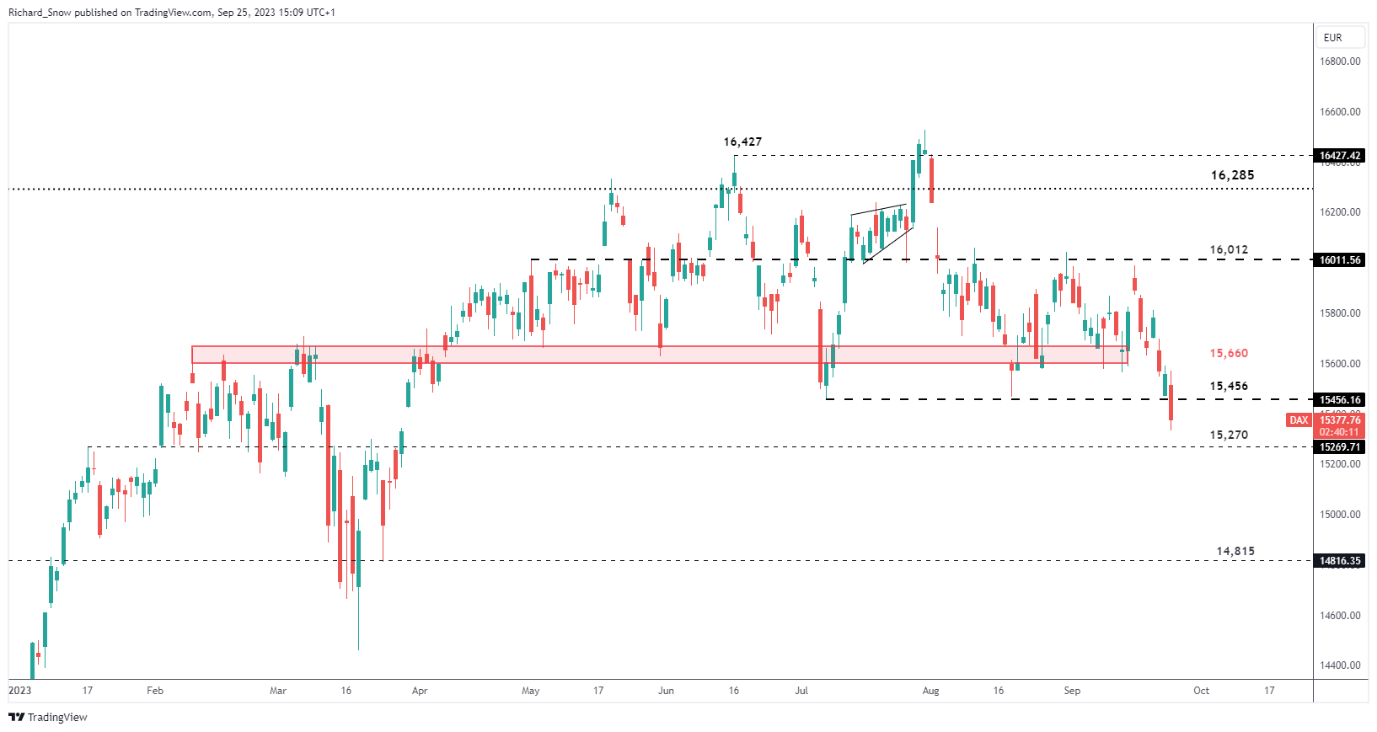
Soon after, the DAX followed the bulk of Asian indices lower, trading below 15,456. The Ifo business climate report did little to arrest the slide, printing a fourth straight decline as European fundamentals sour further. Isabel Schnabel outlined that the inflation problem remains and Christine Lagarde confirmed as much while stating the job market has also seen some easing.

The DAX now has 15,270 as the next level of support, followed by the longer-term 15,070. German and EU inflation data are due on Thursday and Friday this week respectively. The ECB will be desperate for the disinflationary trend to show more progress after hinting last week that the committee may have already reached peak rates.

DAX Daily Chart

image1.png

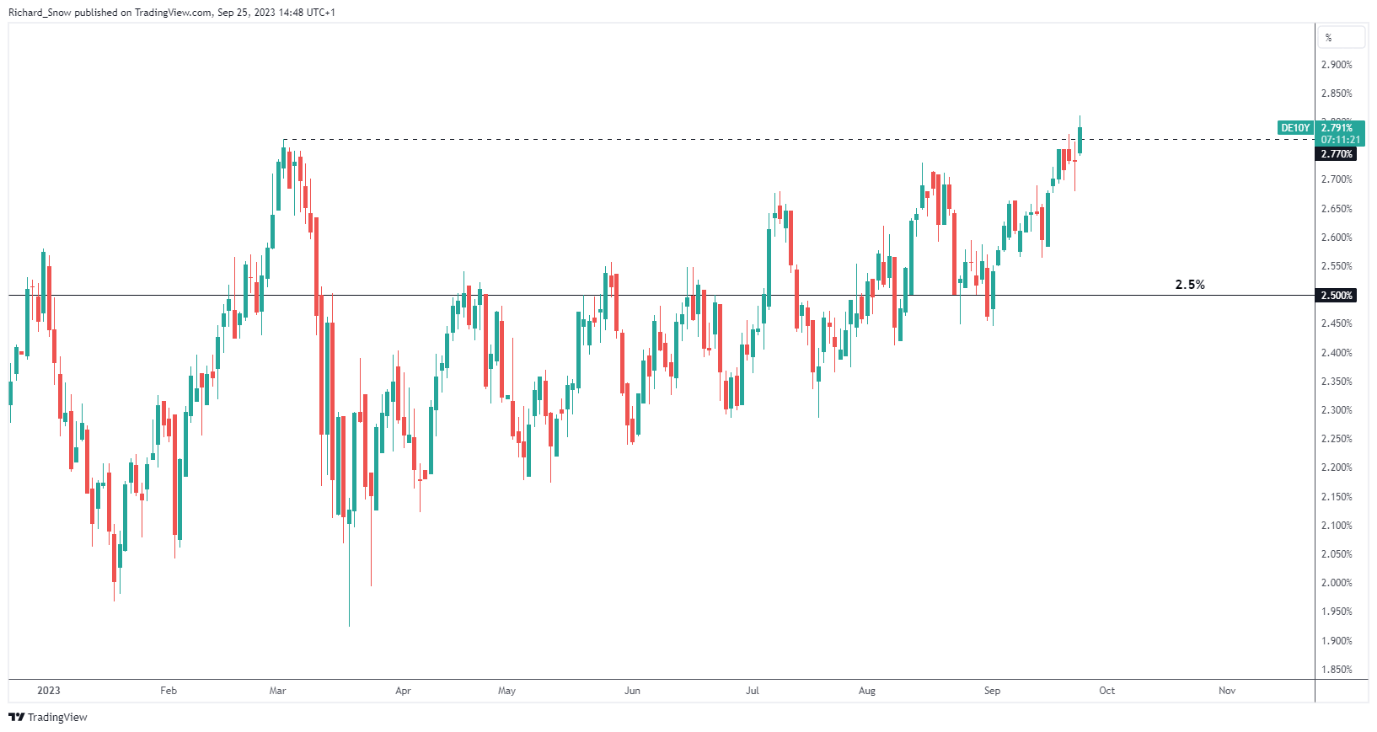
In addition, German Bund yields hit a new yearly high of 2.811% as the bond markets envision a scenario where rates remain higher for longer, even in Europe. However, this did little for the Euro which has broadly declined at the start of the week.

German 10-Year Bund Yield Source: TradingView, prepared by Richard Snow

image2.png

EU Stoxx 50 Breaches Crucial Support

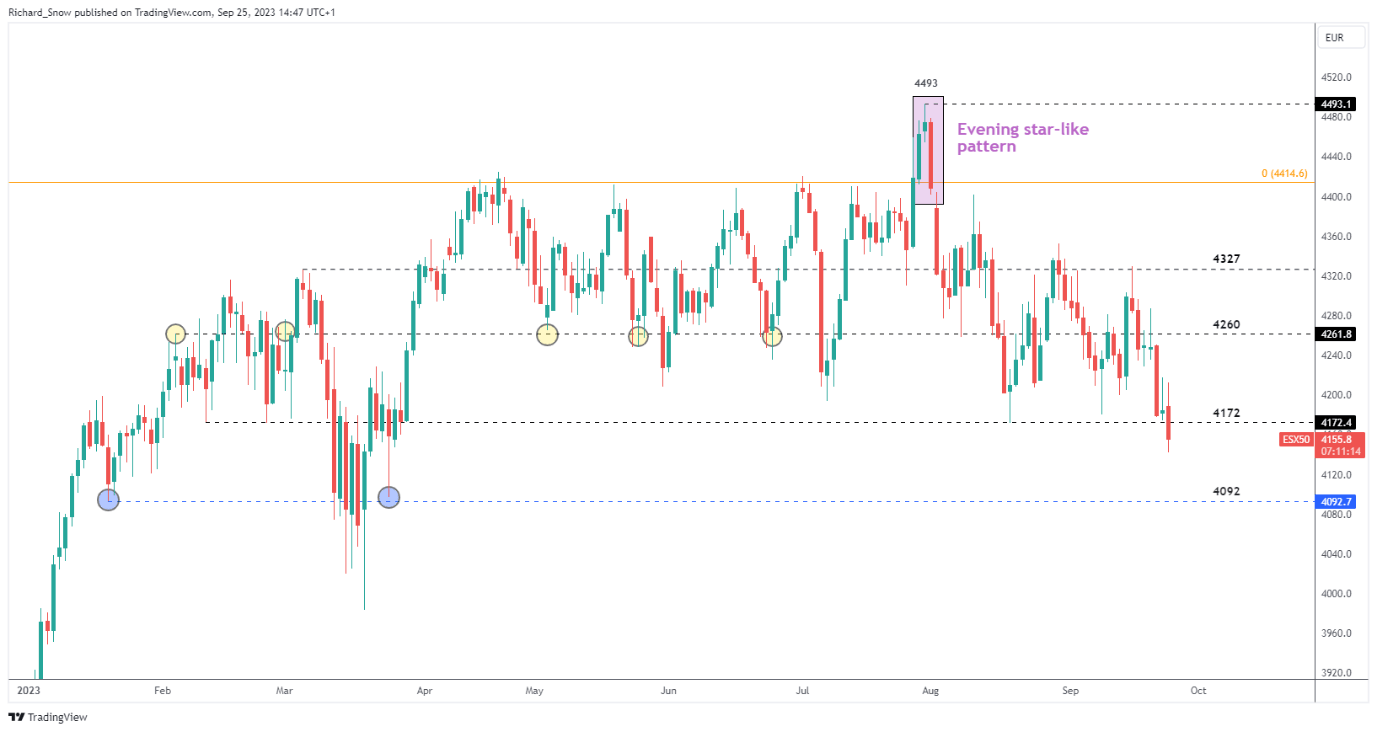
EU Stoxx 50 traded lower at the start of the week, breaching 4,172 – a level of support that had prevented further selling in August and September. The level also came into play in February this year, highlighting its importance as a pivot point.

The decline places 4,092 in sight if the bearish selloff is likely to continue – another notable level of support. In the event of the breakdown, it’s not unusual to see a retest of the 4,172 level of support before a potential bearish continuation.

EU Stoxx 50 Daily Chart

image3.png

Source: TradingView, prepared by Richard Snow

Euro Sets the Stage for an Eleventh Weekly Loss, Where Will EUR/USD Find Support?

Euro Sets the Stage for an Eleventh Weekly Loss, Where Will EUR/USD Find Support?

The Euro fell about -0.5 percent against the US Dollar on Monday. Now, EUR/USD is on course for an 11th consecutive weekly loss, matching the longest losing streak on record back in 1997. In response, retail traders have increased upside exposure. This can be seen by taking a look at IG Client Sentiment (IGCS), which often functions as a contrarian indicator. With that in mind, will the Euro extend its losing streak?

EUR/USD Sentiment Outlook – Bearish

The IGCS gauge shows that about 72% of retail traders are net-long EUR/USD. Since the majority of them are biased to the upside, this continues to hint that prices may fall down the road. This is as upside exposure increased by 12.82% and 6.9% compared to yesterday and last week, respectively. With that in mind, the combination of overall positioning and recent changes produces a stronger bearish contrarian trading bias.

Euro Daily Chart

On the daily chart below, EUR/USD broke under the 61.8% Fibonacci extension level at 1.0631. That has exposed the March low of 1.0516 as immediate support. Meanwhile, the falling trendline from July continues to guide the exchange rate lower.

As such, in the event of a turn higher, the trendline may hold as key resistance, maintaining a broadly bearish technical bias. Meanwhile, confirming a breakout under the March low. Establishing new lows for this year exposes the 100% level at 1.0436.

Euro Daily Chart

Chart Created in Trading View

AUD Price Forecast: Higher US Treasury Yields Limiting Aussie Dollar

AUD Price Forecast: Higher US Treasury Yields Limiting Aussie Dollar

AUSTRALIAN DOLLAR FUNDAMENTAL BACKDROP

The Australian dollar remains on the backfoot this Tuesday after the greenback (DXY) climbed to fresh yearly highs. US 10-year Treasury yields are now trading higher than those in 2008 and could track higher going forward. Post-FOMC, the narrative of ‘higher for longer’ interest rates has gained traction leaving the AUD trailing. The message was then supplemented by the Fed’s Neel Kashkari after he stated that the Fed will need to hike rates again 2023 in order to quell inflationary pressures in the US. Now that the blackout period is over (where Fed officials are unable to speak), the week ahead will be strewn with Fed officials and their outlook on the latest data and FOMC announcement.

Higher yields traditionally suggest investors will become more risk averse which does not bode well for pro-growth currencies like the Aussie dollar. With the US dollar being valued as a safe-haven currency, an extended rally could see the AUD breakdown further.

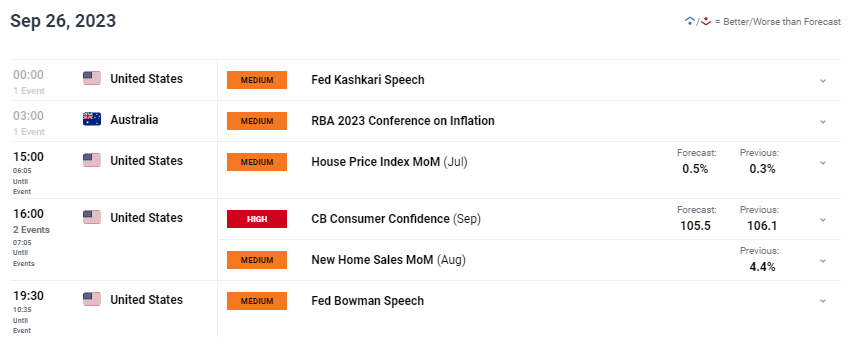
Later today, the economic calendar shown below will once again bring US factors into consideration with CB consumer confidence, housing data and Fed speak.

AUD/USD ECONOMIC CALENDAR (GMT +02:00)

image1.png

TECHNICAL ANALYSIS

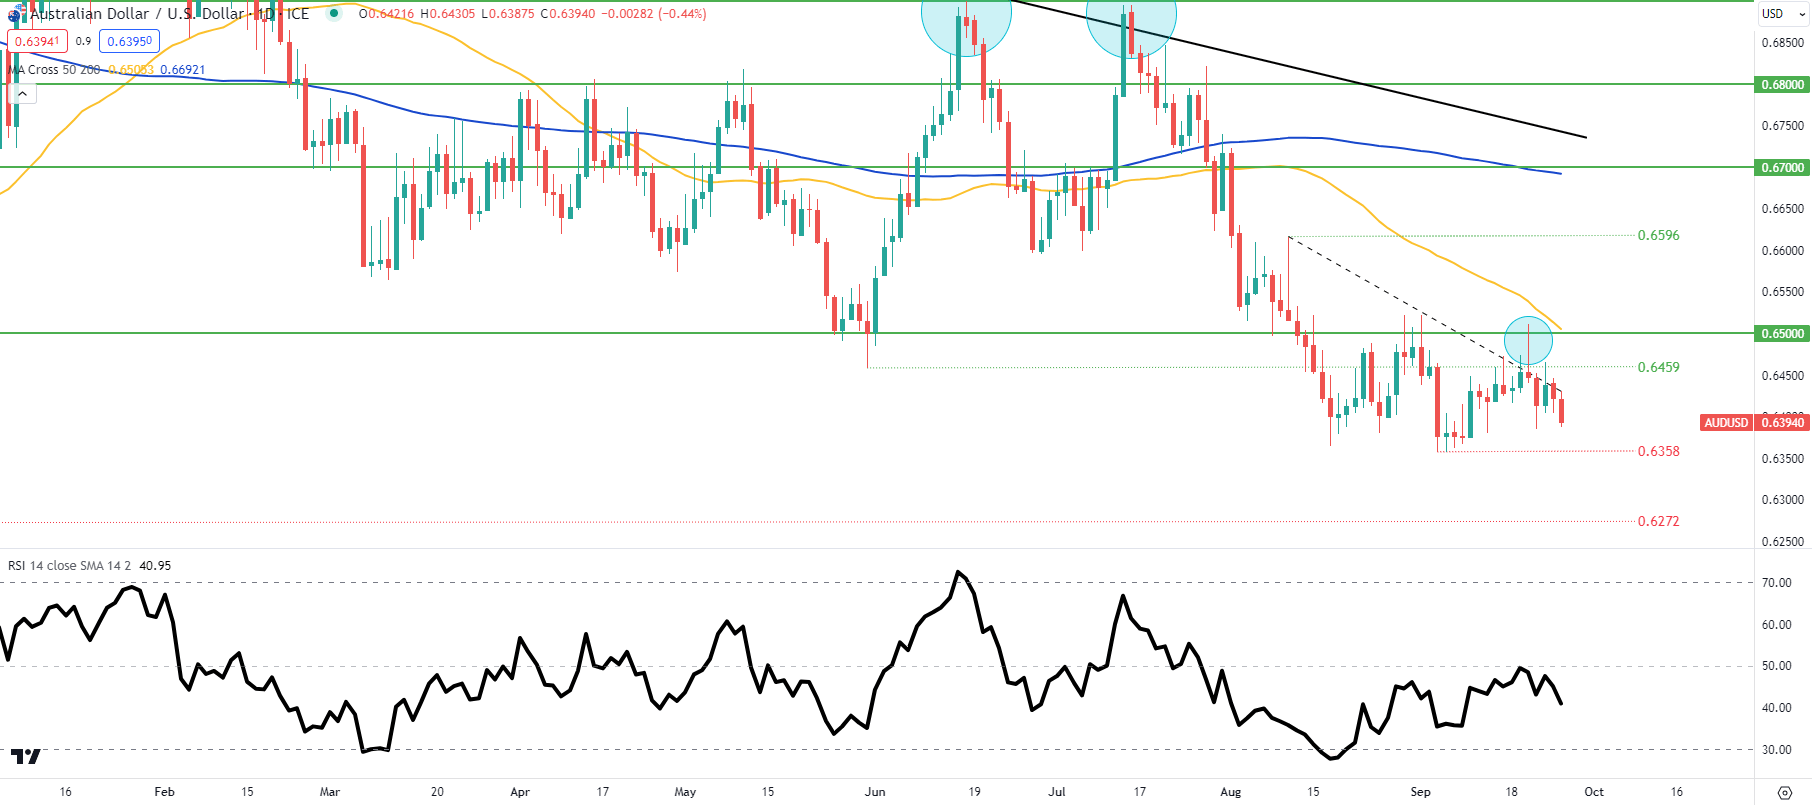
AUD/USD DAILY CHART

image2.png

Daily AUD/USD price action above shows last week’s long upper wick (blue) provide a clue into the subsequent downside move. Bulls are still restrained beneath the medium-term trendline resistance (dashed black line) as the 0.6358 swing low opens up for another test. The Relative Strength Index (RSI) is quite far away from oversold territory, leaving room for the already fragile AUD to extend its decline.


Asia Day Ahead: US Dollar at Fresh 10-month High, HSI Struggles

Asia Day Ahead: US Dollar at Fresh 10-month High, HSI Struggles

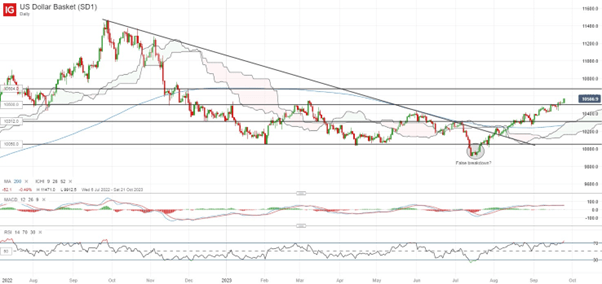
Major US indices eked out small gains to start the week, but it may be nothing more than an attempt to stabilise from recent sell-off, given the absence of a fresh bullish catalyst for now. The US 10-year yields continued its relentless rise to a fresh 16-year high above the 4.55% level while the US 30-year yields head to 4.67%. The US two-year yields saw more muted moves (+2 basis-point), with some unwinding of the inverted yield curve lately reflecting some accustoming to a high-for-longer market stance.

While we still tread amid the seasonally weaker period of the year, the tendency for the US government shutdown to drag for longer (potentially past the 1 Oct deadline) and lingering China’s housing woes remain as immediate headwind for markets to digest. Overnight, the US dollar found the conviction for a fresh 10-month high, seemingly setting its sight on the 106.84 level next. Latest CFTC data also revealed that the aggregate positioning for US dollar against other G10 currencies has reversed into net-long positioning for the first time since November 2022. The higher-highs-higher-lows formation since July this year keeps an upward bias intact for now, with the 105.00 level serving as immediate support to hold.

On the economic calendar ahead, focus will be on the US new home sales and consumer confidence data today. Given the recent jitters around the high-for-longer Fed rate guidance, a more lukewarm reading may be preferred to offer more policy flexibility for the Fed in deciding whether to go ahead with its last rate hike.

Asia Open

Asian stocks look set for a negative open, with Nikkei -0.89%, ASX -0.44% and KOSPI -1.12% at the time of writing, tracking the weaker showing in US equity futures. Higher bond yields and a firmer US dollar did not provide much conviction for risk-taking for now and to add to the downbeat mood, fresh liquidation order for developer China Oceanwide and ongoing China Evergrande’s debt-restructuring woes suggest that the worst-is-over for China’s property sector is far from being seen.

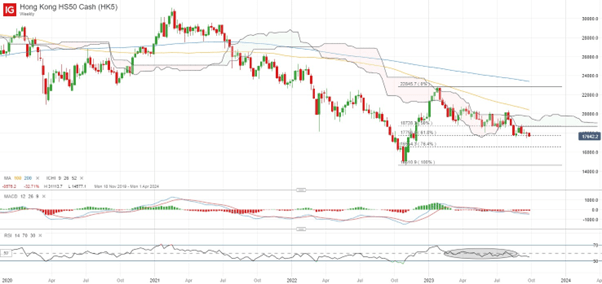
Chinese equities have unwound most of their last Friday’s gains, with the Hang Seng Index down close to 2% in yesterday’s session. The index has been attempting to defend the key 61.8% Fibonacci retracement level of its previous reopening rally, but seems to lack the fresh catalysts to do so. Some dip-buying was seen last week with the formation of a weekly dragonfly doji, but any failure to defend last week’s low may potentially pave the way to retest the 16,524 level next, where the next Fibonacci level stands. Greater conviction for buyers may have to come from a move back above its Ichimoku cloud on the weekly chart, which it has thus far failed to do so since July 2021.

Ahead, Singapore’s industrial production data will be due today. Given the 20.1% contraction for Singapore’s non-oil domestic exports (NODX) in August, the industrial production is expected to mirror the weaker global demand with a 3.1% contraction. That may reiterate the downbeat growth outlook for Singapore, with sentiments likely to track the global risk environment lower.

On the watchlist: EUR/GBP retesting neckline of double-bottom formation

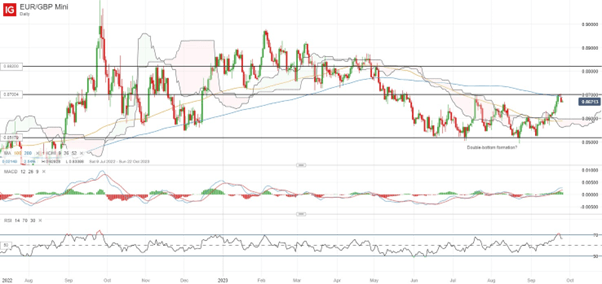
The EUR/GBP has been trading on a double-bottom formation since May this year, with the attempt for an upward break of the neckline at the 0.870 level finding some resistance overnight. Nevertheless, on the weekly chart, a bullish crossover has been formed on its Moving Average Convergence/Divergence (MACD), while its weekly Relative Strength Index (RSI) has also crossed above the key 50 level for the first time since April 2023, which may reflect buyers trying to take back some control.

This comes as the pair has reclaimed its 100-day MA last week, after failing to overcome it on previous three occasions since May this year. Greater conviction for the bulls will still await for the neckline breakout above the 0.870 level, where its 200-day MA stands as well, with any success on that front potentially paving the way to retest the 0.882 level next.


Bitcoin & Ethereum Rally Fizzles: What’s Next for BTC/USD & ETH/USD?

Bitcoin & Ethereum Rally Fizzles: What’s Next for BTC/USD & ETH/USD?

BITCOIN: Lacks upward momentum

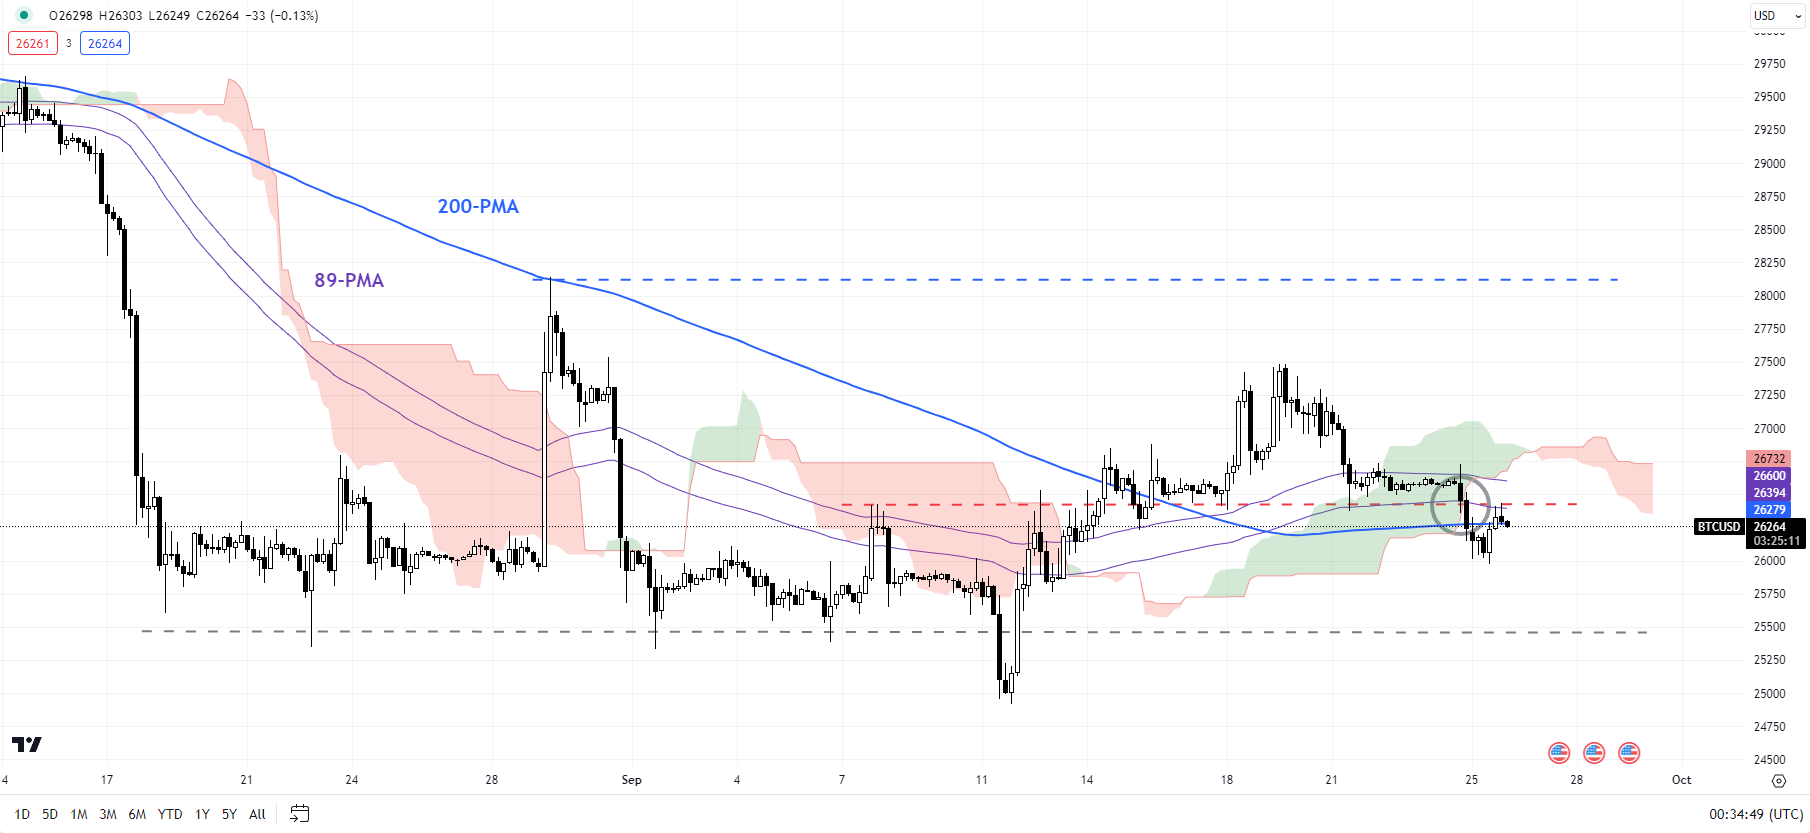
Bitcoin’s inability to retest a vital ceiling at the end-August high of 28150 underscores the broader weakness – BTC/USD just doesn’t have enough upward momentum required to embark on a meaningful uptrend. As a result, the Bitcoin rally last week proved to be short-lived. See the previous update that highlighted the possibility of a rebound “Have Bitcoin & Ethereum Capitulated? BTC/USD & ETH/USD Price Setups,” published September 18.

BTC/USD 240-Minute Chart

image1.png

The subsequent fall below crucial converged support at the September 15 low of 26250, coinciding with the lower edge of the Ichimoku cloud and the 89-period moving average on the 240-minute charts confirms that the upward pressure has faded. The break below support has opened up the possibility of two scenarios. BTC/USD could settle in a 24750-27500 range; the second scenario involves a retest of the June low of 24750.

BTC/USD Daily Chart

image2.png

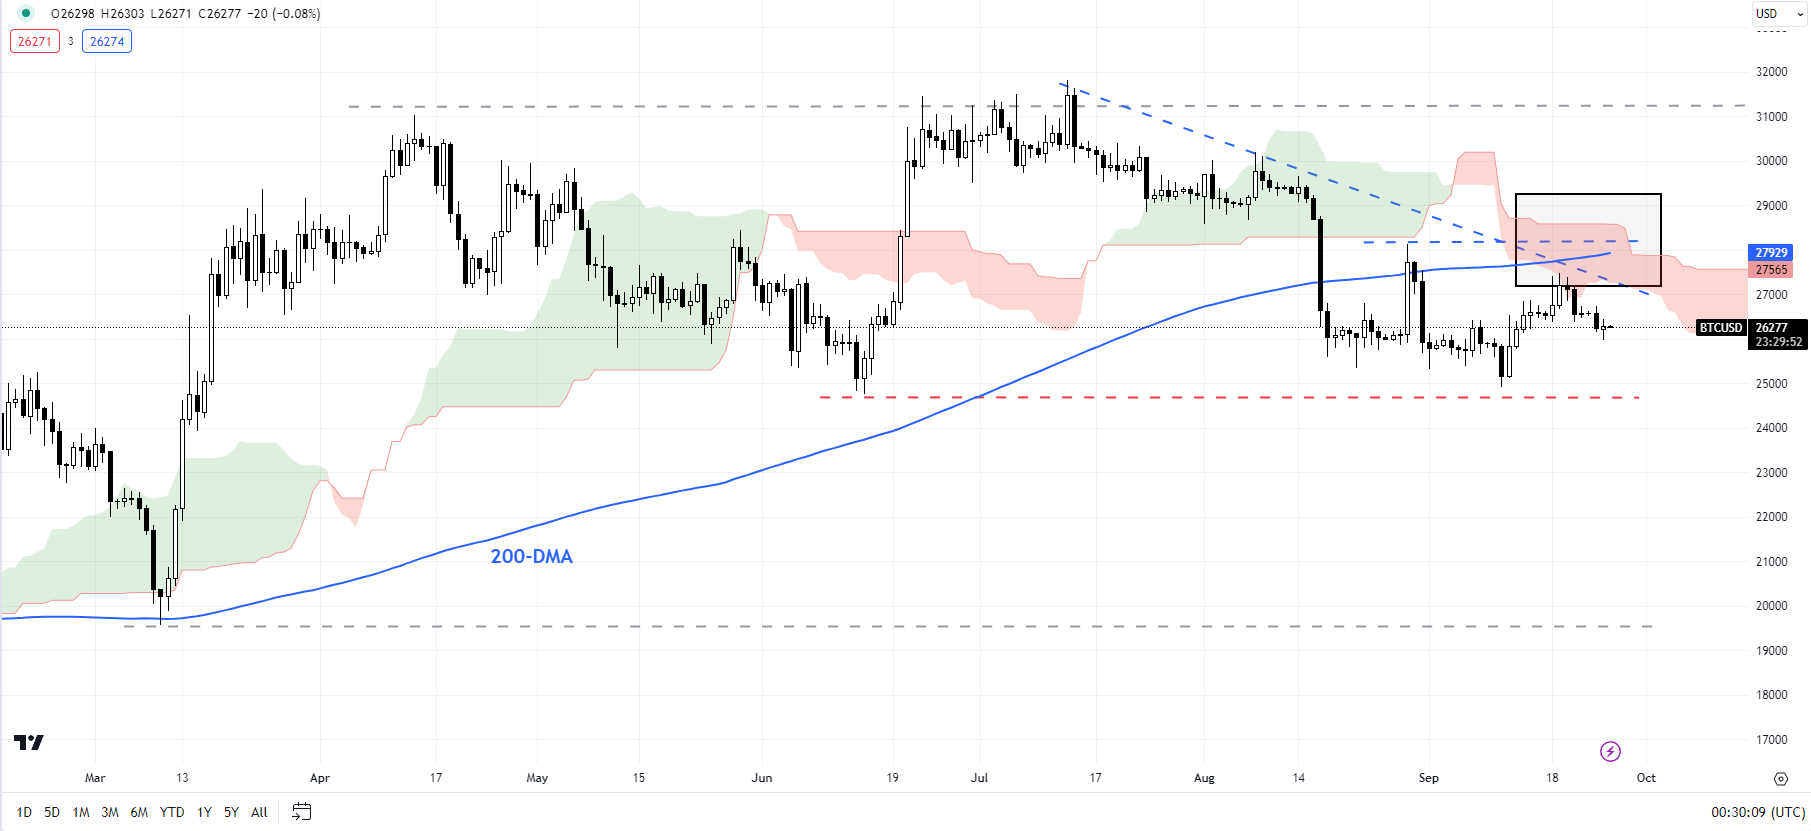
On the upside, unless Bitcoin is able to cross above the end-August high of 28150, the path of least resistance remains sideways to down. From a big-picture perspective, any break below 24750 could spell further weakness toward the March low of 19500.

ETHEREUM: Falters at key resistance

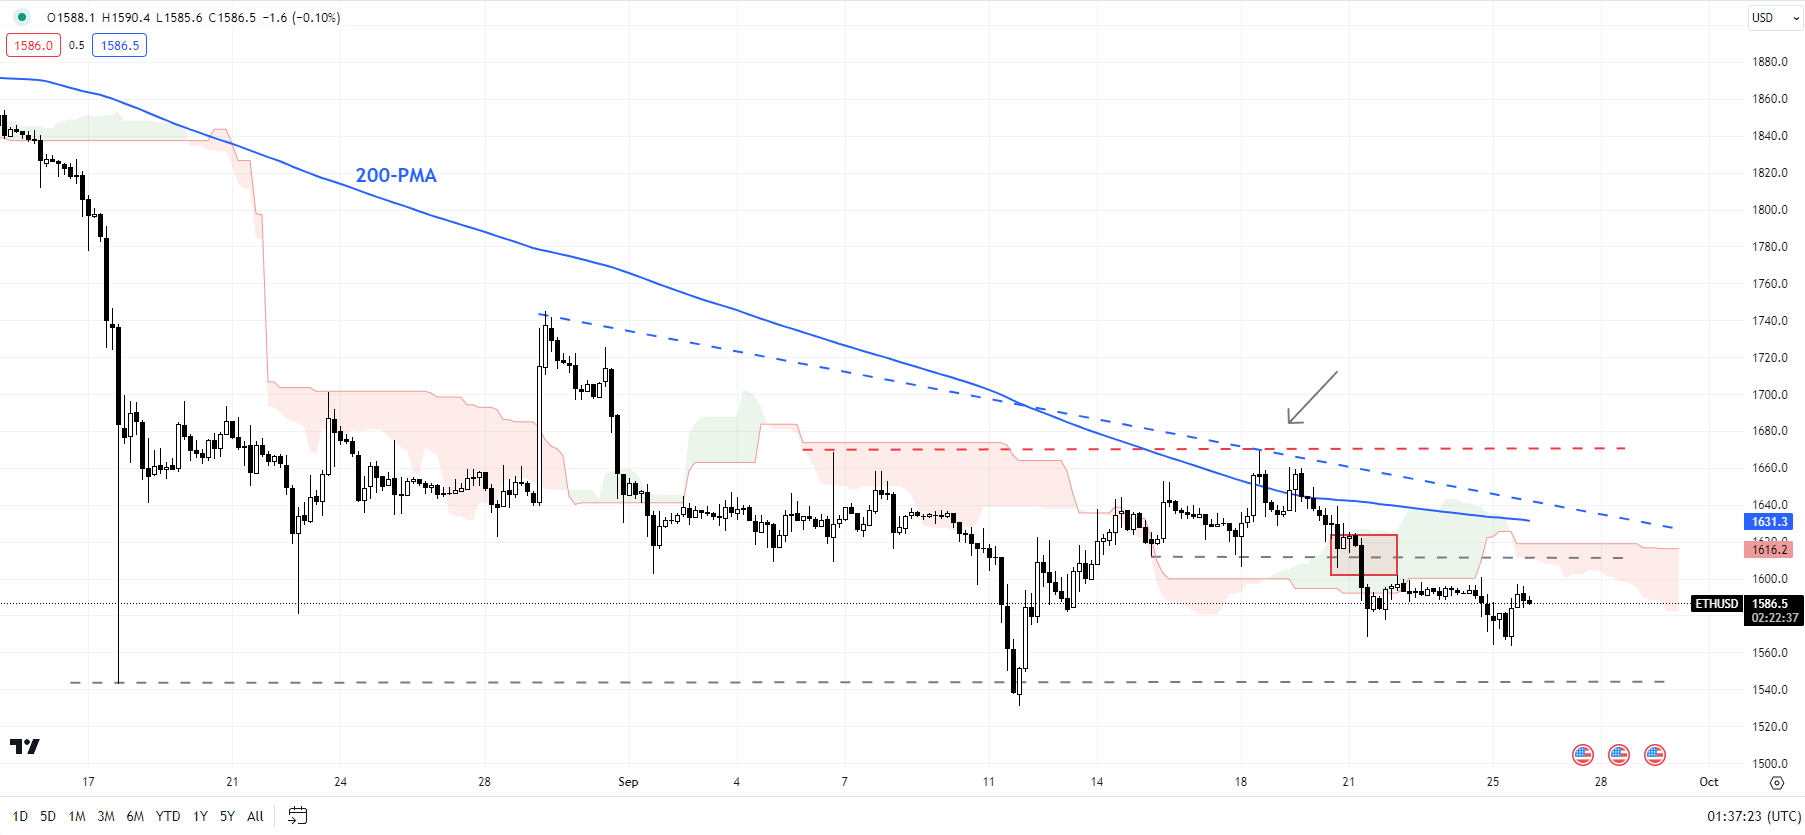
Ethereum charts probably stand out and clarify the inability of Bitcoin to rise toward the August high. Ethereum has succumbed to strong resistance on the 200-period moving average, coinciding with the early-September high of 1660, and a downtrend line from August.

ETH/USD 240-Minute Chart

image3.png

The retreat from key resistance coupled with the subsequent fall below a horizontal trendline support at 1600 keeps the bearish bias intact –as highlighted in the previous update. ETH/USD risks a retest of the August low of 1550. Below the August low, the next support is on the lower edge of a downtrend channel since April (now at about 1485). A break below the 1475-1550 region could pave the way toward the October low of 1370.

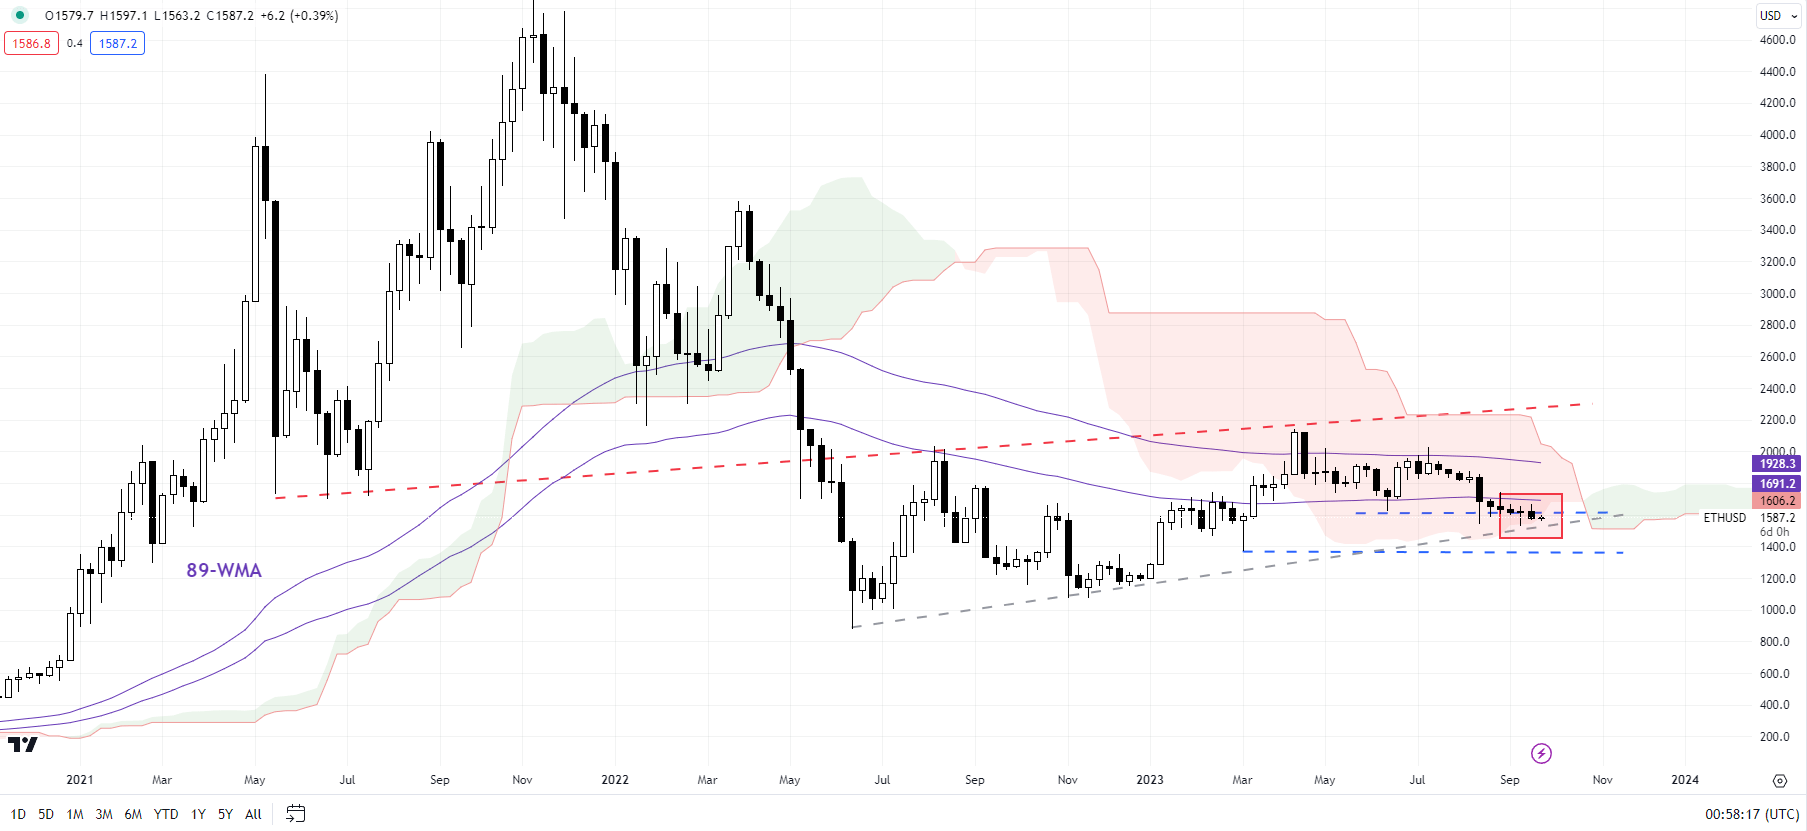
ETH/USD Weekly Chart

image4.png

As noted earlier this month, ETH/USD has been under the influence of the bearish Ichimoku cloud cover on the weekly charts. Furthermore, in recent weeks, ETH/USD has been snowed under the Ichimoku cloud on the daily charts. On the upside, Ethereum needs to surpass 1660 at the very least for the downward pressure to begin easing.