Gold and Silver Prices Weaken on Monday, How is the Near-Term Landscape Shaping up?

Gold and Silver Prices Weaken on Monday, How is the Near-Term Landscape Shaping up?

XAU/USD Analysis

Gold and silver prices have continued lower amid the rise in longer-term US Treasury yields and a stronger US Dollar. As a result, how is the near-term technical landscape evolving in precious metals?

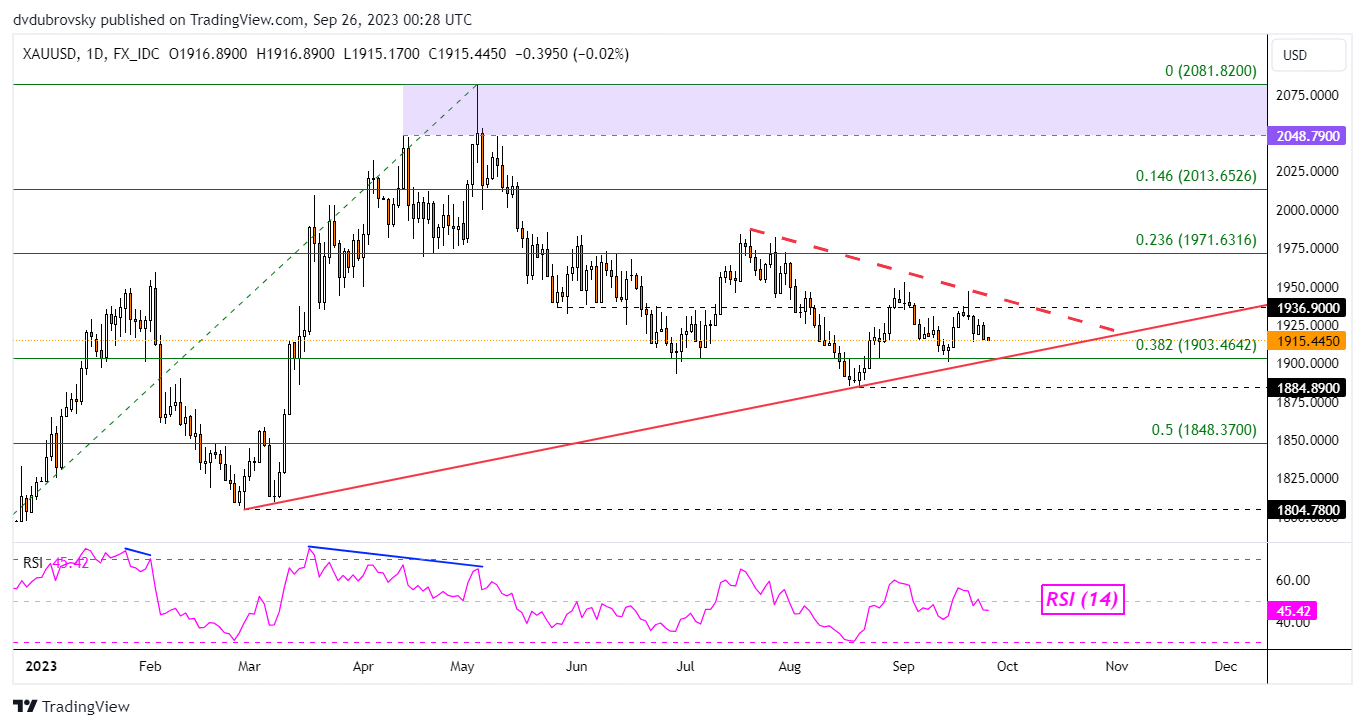
Gold continues to trade in a directionless flow from a near-term technical perspective. Prices are consolidating between the falling trendline from July and rising support from February – see chart below. Broadly speaking, XAU/USD remains unchanged form levels seen in mid-2020.

With each passing day, the yellow metal is running out of room to consolidate between support and resistance. As such, the direction of the breakout could be key for the coming trend. Below, watch the August low of 1884.89. Above, resistance seems to be the 23.6% Fibonacci retracement level of 1971.63.

image1.png

XAG/USD Analysis

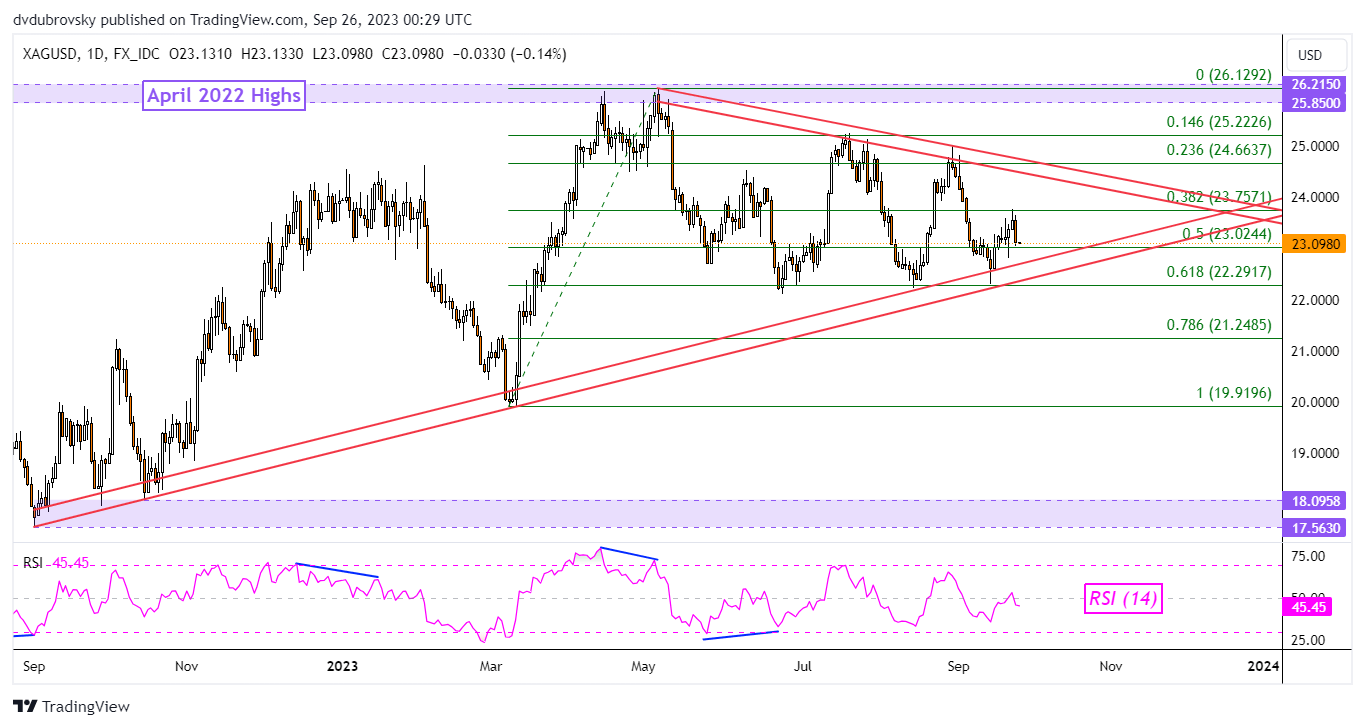
Meanwhile, silver faces a similar setting. Like gold, XAG/USD is consolidating between rising support and resistance. The difference here is that there is still plenty of room left for sideways price action. As such, XAG/USD could be left directionless for a longer period of time than gold.

Silver’s drop on Monday has brought it to the midpoint of the Fibonacci retracement level at 23.02. As such, it is also sitting just above rising support from the end of last year. A meaningful breakout likely entails a push under the 61.8% Fibonacci retracement level of 22.29.

That exposes the 78.6% point at 21.24. Otherwise, a turn higher places the focus on the 38.2% level at 23.75. Just above that is the falling zone of resistance since May.

Silver Mixed

Data provided by

of clients are net long.
Change in Longs Shorts OI
Daily 1% -17% -1%
Weekly -10% 13% -8%
What does it mean for price action?
Get My Guide

XAG/USD Analysis

Chart Created in TradingView

Market Breadth has Weakened: Implications for S&P 500 & Nasdaq

Market Breadth has Weakened: Implications for S&P 500 & Nasdaq

Market breadth in US indices has weakened recently, with some indicators around multi-month lows. From a contrarian perspective, it could reflect oversold conditions, pointing to a minor rebound ahead of the US earnings season.

S&P 500:

As of Friday, around 18% of the members in the S&P 500 index were above their respective 20-day moving average (DMA). Data from 1996 onwards suggests that when 17%-20% of the members were above their respective 20 DMAs, the index was up 67% of the time over the subsequent 30 days. That is, in such instances, 67% of the time the index returns have been positive over the subsequent one-month period based on historical performance (see the distribution plot).

Distribution plot of S&P 500 index returns when 17%-20% of members are above their respective 20-day moving average

Similarly, data from 1996 onwards suggests that when 21%-24% of the members were below their respective Lower Bollinger Bands, the index was up 66% of the time over the subsequent 30 days. That is, in such instances, 66% of the time the index returns have been positive over the subsequent one-month period based on historical performance (see the distribution plot).

Distribution plot of S&P 500 index returns when 21%-24% of members are below their respective Lower Bollinger Band
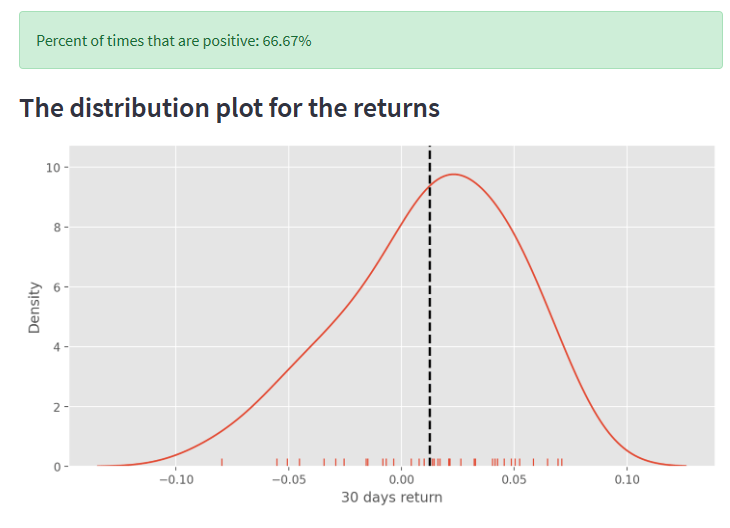
image2.png

Data Source: Bloomberg; Chart Created by Manish Jaradi in Python

Furthermore, as of Friday, 17% of the members in the S&P 500 index had the 14-day Relative Strength Index below 30. Data from 1996 onwards suggests that when 15%-18% of the members had their 14-day RSI below 30, the index was up 68% of the time over the subsequent 30 days. That is, in such instances, 68% of the time the index returns have been positive over the subsequent one-month period based on historical performance (see the distribution plot).

Distribution plot of S&P 500 index returns when 15%-18% of members are trading with 14-day RSI below 30
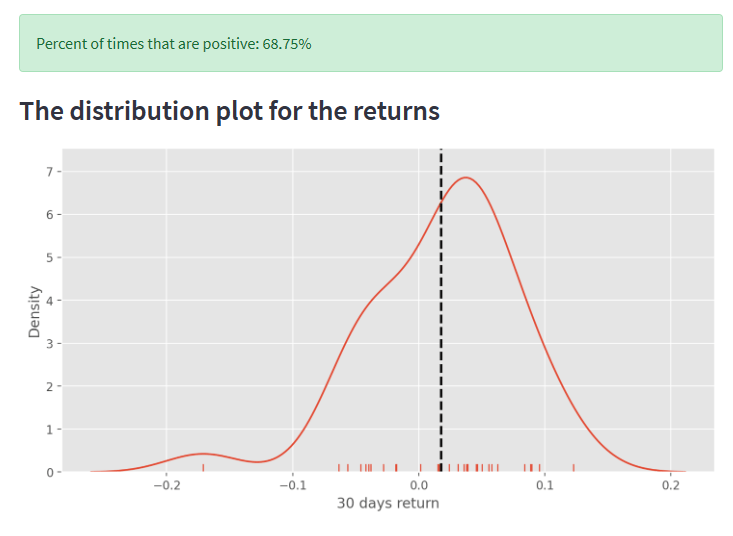
image3.png

Nasdaq Composite Index:

As of Friday, around 23% of the members in the Nasdaq index were above their respective 20-day moving average (DMA). Data from 2002 onwards suggests that when 22%-25% of the members were above their respective 20-DMAs, the index was up 72% of the time over the subsequent 30 days. That is, in such instances, 72% of the time the index returns have been positive over the subsequent one-month period based on historical performance (see the distribution plot).

Distribution plot of Nasdaq Composite index returns when 22%-25% of members are above their respective 20-day moving average
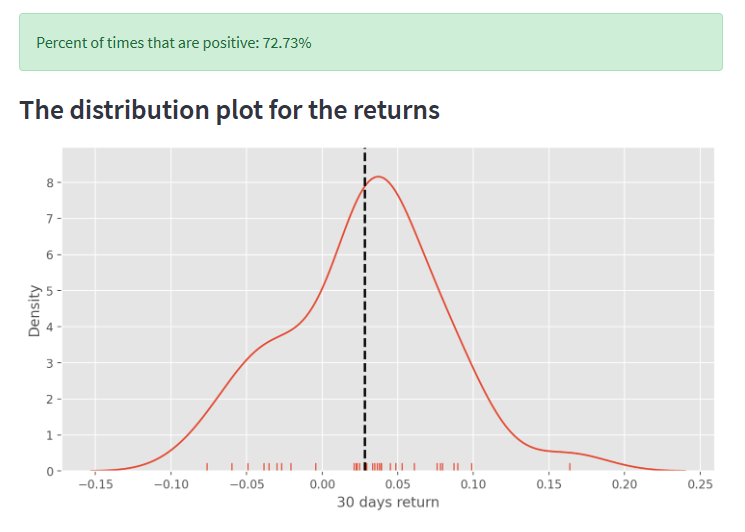
image4.png

Similarly, data from 2002 onwards suggests that when 12%-15% of the members were below their respective Lower Bollinger Bands, the index was up 62% of the time over the subsequent 30 days. That is, in such instances, 62% of the time the index returns have been positive over the subsequent one-month period based on historical performance (see the distribution plot).

Distribution plot of Nasdaq Composite Index returns when 12%-15% of members are below their respective Lower Bollinger Band
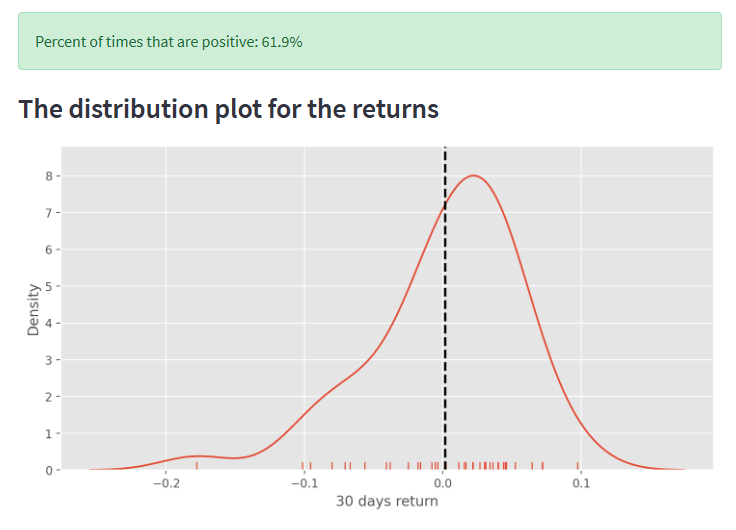
image5.png

Furthermore, as of Friday, 17% of the members in the Nasdaq index had the 14-day Relative Strength Index below 30. Data from 2002 onwards suggests that when 16%-19% of the members had their 14-day RSI below 30, the index was up 65% of the time over the subsequent 30 days. That is, in such instances, 65% of the time the index returns have been positive over the subsequent one-month period based on historical performance (see the distribution plot).

Distribution plot of Nasdaq returns when 16%-19% of members are trading with 14-day RSI below 30
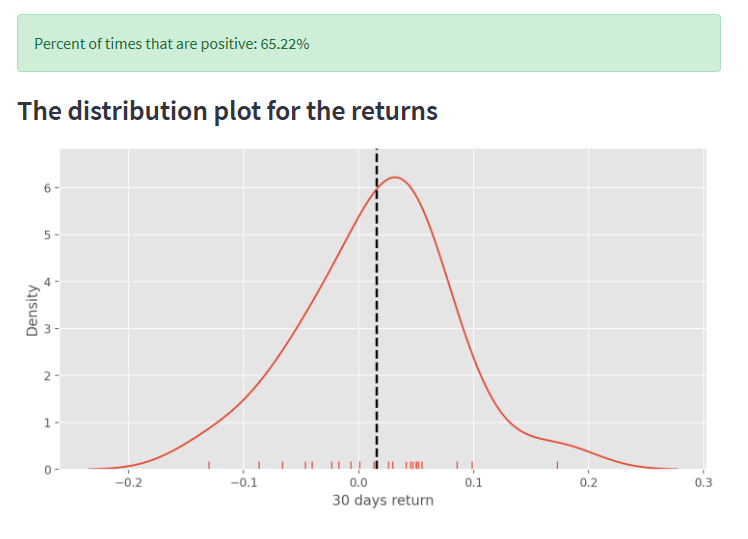
image6.png

Gold Price Forecast – Gold Continues to See Sideways Action

Gold Price Forecast – Gold Continues to See Sideways Action

Gold Market Technical Analysis

Gold markets find themselves ensnared in a web of uncertainty as traders grapple with a multitude of factors affecting the precious metal’s performance. At the forefront of these considerations is the presence of the 50-Day Exponential Moving Average, situated just above the current market price. The market’s ability to breach this level holds implications for its future direction, although the EMA has been traversed multiple times in recent history.

Trading Derivatives carries a high level of risk to your capital and you should only trade with money you can afford to lose. Trading Derivatives may not be suitable for all investors, so please ensure that you fully understand the risks involved, and seek independent advice if necessary. A Product Disclosure Statement (PDS) can be obtained either from this website or on request from our offices and should be considered before entering into a transaction with us. Raw Spread accounts offer spreads from 0.0 pips with a commission charge of USD $3.50 per 100k traded. Standard account offer spreads from 1 pips with no additional commission charges. Spreads on CFD indices start at 0.4 points. The information on this site is not directed at residents in any country or jurisdiction where such distribution or use would be contrary to local law or regulation.

A prominent factor influencing gold’s trajectory is the ebb and flow of interest rates, with the bond market playing a pivotal role. The precious metal remains closely tied to the performance of interest rate markets, which continue to exert upward pressure. Consequently, gold’s price dynamics are poised to remain turbulent as traders attempt to decipher the intentions of central banks.

It’s essential to note that the Federal Reserve has signaled its intention to maintain a tightening stance for an extended period. This policy stance exerts some pressure on gold, as higher interest rates tend to diminish the appeal of non-interest-bearing assets. Nonetheless, gold retains its allure as a safety asset, attracting investors in times of uncertainty—an aspect contributing to its recent performance.

From a technical perspective, gold appears to be forming a triangle pattern—a key chart pattern closely monitored by technical traders. This pattern coincides with the presence of the 200-Day EMA just below, adding further significance to this level. Below the 200-Day EMA lies the critical $1900 level, representing a formidable barrier. Any breach below this level could trigger a swift descent toward the $1800 level.

Conversely, if the market reverses course and embarks on an upward trajectory, it will encounter resistance at the $1980 level, followed by a substantial psychological barrier at $2000.

In the end, gold markets are currently navigating a range-bound environment while grappling with various influencing factors. Interest rate fluctuations continue to be a dominant force, shaping gold’s price movements. The presence of the 50-Day EMA, the triangle pattern, and the 200-Day EMA add layers of technical significance to this market. As the financial landscape remains in a state of flux, traders are advised to exercise caution, remain nimble, and carefully manage their position sizes. While long-term prospects for gold appear promising amid ongoing market uncertainties, short-term fluctuations are likely to persist. Effective position sizing remains paramount in this dynamic market, as in others.

US Dollar Index News: DXY Strengthens Post-Fed Decision; Eyes on Yen and Euro

US Dollar Index News: DXY Strengthens Post-Fed Decision; Eyes on Yen and Euro

Dollar Stands Firm, Eyes on the Yen and Euro

The dollar index continued its ascendancy, hovering near a six-month high, 0.06% higher at 105.64 on Monday. This uptrend follows last week’s Federal Reserve decision to maintain its interest rates. Contrary to market expectations, the Fed hinted at higher U.S. rates persisting longer than anticipated. Recent remarks from Fed officials also allude to impending rate hikes, with market speculators seeing a 25% likelihood of a 25-basis-point augmentation come November.

Yen Weakens, BoJ Maintains Stance

The yen experienced a slump, depreciating 0.17% to 148.66 against the dollar. This decline, the lowest since the previous October, ensued after the Bank of Japan (BoJ) held on to ultra-low interest rates. BoJ Governor Kazuo Ueda emphasized a careful examination of data before contemplating rate hikes. Ueda’s commentary emphasized the absence of consistent inflation, validating BoJ’s ongoing monetary easing. Some analysts speculate that if the yen’s value deteriorates further, Japanese authorities may intercede as they did the previous year.

Advertisement
Know where the Market is headed? Take advantage now with

Trading Derivatives carries a high level of risk to your capital and you should only trade with money you can afford to lose. Trading Derivatives may not be suitable for all investors, so please ensure that you fully understand the risks involved, and seek independent advice if necessary. A Product Disclosure Statement (PDS) can be obtained either from this website or on request from our offices and should be considered before entering into a transaction with us. Raw Spread accounts offer spreads from 0.0 pips with a commission charge of USD $3.50 per 100k traded. Standard account offer spreads from 1 pips with no additional commission charges. Spreads on CFD indices start at 0.4 points. The information on this site is not directed at residents in any country or jurisdiction where such distribution or use would be contrary to local law or regulation.

Euro Dips. Swedish Crown Shines

In other currency movements, the Swedish crown reached a near seven-week pinnacle against the euro. This surge followed the announcement of the Swedish property group SBB’s 8 billion crown ($719 million) acquisition, coupled with plans to restructure its operations. On the contrary, the euro saw a minor decline of 0.1%, gravitating towards its six-month nadir of $1.0615. With fears of a recession escalating, a recent survey revealed Germany’s waning business morale, underscoring these concerns and exerting downward pressure on the euro. ECB policymaker Francois Villeroy de Galhau voiced concerns about the economy, cautioning against excessive rate hikes.

Sterling Suffers Setback

Sterling’s value dipped by 0.17% to $1.2224, a repercussion of the Bank of England’s recent halt on its rate-hike cycle and the unanticipated slackening of Britain’s high inflation rate. The pound is projected to record a 3.5% decline for September, marking its most lackluster monthly performance in the past year.

Short-Term Outlook

The US Dollar Index (DXY) is on a bullish ascent in the short term, reflecting the prevailing market dynamics. Conversely, currencies like the yen and the pound show potential vulnerabilities. Influences from central bank decisions and regional economic indicators remain pivotal in shaping the broader forex arena.

Technical Analysis

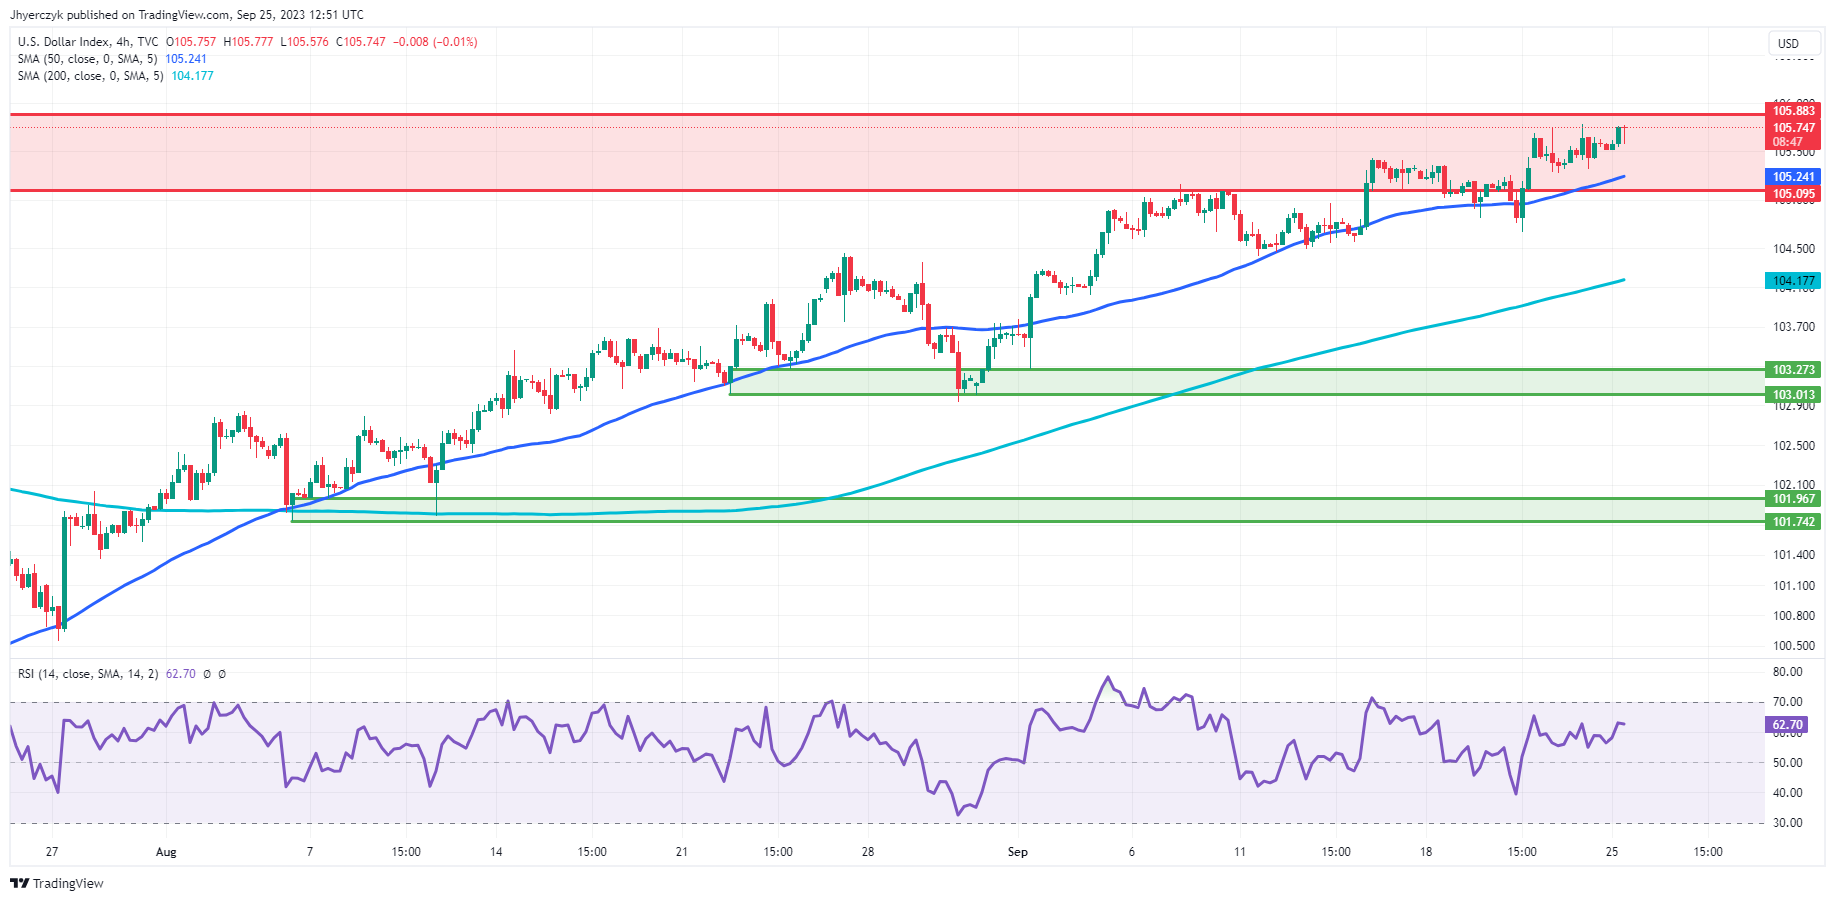
4-Hour US Dollar Index (DXY)The US Dollar Index (DXY) currently trades at 105.734, closely trailing its previous 4-hour mark of 105.755. Its position above the 200-4H moving average of 104.177 indicates a prolonged upward trend, further corroborated as it hovers close to the 50-4H moving average of 105.241.

The 14-4H RSI, at 62.61, shows a strengthened momentum, though not yet in overbought territory.

Significant support is established at 105.095, with a main resistance looming at 105.883. With the DXY standing robustly between these levels, and with its momentum indicators and moving averages in consideration, the market sentiment leans bullish for the short term.

Natural Gas Prices Forecast: Weather and EU’s LNG Dependence Shape Gas Market

Natural Gas Prices Forecast: Weather and EU’s LNG Dependence Shape Gas Market

Weather Dictates the Market

Natural gas prices showed a minor rise on Monday, driven mainly by current weather patterns rather than geopolitical or supply-demand forces. The relatively mild weather across the US has capped demand, but with occasional warm periods in the southern US, there’s a fluctuating need for cooling. The absence of significant events over the weekend, like the conclusion of the Australian strike, also kept the trading landscape fairly calm.

Supply and Demand Dynamics

The US has witnessed consistent and steady supply levels with LSEG reporting an average gas output in the lower 48 states at 102.1 billion cubic feet per day (bcfd) this September. However, there was a minor dip from the 102.3 bcfd record in August. On the demand side, a small decrease in US energy firm rigs could impact future output. Specifically, oil rigs dropped to their lowest since February 2022.

Trading Derivatives carries a high level of risk to your capital and you should only trade with money you can afford to lose. Trading Derivatives may not be suitable for all investors, so please ensure that you fully understand the risks involved, and seek independent advice if necessary. A Product Disclosure Statement (PDS) can be obtained either from this website or on request from our offices and should be considered before entering into a transaction with us. Raw Spread accounts offer spreads from 0.0 pips with a commission charge of USD $3.50 per 100k traded. Standard account offer spreads from 1 pips with no additional commission charges. Spreads on CFD indices start at 0.4 points. The information on this site is not directed at residents in any country or jurisdiction where such distribution or use would be contrary to local law or regulation.

The demand for gas is projected to be fluid due to evolving weather patterns. Although the next week may see a slight decrease in gas demand, with the warmer weather expected in the subsequent week, there could be a resurgence in demand levels. Interestingly, gas flows to major US LNG export plants rose in September compared to August, even though daily averages remain static due to annual maintenance activities.

Trade and International Relations

The gas market is currently being molded by significant trade dynamics. There’s a marked rise in US LNG exports, particularly noticeable in the recent surge of pipeline exports to Mexico this September. On the global stage, the EU is strategically shifting its energy sources, especially in the aftermath of the Russia-Ukraine conflict. This transition underscores Europe’s dependence on US LNG. As Europe strives to lessen its reliance on Russian gas and bolster its renewable energy sector, Ditte Juul Jørgensen’s remarks to the Financial Times underscore the enduring importance of US fossil fuels in the EU’s energy matrix.

A Glimpse Ahead

The near-term forecast for natural gas remains neutral to bearish. The ongoing fluctuations in weather, combined with steady supply levels and varying international demand, especially from Europe, will keep the gas market active. While the mild weather might suppress the immediate demand.

The larger geopolitical landscape and the EU’s pivot towards US LNG indicate a sustained demand in the longer run.

Technical Analysis

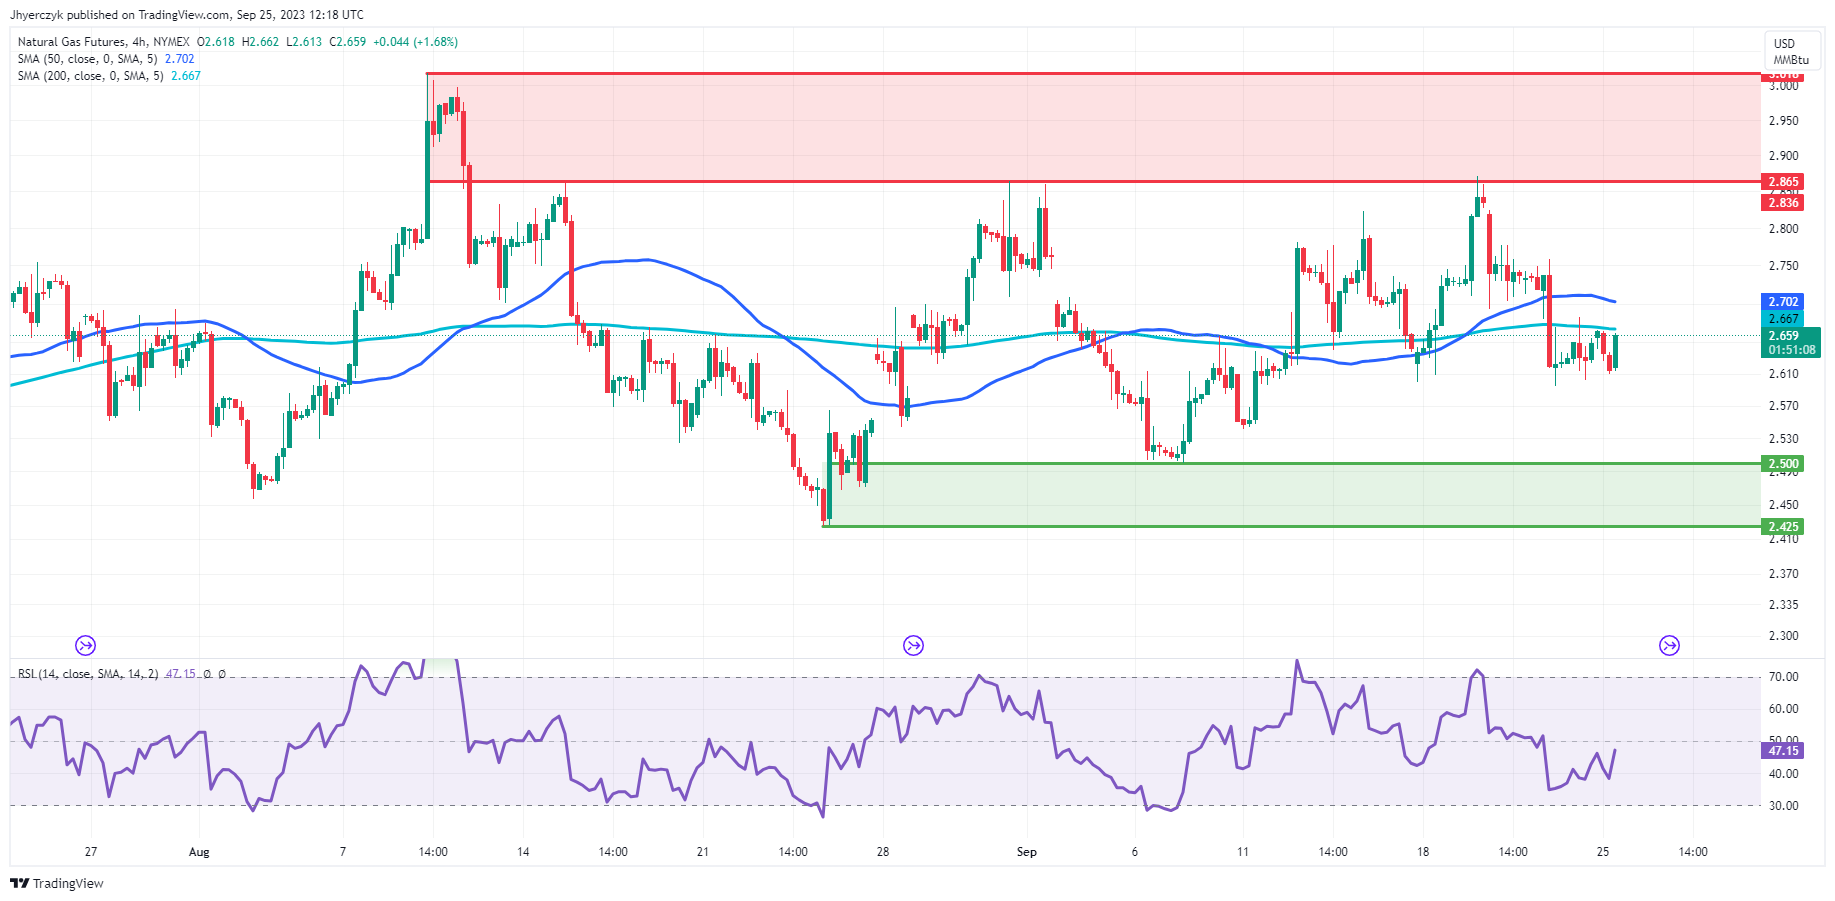
4-Hour Natural GasNatural Gas’s current 4-hour price stands at 2.661, showing a modest increase from the previous 4-hour price of 2.615. When compared to the 200-4H moving average of 2.667, the commodity is trading slightly below it, while it also lies below the 50-4H moving average of 2.702.

The 14-4H RSI reading is at 47.50, suggesting a slightly weakened momentum but not necessarily oversold conditions.

In terms of support and resistance, the price is hovering above the main support area of 2.500 to 2.425 but remains below the main resistance area ranging from 2.865 to 3.018. Based on these technical indicators, the market sentiment for Natural Gas appears to be neutral to mildly bearish.

Dallas Fed Manufacturing Index Slides In September, Missing Analyst Estimates

Dallas Fed Manufacturing Index Slides In September, Missing Analyst Estimates

On September 25, the Federal Reserve Bank of Dallas released Dallas Fed Manufacturing Index report. The report indicated that Dallas Fed Manufacturing Index declined from -17.2 in August to -18.1 in September, compared to analyst consensus of -10.

Production Index improved from -11.2 in August to +7.9 in September, while New Orders Index increased from -15.8 to -5.2. Capacity Utilization grew from -3.7 to +7.8.

The future remains uncertain for survey respondents, and the corresponding Outlook Uncertainty indicator increased from 12.7 in August to 27.0 in September.

Treasury yields continue to move higher as traders fear that Fed may be forced to raise rates one more time this year to fight inflation.

U.S. dollar tests multi-month highs as traders focus on rising Treasury yields. Currently, U.S. Dollar Index is trying to settle above the 106.00 level.

Rising Treasury yields and strong dollar put significant pressure on gold markets. Gold pulled back towards the $1915 level and is moving towards the nearest significant support level, which is located in the $1900 – $1915 range.

SP500 remains under pressure after the release of Dallas Fed Manufacturing Index report. SP500 settled below the 4320 level as the pullback continues.

Oil Prices Forecast: Crude’s Turbulence Driven by Geopolitics, Rate Hikes, China

Oil Prices Forecast: Crude’s Turbulence Driven by Geopolitics, Rate Hikes, China

Tightening Oil Supply and Global Implications

Global oil prices witnessed an uptick on Monday, primarily fueled by Moscow’s decision to temporarily curb fuel exports. This measure amplifies the already looming tension around constrained oil supply. Brent crude is trading at $93.59 a barrel, observing a subtle increase, while U.S. West Texas Intermediate is at $90.27 a barrel, marking its second session of gains.

Rate Hikes and Market Response

While the market grapples with Russia’s restrictions on diesel and gasoline exports, there’s an overshadowing concern about future rate hikes, a consequence of the Federal Reserve’s latest hawkish messages. This standpoint from the Fed challenges the oil market’s dynamics, as evidenced by the previous week’s dip in oil contracts. This slip, ending a three-week surge, was instigated by concerns around oil demand set against the backdrop of potential rate hikes.

Trading Derivatives carries a high level of risk to your capital and you should only trade with money you can afford to lose. Trading Derivatives may not be suitable for all investors, so please ensure that you fully understand the risks involved, and seek independent advice if necessary. A Product Disclosure Statement (PDS) can be obtained either from this website or on request from our offices and should be considered before entering into a transaction with us. Raw Spread accounts offer spreads from 0.0 pips with a commission charge of USD $3.50 per 100k traded. Standard account offer spreads from 1 pips with no additional commission charges. Spreads on CFD indices start at 0.4 points. The information on this site is not directed at residents in any country or jurisdiction where such distribution or use would be contrary to local law or regulation.

Geopolitical Factors and Market Dynamics

Russia’s recent embargo on most gasoline and diesel exports aims at stabilizing its domestic market. However, this decision aggravates global concerns, primarily around heating oil supplies as winter nears. Concurrently, in the U.S., the count of operational oil rigs dropped to its lowest since February 2022, standing at 507, despite the price surge, a trend highlighted in the Baker Hughes report.

Chinese Market and its Implications

China, being the top crude importer globally, wields significant influence over market sentiments. Analysts project a rejuvenation of China’s manufacturing sector this September, expecting a surge in the Purchasing Manufacturing Index. Additionally, China’s increasing oil demand, which recorded an uptick of 0.3 million barrels per day recently, further impacts global oil dynamics.

Forecast: A Delicate Balance

Oil prices face a short-term bullish forecast, with Brent predicted to hover between $90 to $100 a barrel in the coming months, concluding the year around $95, as per UBS. However, exceeding the $100 mark persistently might instigate a surge in U.S. crude supply, setting a potential bearish trend in motion. Thus, with geopolitical decisions, rate hike concerns, and major market influencers like China in the mix, the oil market sails on turbulent waters.

Technical Analysis

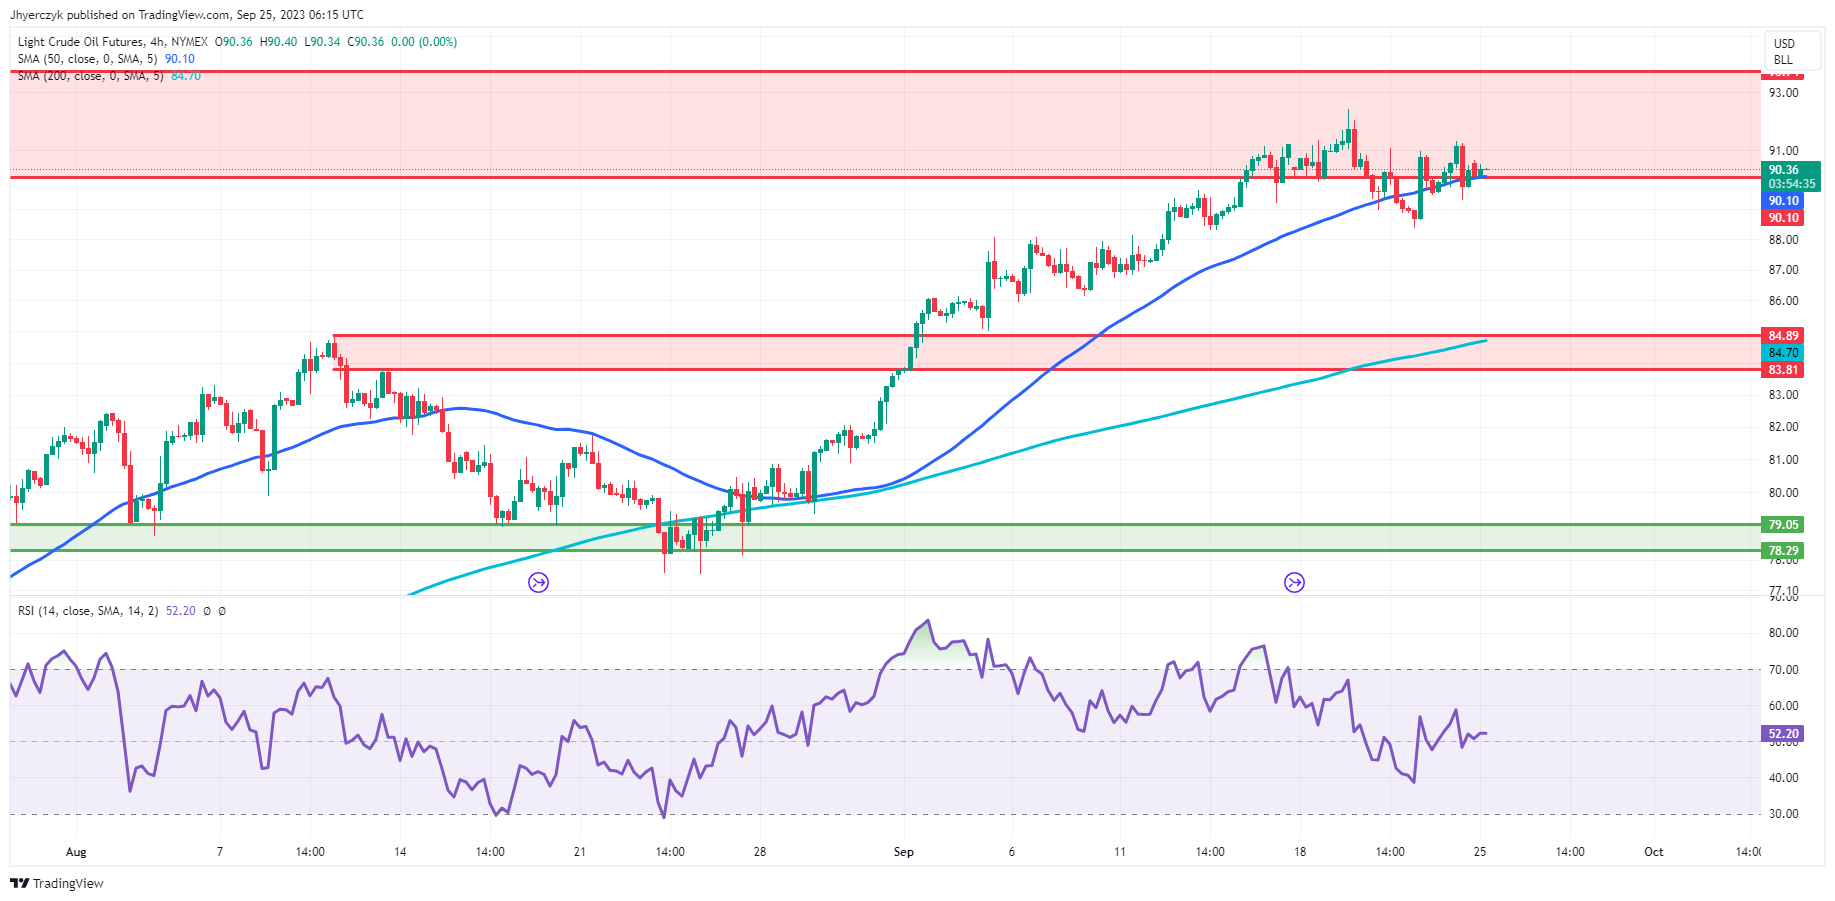
4-Hour Light Crude Oil FuturesGiven the provided data for Light Crude Oil Futures, the current 4-hour price of $90.42 is slightly above the previous 4-hour price of $90.36, indicating a marginal upward movement. This price also resides above the 200-4H moving average of $84.70 but is very close to the 50-4H moving average of $90.10, suggesting a possible consolidation or a mild bullish trend.

The 14-4H RSI is at 52.64, slightly above the neutral 50, pointing to a moderate strengthening in momentum.

The price is currently operating between the main support area of $84.89 to $83.81 and the main resistance area of $90.10 to $93.74, hovering inside the primary resistance zone, showcasing a potential for bullish behavior, but caution is warranted due to proximity to resistance levels.

DAX Index, FTSE 100, CAC 40: Navigating European Market Turbulence Amid Chinese Concerns

DAX Index, FTSE 100, CAC 40: Navigating European Market Turbulence Amid Chinese Concerns

European Markets Grapple with Chinese Uncertainties

As we approach the end of the quarter, Europe’s main stock markets, notably the DAX and STOXX, find themselves in challenging territory. A combination of fears of persistent high interest rates and troubles linked to Chinese stocks have dampened investor sentiment. Germany’s flagship DAX index has been hit with a 0.9% drop, an unwelcome sign.

Even more troubling is the indication that business confidence in Germany is eroding, marking its fifth consecutive monthly decline. This ongoing trend puts German stocks in a tough spot, as they’re underperforming this quarter with a decline of 4.5%, steeper than the broader STOXX 600’s 2.6% dip.

Trading Derivatives carries a high level of risk to your capital and you should only trade with money you can afford to lose. Trading Derivatives may not be suitable for all investors, so please ensure that you fully understand the risks involved, and seek independent advice if necessary. A Product Disclosure Statement (PDS) can be obtained either from this website or on request from our offices and should be considered before entering into a transaction with us. Raw Spread accounts offer spreads from 0.0 pips with a commission charge of USD $3.50 per 100k traded. Standard account offer spreads from 1 pips with no additional commission charges. Spreads on CFD indices start at 0.4 points. The information on this site is not directed at residents in any country or jurisdiction where such distribution or use would be contrary to local law or regulation.

Daily DAX

Breaking Down Europe’s Varied Landscape

Diving deeper into the European economic sectors, the story is multifaceted. Manufacturing firms, the heartbeat of the European industrial ecosystem, seem to be navigating the storm, albeit with caution regarding future prospects. The service sector, on the other hand, is on a downward trajectory, marking its sixth consecutive month of decline. While current business conditions present challenges, there’s an undercurrent of hope among some industry players, banking on a possible turnaround.

On another front, the construction sector paints a gloomier picture. Its outlook is notably bleak, registering its most disheartening point since January 2009. Such figures hint at potentially turbulent waters ahead.

Britain’s Shaky Financial Playground

Over in the UK, financial markets are mirroring Europe’s turbulent ride. A headline-grabber is the unexpected forecast from Entain, a heavy-hitter in the British betting domain. Their cautious outlook on online gaming revenue has seen their share prices nosedive.

To compound matters, there’s regulatory pressure building. The UK government’s ongoing discourse on reinforcing measures against problem gambling spells significant change on the horizon for the betting industry. Casting a broader net, the outlook for the UK’s principal stock indices isn’t particularly rosy. Both the premier FTSE 100 and its sibling, the FTSE 250, are down by 0.4%. This widespread decline underscores a prevailing investor anxiety about how future macroeconomic policies might squeeze their portfolios.

Daily FTSE 100

Anticipating the Future of European and UK Stocks

Combining the current dynamics, both the European and UK financial landscapes appear at a pivotal juncture. While certain sectors in Europe, particularly manufacturing, exude a sense of guarded optimism, the overarching sentiment is cautious. The UK, with its evolving regulatory framework and sector-specific challenges, faces an uncertain trajectory.

For the astute investor, reading between the lines is crucial. The ongoing developments suggest potential opportunities but also inherent risks. Both European and British markets exhibit signs of impending bearish trends. It’s a juncture that necessitates prudence, strategic decision-making, and an anticipation of the challenges that may be lurking around the corner.

EUR/USD Forecast: Will German Business Sentiment Lift the Euro?

EUR/USD Forecast: Will German Business Sentiment Lift the Euro?

Friday Overview

On Friday, the EUR/USD declined by 0.12%. Following a 0.02% loss on Thursday, the EUR/USD ended the day at $1.06452. The EUR/USD fell to a low of $1.06147 before rising to a high of $1.06717.

German Business Sentiment and ECB President Lagarde in Focus

The German Ifo Business Climate Index and sub-components for September will draw investor interest today. Economists forecast the headline Business Climate Index to fall from 85.7 to 85.0. A more marked decline would weigh on buyer appetite for the EUR/USD.

Trading Derivatives carries a high level of risk to your capital and you should only trade with money you can afford to lose. Trading Derivatives may not be suitable for all investors, so please ensure that you fully understand the risks involved, and seek independent advice if necessary. A Product Disclosure Statement (PDS) can be obtained either from this website or on request from our offices and should be considered before entering into a transaction with us. Raw Spread accounts offer spreads from 0.0 pips with a commission charge of USD $3.50 per 100k traded. Standard account offer spreads from 1 pips with no additional commission charges. Spreads on CFD indices start at 0.4 points. The information on this site is not directed at residents in any country or jurisdiction where such distribution or use would be contrary to local law or regulation.

However, economists predict a rise in the Business Expectations Index from 82.6 to 82.9. An improving outlook would offset business sentiment toward the current macroeconomic environment. Economists forecast the Business Current Assessment Index to fall from 89.0 to 88.0.

With the German services sector contributing 70% to GDP, investors should consider updates relating to the services sector. Improving services sector sentiment would support labor market conditions, consumption, and a brighter economic outlook. German private sector consumption contributes more than 50% to GDP.

On Friday, better-than-expected German private sector PMIs failed to shift sentiment toward the macroeconomic environment. Despite an unexpected jump in the services PMI from 47.3 to 49.8, the German private sector continued to contract at a marked pace.

According to the flash PMI survey, business sentiment across the private sector fell to its lowest since November 2022. While services sector sentiment remained modestly positive, manufacturers continued to feel pressure from a weak demand environment.

Beyond the numbers, ECB President Christine Lagarde and ECB Executive Board member Isabel Schnabel are on the calendar to speak. A move away from the higher-for-longer interest rate outlook would test demand for the EUR.

Chicago Fed National Activity Index in the Spotlight

The Chicago Fed National Activity Index will influence sentiment toward Fed policy goals. A pickup in activity would align with the more hawkish FOMC projections and interest rate path. Investors should look beyond the headline figure. Sub-components, including employment and personal consumption, need consideration.

Tight labor market conditions and an upward trend in consumption fuel demand-driven inflation, pressuring the Fed to push rates higher. Higher interest rates would impact labor market conditions and consumer spending power, easing demand-driven inflationary pressures.

Short-Term Forecast:

Economic and monetary policy divergence remains firmly tilted in favor of the US dollar. However, a pickup in German business sentiment would fuel hopes of a shift in the German macroeconomic environment and deliver early EUR/USD support.

EUR/USD Price Action

Daily Chart

The EUR/USD remained below the 50-day and 200-day EMAs, sending bearish price signals.

A larger-than-expected slide in German business sentiment would support a EUR/USD fall through the $1.06342 support level. A break below the $1.06342 support level would bring sub-$1.06 into play.

However, a weaker Chicago Fed National Activity Index would support a EUR/USD return to $1.07. A return to $1.07 would bring the $1.07635 resistance level into view.

The 14-period Daily RSI at 34.93 indicates a EUR/USD fall through the $1.06342 support level before entering oversold territory.

EUR/USD Daily Chart sends bearish price signals.
EURUSD 250923 Daily Chart

4-Hour Chart

The EUR/USD sits below the 50-day and 200-day EMAs, reaffirming the bearish price signals. A fall through the $1.06342 support level would give the bears a run at sub-$1.06.

However, a break above the 50-day EMA would support a EUR/USD return to $1.07. A return to $1.07 would bring the $1.07635 resistance level into view.

The 14-period 4-Hourly RSI at 44.02 indicates a EUR/USD fall through the $1.06342 support level before entering oversold territory.

4-Hourly Chart affirms bearish price signals.
EURUSD 250923 4 Hourly Chart
Silver Prices Forecast: Resilient Amid US Policy, Global Economic Pressures

Silver Prices Forecast: Resilient Amid US Policy, Global Economic Pressures

Silver’s Reaction to American Economic Dynamics

The silver market (XAG/USD) is showing signs of resilience this Monday, rising slightly despite looming uncertainties in the American economic landscape. It’s evident that the metal’s value isn’t just tethered to industrial demand but is also a barometer for wider financial currents, including those driven by key policy decisions from institutions like the U.S. Federal Reserve.

External Pressures on the Silver Market

While silver prices have been fluctuating, the shadows of potential U.S. interest rate hikes loom large. The imminent release of significant consumer inflation data adds another layer of unpredictability. Additionally, political tensions, underscored by the threat of a U.S. government shutdown, are casting their own influences on the market.

Trading Derivatives carries a high level of risk to your capital and you should only trade with money you can afford to lose. Trading Derivatives may not be suitable for all investors, so please ensure that you fully understand the risks involved, and seek independent advice if necessary. A Product Disclosure Statement (PDS) can be obtained either from this website or on request from our offices and should be considered before entering into a transaction with us. Raw Spread accounts offer spreads from 0.0 pips with a commission charge of USD $3.50 per 100k traded. Standard account offer spreads from 1 pips with no additional commission charges. Spreads on CFD indices start at 0.4 points. The information on this site is not directed at residents in any country or jurisdiction where such distribution or use would be contrary to local law or regulation.

Factors Closer to Home

Domestically, the ongoing U.S. automakers’ strike and the unresolved government fiscal year budget have traders on edge. There’s a palpable concern in the market, corroborated by the SPDR Gold Trust – the world’s premier gold-backed ETF. Its holdings have plummeted to a low not seen since January 2020, highlighting diminishing investor interest in the face of these challenges. This news may be capping gains in silver.

The Global Context

Internationally, silver’s status as a non-yielding asset is being tested by rising interest rates. This trend, signposted by recent comments from Federal Reserve officials and reinforced by the robust dollar and soaring 10-year Treasury yields, threatens silver’s upward trajectory. Furthermore, global economic indicators, such as the Bank of Japan’s commitment to ultra-low interest rates and slowdowns in European economies, play pivotal roles in shaping silver’s path.

The anticipation is palpable as investors await the Fed’s preferred inflation metric, the PCE price index. Coupled with ongoing budget discussions in Washington, it sets the stage for an atmosphere of heightened uncertainty. Drawing from current market indicators and global economic forecasts, the near-term outlook for silver appears somewhat bearish. The precious metal’s trajectory seems hemmed in by a combination of national political uncertainties and impending interest rate adjustments.

Technical Analysis

4-Hour Silver (XAG/USD)Silver’s current 4-hour price of 23.54 shows a marginal rise from its preceding 4-hour mark of 23.48. As we examine the moving averages, the current price stands above both the 50-4H and the 200-4H moving averages, indicating a potential upward momentum.

The 14-4H RSI reading of 56.04 signifies strengthening momentum, being comfortably above the neutral point.

When observing support and resistance levels, the present price resides between the main support area (22.70 to 22.28) and the main resistance area (25.00 to 25.27). In light of the mentioned indicators, the market sentiment for silver seems moderately bullish in the near term.