EUR/USD Forecast: Inflation Focus Leads to Sub-$1.04 Predictions

EUR/USD Forecast: Inflation Focus Leads to Sub-$1.04 Predictions

Wednesday Overview

On Wednesday, the EUR/USD declined by 0.66%. Following a 0.20% fall on Tuesday, the EUR/USD ended the session at $1.05022. The EUR/USD rose to a high of $1.05743 before sliding to a low of $1.04881.

The ECB and German Inflation in the Spotlight

Inflation will be the talking point today. Prelim September inflation figures for Spain and Germany will be in focus today. Barring a higher-than-expected Spanish inflation figure, the inflation numbers from Germany will likely impact the EUR/USD more.

Trading Derivatives carries a high level of risk to your capital and you should only trade with money you can afford to lose. Trading Derivatives may not be suitable for all investors, so please ensure that you fully understand the risks involved, and seek independent advice if necessary. A Product Disclosure Statement (PDS) can be obtained either from this website or on request from our offices and should be considered before entering into a transaction with us. Raw Spread accounts offer spreads from 0.0 pips with a commission charge of USD $3.50 per 100k traded. Standard account offer spreads from 1 pips with no additional commission charges. Spreads on CFD indices start at 0.4 points. The information on this site is not directed at residents in any country or jurisdiction where such distribution or use would be contrary to local law or regulation.

Economists predict a decrease in German annual inflation from 6.1% to 4.6%. Although inflation will likely stay elevated, a significant softening would reduce the need for the ECB to keep interest rates higher for longer. A potentially less hawkish policy outlook may put additional pressure on the EUR/USD.

Beyond the numbers, the ECB Economic Bulletin and ECB Executive Board member speeches also need consideration. ECB Executive Board members Andrea Enria and Elizabeth McCaul are on the calendar to speak today.

US Jobless Claims to Deliver Pre-US Jobs Report Labor Market Signals

Later today, US jobless claims will be the focal point. Investors are eying reasons for the Fed to deviate from its hawkish interest rate path. However, tight labor market conditions will likely leave the Fed on an aggressive interest rate trajectory.

Economists forecast initial jobless claims to increase from 201k to 217k. However, the markets may accept sub-220k. Lower-than-expected jobless claims would fuel hawkish Fed bets. Rate hikes weaken labor market conditions and soften wage growth. A deteriorating labor market environment would force consumers to curb spending, easing demand-driven inflationary pressures.

Q2 GDP numbers for the US are also due out. Barring a marked revision to the prelim US GDP, the finalized figure should have a limited impact on the US dollar.

Short-Term Forecast:

The talk of parity has resurfaced. Armed with a resilient US economy, a hawkish Fed may support a EUR/USD fall to sub-$1.04. However, a spike in US jobless claims may surprise investors and dampen the demand for the US dollar.

EUR/USD Price Action

Daily Chart

The EUR/USD remained below the 50-day and 200-day EMAs, sending bearish price signals. Significantly, the 50-day EMA crossed through the 200-day EMA signaling further price weakness. Negative sentiment toward the Euro area economy continues to pressure the EUR/USD.

Steady US labor market numbers and softer German inflation figures would support a EUR/USD return to $1.0450. A fall to sub-$1.0450 would support a move to the $1.03922 support level.

However, a break above the $1.05230 resistance level would give the bulls a run at $1.06.

The 14-period Daily RSI at 24.36 indicates the EUR/USD in the oversold territory. Oversold territory suggests the EUR/USD may see a price recovery in the short term.

EUR/USD Daily Chart sends bearish price signals.
EURUSD 270923 Daily Chart

4-Hour Chart

The EUR/USD sits below the 50-day and 200-day EMAs, reaffirming the bearish price signals. A break below the $1.05230 support level would give the bears a run at sub-$1.05.

However, a EUR/USD fall to sub-$1.0450 would bring the $1.03922 support level into play.

A EUR/USD break above the $1.05230 resistance level would support a move toward the 50-day EMA.

The 14-period 4-Hourly RSI at 24.92 indicates a EUR/USD in oversold territory.

4-Hourly Chart affirms bearish price signals.
EURUSD 270923 4 Hourly Chart
Silver Prices Forecast: XAG/USD Traders Eye US Economic Data, Fed Moves

Silver Prices Forecast: XAG/USD Traders Eye US Economic Data, Fed Moves

Silver’s Position in a Volatile Market

Amidst a financial landscape characterized by a robust dollar and escalating Treasury yields, silver (XAG/USD) treads cautiously, staying close to a recent two-week low. This prevailing uncertainty among investors is heightened as they anticipate key U.S. economic indicators, looking to discern the Federal Reserve’s next move concerning interest rates.

As the sheen of silver fades for the third day in a row, market murmurs point to the expectation that the Federal Reserve might uphold high interest rates. This sentiment, bolstered by upcoming U.S. inflation data, has pushed many to the dollar’s relative safety, making silver a more expensive proposition for global investors.

Trading Derivatives carries a high level of risk to your capital and you should only trade with money you can afford to lose. Trading Derivatives may not be suitable for all investors, so please ensure that you fully understand the risks involved, and seek independent advice if necessary. A Product Disclosure Statement (PDS) can be obtained either from this website or on request from our offices and should be considered before entering into a transaction with us. Raw Spread accounts offer spreads from 0.0 pips with a commission charge of USD $3.50 per 100k traded. Standard account offer spreads from 1 pips with no additional commission charges. Spreads on CFD indices start at 0.4 points. The information on this site is not directed at residents in any country or jurisdiction where such distribution or use would be contrary to local law or regulation.

With the Federal Reserve’s preferred inflation gauge, the U.S. PCE index, set to release soon, the market is abuzz with speculation. A dip in inflation could be the breather silver needs, while an uptick might tighten the noose further.

Echoing this sentiment, Minneapolis Fed’s Neel Kashkari forecasts a potential “soft landing” for the U.S. economy. Yet, the looming shadow of significant rate hikes to combat inflation remains. Amidst these challenges, the demand for physical silver remains consistent, drawing strength especially from central banks and the Chinese market.

Short-Term Outlook

With U.S. GDP growth and unemployment data on the horizon, coupled with the specter of a potential U.S. government shutdown, the market sentiment leans bearish for silver in the short term.

Technical Analysis

Daily Silver (XAG/USD)Silver’s (XAG/USD) current position against the U.S. Dollar showcases a subtle bearish sentiment in the market. Hovering slightly below both the 200-Day and 50-Day moving averages at 23.46 and 23.49 respectively, the Daily Price of 22.45 underscores a cautious downtrend.

The 14-Day RSI stands at 36.36, indicating that momentum has weakened, though it hasn’t entered the oversold territory yet.

As the current price edges perilously close to the main support level of 22.46, any further downward movement might test this threshold. While trend line support is set at 22.34, bearish traders eye this level for possible weakness and the start of an acceleration to the downside.

Gold Prices Forecast: XAU/USD’s Struggles Against Dollar and Fed Decisions

Gold Prices Forecast: XAU/USD’s Struggles Against Dollar and Fed Decisions

Gold’s Dilemma Amid Rising U.S. Rates

Gold (XAU/USD), having steadied after a significant drop, continues to hover near its six-month low early Wednesday. The root causes? A stronger dollar and the current trajectory of Treasury yields. Investors keenly await U.S. economic figures, hoping for insights into the Federal Reserve’s interest rate decisions.

Decline in Gold’s Appeal

Gold’s allure has diminished for three consecutive sessions. The primary culprit: speculations that the Federal Reserve may sustain elevated interest rates. Such speculations were further fueled by expectations surrounding U.S. inflation data. Consequently, investors, seeking refuge, have turned to the dollar, making gold pricier for international buyers.

Trading Derivatives carries a high level of risk to your capital and you should only trade with money you can afford to lose. Trading Derivatives may not be suitable for all investors, so please ensure that you fully understand the risks involved, and seek independent advice if necessary. A Product Disclosure Statement (PDS) can be obtained either from this website or on request from our offices and should be considered before entering into a transaction with us. Raw Spread accounts offer spreads from 0.0 pips with a commission charge of USD $3.50 per 100k traded. Standard account offer spreads from 1 pips with no additional commission charges. Spreads on CFD indices start at 0.4 points. The information on this site is not directed at residents in any country or jurisdiction where such distribution or use would be contrary to local law or regulation.

Inflation and U.S. Rates

The upcoming release of the U.S. personal consumption expenditures (PCE) index, a key inflation metric for the Federal Reserve, is highly anticipated. An inflation drop might bring respite to gold, potentially curbing expectations of tighter monetary policy. On the contrary, stronger inflation data could exacerbate gold’s challenges.

Federal Reserve’s Stance

Minneapolis Fed President, Neel Kashkari, hinted at the likelihood of a “soft landing” for the U.S. economy, but also raised the prospect of significant rate hikes to combat inflation. Despite these challenges, gold finds solace in steady physical demand, notably from central banks and China.

Market Watch and Outlook

The market’s gaze is fixed on imminent U.S. GDP growth figures and jobless claims. However, looming shadows of a potential U.S. government shutdown, and concerns about interest rates, hint at a bearish short-term sentiment for gold.

Technical Analysis

Daily Gold (XAU/USD)Gold Spot/U.S. Dollar currently trades at 1874.655, below both the 200-Day and 50-Day moving averages, indicating a bearish trend.

The 14-Day RSI stands at 30.16, signifying an oversold market condition, suggesting a potential reversal or a pullback in the near term.

Meanwhile, the market is trading below the defined trend line support at 1911.45 and under previous support levels at 1901.240 and 1889.369. Considering these factors, the sentiment appears predominantly bearish for Gold Spot/U.S. Dollar.

Spain’s September CPI Hits Forecasted 3.5%

Spain’s September CPI Hits Forecasted 3.5%

Spain’s Inflationary Surge: September’s CPI Flash Report Revealed

Spain, in the throes of economic transitions, has just witnessed an inflationary uptick in September 2023. The recent flash report by the NSI unveils that the Consumer Price Index (CPI) reached an annual rate of 3.5%, aligning precisely with economists’ projections.

Diving Deeper into the Details

Spain’s economy, having previously reported a 2.6% inflation rate, saw a notable climb this September. The ascension can primarily be attributed to the soaring electricity costs, which made a distinct departure from last September’s falling prices. Moreover, while not as impactful but still significant, fuel prices took an upward trajectory, juxtaposed with their decline from the previous year.

Underlying Inflation: A Contrary Tale

While the broader picture showcases heightened inflation, a nuanced look at the underlying inflation tells a slightly different story. This particular metric, which conveniently filters out the volatile components like nonprocessed food and energy products, witnessed a slight contraction, positioning itself at 5.8%.

Harmonized Approach to Inflation

Supplementing this data, Spain’s Harmonized Consumer Price Index (HCPI) indicates an annual rate of 3.2% for September.

Implications and Outlook

Given this recent data, Spain’s economy is on the radar of many market watchers. The alignment of the CPI with economists’ expectations underscores the reliability of market predictions, yet the discernible changes in key sectors, notably electricity and fuel, hint at potential challenges ahead. Whether these trends will stabilize or trigger broader economic shifts remains a focal point for the coming months.

Crude Oil Prices Soar, Mostly Sealing the Fate of a Fourth Monthly Gain. Where to?

Crude Oil Prices Soar, Mostly Sealing the Fate of a Fourth Monthly Gain. Where to?

Crude oil prices rocketed higher on Wednesday, soaring 3.6 percent in the most aggressive day since early June. The commodity is on course for a 4th consecutive monthly gain. Meanwhile, retail traders continue increasing bearish exposure. This can be seen by looking at IG Client Sentiment, which tends to function as a contrarian indicator. Will this spell further gains for oil?

Crude Oil Sentiment Outlook – Bullish

According to IGCS, only about 30% of retail traders are net-long crude oil. Since the majority are biased to the downside, this continues to hint that prices may rise down the road. Meanwhile, upside bets have decreased by 10.3% and 16.32% compared to yesterday and last week, respectively. With that in mind, overall exposure and recent changes offer a stronger bullish contrarian trading outlook.

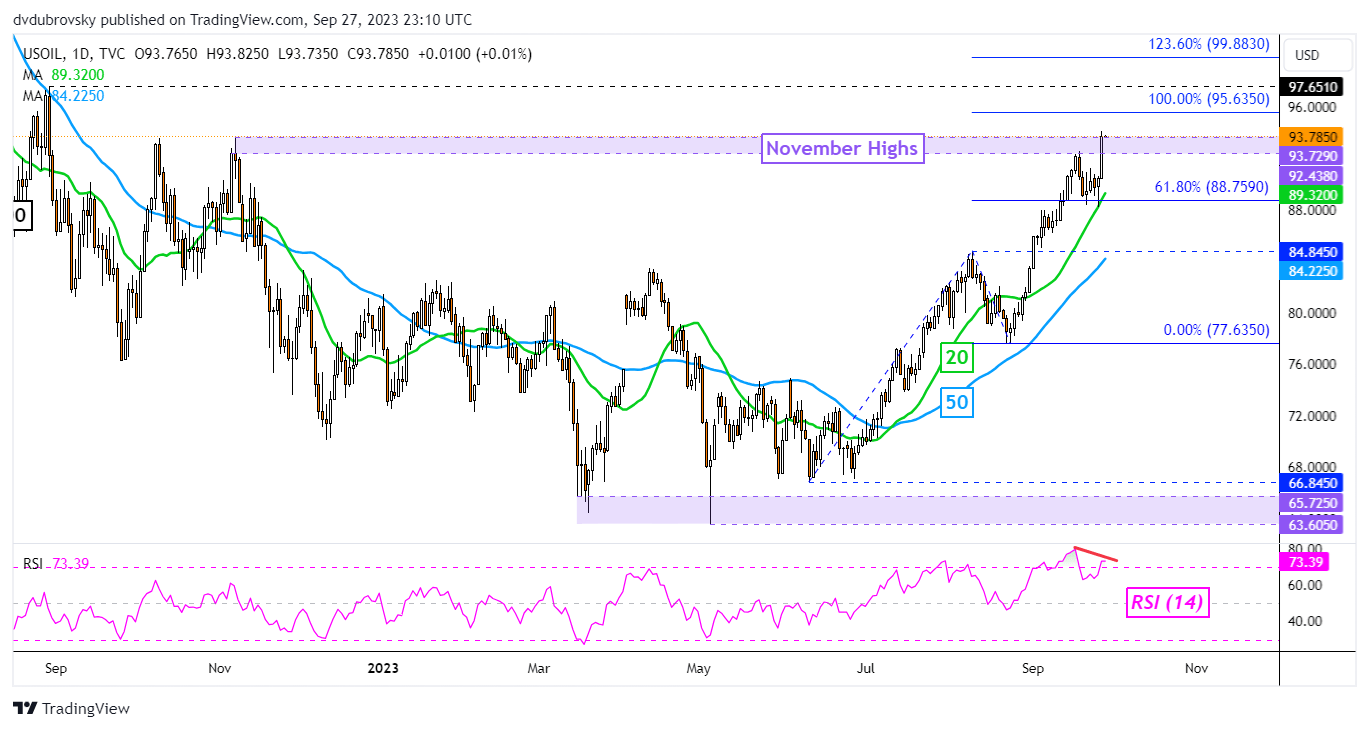
On the daily chart below, WTI has just barely closed above the 93.72 – 92.43 resistance zone from highs seen in November. That has opened the door to extending the uptrend since earlier this year, exposing the 100% Fibonacci extension level at 95.63. Just beyond that is the August 2022 high of 97.65, which may hold as key resistance.

But, note that there is a negative RSI divergence showing that upside momentum is fading. In the event of a turn lower, dropping through the 93.72 – 92.43 former resistance zone places the focus on the 20-day Moving Average. Just below that is the 61.8% extension at 88.75.

Crude Oil Daily Chart

Crude Oil Daily Chart


Asia Day Ahead: Nikkei at Near-Term Support, Brent Crude Eyeing September High

Asia Day Ahead: Nikkei at Near-Term Support, Brent Crude Eyeing September High

Wall Street managed to stabilise overnight from its recent sell-off, despite another climb in Treasury yields and a pull-ahead in the US dollar (+0.4%). The US 10-year yields were up another 5 basis-point (bp) to reach above 4.60%, with the yield curve presenting a prolonged bear steepening trade as market participants buy into the narrative that high interest rates will linger for longer. Perhaps one to watch over the medium term is an eventual un-inversion of the 10 year/2 year Treasury yield spread, which tends to precede a recession on the past four occasions.

Ahead, the final reading for US 2Q GDP will be on watch. Given that the data may be backward looking, reaction to the data may be short-lived, barring any significant deviation from the initial read. Current expectations are looking for a slight uptick in the GDP growth rate to 2.1% from previous 2%.

The key focus may instead revolve around any clues on US monetary policy outlook from Fed Chair Jerome Powell’s speech. Given the lack of key economic data from the recent Federal Open Market Committee (FOMC) meeting till now, he may likely stick to his original Federal Reserve (Fed) meeting script and leave the door open for additional hike, albeit still very much dependent on upcoming data.

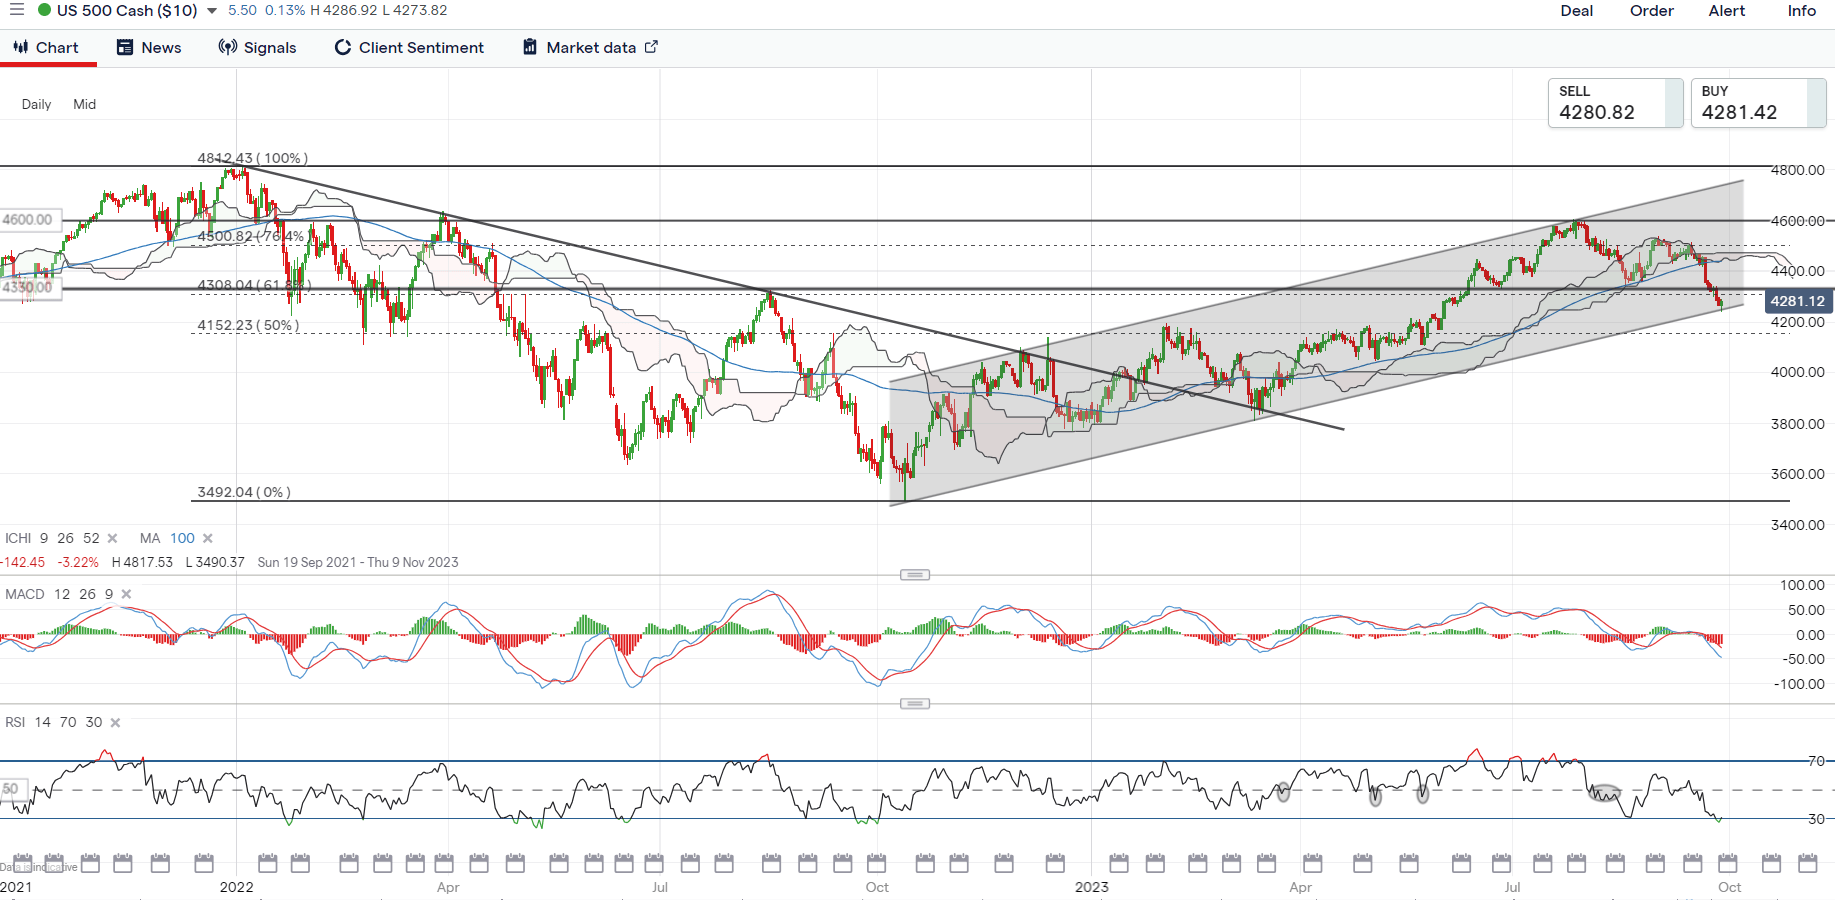
The S&P 500 is currently back to retest the lower trendline of an ascending channel pattern in place since October 2022, providing a moment of reckoning for buyers. Its weekly Relative Strength Index (RSI) is also back at the key 50 level – a midline that may determine the broader trend ahead. Any failure to defend the lower channel trendline support may pave the way to retest the 4,150 level next.

image1.png

Asia Open

Asian stocks look set for a mixed open, with Nikkei -0.70% and ASX +0.24% at the time of writing. Korean markets are closed for Mid-Autumn Festival today and tomorrow. The relatively quiet economic calendar today may lead sentiments on a more subdued tone, while reservations on risk-taking may continue to revolve around developments on China’s property sector. Suspension of trading in China Evergrande’s shares and its chairman placed under police surveillance further reinforces the odds of liquidation, while a bailout from authorities remains unlikely, given their series of more indirect measures to support the property sector.

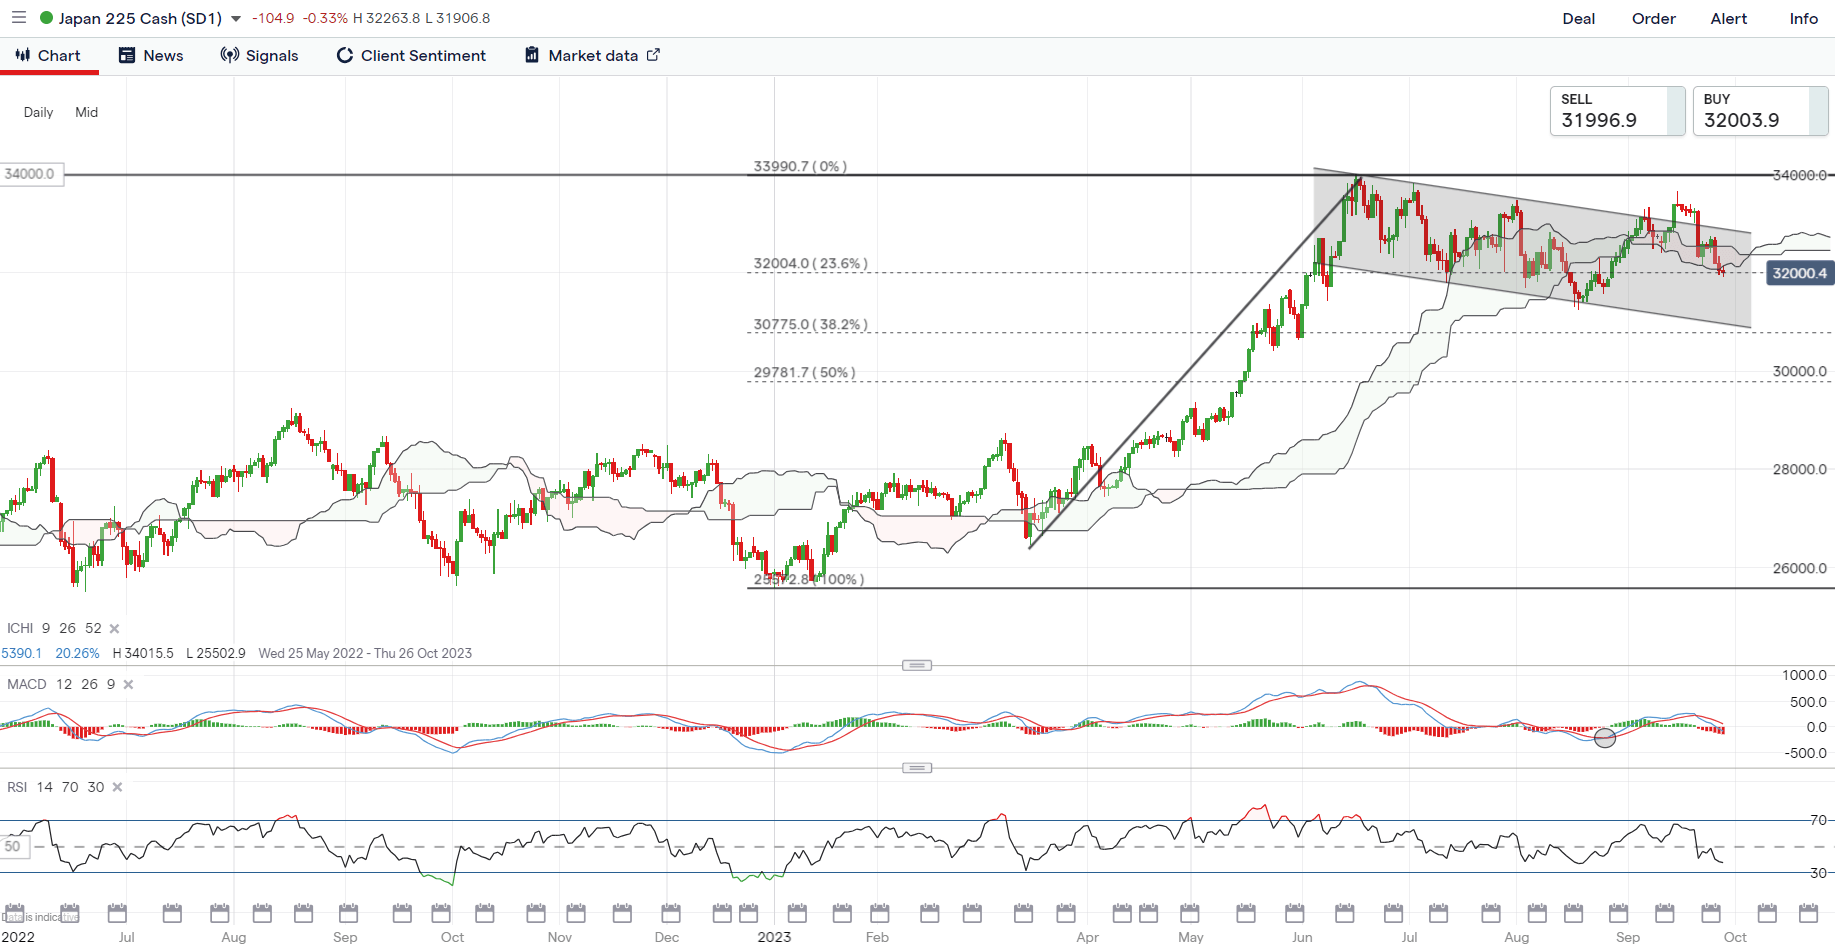
Perhaps one to watch may be the Nikkei 225 index, which is struggling to defend the lower edge of its Ichimoku cloud on the daily chart at the 32,000 level. This level also coincides with a 23.6% Fibonacci level of retracement, with any failure to hold potentially paving the way to retest the 30,800 level next, where the lower channel trendline support resides. Near-term upward momentum still remains weak for now, with its daily Moving Average Convergence/Divergence (MACD) looking to cross below the zero line.

image2.png

On the watchlist: Brent crude prices eyeing for a retest of its recent high

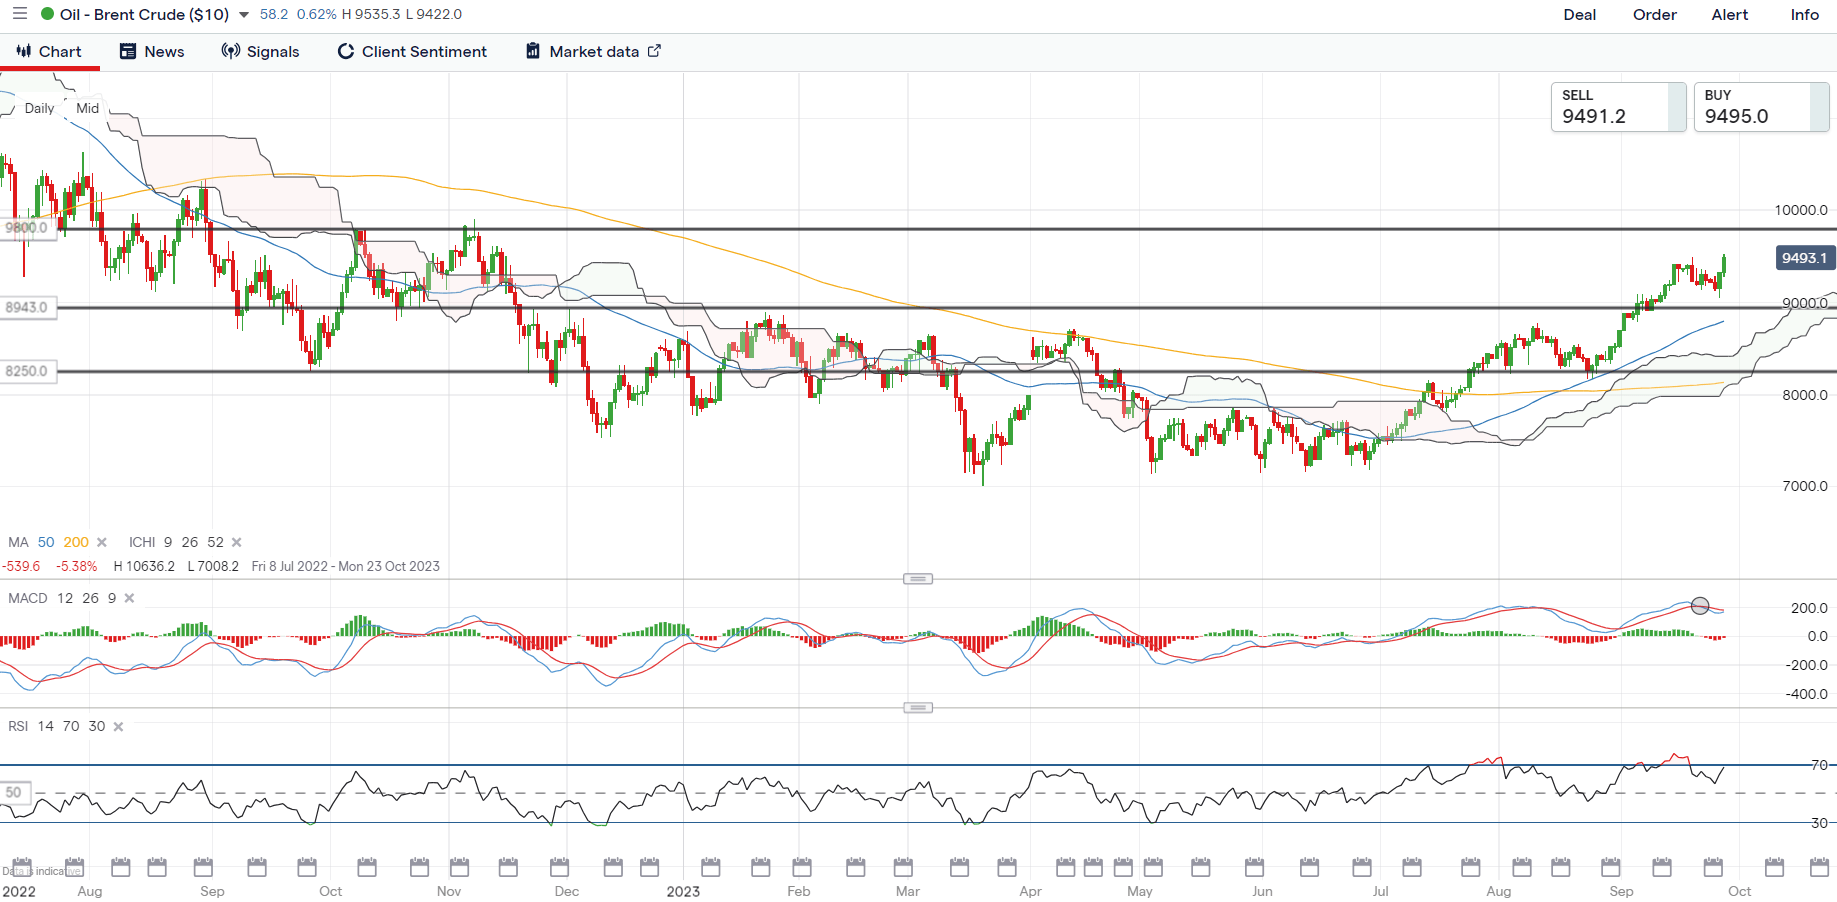
Recent retracement in Brent crude prices has proved to be short-lived as prices were up more than 3% over the past two trading days, seemingly eyeing for a retest of its recent September high at the US$95.00 level. Another week of significant drawdown in US crude oil inventories overnight continues to reinforce the trend of tighter supplies (-2.17 million vs -0.32 million expected) since August this year, which far overrides worries about China’s growth conditions and a stronger US dollar.

Ahead, one to watch if the September top may be overcome to form a new higher high and reinforce the prevailing upward trend since June this year. Its weekly MACD has crossed above the zero line as an indication of positive momentum in place, while its RSI above 50 also leaves buyers in control for now. Further upside may leave the US$98.00 level on watch as the next point of resistance to overcome.

image3.png


How Much More Upside in US Dollar? EUR/USD, GBP/USD, AUD/USD, USD/JPY

How Much More Upside in US Dollar? EUR/USD, GBP/USD, AUD/USD, USD/JPY

The US dollar has broken key resistance levels against some of its peers as higher-for-longer rates view solidifies after the US Federal Reserve last week signaled one more rate hike before the end of the year and fewer rate cuts than previously indicated. For a more detailed discussion, see “US Dollar Gets a Boost from Optimistic Fed; EUR/USD, GBP/USD, AUD/USD,” published September 21.

EUR/USD Weekly Chart

image1.png

EUR/USD: Tests major support

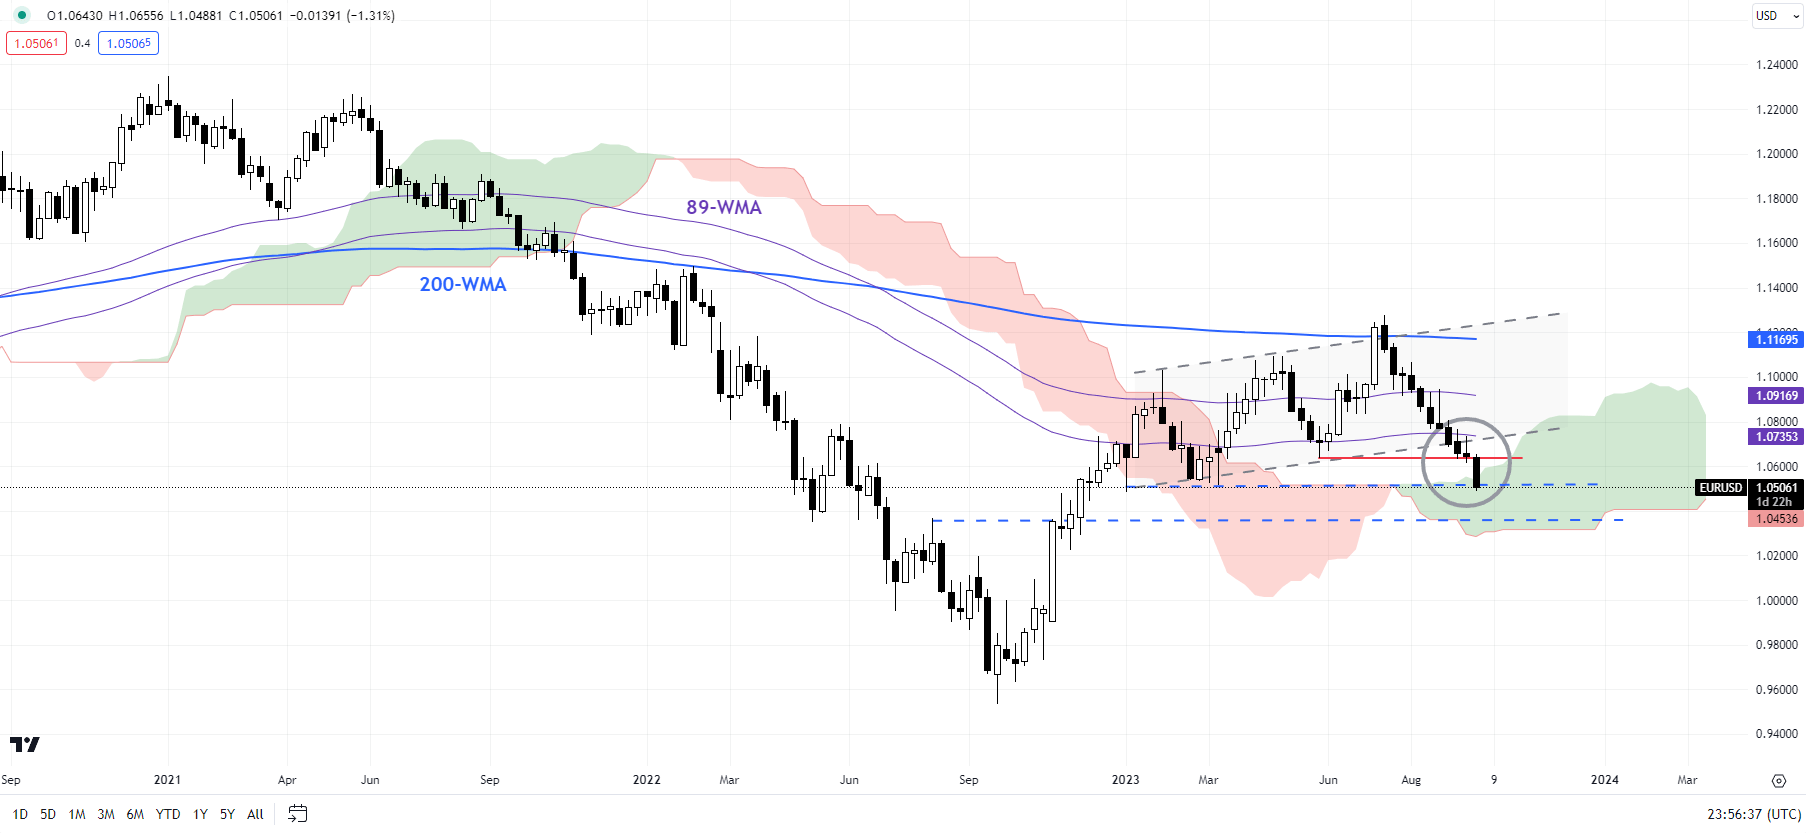
EUR/USD’s break last week below the upper edge of a rising channel from early 2023, coinciding with the May low of 1.0630, confirms the medium-term upward pressure has faded. The pair is now testing the January low of 1.0480 – a break below would pose a serious threat to the medium-term uptrend that started late last year. Subsequent support is on the lower edge of the Ichimoku cloud on the weekly chart (now at about 1.0300). On the upside, EUR/USD needs to break above the September 20 high of 1.0735 at minimum for the immediate downside risks to dissipate.For a discussion on fundamentals, see “Euro Could Be Due for a Minor Bounce: EUR/USD, EUR/JPY, EUR/GBP, Price Setups,” published September 19.

GBP/USD Weekly Chart

image2.png

GBPUSD: Bearish bias intact

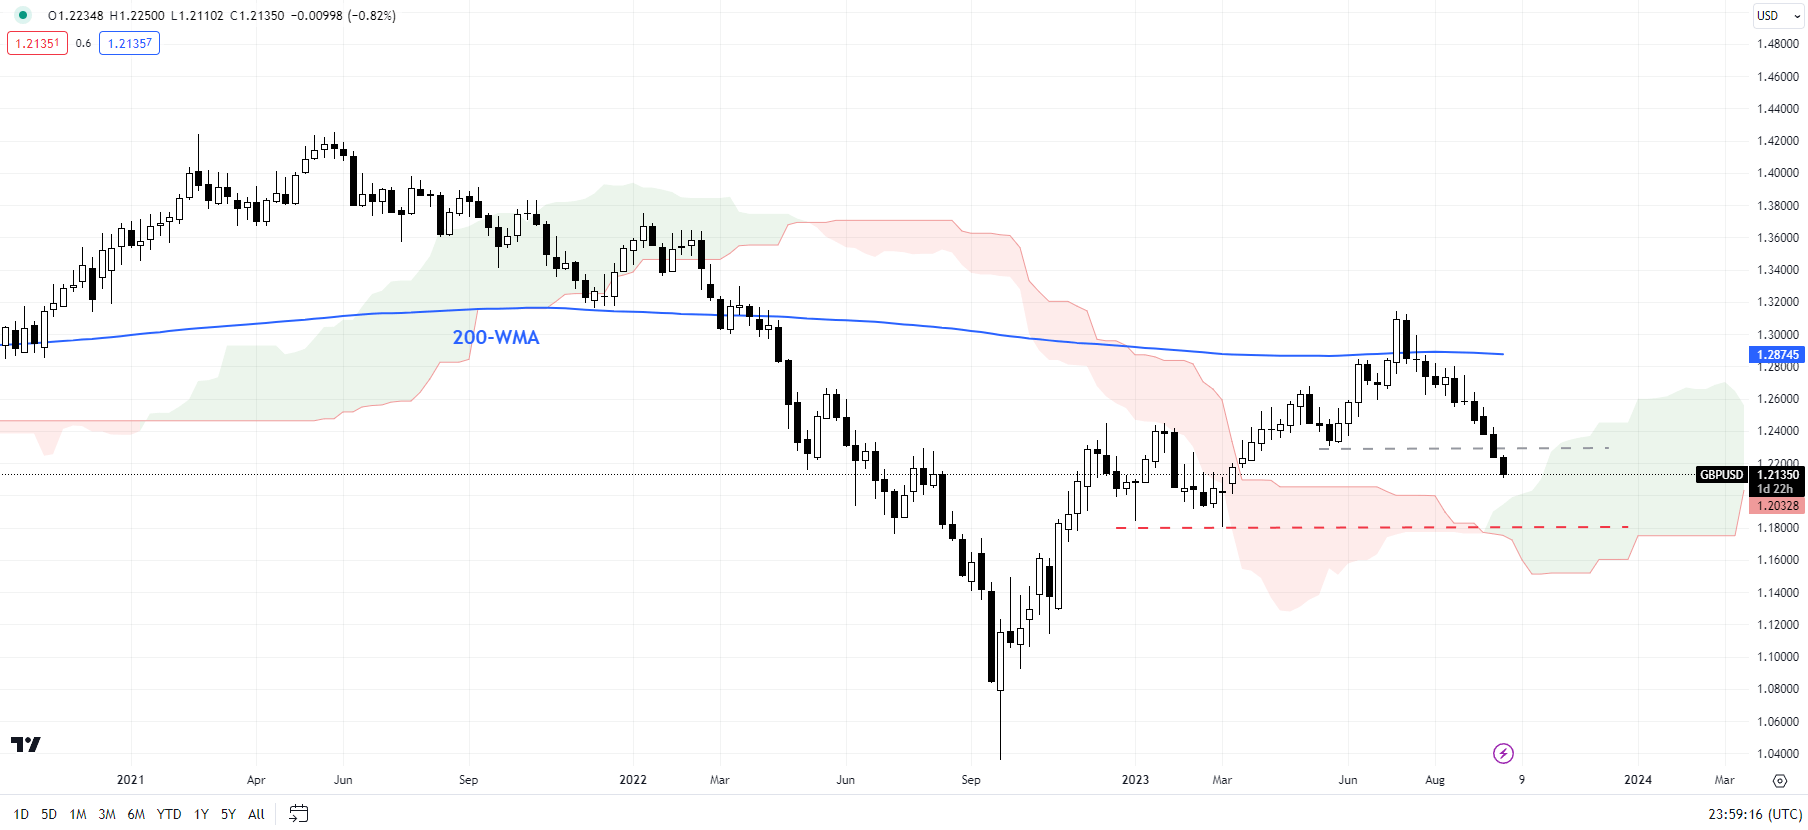
GBP/USD has fallen under a vital floor at the May low of 1.2300, temporarily disrupting the higher-low-higher-high sequence since late 2022. The retreat in July from the 200-week moving average and the subsequent sharp decline raises the odds that the retracement is the correction of the rally that started a year ago. For more discussion, see “Pound’s Resilience Masks Broader Fatigue: GBP/USD, EUR/GBP, GBP/JPY Setups,” published August 23. The next significant support is at the March low of 1.1800. A fall below 1.1600-1.1800 would pose a risk to the broader recovery that started in 2022.

AUD/USD Weekly Chart

image3.png

AUD/USD: Retests the lower end of the recent range

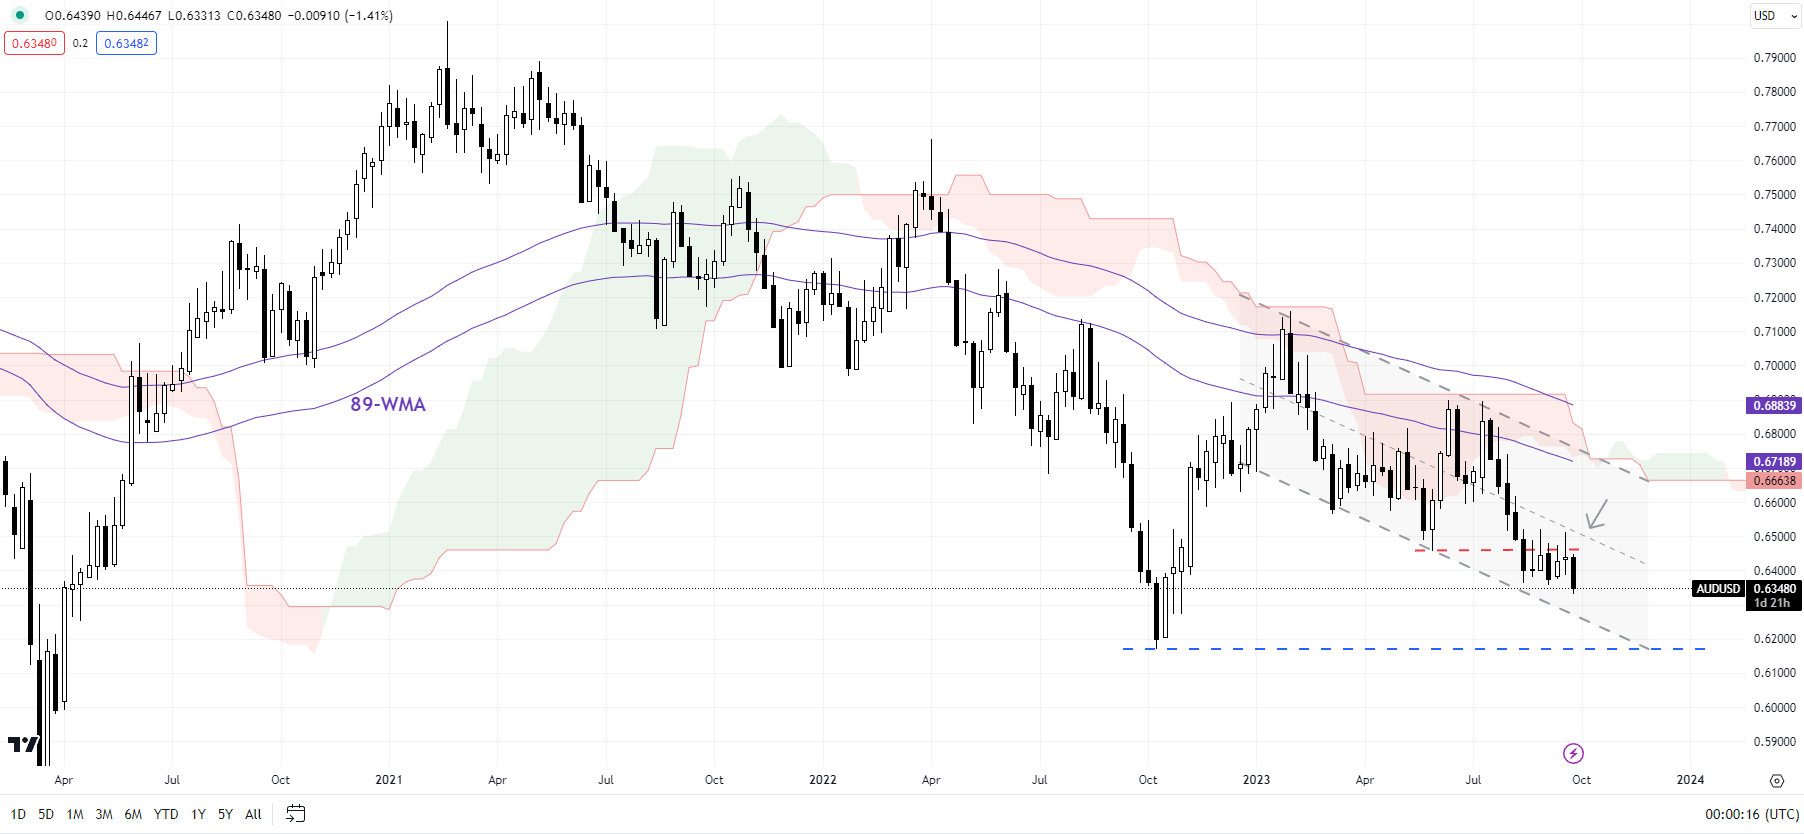
AUD/USD is attempting to break below the lower end of the recent range at 0.6350. This follows a retreat from fairly strong converged resistance at the August high of 0.6525, coinciding with the upper edge of a rising channel since early September. Any break below 0.6350 could expose downside risks toward the November 2022 low of 0.6270. Below that the next support is at the October low of 0.6170.

USD/JPY Weekly Chart

image4.png

USD/JPY: Psychological barrier at 150

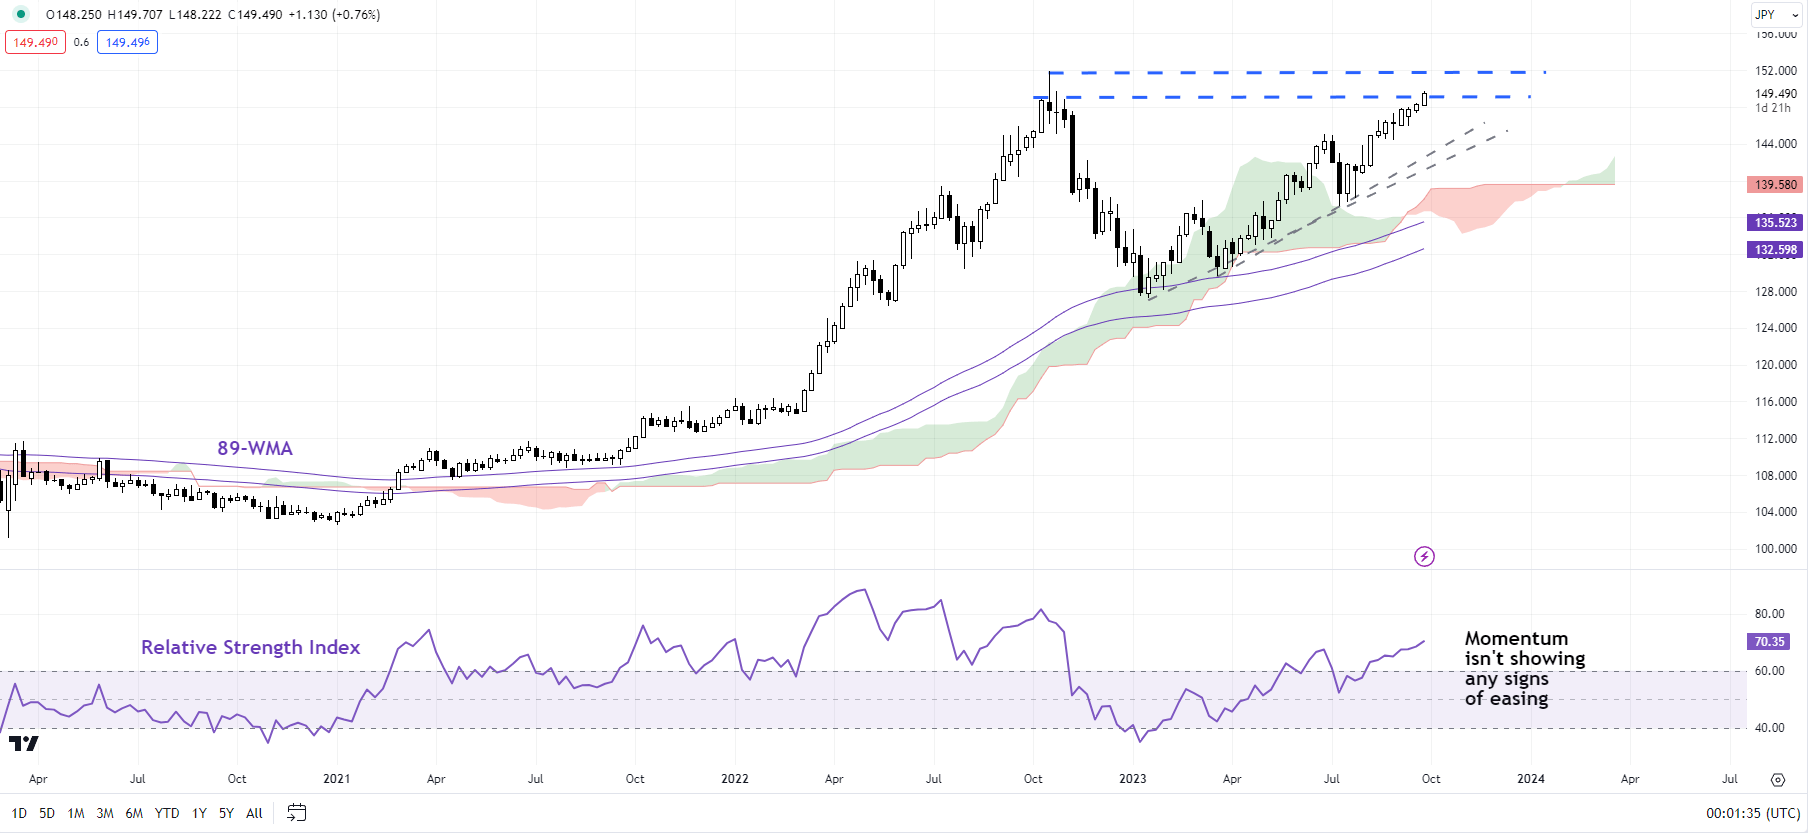
USD/JPY is approaching the psychological barrier at 150, not too far from the 2022 high of 152.00. There is no sign of reversal of the uptrend, while momentum on the weekly charts isn’t showing any signs of fatigue. This suggests the pair could give a shot at 152.00. For the immediate upward pressure to begin easing, USD/JPY would need to fall below the early-September high of 147.75. Above 152.00, the next level to watch would be the 1990 high of 160.35. For more discussion, see “Japanese Yen After BOJ: What Has Changed in USD/JPY, EUR/JPY, AUD/JPY?” published September 25.

Euro Technical Update: EUR/USD Eyes Worst Week Since May, EUR/GBP Rejects Resistance

Euro Technical Update: EUR/USD Eyes Worst Week Since May, EUR/GBP Rejects Resistance

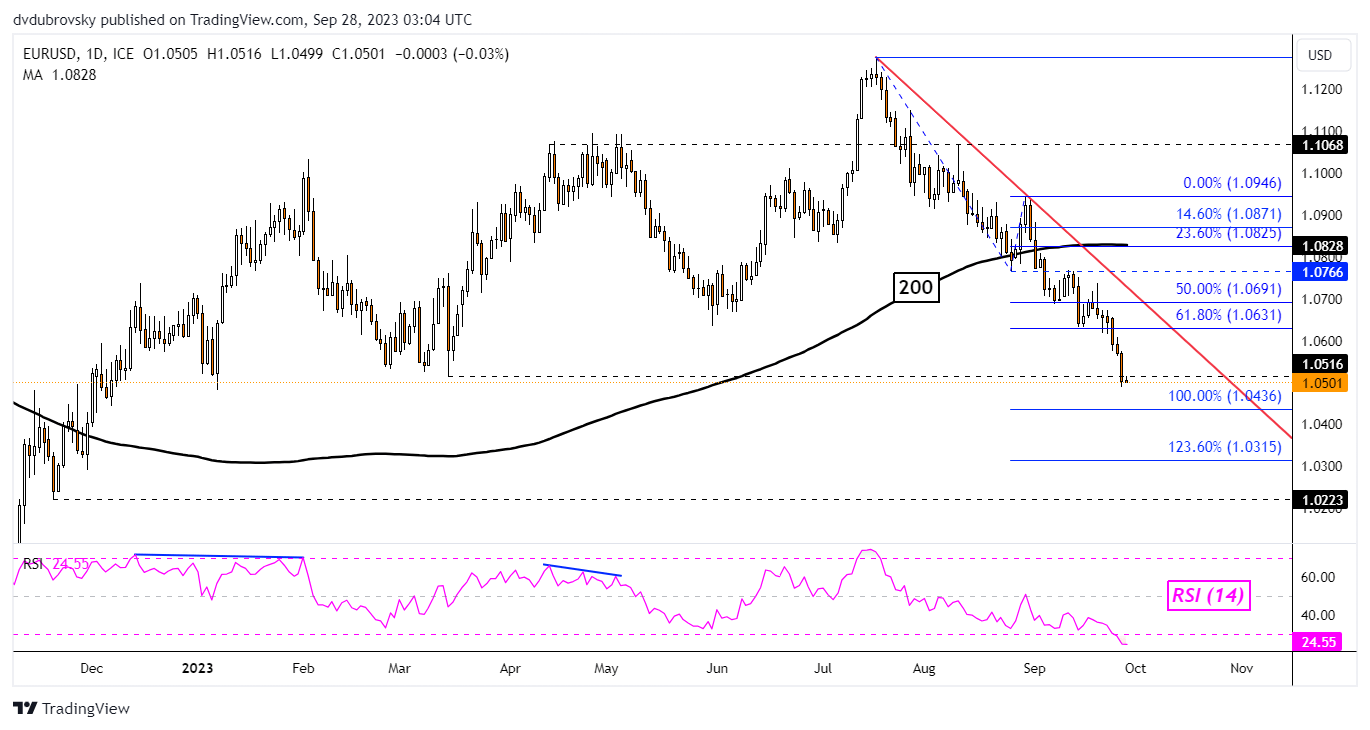
The Euro extended its losing streak against the US Dollar on Wednesday, with EUR/USD sinking 0.6 percent. At -1.3%, the single currency is also on course for the worst weekly performance since early May. How is the near-term technical landscape shaping up?

Over the past 24 hours, prices closed under the March low of 1.0516, exposing immediate support as the 100% Fibonacci extension at 1.0436 on the daily chart below. Further losses would subsequently place the focus on the 123.6% level of 1.0315.

Meanwhile, in the event of a turn higher, keep a close eye on the falling trendline from July. This could hold as resistance, reinstating the broader downside focus. But, getting their entails also facing the 61.8% level at 1.0631.

image1.png

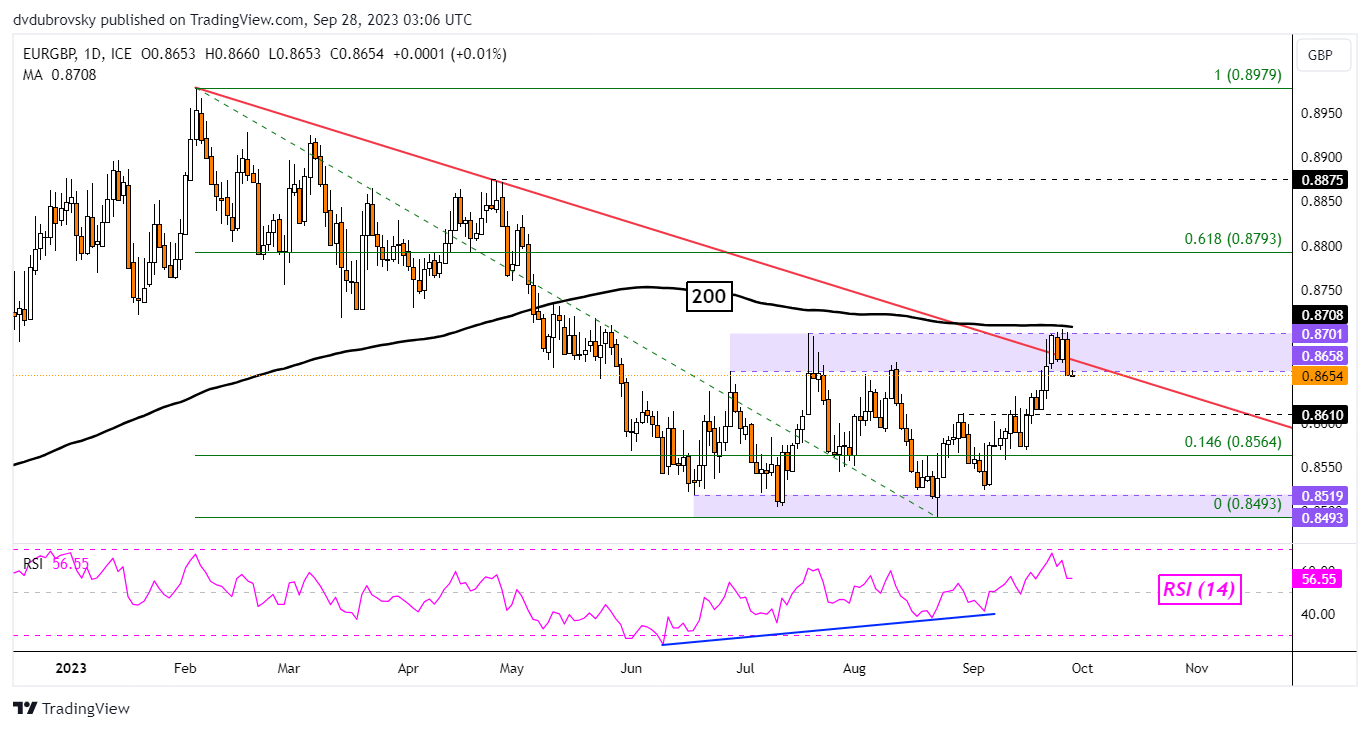
Meanwhile, the Euro might be readying to weaken against the British Pound. On the daily chart below, EUR/GBP appears to be rejecting the 0.8658 – 0.8701 resistance zone, opening the door to falling back to the familiar 0.8493 – 0.8519 support range. Broadly, the exchange rate has been consolidating between these two areas in directionless trade.

This also follows a hold and rejection of the 200-day Moving Average. Confirming a push lower places the focus on immediate support which is the 0.861 inflection point. At the same time, the falling trendline from February appears to be holding. Otherwise, breaking above the zone of resistance would introduce a bullish posture, exposing the 61.8% Fibonacci retracement level at 0.8493.

image2.png


Australian Dollar Fundamental Bias Breakdown: What Matters the Most for AUD/USD?

Australian Dollar Fundamental Bias Breakdown: What Matters the Most for AUD/USD?

Like other exchange rates, AUD/USD can be influenced by the difference in relative monetary policy, which in this case is between the RBA and the Fed. But that alone is one of the many ingredients that drive the direction of the Aussie. Financial markets are constantly adapting to changing economic environments. That also means the importance of what impacts the Australian Dollar changes over time.

For example, another ingredient that influences AUD/USD is financial market sentiment. That is because Australia finds itself sitting at the front end of the global supply chain, or in other words, the world business cycle. That is why you will often see the exchange rate being influenced by stock markets, especially those related to Emerging Markets.

China is Australia’s largest trading partner, and the latter heavily exports commodities to the former. That also means that understanding the dynamics of commodity prices is another factor that determines Australian Dollar direction. This means three vital ingredients are impacting the exchange rate: relative monetary policy, market sentiment and commodity prices.

With that in mind, this is a special report that focuses on trying to understand how the influence of these variables on the Australian Dollar changed from 2006 up until the middle of 2023. The purpose of the study will be to demonstrate why it is important to adapt fundamental analysis to constantly changing environments. With that in mind, let us cover how this was performed.

How the Study Was Conducted

Rolling regression modeling over a 36-month window in steps was used on the following variables (all of which were expressed in month-over-month form): AUD/USD, the spread between Australian and United States 2-year government bond yields, the MSCI Emerging Markets Index (EEM) and the Bloomberg Commodities Index (BCOM). Doing this created explanatory coefficients that changed in influence over time. It should also be noted that to gauge underlying relationships, a few data outliers were removed. If you are interested, a full analysis of how this was performed was outlined in a Twitter thread.

How Has RBA & Fed Policy Divergence Been Influencing AUD/USD?

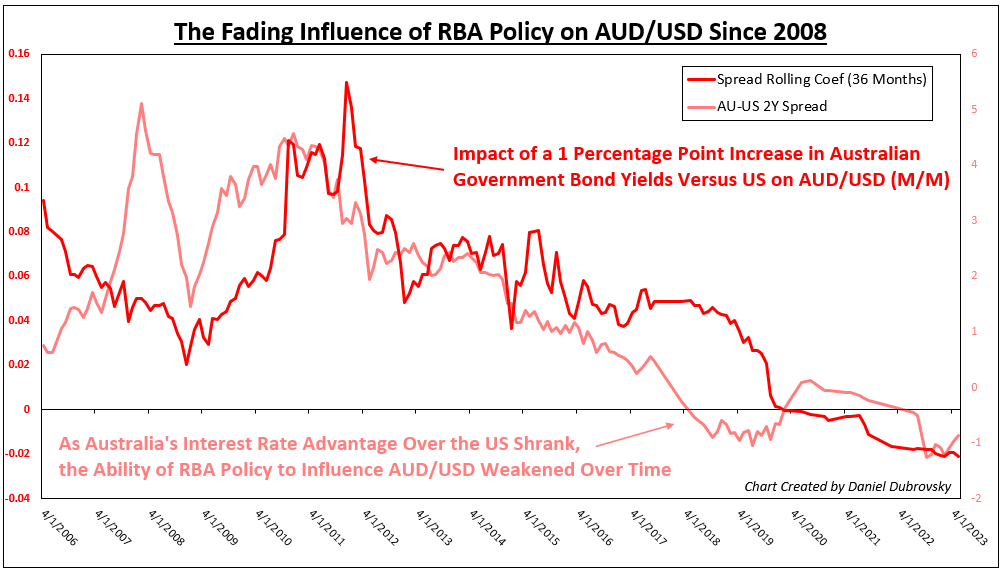
We will start with the importance of relative monetary policy. The dark red line on the chart below is the rolling bond yield spread coefficient and how it changed over time. When this line is rising above 0, that means a 1 percentage point improvement in 2-year bond yield returns in Australia relative to the United States produced an increasingly more positive reaction from AUD/USD (m/m), controlling for EEM and BCOM.

In other words, increasingly higher interest rates in Australia relative to the United States typically means stronger Aussie appreciation. What you may notice is that the dark red line has been falling steadily since 2011 and turned slightly negative around the time of 2020. When the dark red line is at 0, that means there is practically no relationship between AU-US bond yield spreads and AUD/USD.

So, what happened to this relationship? The yield advantage that Australia once had relative to the United States slowly evaporated after the 2008 Financial Crisis (light red line), turning negative heading into Covid and remaining mostly thereafter. In other words, interest rates in the US became higher than in Australia. As this happened, the ability of RBA monetary policy to influence AUD/USD (through setting interest rates) weakened significantly and remained so in the few years after Covid.

How Has RBA & Fed Policy Divergence Been Influencing AUD/USD?

How Has Emerging Market Sentiment Been Impacting AUD/USD?

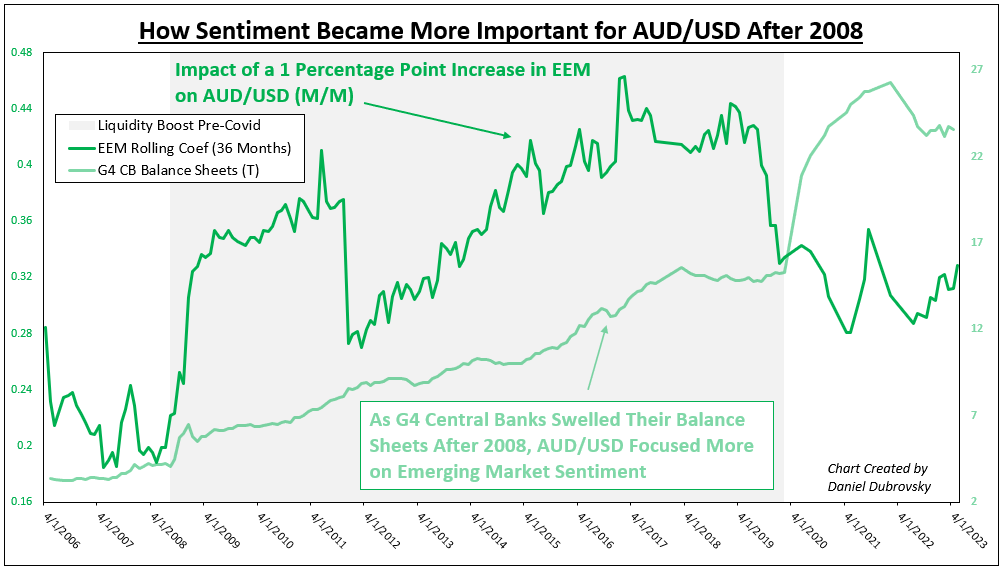
While RBA policy became an increasingly poorer predictor of AUD/USD, Emerging Market sentiment became more important. The dark green line on the chart below is the rolling EEM coefficient. When this line is rising above 0, a 1 percentage point boost in monthly Emerging Market performance shows increasingly better returns in AUD/USD (m/m), controlling for bond yield spreads and BCOM.

I have overlaid this with G4 central bank balance sheet assets. What you can see is that as major central banks injected liquidity into the financial system after the 2008 recession, sentiment became an increasingly better predictor of the Aussie exchange rate. But, you might notice that the dark green line peaked just before Covid and stayed lower thereafter despite the surge in asset holdings.

That would speak to less influence from market sentiment driving AUD/USD in the post-Covid era (although the relationship remained positive). Let us take a closer look at why this happened.

How Has Emerging Market Sentiment Been Impacting AUD/USD?

What About Commodity Prices?

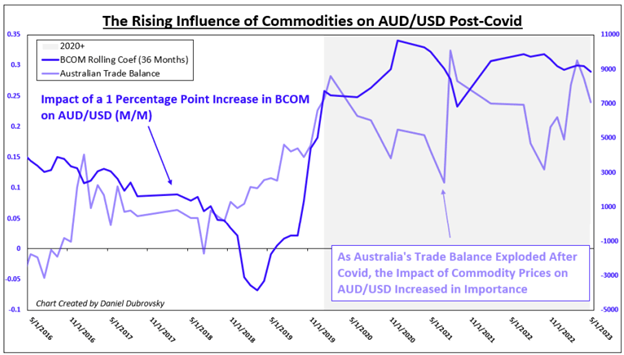
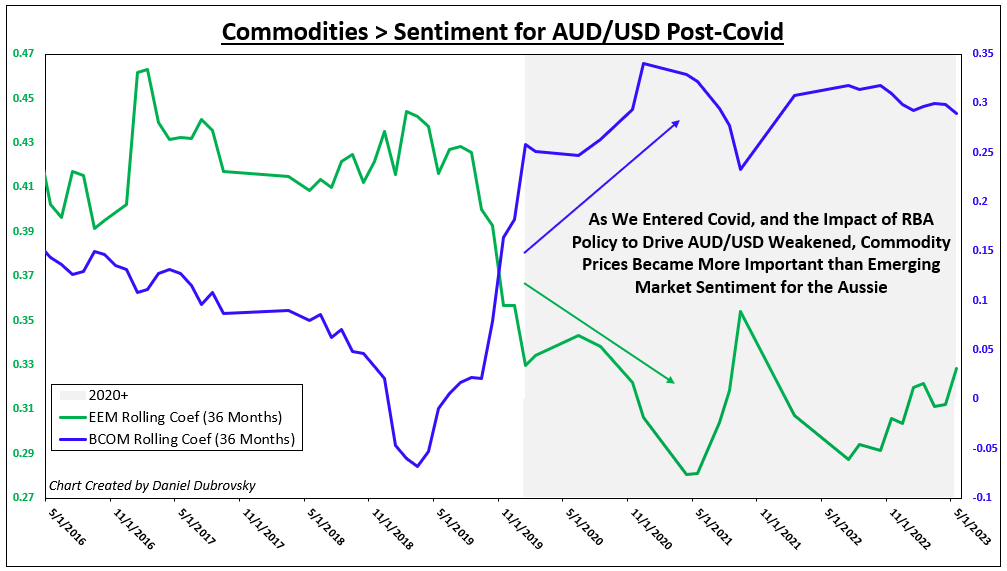
The dark blue line on the chart below is the rolling BCOM coefficient, zoomed in on just 2016+. When this line is rising increasingly above 0, a 1 percentage point boost in the BCOM Index tends to elicit a stronger positive effect on AUD/USD (m/m), controlling for bond yield spreads and EEM. What is very interesting is that the dark blue line surged higher heading into Covid and remained elevated thereafter.

This is as Australia’s trade balance exploded during Covid, meaning the value of the nation’s exports became significantly larger than its imports. In other words, as commodity prices surged, benefiting Australia, AUD/USD paid more attention to the BCOM Index and less so to EEM and AU-US bond yield spreads.

What About Commodity Prices?

A Closer Look at Post-Covid

The last chart below plots the EEM and BCOM coefficients zoomed in on 2016+. The reason this was performed is to visualize the evolution of AUD/USD underlying fundamental dynamics during Covid. Specifically, you can see how entering the pandemic, commodities became a more important factor than Emerging Market sentiment for driving the Aussie exchange rate. This was likely due to the significance of how global trading and surging prices impacted Australia’s economy, and thus the exchange rate.

A Closer Look at Post-Covid

Conclusion and Study Limitations

While it is generally correct that monetary policy is a key driver of exchange rates, the truth is each currency behaves differently because of the unique traits of various economies. For the Australian Dollar, sentiment and commodity prices are other key factors that are involved in this equation.

On top of this, fundamental conditions change, and the influence of certain variables is no different. What this study has demonstrated is that for the Australian Dollar, RBA policy direction became an increasingly poorer predictor of the exchange rate in the aftermath of the 2008 financial crisis.

Instead, factors like market sentiment and commodity prices become better predictors of the exchange rate as underlying fundamental conditions evolved heading into Covid. Perhaps this could reverse course in the future, such as in a scenario where interest rates in Australia begin far outpacing those in the US.

It should be noted that this kind of modeling with rolling regressions creates many outputs, 180 to be exact in this sample. That is 180 different regressions that could each have their quirks or issues, such as creating a coefficient that is not statistically significant.

This was not considered. Instead, a general comprehensive regression of the entire dataset was thoroughly analyzed for potential issues. This included testing for correlation between control variables, residual normality, residual autocorrelation and heteroskedasticity. No major faults were identified.

Oil Prices Forecast: Inventory Tightness Meets Global Economic Clouds

Oil Prices Forecast: Inventory Tightness Meets Global Economic Clouds

Global Oil Prices Stumble Amid Economic Concerns

As central banks signal a potential extended period of higher interest rates, oil prices are facing downward pressures. Despite anticipated supply constraints, these economic concerns are clouding the short-term outlook for the commodity.

Central Bank Decisions and Economic Recession Fears

The oil market is navigating a turbulent period. Concerns about higher interest rates potentially curtailing economic growth have been ignited by statements from major economic policymakers like the U.S. Federal Reserve and the European Central Bank. Their unified commitment to combatting inflation suggests that tighter policies could prevail longer than many market participants had forecasted. Such economic cooling measures inherently dampen the demand for oil.

Trading Derivatives carries a high level of risk to your capital and you should only trade with money you can afford to lose. Trading Derivatives may not be suitable for all investors, so please ensure that you fully understand the risks involved, and seek independent advice if necessary. A Product Disclosure Statement (PDS) can be obtained either from this website or on request from our offices and should be considered before entering into a transaction with us. Raw Spread accounts offer spreads from 0.0 pips with a commission charge of USD $3.50 per 100k traded. Standard account offer spreads from 1 pips with no additional commission charges. Spreads on CFD indices start at 0.4 points. The information on this site is not directed at residents in any country or jurisdiction where such distribution or use would be contrary to local law or regulation.

External Pressures: U.S. Governance and China’s Real Estate

Adding to the marketplace’s apprehensions, Moody’s recent warning about the repercussions of a U.S. government shutdown on the country’s credit stands out. This alert comes on the heels of a Fitch downgrade due to a previous debt ceiling crisis. Additionally, China’s real estate sector casts another shadow, with Evergrande’s recent missed bond coupon payment amplifying investor unease about Chinese property markets.

Supply Dynamics and Future Forecasts

The oil supply outlook remains tight. While Russia and Saudi Arabia have curtailed output till year-end, Russia recently relaxed its fuel export ban. Concurrently, the number of operational oil rigs in the U.S. has dwindled, hitting its lowest since February 2022. U.S. refiners are also cutting capacity, further tightening supply. Although these factors should prop up prices, the overarching economic concerns are capping gains.

Short-term Outlook

In the immediate future, oil prices may continue to be buffeted by these various forces. Elevated interest rates, dollar strength, and global economic concerns appear to be offsetting the bullish effects of limited supply. However, with the onset of China’s Golden Week, a potential uptick in travel might lend some support to oil prices. Still, until global economic concerns are assuaged, the market sentiment leans bearish.

Technical Analysis

4-Hour Light Crude Oil FuturesLight Crude Oil Futures are currently exhibiting a mix of signals. The present 4-hour price at 89.25 is below the 50-4H moving average of 90.18, suggesting a potential bearish tilt. However, it is above the 200-4H moving average, standing at 84.88, which generally hints at a more extended bullish sentiment.

Meanwhile, the 14-4H RSI reading of 43.08 indicates weakened momentum but is not yet in the oversold territory.
Importantly, the price is hovering near the main resistance area, ranging from 90.10 to 93.74, and significantly above the main support zone between 84.89 and 83.81. Taking these factors into account, the market sentiment for Light Crude Oil Futures appears to be cautiously bearish as it tries to pull-a-way from resistance.