Crude Oil Price Climbs on Russia News and EIA Data as it Eyes New Highs

Crude Oil Price Climbs on Russia News and EIA Data as it Eyes New Highs

The crude oil price climbed higher going into Friday’s trading session after reports emerged that Russia would extend cuts to production and inventory data revealed another drop in stockpiles.

It is being reported overnight that Russia will announce new parameters of a deal with its OPEC+ partners next week according to Deputy Prime Minister Alexander Novak.

On the flipside, the latest data also shows that China and India imported less oil in July.

Thursday’s US Energy Information Agency (EIA) weekly petroleum status report revealed a massive drop of -10.584 million barrels for the week ended August 25th, much lower than the -3.267 million anticipated and -6.135 prior.

It comes hot on the heel of the American Petroleum Institute (API) inventory report the day before that showed -11.486 million fewer barrels in stock for the same week. Again, that was well below the -2.9 million forecast.

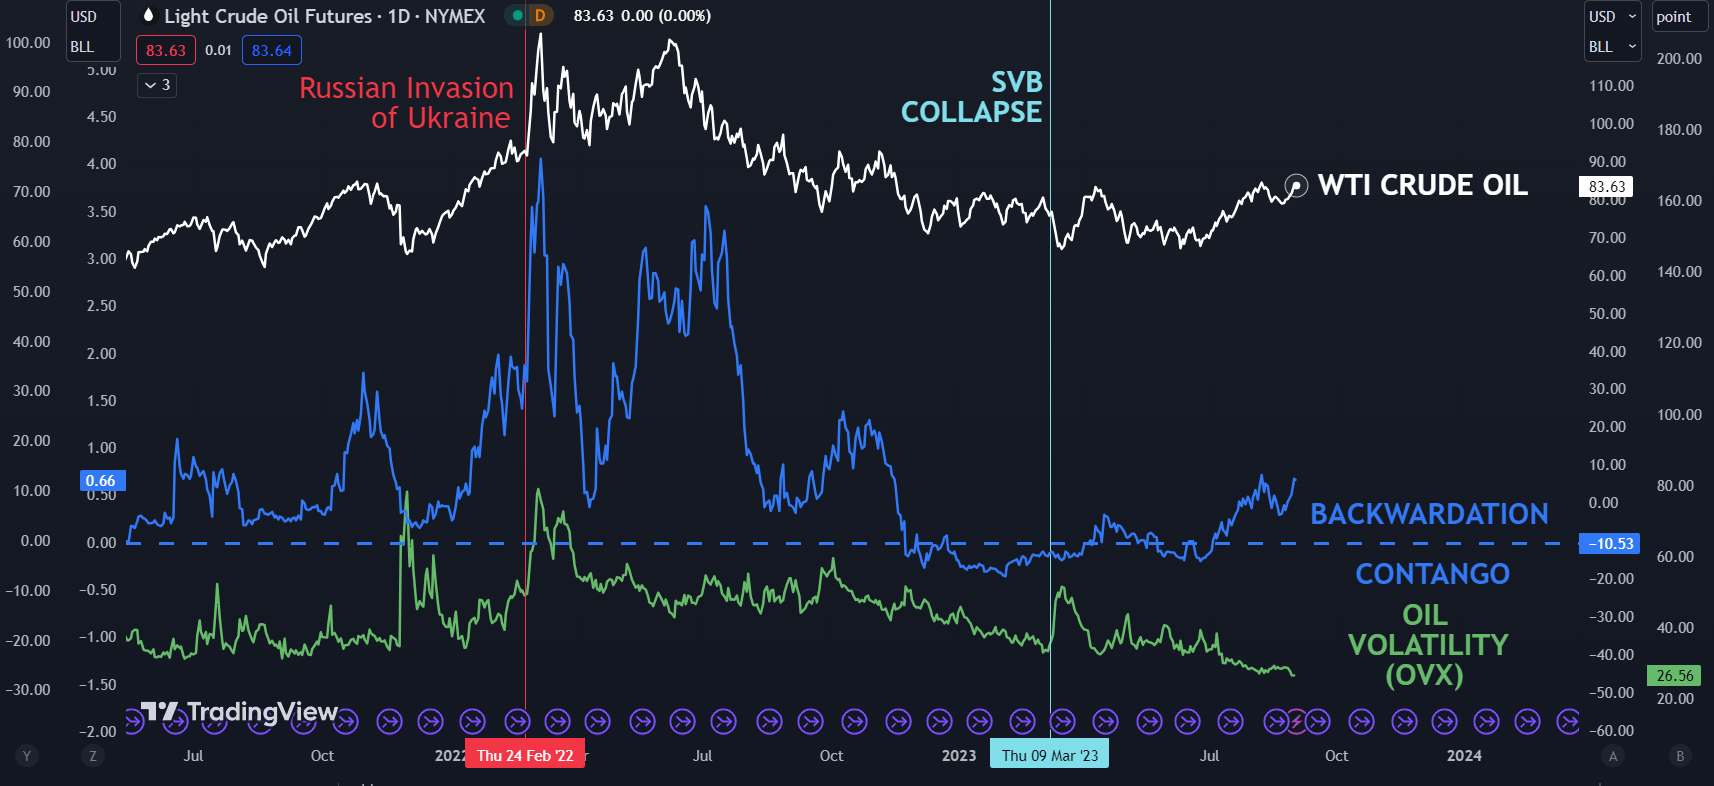
Backwardation between the front 2 WTI futures contracts had been moving in a bullish direction for crude and might support the case that demand in the US is robust for now.

At the same time, the OVX index continues to languish at its lowest level since 2019 which may indicate that the market is non-plussed about the run-up in prices.

The OVX index measures volatility in the WTI oil price in a similar way that the VIX index gauges volatility on the S&P 500.

At the start of trading on Friday, the WTI futures contract is a touch above US$ 83.50 bbl while the Brent contract is trading near US$ 86.80 bbl at the time of going to print.

The August peak was US$ 84.89 for WTI and US$ 87.37 for Brent. Live prices can be found here.

The markets appear to be somewhat at a crossroads after soft US data earlier in the week led to speculation that the Fed might not need to be as aggressive in its tight monetary policy stance.

Later today US non-farm payrolls (NFP) will be released could provide a catalyst for oil price volatility. A Bloomberg survey of economists is forecasting that 170k jobs were added in August and that the unemployment rate will remain steady at 3.5%.

The weekly Baker Hughes rig-count report is also likely to get some attention.

For more information on how to trade oil, click on the banner below.

WTI CRUDE OIL, RBOB CRACK SPREAD, BACKWARDATION AND VOLATILITY (OVX)

image1.png


How Do the US Dollar, Gold, S&P 500, and More Trade at the Onset of Recessions?

How Do the US Dollar, Gold, S&P 500, and More Trade at the Onset of Recessions?

The onset of recessions in the United States typically results in reoccurring financial market trading patterns. While not all of them will be the same, we can look back and see how key assets have performed. This is a special report that analyzes how the US Dollar, gold, S&P 500, Australian Dollar and 10-year Treasury yield traded during the first 3 months of economic downturns.

The length and severity of each recession will vary. This means the usual reaction you might expect from an asset during the onset of a downturn will not always repeat perfectly. For example, during the 2000s housing crash, the US entered a recession in Q4 of 2007. While the stock market declined during these 3 months as one might have expected, peak market volatility occurred much later towards the end of 2008.

Before diving into this topic, I need to set the ground rules, starting with the definition of a recession. In this study, I will be using a GDP-based recession indicator, which attempts to assign dates to downturns based on a mathematical model. This is as opposed to the NBER’s Business Cycle Dating Committee playbook, which can at times be subjective. You can learn more about the indicator I am referencing here.

This definition is also different from the widely referenced two consecutive quarters of negative growth, which is unofficial and often too simplistic, failing to capture other economic trends. For example, in 2022, the economy experienced 2 quarters of negative growth in Q1 and Q2. But, the labor market outperformed.

For analyzing the US and Australian Dollars, I will be using a correlation-weighted currency index instead of an exchange rate. This helps us capture the broader direction of a currency against the world rather than any individual unit. Otherwise, comparing AUD/USD with the DXY Dollar Index runs the risk of placing too much emphasis on the greenback.

Average Snapshot

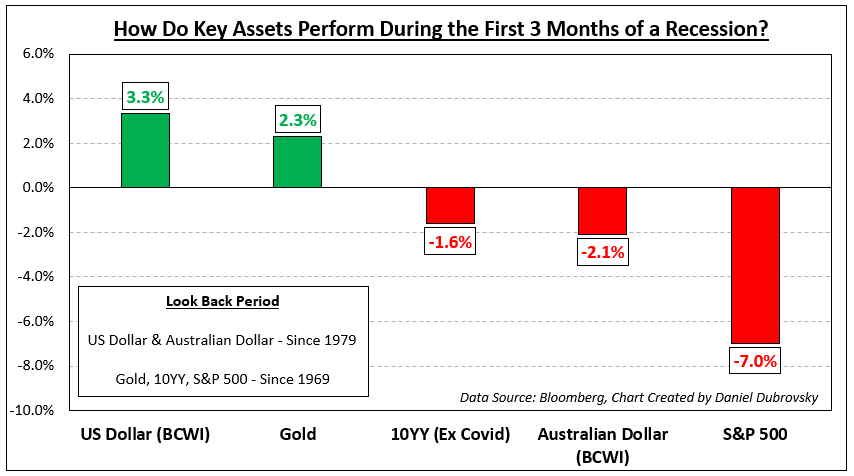
The chart below is a snapshot of how these assets performed during the onset of recessions ordered from best performing to the worst. The sequence is as follows: US Dollar, gold, 10-year Treasury yield, Australian Dollar and S&P 500. The availability of currency data meant I could only look back to 1979. For the rest of the assets, I was able to look back to 1969. The remainder of this article breaks down the individual performance beginning with the US Dollar.

Average Snapshot

US Dollar

Looking back to recessions since 1979, which adds up to 6, the Bloomberg Correlation-Weighted US Dollar Index rose 3.3% on average in the first 3 months of economic downturns. That is not to say each time it climbed. The up/down ratio is 50%. But, as you can see in the chart below, when the dollar rallies, it tends to do so strongly. During periods when the currency fell, the downside reaction was much weaker. This should come as little surprise. In the currency spectrum, the US Dollar functions as a haven given its status as the world’s reserve currency.

US Dollar

Gold

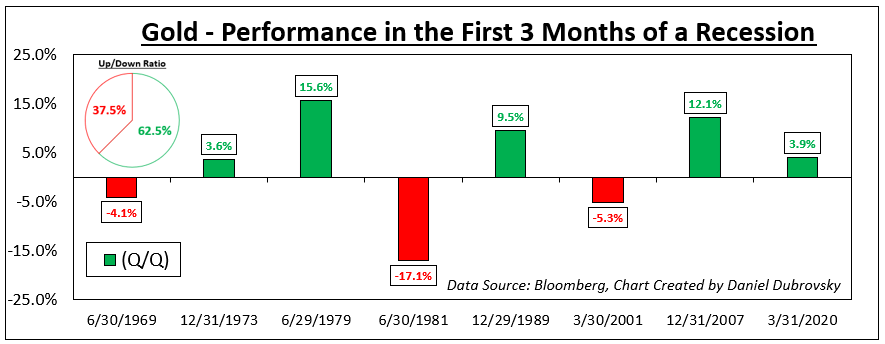
Meanwhile, gold also tends to perform decently at the onset of recessions going back to 1969. On average, the yellow metal returned +2.3% with a win/loss ratio of about 62.5%. Like the US Dollar, the wins were stronger than your average losses, excluding the early 1980s recession (-17.1%). Does this make gold a haven? Remember that gold is not as liquid as a currency. XAU/USD tends to function as an anti-fiat instrument. When the return on cash dwindles, which is what usually happens during recessions, gold becomes relatively more attractive and vice versa.

Gold

10-Year Treasury Yield

From this point forward, we are moving on to assets that underperform. Since 1969, the 10-year Treasury yield has declined by -1.6% on average during the onset of recessions (excluding Covid, which was a major negative outlier that skews the mean). Factoring in Covid though, the up/down ratio is about 29%. Bonds tend to receive a high amount of demand during economic uncertainty due to perceived safety, pushing up the price at the cost of yields.

10-Year Treasury Yield

Australian Dollar

Looking at the Bloomberg Correlation-Weighted Australian Dollar Index, the Aussie returned on average -2.1% during the first 3 months of a US recession since 1979. AUD also has a depressingly low win/loss rate of 16.7%. In currency markets, the Aussie is known for its sentiment-linked status, often closely following equities. Australia’s economy is closely tied to the global business cycle due to commodity exports, making it important to watch growth in the United States. When the latter sneezes, the world can catch a cold, driving up market volatility and negatively impacting the Australian Dollar.

Australian Dollar

S&P 500

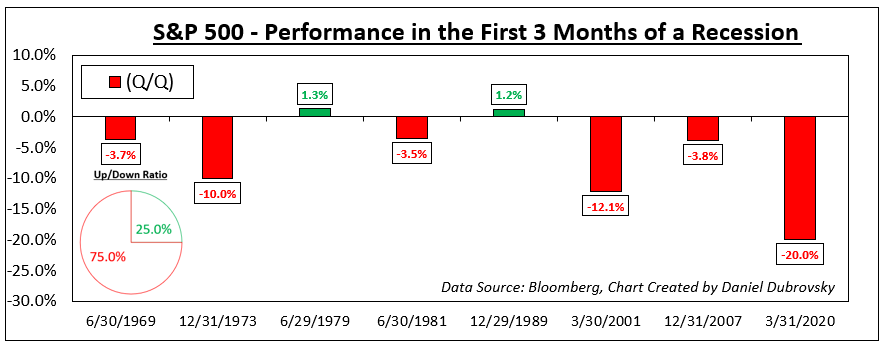
Finally, we arrive at the S&P 500, which is one of the key US benchmark stock indices. Unsurprisingly, the S&P 500 has returned on average -7.0% at the onset of recessions since 1969. But, unlike the Australian Dollar, the win/loss ratio is slightly better at 25%. This is unsurprising. Depending on the severity of the recession, uncertainty plays a key role in how much the stock market declines and how fast it does.

Recessions raise the risk that companies can go out of business and/or lay off workers, resulting in stock market crashes. Often, a bubble popping can lead to a recession, such as the dotcom bust in the early 2000s and the housing market leading in 2008. There are also leading indicators of a recession that you might be interested to learn about.

S&P 500

The Mystery of Bearish Engulfings: Do they Reliably Predict Forex Price Reversals?

The Mystery of Bearish Engulfings: Do they Reliably Predict Forex Price Reversals?

A Bearish Engulfing (BE) is a candlestick pattern that can be identified when looking at virtually any financial trading instrument. All you need is an opening, high, low and closing price. As implied by the name, technicalists will often use these as signals that an upward-trending market might be readying to reverse. But as you might have heard past performance is not always indicative of future results.

This is not a report about the intricacies of Bearish Engulfings: which you may learn more about here. Rather, the purpose of this educational content is to test their effectiveness using price and price alone. This will come from the foreign exchange market (forex). At the end of the article, I will go over the key takeaways and some of the limitations of this study. In the meantime, let us set some ground rules.

Identifying Bearish Engulfings – EUR/USD, GBP/USD, USD/JPY, AUD/USD, USD/CAD

Almost 37,000 candles were analyzed between EUR/USD, GBP/USD, USD/JPY, AUD/USD and USD/CAD using daily data since 1995 from TradingView. One of the reasons why I chose the foreign exchange market is because of its unparalleled liquidity, especially amongst the major pairs. This helps produce smoother price action compared to other markets, such as stocks and cryptocurrencies.

How did I identify Bearish Engulfings? It was based on a set of rules I coded to search over each candle to recognize if it was valid. For this study, I focused on a near-term horizon, which translates to 20 days before and after an engulfing. In total, there are too many rules to go over. Instead, let us look at some of the most important ones:

Bearish Engulfing Detection Rules

  1. The Bearish Engulfing body must meet a minimum size requirement, it cannot be too small
  2. The body of the candle before the BE (the pre-candle) cannot be too small relative to the BE body
  3. Rather than the pre-candle low, the BE must close under the pre-candle open
  4. Before the BE, there must be the appearance of an uptrend (no downtrends or flat price action)
  5. The pre-candle close must also be a 20-day high close, with some cautious room for error

Limitations to these rules and subjectivity will be discussed at the end of this report. In the meantime, the chart below is an example of a detected EUR/USD Bearish Engulfing pulled on March 13th, 2005. This serves as an example of a clean one. Notice how the price was trending higher before the BE and the pre-candle close was a 20-day high close. After the BE, the price turned lower as one would expect.

In total, the code detected slightly over 200 Bearish Engulfings from a possible almost 37,000 candles. Of course, not all of them were as clean as the one below. If you would like to watch how some of the other cases appeared, I highly encourage you to check out this link to a Twitter thread I made that displays some of the Bearish Engulfings in each pair.
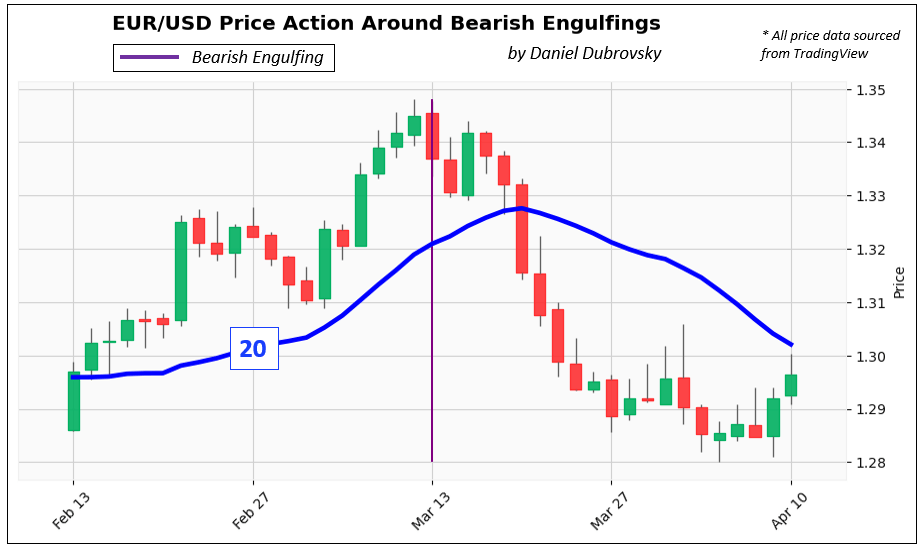
Identifying Bearish Engulfings – EUR/USD

37,000 Candles, Over 200 Bearish Engulfings, How Do the Trends Look Like?

Below is a chart that plots each Bearish Engulfing trend 20 days before and after its appearance. To make sure that every trend was in the same scale range, each BE (close) was indexed to 100 as a starting point.

In the period leading into the BE, you can see how the trends were rising with a consistent pattern and range. Then, the day before the BE was always the peak. This is what creates the dip into the BE, which represents the close under the pre-candle.

What happens after the Bearish Engulfing? The trends continue for 20 days and with each passing period, spread out in a cone or triangle-like fashion. The right side also exhibits a larger dispersion of prices (variance) than the left, with a wide range of peaks and troughs. At first glance, this speaks to randomness and pours cold water on the idea of Bearish Engulfings as consistent reversal signals. But we need to take a closer look.
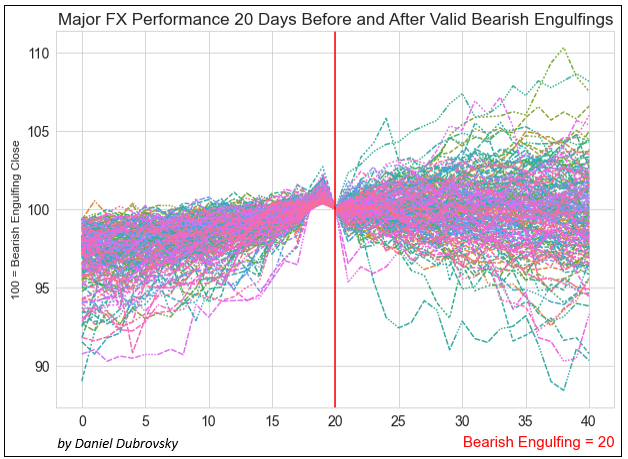
37,000 Candles, Over 200 Bearish Engulfings, How Do the Trends Look Like?

How Does the Average Bearish Engulfing Trend Look Like?

That is where the next chart comes in, which is the average Bearish Engulfing trend. This visualization confirms that the code was able to consistently capture the uptrend before the BE. Just like with the previous chart, you can see the top right before the BE before the price fell to 100, representing the dip into the engulfing. After the engulfing, prices continued lower, finishing -0.28% on average 20 days after the BE. So, it appears that there is a slight downward bias in the post-BE trend. I would argue that this is not the most important takeaway from this analysis.
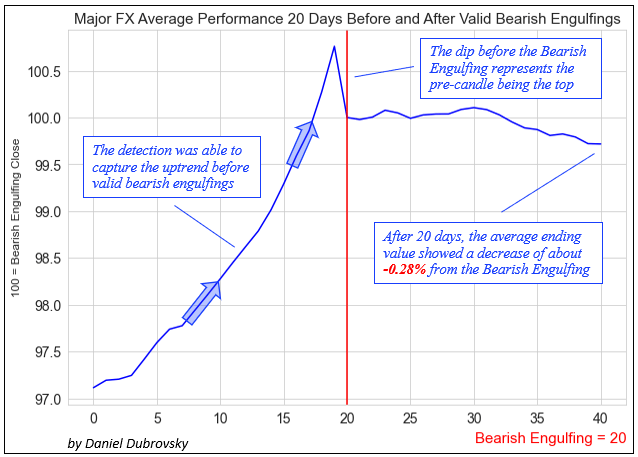
How Does the Average Bearish Engulfing Trend Look Like?

Bearish Engulfings: Reversal or Topping Signal?

The last chart overlays the average Bearish Engulfing series, with the percentage of trends that closed below the pre-candle for each day. For example: after 5 days, 71% of trends remained below the pre-candle close. After 10 days, this number shrank to 66%, then rose to 68% on the 15th day and finally ending at 65% on the 20th day. In other words, on average, about two-thirds (2/3) of trends remained below the top after one month.

Here is a fun fact: after 20 days, the ending price observations created a statistically significant normal distribution. This means we can alternatively use a Cumulative Distribution Function (CDF) to calculate the probability of a series in this sample finishing below the top. And just like with the results mentioned earlier, that clocks in at roughly 65% as well.
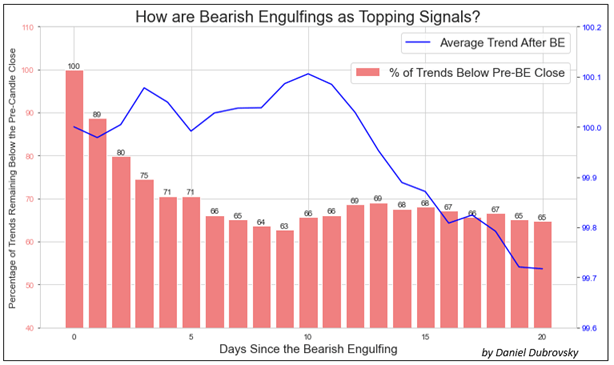
Bearish Engulfings: Reversal or Topping Signal?

What’s the Verdict on Bearish Engulfings?

After analyzing almost 37,000 candles between EUR/USD, GBP/USD, USD/JPY, AUD/USD and USD/CAD, identifying at least 200 Bearish Engulfings, it seems that this candlestick pattern functions better as a topping signal than a reversal one. While the average trend finished almost -0.3% after 20 days, 2/3 of them remained below the top. In other words, if we can identify valid Bearish Engulfings in this market, it might be worth paying attention to. But, let us go over some study limitations.

Study Limitations

While Bearish Engulfings can be observed universally between markets, understand that a specific subset of the forex market was analyzed for this study, and it might be the most relevant to the pairs studied. Furthermore, this is based on a sample of a little over 200 Bearish Engulfings. More might be needed to enhance the validity of this study, (or even disprove it).

As much as I tried to keep this study as objective as possible, there is some inherent subjectiveness in technical analysis. For example, while most people can universally agree on the dimensions of a Bearish Engulfing and how they appear, the background in which they form is more fluid. In this sample, I considered if the BE closed under the pre-candle open and not the pre-candle low. Some may debate that the latter is more proper.

Another important factor is the timeframe. This was conducted on daily data, but you could theoretically analyze different layers of time horizons. That also includes the duration you measure before and after the engulfing. This study was focused on near-term price action, but you could also analyze broader trends, such as 40 days before and after the Bearish Engulfing


Trading Forex at the News Release

Trading Forex at the News Release

Forex News Trading Strategies

There are two common strategies for trading forex at the news release:

  1. Initial Spike Fade strategy
  2. News Straddle strategy

Each one provides a robust plan for traders to follow, depending on the market environment observed at the time of the release, and how best to approach that particular market.

Before reading further it is essential that you have a good grasp on the basics of news trading. If you are new to trading or simply require a refresher, take a look at our introduction on how to trade forex news.

1. Initial Spike Fade Strategy

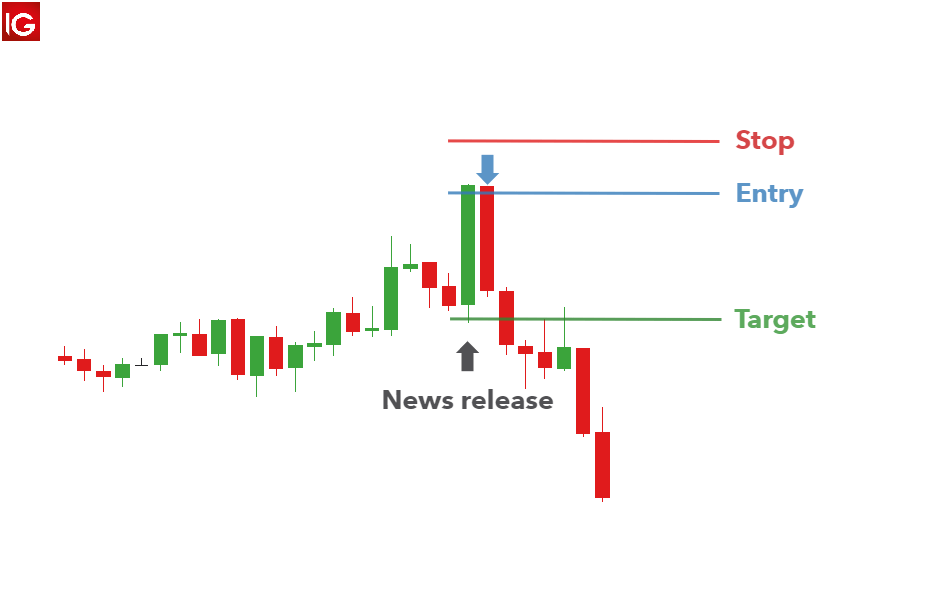
This strategy looks to capitalize on an overreaction in the market over the short term by fading the initial move. This strategy suits reversal traders, scalpers and day traders due to fast moving and erratic pricing that often follows a major news release.

Overreactions and subsequent reversals are seen fairly regularly in the forex market as large institutions add to the increased volatility of the initial move. The market as a whole, often spikes as an overreaction and subsequently push price back toward pre-release levels.

Once the market calms down and spreads return to normal, the reversal often gains momentum showing early signs of a potential new trend.

The shortfall associated with this strategy is that the initial spike may turn out to be the start of a prolonged move in the direction of the initial spike. This underscores the importance of using well-defined stops to limit downside risk and get you out of a bad trade quickly.

How to implement initial spike fade strategy:

  1. Select the relevant currency pair: Ensure the major news event corresponds to the desired currency pair to trade, i.e. Non-Farm Payrolls will affect USD crosses.
  2. Switch to a five-minute chart: After selecting the desired market, switch to a 5-minute chart just before the news release.
  3. Observe the close of the first five-minute candle: The first five-minute candle is usually quite large. When price approaches either the spike high or the spike low, fade the move by trading in the opposite direction.
  4. Stops and limits: Stops can be placed 15 pips above the high for a short trade or 15 pips below the low for a long trade. Targets can be set at two or three times the distance of the stop.

initial spike fade strategy in forex news trading

2. News Straddle Strategy

The news straddle strategy is perfect for traders expecting a huge surge in volatility but are unsure of the direction. This strategy lends its name from a typical straddle strategy in the world of options trading as it uses the same core strategy – to capitalize on an increase in volatility when direction is uncertain.

The disadvantage of the news straddle approach surfaces when price breaks support or resistance only to reverse soon thereafter. Similarly, price can trigger the entry order and move toward your target only to reverse until a stop it hit.

This strategy can be implemented using the following steps:

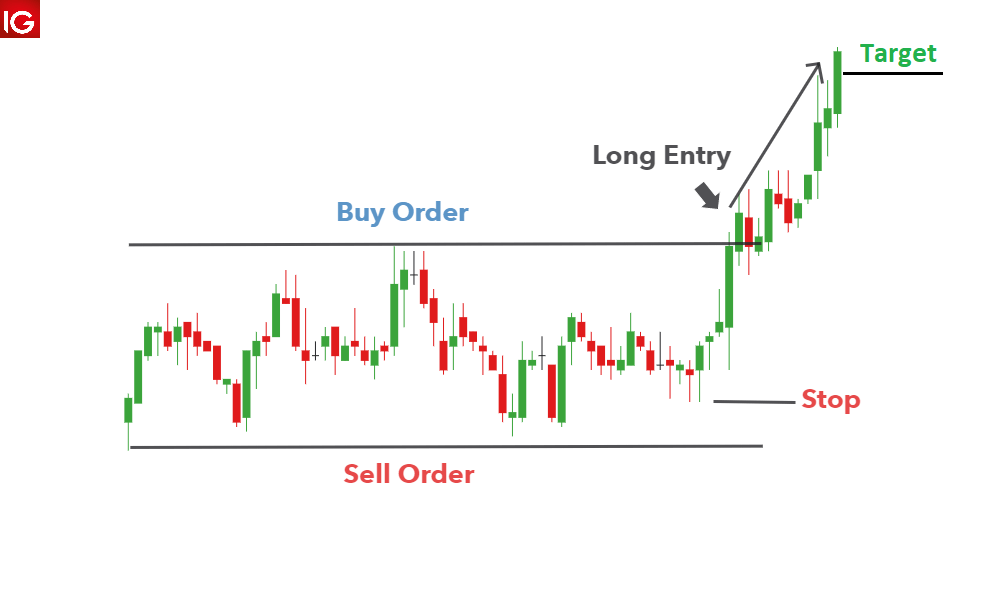
  1. Establish a range with support and resistance.
  2. Set two orders to open: Set a working order/ entry order to open a long trade if price breaks above resistance and one to go short if price trades below support.
  3. Remove remaining order after confirming direction: The market has the potential to breakout of the range and once this happens, the one entry order will be triggered, and a trade will be opened. Immediately remove the entry order that was not triggered.
  4. Stops and limits: A tight stop can be placed at the recent range low when going long and recent high when going short. Limits can be placed in line with a positive risk to reward ratio.

Straddle news trading strategy

Trading the News During the Release: Conclusion

Trading forex news at the news release has the potential to overwhelm traders with increased volatility in a short period of time. However, through the adoption of a solid strategy, traders can approach these volatile periods with greater confidence and mitigate risk of a runaway market through the use of guaranteed stops (where available).

Trading Forex News Releases FAQs

How can I tell which direction the market will trade after at the release?

Forecasting the economic news release is one thing, predicting how traders will react to the news release is quite difficult. When estimations are unsurprising or more or less similar to the previous recorded number, the market tends to digest this information and it is reflected in the lead up to the release. However, there is no guarantee that the market direction/trend will be maintained even if the news comes out exactly as was estimated. This is because different market participants can draw different conclusions that will influence their trades.

Someone may consider data that prints in line with expectations as a bad thing and someone else may view it as a good thing. The bottom line is that traders need to have a strategy in place with predetermined risk parameters.

Bitcoin (BTC), Ethereum (ETH) Slide as SEC Postpones ETF Decision, US Jobs Report Now Key

Bitcoin (BTC), Ethereum (ETH) Slide as SEC Postpones ETF Decision, US Jobs Report Now Key

Bitcoin (BTC), Ethereum (ETH) Prices, Charts, and Analysis:

Bitcoin gave back nearly all of Tuesday’s rally on Thursday after the Securities and Exchange Commission (SEC) delayed making any decision on a raft of Bitcoin ETF applications. The SEC has now pushed back the latest deadline until mid-October. While this outcome was expected, a degree of hope had been building in the cryptocurrency market that a spot Bitcoin ETF would soon be announced. On Tuesday, the US Court of Appeal said that the SEC was wrong in rejecting Grayscale’s proposal to convert its Grayscale Bitcoin Trust into a spot Bitcoin ETF, fueling hope that a spot ETF would soon be granted.

A Bitcoin spot ETF gives investors direct exposure to changes in the cash market – the ETF manager holds actual Bitcoins – while futures ETFs give investors exposure to moves in the underlying futures market. Bitcoin futures ETFs are already available in the market.

Looking at the daily BTC/USD chart, all of this week’s gains have been reversed and left the pair eyeing a short-term level of support around $25.2k. The current spot price is now below all three moving averages, a negative set-up, leaving further downside the path of least resistance. Traders however should be aware that later today – 13:30 UK – the latest US Jobs Report (NFP) is released and this has the heft to move markets, and sometimes sharply. A miss of already low expectations of 170k would likely send prices higher again as expectations of higher-for-longer US interest rates are pared back further.

Bitcoin (BTC/USD) Daily Price Chart – September 1, 2023

image1.png

Ethereum moved lower in tandem with Bitcoin but is still trying to keep a short-term series of higher lows in place. A close and open below $1,622 would break this series and leave traders eyeing the August 22nd low at $1,581 and the August 17th spike low at $1,542.5. To the upside, short-term resistance at $1,725 and $1,744.

Ethereum (ETH/USD) Daily Price Chart – September 1, 2023

image2.png