Silver Prices Forecast: XAG/USD Reacts to US Jobs Data, Fed Policy Speculation

Silver Prices Forecast: XAG/USD Reacts to US Jobs Data, Fed Policy Speculation

Silver’s Rollercoaster Ride Amid Economic Indicators

Silver (XAG/USD) prices, after climbing to a one-month peak last week, faced a downturn this Monday, marking the potential for its fourth consecutive decline. The initial surge came in light of the dollar’s pullback and speculation around the U.S. Federal Reserve’s anticipated pause in interest rate hikes. However, the shine was short-lived. With Monday being a U.S. bank holiday, traders should be prepared for subdued price movements and below-par trading volume.

The Impact of U.S. Jobs Report on Treasury Yields

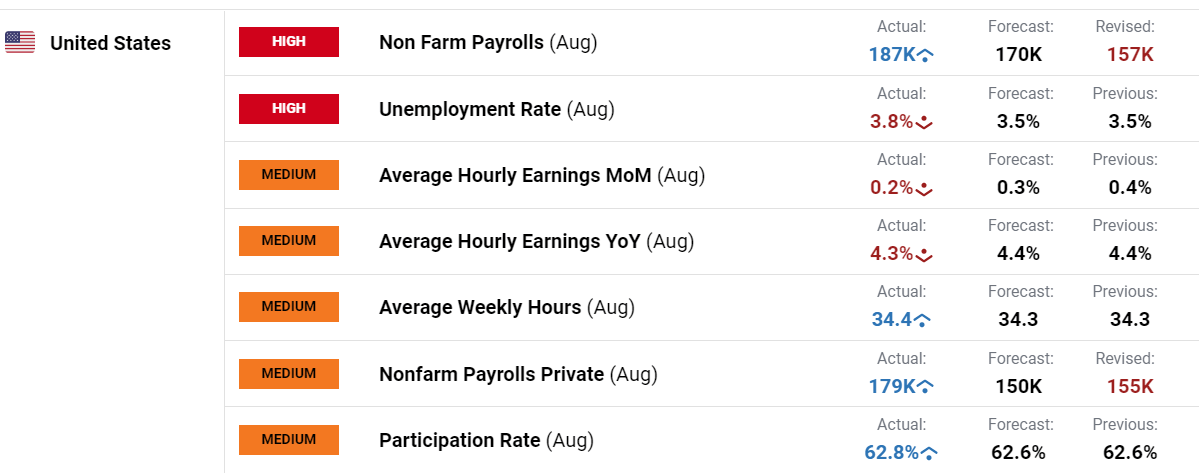
Friday saw a rise in Treasury yields, influenced heavily by the latest U.S. jobs data. On Monday, early signs indicated another uptick in the Treasury futures market. The unemployment rate for August registered at 3.8%, a jump from July’s 3.5%, and the highest since February 2022. Although there was a hint of optimism as the U.S. added more jobs than anticipated – a seasonally adjusted 187,000 versus the expected 170,000 – the figures for June and July were retroactively adjusted downwards by 110,000, tempering the initial enthusiasm.

Trading Derivatives carries a high level of risk to your capital and you should only trade with money you can afford to lose. Trading Derivatives may not be suitable for all investors, so please ensure that you fully understand the risks involved, and seek independent advice if necessary. A Product Disclosure Statement (PDS) can be obtained either from this website or on request from our offices and should be considered before entering into a transaction with us. Raw Spread accounts offer spreads from 0.0 pips with a commission charge of USD $3.50 per 100k traded. Standard account offer spreads from 1 pips with no additional commission charges. Spreads on CFD indices start at 0.4 points. The information on this site is not directed at residents in any country or jurisdiction where such distribution or use would be contrary to local law or regulation.

Fed’s Stance Amid Inflation Concerns

Chairman Jerome Powell’s recent comments hinting at possible further rate hikes to contain persistent inflation have ignited debates. The prevailing sentiment is that the weakening labor market might dissuade the Fed from more hikes this year. With the imminent Fed decisions in the offing, markets project a 93% probability of rates remaining unchanged in the September meeting, as per CME’s FedWatch tool. However, market predictions are split regarding the subsequent steps.

Economic Indicators Favor Silver

An array of economic signals, from moderating inflation to a relaxing labor market, strengthens the conviction that the U.S. economy is headed for a mild deceleration rather than a crash. The anticipated pause in interest rate hikes by the Fed might soften the dollar, providing a favorable environment for silver prices.

The Interplay Between Yields and Silver Prices

Given the inverse relationship between silver and interest rates, all eyes are on Treasury yields. With seven Fed officials expected to address the public this week, traders await insights that might shed light on decisions at the policy meeting scheduled for September 19-20. In the short term, a bearish sentiment prevails for silver, but the market remains hopeful for long-term gains.

Technical Analysis

4-Hour Silver (XAG/USD)The current 4-hour price of 24.18 is slightly below the previous 4-hour price of 24.27, indicating a minor downtrend. The price is currently sandwiched between the 200-4H moving average of 23.83 and the 50-4H moving average of 24.33, suggesting a narrowing trading range. The 14-4H RSI stands at 42.99, showing a weakened momentum but not in the oversold territory.

Price is positioned above the main support area (22.70 to 22.28) and below the main resistance area (25.00 to 25.27). In summary, the market for Silver (XAG/USD) on a 4-hour chart displays a mildly bearish sentiment, but it’s nearing key moving averages that could dictate its next move.

NASDAQ 100, Dow Jones, S&P 500 News: Outlook Points to Bullish Sentiment Amid Fed Rate Pause

NASDAQ 100, Dow Jones, S&P 500 News: Outlook Points to Bullish Sentiment Amid Fed Rate Pause

Rate Dispute and Economic Indicators Affect Markets

The S&P 500 closed higher on Friday as rising unemployment numbers fueled expectations of a halt in upcoming interest rate hikes. This change in employment figures indicates the Federal Reserve’s successful combat against inflation, hinting at an end to the interest rate hiking cycle. Such data suggests a potential dovish stance by the Fed, with predictions pointing to no rate hikes this month.

Weekly Market Snapshot

The S&P 500 rose by 2.50% over the week, achieving its best performance since June. The Dow and the Nasdaq followed suit, posting gains of 1.43% and 3.25%, respectively. However, trading volumes on U.S. exchanges appeared subdued, with only 8.9 billion shares being traded as compared to the 10.4 billion shares average over the past 20 sessions.

Trading Derivatives carries a high level of risk to your capital and you should only trade with money you can afford to lose. Trading Derivatives may not be suitable for all investors, so please ensure that you fully understand the risks involved, and seek independent advice if necessary. A Product Disclosure Statement (PDS) can be obtained either from this website or on request from our offices and should be considered before entering into a transaction with us. Raw Spread accounts offer spreads from 0.0 pips with a commission charge of USD $3.50 per 100k traded. Standard account offer spreads from 1 pips with no additional commission charges. Spreads on CFD indices start at 0.4 points. The information on this site is not directed at residents in any country or jurisdiction where such distribution or use would be contrary to local law or regulation.

Fed’s Anticipated Move

Amid rising unemployment and a visible slowdown in wage growth, the Federal Reserve’s stance appears to be tilting towards a more dovish approach. The recent macroeconomic indicators underscore the Fed’s progress in its battle against inflation, suggesting that the central bank could be nearing the conclusion of its interest rate hiking cycle.

With the interest rate futures indicating a 93% probability of rates remaining unchanged in the forthcoming meeting, it is becoming increasingly apparent that the Fed might opt for a pause in rate hikes to support the economy. This potential halt would be in response to both domestic employment data and global economic uncertainties, ensuring that the U.S. economy remains on a stable growth trajectory.

Company Highlights

Broadcom’s shares took a 5.5% hit after the chipmaker projected current-quarter revenue below expectations, despite outperforming earnings and revenue in the latest quarter. Lululemon Athletica rose by 6% following an earnings beat and subsequent revision in their annual profit and revenue forecasts. Additionally, Dell Technologies witnessed a surge of 21% after outperforming analysts’ second-quarter expectations.

Streaming Wars and Major Trades

Tensions between Disney and Charter Communications led to a decline in shares of major streaming firms. The unresolved distribution agreement saw major channels like ESPN go offline for Charter’s Spectrum cable service users. Consequently, stocks for Disney plummeted by 2.4%, Charter Communications by 3.6%, and Warner Bros Discovery faced a significant 12% drop. Meanwhile, Tesla’s decision to cut prices for some of its vehicles resulted in a 5% dip in their shares.

Short-Term Market Forecast

As we head into the next trading week, several factors will likely shape the short-term trajectory of the U.S. markets. The expectation of the Federal Reserve adopting a more dovish approach, given the prevailing macroeconomic conditions, could bolster market sentiment, leading to potential uptrends in major indices. However, investor sentiment might be tested by corporate undercurrents, particularly the streaming sector’s ongoing rate disputes and the repercussions from company-specific announcements.

The S&P 500’s robust performance over the past week may serve as a positive harbinger, but it’s imperative to monitor trading volumes as a key liquidity indicator. If volumes remain subdued, it may signal decreased confidence among traders.

In the corporate realm, the ongoing disputes between streaming giants could introduce volatility in the sector. While companies like Lululemon Athletica and Dell Technologies might continue to enjoy the positive momentum from their recent announcements, firms like Broadcom could face headwinds due to forecasted revenue challenges.

In conclusion, while the broader market outlook appears cautiously bullish, driven by anticipated Federal Reserve decisions, individual sectors and stocks may experience volatility, making it essential for investors to remain vigilant and diversified.

Sentix Index Signals Recession with Germany Casting Shadow Over Global Economy

Sentix Index Signals Recession with Germany Casting Shadow Over Global Economy

Overview

Economic indicators in September hint at further global downturn, led predominantly by Germany’s continued recession. The “first mover” in economic signals, the sentix economic index, is showing a bleak outlook across major economies.

State of the Global Economy

Germany, reminiscent of the 2008 financial aftermath or the initial 2020 lockdown, shows its fifth successive decline in the overall index. The sentix economic index for the Eurozone, at -21.5 points, suggests that the region remains mired in a recession. This recession is particularly felt in the service sector and is set to deepen. Amid these declining economic circumstances, Germany’s economic weight pulls the entire Eurozone down, challenging the ECB’s stance.

Germany’s Stumbling Economy

Germany, once Europe’s economic powerhouse, is now grappling with challenges reminiscent of the first Corona lockdown in 2020. Political leadership’s economic missteps and uncertainties stemming from energy crises have sunk the economy further into recession. Investors remain pessimistic, expecting the downtrend to persist.

US and Switzerland: Tipping Towards a Recession?

Previously resilient, the US economy now shows signs of vulnerability. A restrictive monetary policy combined with sluggish money and credit growth might be working against its growth prospects. Meanwhile, Switzerland’s economy, teetering on the edge, reflects declining investor confidence, with concerns of an impending recession.

Short-term Forecast

The overall sentiment, based on the mentioned indicators, leans bearish. As global economies grapple with downturns and recessions, the near future appears challenging, particularly for Germany and possibly the US and Switzerland.

US Holiday Today but Focus Could be on China, Russell 2000, USD/JPY and Brent Crude

US Holiday Today but Focus Could be on China, Russell 2000, USD/JPY and Brent Crude

Market Recap

The US jobs data release last Friday continues to reflect signs of softening in the US labour market, which seems to be in line with what the Federal Reserve (Fed) wants to see. Job additions were somewhat lukewarm despite being slightly higher than consensus (187,000 versus 170,000 forecast), while unemployment rate jumped to 3.8% from previous 3.5%. Along with some moderation in wage growth, rate expectations found validation for the Fed to keep rates on hold this month, with 62% probability being priced for the November meeting.

Get My Guide

Treasury yields were higher however, with the two-year yields paring earlier losses while the ten-year is up 7 basis-point (bp), overall lifting the US dollar. This comes as US Institute for Supply Management (ISM) manufacturing purchasing managers index (PMI) data may support rates to be keep high for longer by displaying a lesser-than-expected contraction in manufacturing prices (48.4 versus 43.9 forecast).

Wall Street was little changed, somewhat catching a breather from its recent rally, with US markets offline today due to Labour Day holiday. This may bring about lighter trading volume across the globe and set the stage for a quieter start to the week. Attention will then be turned to China’s Caixin PMI data and the RBA interest rate decision tomorrow, along with retail sales figure in Singapore.

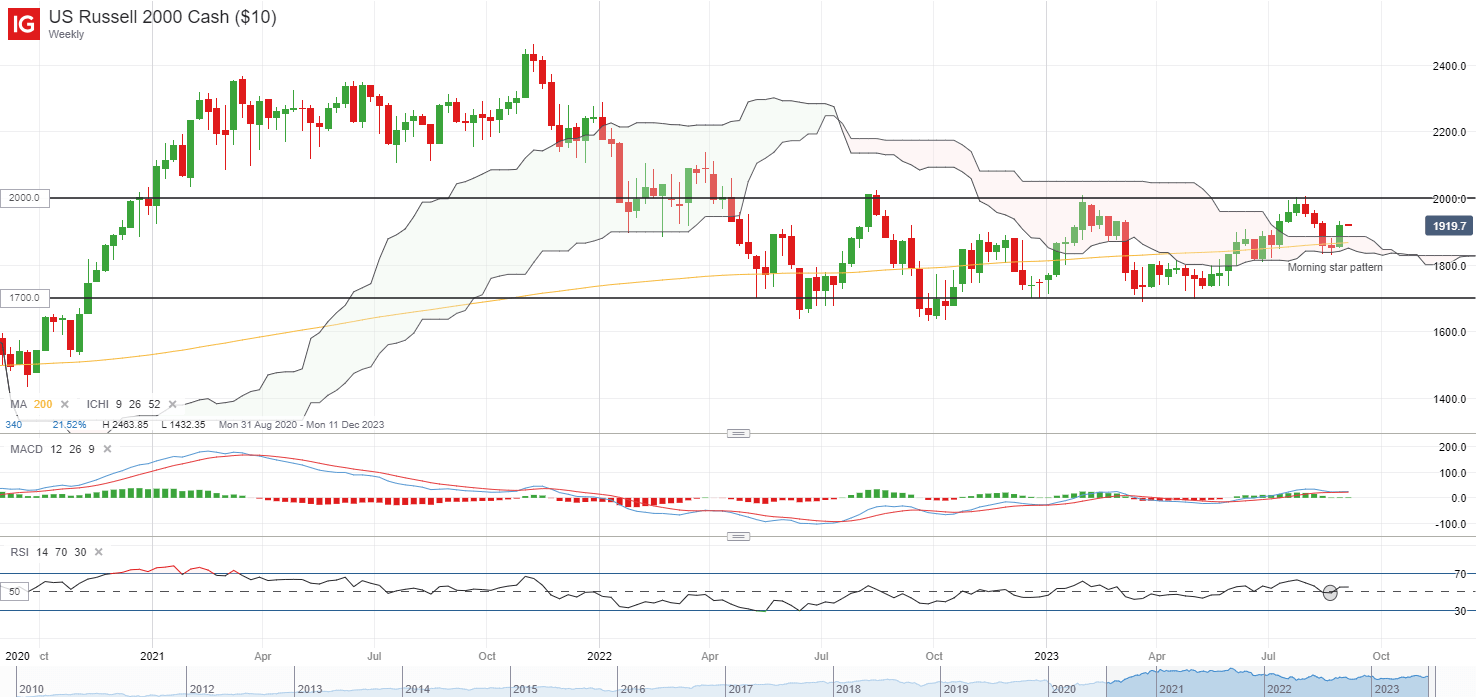
Perhaps one to watch is the Russell 2000 index, which is up 3.4% for the week. On the weekly chart, a morning star formation seems to be in place, while its relative strength index (RSI) attempts to defend its key 50 level last week. This follows after a retest of the lower edge of its Ichimoku cloud pattern on the weekly chart, which has supported prices for the second occasion since May this year. Staying above its 200-day MA may keep the near-term bias intact, with immediate support at the 1,900 level. On the upside, the key psychological 2,000 level will serve as key resistance to overcome.

image1.png

Source: IG charts

Asia Open

Asian stocks look set for a positive open, with Nikkei +0.32%, ASX +0.71% and KOSPI +0.19% at the time of writing. The Nasdaq Golden Dragon China Index was up 3.2% last Friday, digesting the recent fresh moves from China authorities to support the CNY and its housing market. China’s financial regulators have cut the down-payment requirements for first and second-time home buyers and lowered rates on existing mortgages – a move to provide some support for home sales demand as a bid to restore confidence, although much still awaits on how much impact it may eventually have.

On another front, Country Garden’s recent success in buying some time from its creditors for its 3.9 billion yuan onshore private bond could provide some support for Chinese equities to start the week, although past lessons from China Evergrande suggests that any extension could be just a near-term reprieve, with the lack of an eventual resolution still a headwind for risk sentiments eventually.

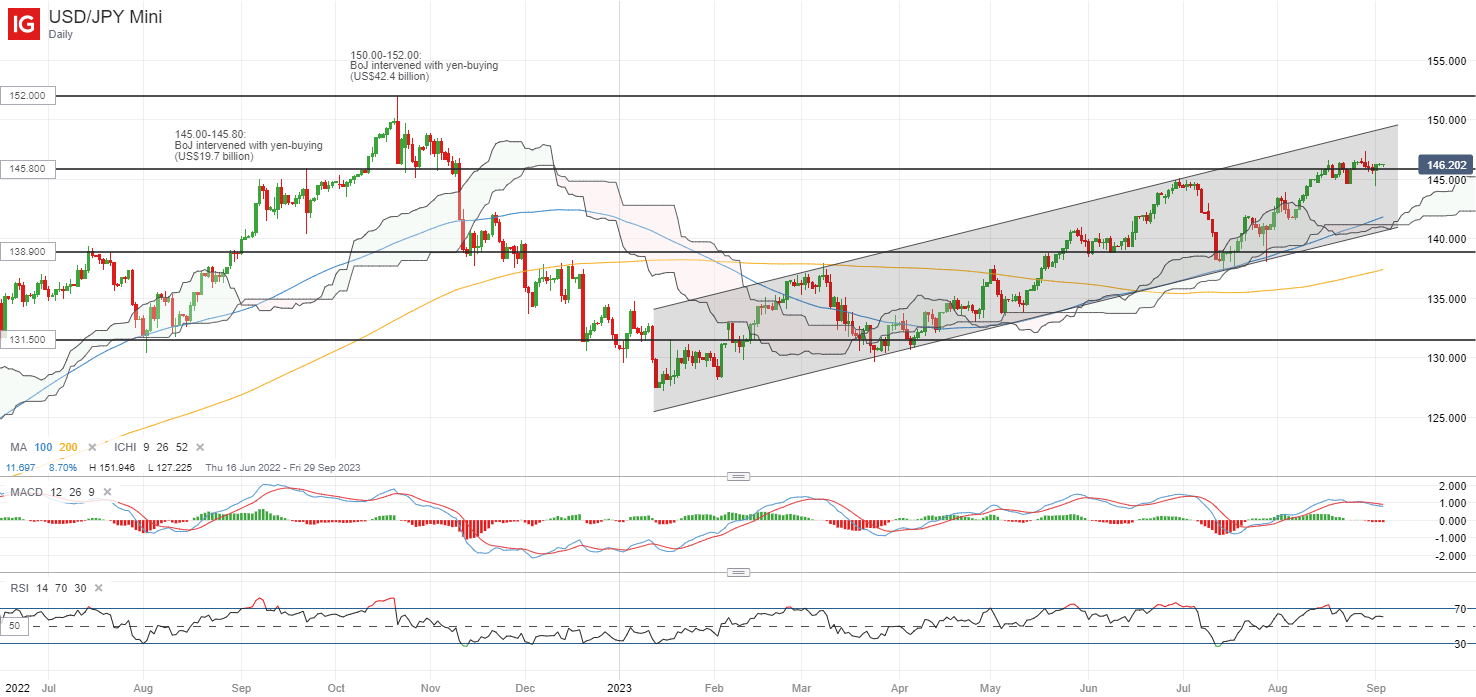
Aside, one to watch may be the USD/JPY, which saw the formation of a bullish hammer on the daily chart last Friday to defend the key 145.80 level. This level marked a crucial level of intervention by the Bank of Japan (BoJ) in September last year, with the dip-buying in place reflecting some expectations for the US-Japan yield differentials to be well-supported by policy divergence. A move above last Tuesday’s high may potentially support a move to retest the 148.80 level next, while on the downside, the 145.00-145.80 range will remain a key level of support for buyers to hold.

 image2.png

On the watchlist: Brent crude prices setting its sight for new year-to-date high

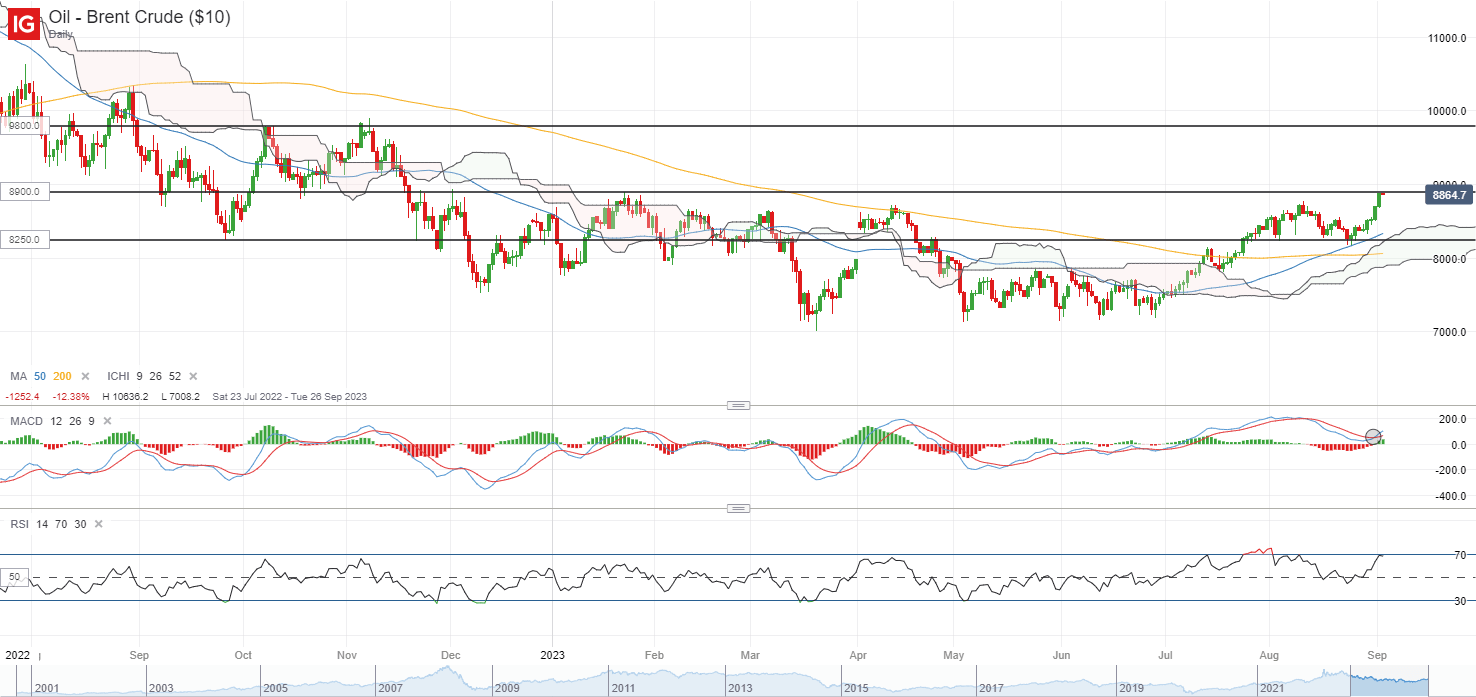
Brent crude prices continue to climb last Friday (+2.1%), shrugging off the stronger US dollar to stand just less than 1% away from a new year-to-date high. For the week, prices are up 5.5% – its best week since April this year. Declining inventories in the US, along with further output cuts expected out of Russia, continues to underpin a tightening supply outlook while on the technical front, prices continue to trend above its 200-day MA.

A bullish crossover was formed on its MACD on the daily chart last week, overall supporting some build-up in positive momentum. Further upside may leave the US$98.00 level on watch for a retest next, which marked its October and November 2022 highs.

image3.png

Japanese Yen’s Slide Pauses but for How Long? USD/JPY, EUR/JPY, MXN/JPY Price Setups

Japanese Yen’s Slide Pauses but for How Long? USD/JPY, EUR/JPY, MXN/JPY Price Setups

The retreat in US Treasury yields amid a scaling back in US Federal Reserve rate hike expectations this year appears to have put a lid on USD/JPY.But unless the pair breaks below key technical support, the path of least resistance remains sideways to up.

US PCE price index rose 0.2% on-month in July, in line with June. On a year-on-year basis, the index rose 3.3% from 3.0% in June. The US unemployment rate rose more than expected in August, along with a slowing in average hourly wage growth, boosting hopes that the jobs market could be starting to cool. Employers added 187k jobs last month Vs 170k expected. Markets see almost no chance of a Fed rate hike in September, while the odds of a November move have scaled back to 35% from 50% a week ago.

Meanwhile, Japan’s finance minister on Friday stopped short of offering any sign of intervention even as USD/JPY surpassed levels that triggered intervention last year. BOJ Governor Kazuo Ueda’s assessment that inflation remains below BOJ’s 2% target possibly rules out any premature tightening, and that the cost of waiting for underlying price pressure to increase is not too high.

Moreover, the deteriorating growth outlook outside of the US implies that the Japanese central bank may not rush into making further changes to its yield curve control (YCC) in the foreseeable future. This implies that it may be premature to assume that USD/JPY’s broader uptrend is changing. Indeed, for USD/JPY’s bull run to reverse, US interest rates may need to peak.

USD/JPY 240-Minute Chart

image1.png

USD/JPY: Early signs of fatigue

On technical charts, USD/JPY’s failure last month to decisively break above the August high of 146.50 is a sign of exhaustion following the one-month-long rally. So far, the pair is holding above vital converged support on a horizontal trendline since June (at about 144.50), near the 200-period moving average. However, any break below would be a confirmation that the uptrend from July had changed.

EUR/JPY 240-Minute Chart

image2.png


EUR/JPY: Risks a minor double top

EUR/JPY is testing crucial support at the late-August low of 156.85, coinciding with the 200-period moving average on the 240-minute charts. Any break below would trigger a double top (the August highs), with a potential price objective of around 154.00. Having said that, any retreat is unlikely to pose a threat to the broader EUR/JPY uptrend while the cross holds above the July low of 151.50.

MXN/JPY Monthly Chart

image3.png

MXN/JPY: Consolidation may have started

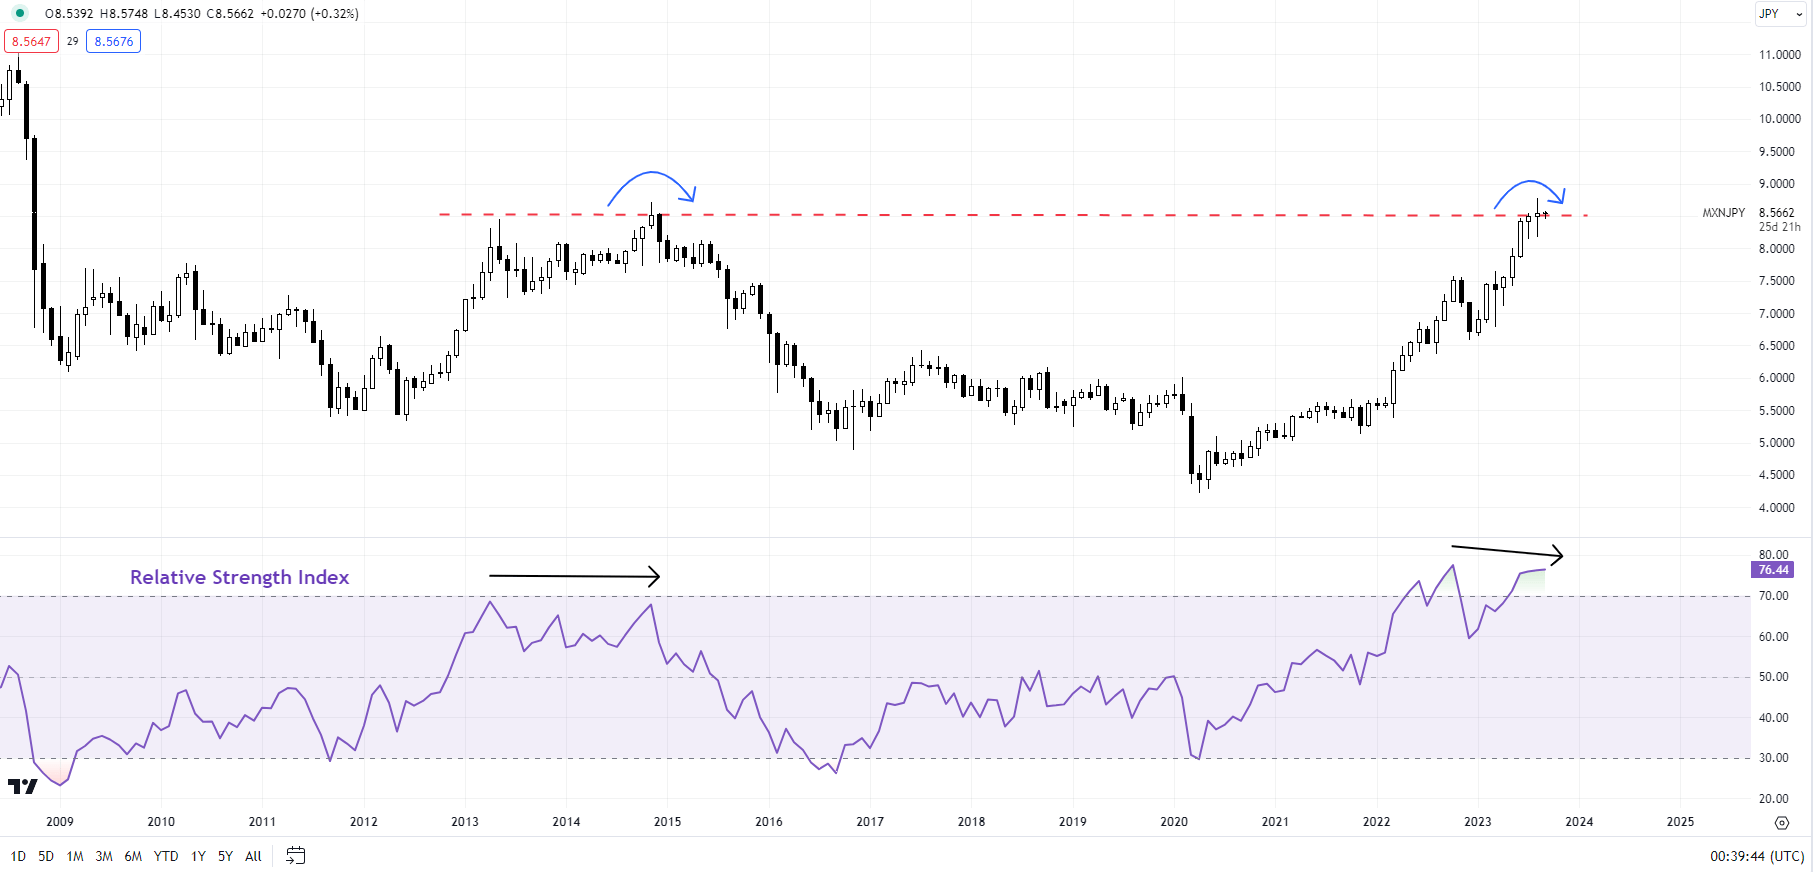
Cracks in the 3.5-year rally appear to be finally emerging on MXN/JPY charts. A doji candlestick pattern and a potential negative divergence on the monthly charts suggest the cross rally is losing steam as it faces major resistance at the 2014 high of 8.72. The fall below minor support at the end-August low of 8.65 on the 240-minute charts is a sign that the upward pressure is fading. Any fall below the 200-period moving average on the 240-minute chart could pave the way toward strong support at the July low of 8.05.

Crude Oil Flies High with Markets Eyeing a Fed Pause. Will WTI Go Higher?

Crude Oil Flies High with Markets Eyeing a Fed Pause. Will WTI Go Higher?

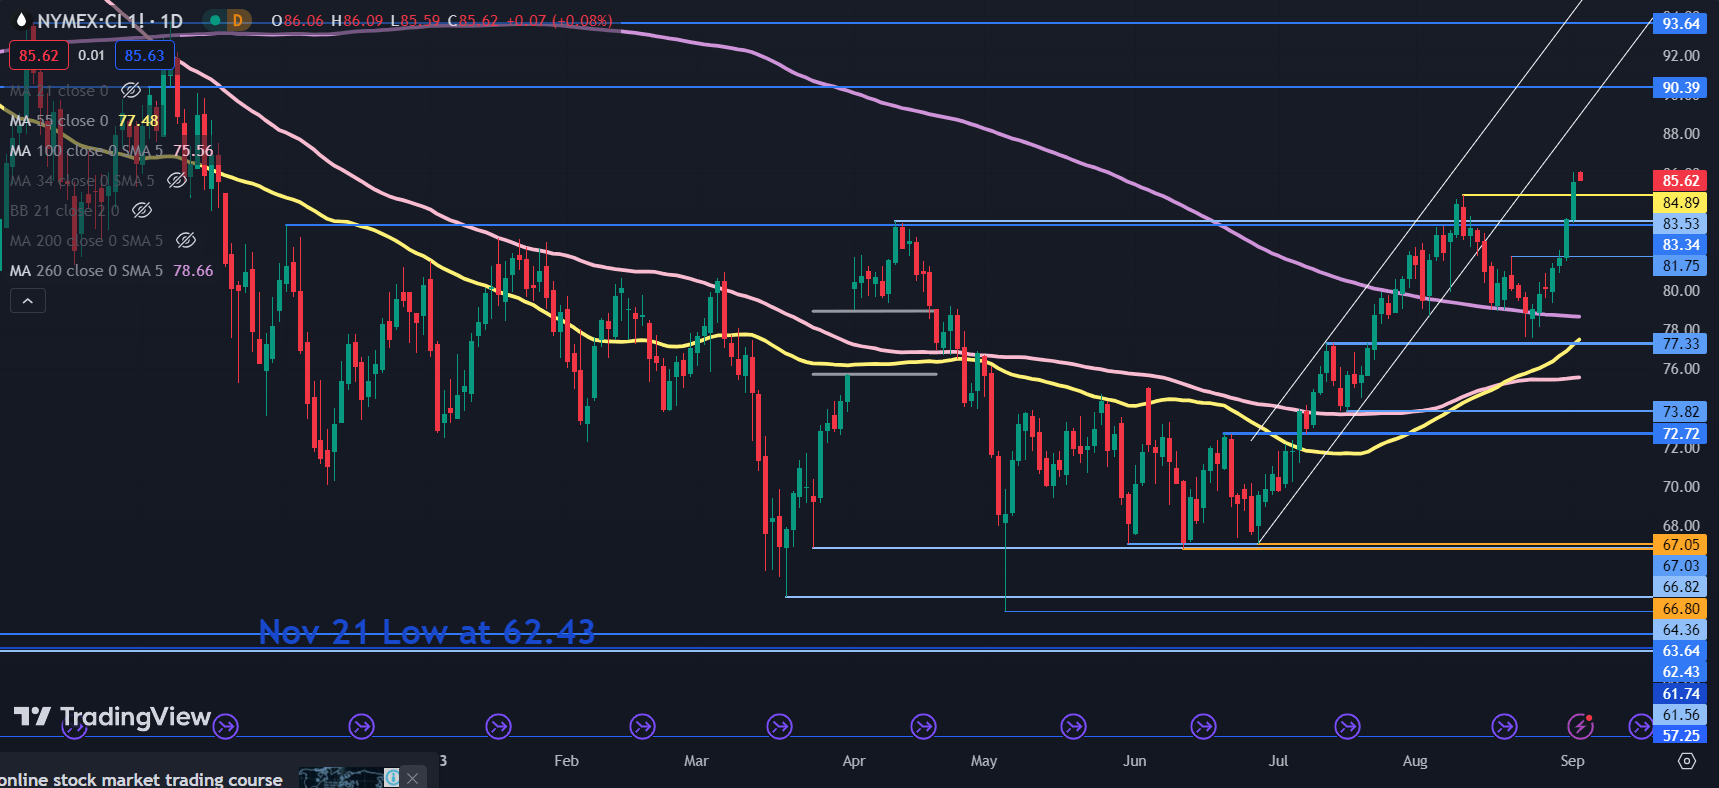
The crude oil price is holding onto loft levels going into a new week of trading after making fresh highs on Friday with markets mostly seeing a good US jobs report.

The WTI futures contract made a 10-month peak at US$ 86.09 while the Brent contract traded above US$ 89 for the first time since January.

Production cut announcements from Saudi Arabia and Russia exasperated a fragile market after US inventory data revealed a surprising run down of stocks over the week prior.

Last week, the American Petroleum Institute (API) inventory report showed -11.486 million fewer barrels, while the US Energy Information Agency (EIA) weekly petroleum status report revealed a notable drop of -10.584 million barrels.

Friday’s US non-farm payrolls (NFP) were seen as positive overall with more jobs added than anticipated but the unemployment rate saw an uptick.

This was due to a higher participation rate and some downward revisions to prior readings. At the end of the day, the Fed is now widely forecast to remain on hold at its Federal Open Market Committee (FOMC) meeting later this month.

image1.png

The US is on its Labour Day holiday today and cash Treasury markets are closed but bond futures are pointing toward a slight uptick in yields. Canada is also on a Labour Day break.

The US Dollar is little changed although generally slightly weaker on Monday, but APAC equities have seen a good day.

Of the main indices, Hong Kong’s Hang Seng Index (HSI) has led the way higher, up over 2.5% today.

Metals markets are firm again after solid gains last week. Spot gold continues to trade near US$ 1,940 an ounce.

Looking ahead for the week, the RBA and Bank of Canada will be making interest rate decisions on Tuesday and Wednesday respectively.

The ASEAN summit in Jakarta gets underway tomorrow and the G-20 will start later in the week in New Delhi.

Seven Fed speakers are due to give thoughts publicly throughout the week but closer at hand, ECB President Christine Lagarde will be talking later today.

WTI CRUDE OIL TECHNICAL ANALYSIS SNAPSHOT

The WTI futures contract has eased today after making a stellar run higher last week, eclipsing the mid-August peak to trade as high as 86.09.

Resistance could be at the breakpoint of 90.39 or at the twin peaks near 93.74.

On the downside, support may lie at the breakpoints near 84.90, 83.50, 84.30 and 81.75.

Further down, there is a breakpoint, prior low and the 55-day simple moving average (SMA) in the 77.30 77.50 area which might provide a support zone.

To learn more about breakout trading, click on the banner under the chart.

image2.png

EUR/USD Price Forecast: Euro Upside Could be Temporary

EUR/USD Price Forecast: Euro Upside Could be Temporary

EURO FUNDAMENTAL BACKDROP

The euro is marginally bid this Monday morning after last week’s Non-Farm Payroll (NFP) report saw markets rally behind the US dollar. Today’s volumes are likely to be relatively tame with the US and Canada celebrating Labor Day. That being said, the euro area has several potentially market moving events scattered throughout the day beginning with German balance of trade which showed exports slowing (see economic calendar below), highlighting economic growth concerns for the Eurozone’s largest economy. The result was a reduction in balance of trade numbers to €15.9B.

Central bank speakers will be the focal point for today with European Central Bank (ECB) Speakers scheduled to speak including President Christine Lagarde. Over the weekend, the ECB’s Wunsch reiterated a hawkish stance and it will be interesting to see whether or not today’s addresses follow a similar viewpoint.

EUR/USD ECONOMIC CALENDAR (GMT +02:00)

image1.png

This may be the last chance for the ECB to hike rate in what is a slowing EZ economy in the September meeting but it seems as if market pricing favors a pause (refer to table below) with a +/-76% probability.

ECB INTEREST RATE PROBABILITIES

image2.png

TECHNICAL ANALYSIS

EUR/USD WEEKLY CHART

image3.png

The weekly EUR/USD above is currently sandwiched between the 50-week moving average (yellow) and 200-week moving average (blue) with the prior week’s candle closing with a long upper wick (red). Traditionally, this would point to subsequent downside to come and could coincide with a weekly close below the 50-week MA.

EUR/USD DAILY CHART

image4.png

Shorter-term daily EUR/USD price action remains below the 1.0800 psychological handle with bears eyeing the 1.0767 swing low.

7 Step Trading Checklist Before Entering Any Trade

7 Step Trading Checklist Before Entering Any Trade

Why You Should Use a Trading Checklist

Implementing a trading checklist is a vital part of the trading process because it helps traders to stay disciplined, stick to the trading plan, and builds confidence. Maintaining a trading checklist presents traders with a list of questions that traders need to answer before executing trades.

It is important not to confuse a trading plan with the trading checklist. The trading plan deals with the big picture, for example, the market you are trading and the analytical approach you choose to follow. The trading checklist focuses on each individual trade and the conditions that must be met before the trade can be made.

Your Trading Checklist

Before entering a trade, ask yourself the following questions:

  1. Is the market trending or ranging?
  2. Is there a significant level of support or resistance nearby?
  3. Is the trade confirmed by an indicator?
  4. What is the risk to reward ratio?
  5. How much capital am I risking?
  6. Are there any significant economic releases that can impact the trade?
  7. Am I following the trading plan?

1) Is the Market Trending or Ranging?

Trending markets

Experienced traders know that finding a strong trend and trading in the trend’s direction, has the potential to lead to higher probability trades.

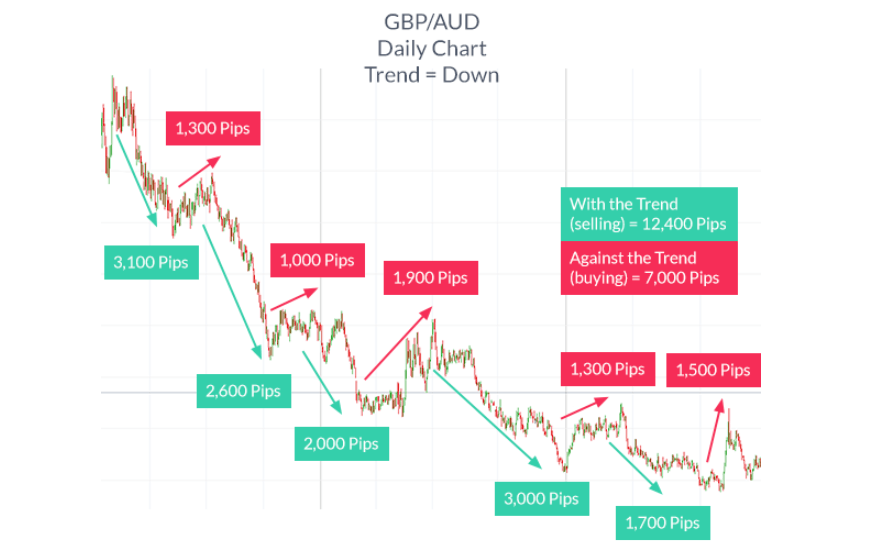
There is a well-known saying that trending markets have the ability to bail traders out of bad entries. As can be seen below, even if a trader entered a short trade after the trend was well established, the trend would continue to provide more pips to the downside than to the upside.

Traders need to ask themselves if the market is exhibiting signs of a strong trend and whether ‘trend trading’ forms part of the trading plan.

Trend trading where there are more pips available in the direction of the trend

Ranging markets

Ranging markets tend to see price bounce between support and resistance to trade within a channel. Certain markets, like the Asian trading session, tend to trade in ranges. Oscillating indicators (RSI, CCI and Stochastic) can be of great use to traders that focus on range trading.

Range trading

2) Is there a significant level of support or resistance nearby?

Price action tends to respect certain price levels for a number of reasons and being able to identify these levels is key. Traders do not want to be holding a short position after price has dropped to the key level of support, only to bounce back higher.

Key level of support EUR/USD

The same applies when price approaches a key level of resistance and typically drops lower shortly after. Trend traders typically look for sustained breaks of these levels as an indication that the market may start to trend. Range traders will on the other hand, look for price to bounce between support and resistance for prolonged periods.

3) Is the trade confirmed by an indicator?

Indicators assist traders in confirming high probability trades. Depending on the trading plan and strategy, traders will have one or two indicators that complement the trading strategy. Do not fall into the trap of over-complicating the analysis by adding multiple indicators to a single chart. Keep the analysis clean and simple and easy to view at a glance.

4) What is the risk to reward ratio?

The risk to reward ratio is the ratio of the number of pips that traders will risk in the hopes of reaching the target. According to our Traits of Successful Traders research, which analysed over 30 million live trades, traders with a positive risk to reward ratio were nearly three times more likely to be profitable than those who do not. For example, a 1:2 ratio means that a trader risks half of what he/she stands to gain if the trade works out. The image below further depicts this principle.

risk to reward ratio good vs bad

5) How much capital am I risking?

It is essential for traders to ask this question. Often traders blow up their accounts by leveraging the account to the maximum when chasing “sure things”. One way to avoid this is to limit the leverage used on all trades to ten to one, or less. Another helpful tip is to set stops on all trades and ensure that the aggregate amount risked is no more then 5% of the account balance.

Before placing a trade, ask yourself, “how much capital should I use?”

6) Are there any significant economic releases that can impact the trade?

Sudden market news has the potential to invalidate the “perfect” trade. While it is almost impossible to anticipate things like, acts of terror, natural disasters or systemic failures in the financial markets, traders can plan for economic releases like NFP, CPI, PMI and GDP releases.

Plan ahead by viewing our economic calendar which highlights major economic releases from the top trading nations

7) Am I following the trading plan?

All of the above is of very little use if it does not tie in with the trading plan. Deviating from the trading plan will result in mixed results and only frustrate the trading process. Keep to the trading plan and do not place trades unless the trading checklist has been completed and confirms the trade may be executed.

Gold Price Forecast – Gold Markets See a Lift After Jobs Figure

Gold Price Forecast – Gold Markets See a Lift After Jobs Figure

Gold Market Technical Analysis

Gold markets got a little bit of a boost during the Friday session after the Non-Farm Payrolls announcement came out, giving us a little bit of a heads up as to what inflation might be doing. After all, if the average hourly earnings in the United States are dropping, that’s a big boost for the inflation plan, and at the same time we are seeing more jobs added then initially thought, it means that the Fed is perhaps strengthening the case for a “soft landing”, as they bring down inflation without wrecking the jobs market. While this has never been done in the past, one thing is for sure, economic action as of late has been all over the place.

Trading Derivatives carries a high level of risk to your capital and you should only trade with money you can afford to lose. Trading Derivatives may not be suitable for all investors, so please ensure that you fully understand the risks involved, and seek independent advice if necessary. A Product Disclosure Statement (PDS) can be obtained either from this website or on request from our offices and should be considered before entering into a transaction with us. Raw Spread accounts offer spreads from 0.0 pips with a commission charge of USD $3.50 per 100k traded. Standard account offer spreads from 1 pips with no additional commission charges. Spreads on CFD indices start at 0.4 points. The information on this site is not directed at residents in any country or jurisdiction where such distribution or use would be contrary to local law or regulation.

Underneath, we have the 50-Day EMA, which is a technical indicator that a lot of people will pay close attention to near the $1950 region. Just above, we have the $2000 level which could cause a significant amount of resistance, and therefore you could see a little bit of a pullback as a result. That being said, I do think that it is probably only a matter of time before we try to break through that level. If we can, then the market is likely to go looking toward the $2100 level. Underneath, if we were to break down below the 50-Day EMA, then we could drop down to the $1925 level, which also has the 200-Day EMA in that region, which also expands support all the way down to the $1900 level. In other words, I do think that the downside is somewhat limited, but at this point we also have the worry about whether or not we can break out to the upside.

Keep in mind that the bond market will be a major influence on where we go, and rising yields would be bad for gold. However, gold has seen yields fall rather drastically during the trading session on Friday, supercharging the momentum to the upside, at least in the short term. You should also keep in mind that Monday is Labor Day, so that will have a major influence on whether or not there’s going to be any liquidity. At this point, it looks like we are going to try to get to the $2000 level.

US Dollar Index News: Unexpected Unemployment Spike Shakes DXY

US Dollar Index News: Unexpected Unemployment Spike Shakes DXY

Mixed Jobs Data Sends U.S. Dollar Tumbling, Fed Rate Hike in Question

The U.S. Dollar took a nosedive against major currencies last Friday, rattled by an unexpected rise in unemployment. Despite a robust addition of jobs in August, the market is speculating that the Federal Reserve might pause its cycle of interest rate hikes.

The Conflicting Landscape of the U.S. Job Market

The U.S. economy added a hearty 187,000 jobs in August, outperforming Dow Jones estimates of 170,000. However, this robust growth was overshadowed by an increase in the unemployment rate to 3.8%—the highest since February 2022. The labor force participation rate also surged to its highest level since just before the pandemic, clocking in at 62.8%. As for earnings, they lagged behind expectations, with average hourly earnings rising only 0.2% for the month, well below the forecast of 0.3%.

Trading Derivatives carries a high level of risk to your capital and you should only trade with money you can afford to lose. Trading Derivatives may not be suitable for all investors, so please ensure that you fully understand the risks involved, and seek independent advice if necessary. A Product Disclosure Statement (PDS) can be obtained either from this website or on request from our offices and should be considered before entering into a transaction with us. Raw Spread accounts offer spreads from 0.0 pips with a commission charge of USD $3.50 per 100k traded. Standard account offer spreads from 1 pips with no additional commission charges. Spreads on CFD indices start at 0.4 points. The information on this site is not directed at residents in any country or jurisdiction where such distribution or use would be contrary to local law or regulation.

Revisions and Volatility: A Closer Look

The employment landscape wasn’t all rosy. Job growth numbers for previous months took a hit, with July and June’s figures being revised downward by 30,000 and 80,000 respectively. This comes on top of an increase in the number of unemployed individuals by 514,000. The uncertainty surrounding jobs data for August, a historically volatile month, adds another layer of complexity to the labor market outlook.

The Broader Economic Picture

The U.S. economy is sending mixed signals, making it hard for Federal Reserve officials to chart a steady course. While consumer spending remains strong, inflation shows signs of cooling down. The Fed’s preferred measure of inflation, personal consumption expenditures prices, rose by just 0.2% in July. Job openings have fallen but remain at historically high levels. The GDP growth rate for Q2 was revised to 2.1%, although the Atlanta Fed predicts a robust 5.6% growth for Q3, countering recession fears.

What’s Next? A Bullish or Bearish Outlook?

Given the complexities of the current job market and broader economic indicators, it’s more likely that the Fed will pause its rate hikes, at least for the near term. Market expectations for a rate increase in the Fed’s upcoming September meeting have dampened, although there is still a 47% probability of a final hike come late October to early November. For now, the outlook is cautiously bearish for the U.S. Dollar, as traders grapple with the mixed economic signals.