Asia Day Ahead: RBA rate decision ahead, VIX hovers near year-to-date low

Asia Day Ahead: RBA rate decision ahead, VIX hovers near year-to-date low

With the US shut for Labour Day holiday, European indices were largely subdued overnight on some wait-and-see, failing to tap on gains in the earlier Asian session. European bond yields edged slightly higher, largely following through from last Friday’s moves. Despite the softer read in the recent US jobs report, the resilience in US Treasury yields to end last week seems to reflect some positioning for a high-for-longer rate outlook, potentially making provisions for upside risks to inflation ahead with higher oil prices and abating base effects.

As the US markets return to trading today, clearer indications for the risk environment may be presented, with US equity futures just slightly underwater at the time of writing. Perhaps one to watch ahead may be the VIX, which has recently declined for six straight days to hover near its year-to-date low at the 15.30 level.

Current VIX levels still point towards a general risk-on environment, but given its negative correlation with the stock market, any attempt to bounce from its immediate horizontal support could translate to near-term downside pressure for US indices. On the other hand, a break to a new year-to-low could indicate abating stress for markets, with any move below the 15.30 level potentially paving the way to retest its 2018 low at the 13.50 level next.
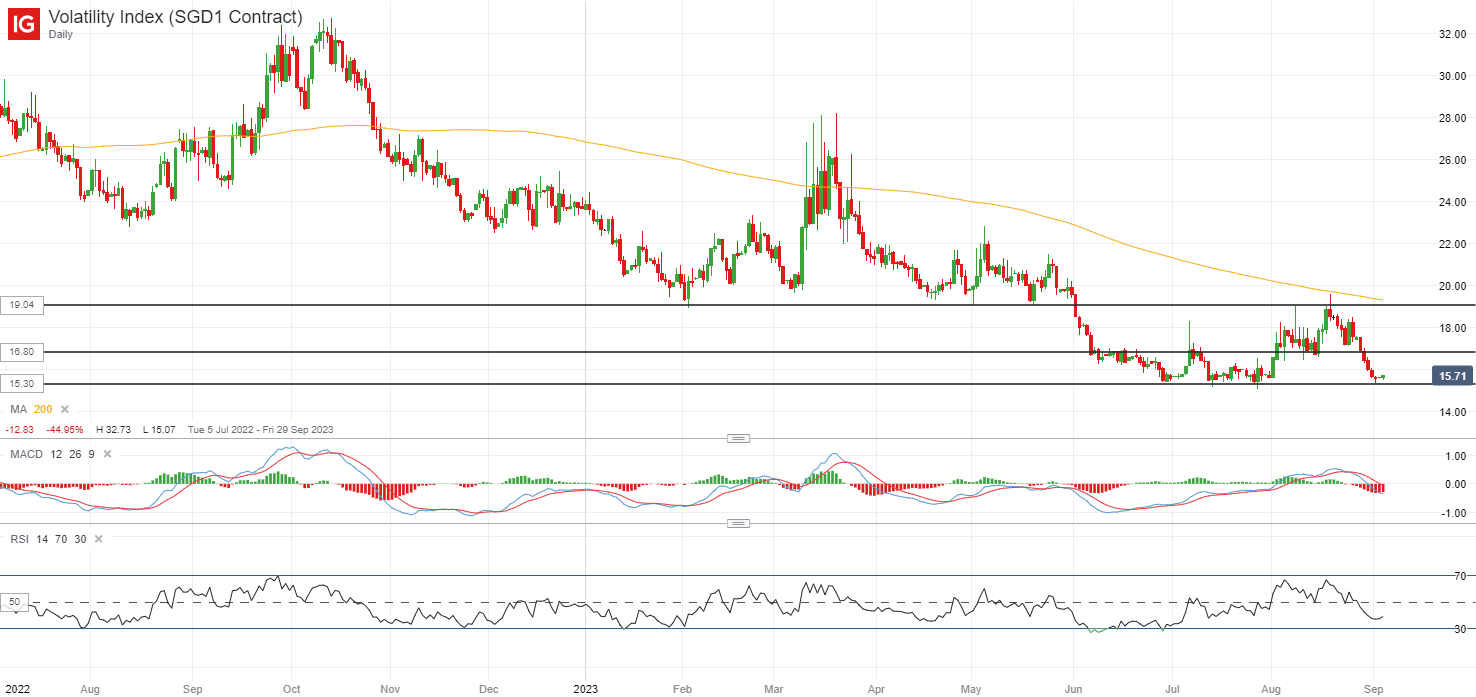
image1.png

Source: IG charts

Asia Open

Asian stocks look set for a downbeat open, with Nikkei -0.12%, ASX -0.57% and KOSPI -0.26% at the time of writing. Recent property support measures have brought a relief rally for Chinese equities in yesterday’s session, with the Hang Seng Index up 2.5%. But as with the series of support measures that we have seen so far, whether gains can be sustained will still depend on the degree of policy success in translating to a turnaround in economic conditions ahead.

Today will leave the Reserve Bank of Australia (RBA) interest rate decision on the radar. Recent downside surprise in Australia’s inflation and weaker purchasing managers index (PMI) data have offered room for the central bank to keep rates on hold at the upcoming meeting, which is also the wide market consensus.

The focus instead may be on whether recent progress in inflation is sufficient to soften the RBA’s hawkish stance, given that there are still some hawkish bets in place that the RBA may have to tighten by another 25 basis-point (bp) by the end of this year.

The AUD/USD has attempted to recover last week alongside the broader risk environment, but much may still await for now, having just reached the 23.6% Fibonacci level of retracement from its July peak to August 2023 bottom. While a bullish crossover on MACD was presented in the daily chart, the risks of a bearish flag formation remain, with a retest of the 0.650 level last Friday met with a bearish rejection. Any breakdown of the upward-sloping consolidation channel may pave the way for a continuation of the downward trend, while on the upside, the last Friday’s high may have to be overcome to signal buyers in greater control.
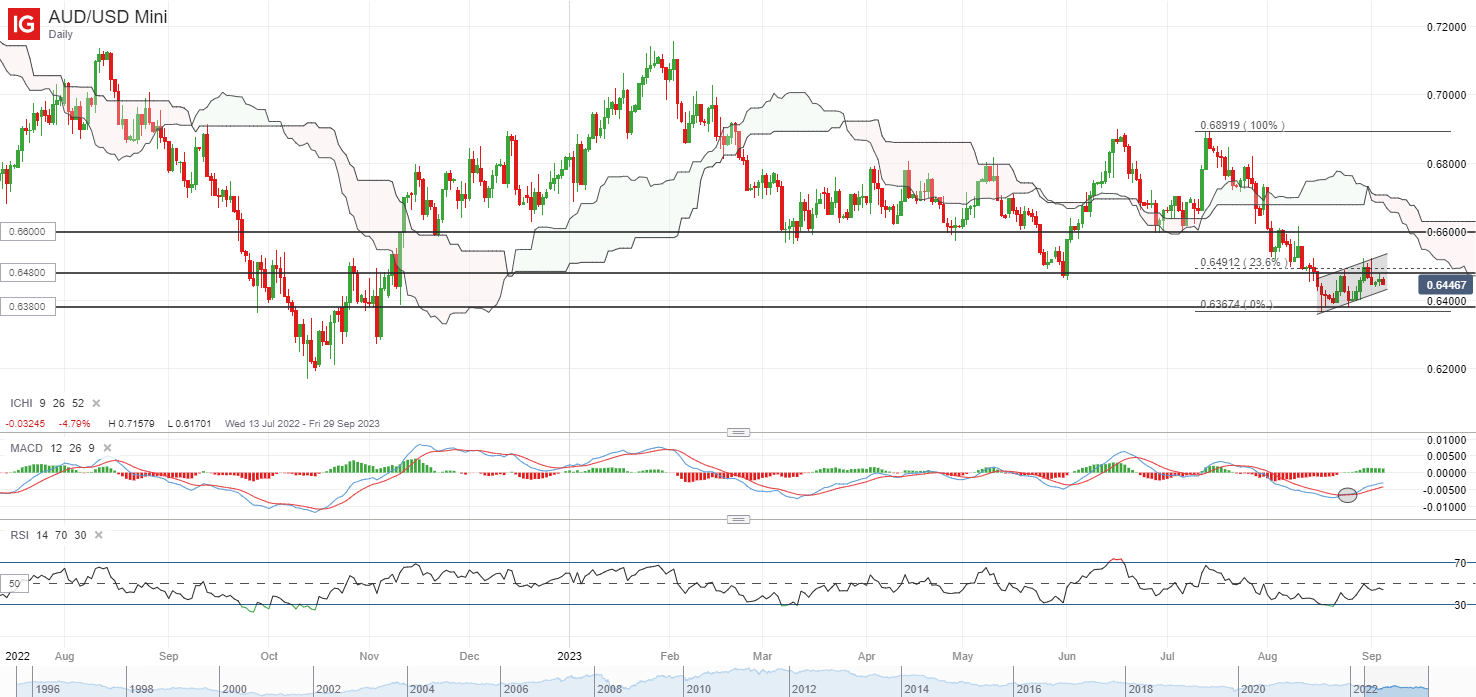
image2.png

Source: IG charts

On the watchlist: GBP/USD struggling to bounce off head-and-shoulder neckline for now

Having traded within a head-and-shoulder formation on the daily chart since June this year, recent attempt to bounce off the neckline at the 1.260 level has failed to find much follow-through amid strength in the US dollar to end last week.

On the daily chart, the RSI has struggled to cross back above the key 50 level over the past month, while the pair seems to be finding some resistance at the lower edge of its Ichimoku cloud pattern after a breakdown in late-August. The head-and-shoulder neckline at the 1.260 level is put to the test once again this week, with any failure to defend the level potentially paving the way towards the 1.231 level.
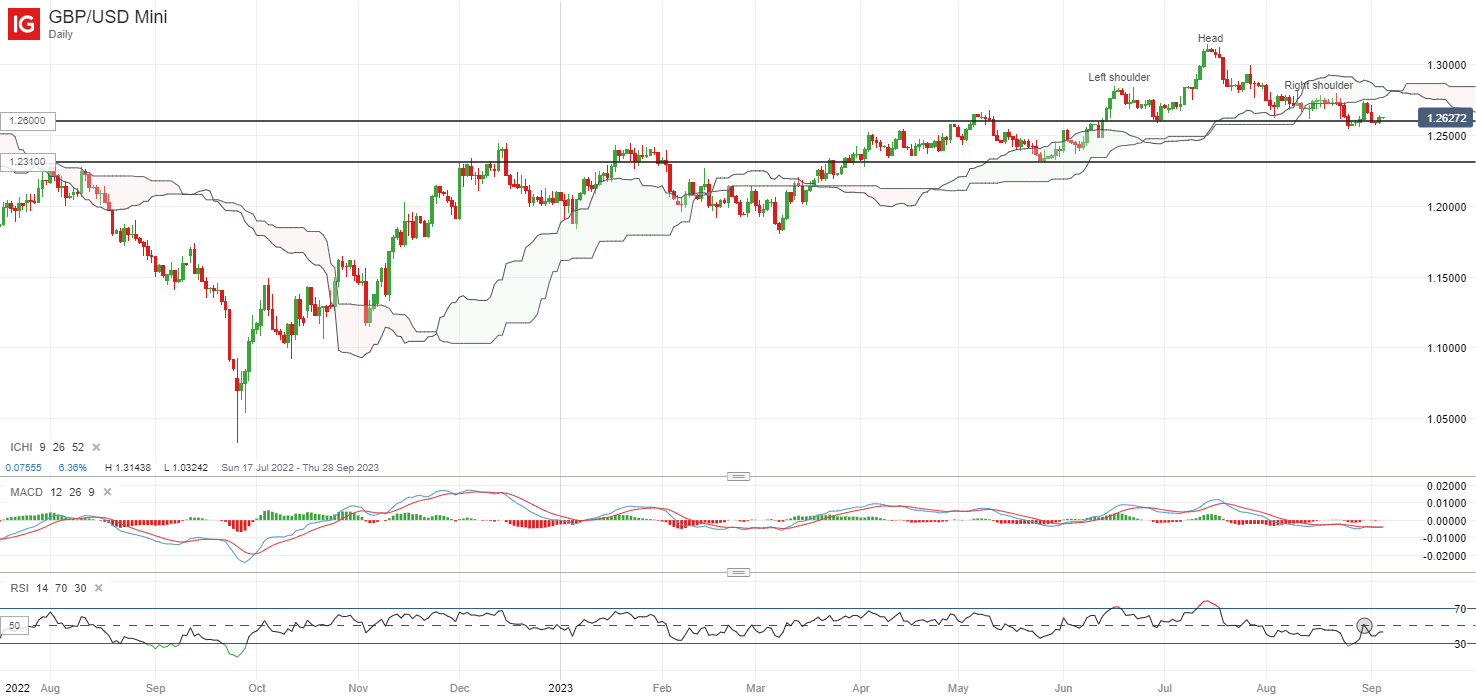
image3.png

Source: IG charts
MFF My Forex Funds Prop Firm Shutdown: What Happened?

MFF My Forex Funds Prop Firm Shutdown: What Happened?

In an unexpected turn of events, My Forex Funds, a well-known prop trading firm, faced an abrupt shutdown. Traders and investors associated with the firm were left bewildered as they received the news that provincial securities regulators in Canada and commodities regulators in the United States had issued orders preventing the firm from trading securities or accessing its bank accounts.

This sudden and drastic move has effectively frozen the operations of My Forex Funds. Traders are unable to access their funds, and the future of the firm hangs in the balance until these freeze orders are lifted or modified.

What Led to the Shutdown?

As of now, specific details about the concerns raised by regulators remain undisclosed. However, My Forex Funds has pledged to engage with these regulatory bodies to address their concerns. The first crucial step in this process will take place on September 11 in the United States, with another hearing scheduled later that same week in Canada. It is during these hearings that the fate of the freeze orders will be determined.

Turning to OFP: A Prop Firm You Can Trust

At times like these, traders are understandably concerned about the security and stability of their trading partners. If you’re a trader seeking a prop firm that abides by regulations and prioritizes the safety of your investments, consider OFP.

Unlike some firms, OFP is dedicated to maintaining a strong commitment to regulatory compliance and ensuring that traders’ interests are protected. We understand the importance of transparent and ethical business practices, and we are here to provide a stable trading environment for traders looking for a reliable partner in the industry.

In the midst of uncertainty, remember that there are prop firms like OFP that prioritize your peace of mind and security. We will not leave traders hanging, and we remain committed to upholding the highest standards of integrity in the trading world.

As My Forex Funds navigates the challenges ahead, we extend our support and encourage traders to explore the secure and compliant trading environment that we provide. Your trading journey is important to us, and we are here to help you succeed.

US Dollar Struggles at Resistance Amid Softening Data; EUR/USD, GBP/USD, USD/CAD

US Dollar Struggles at Resistance Amid Softening Data; EUR/USD, GBP/USD, USD/CAD

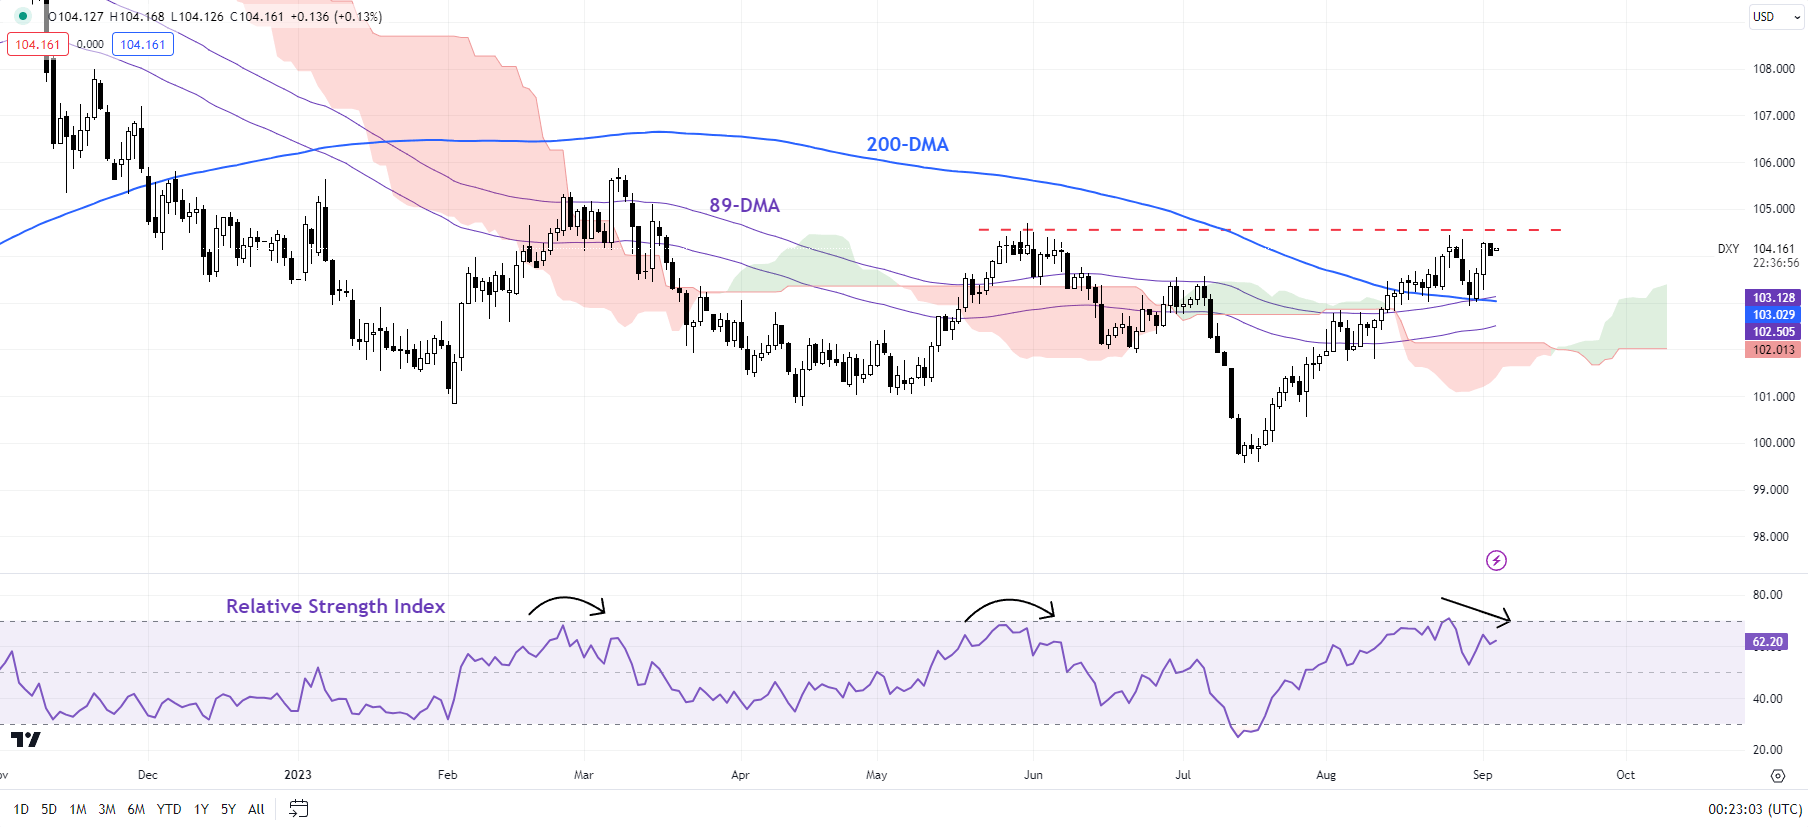
The recent struggle at key resistance reinforces the view that the US dollar’s (DXY Index) rally is losing steam as recent data eases concerns that the US economy is resurging.

The US Economic Surprise Index has rolled over from two-year highs in a sign that much of the optimism could be in the price. The ongoing disinflation coupled with early signs that the labor market could be cooling (unemployment jumped in August) has capped expectations of further tightening by the US Federal Reserve. Markets are now pricing in a more than 90% chance that the Fed will keep interest rates on hold when it meets later this month, with around 60% chance of no more rate hikes this year.

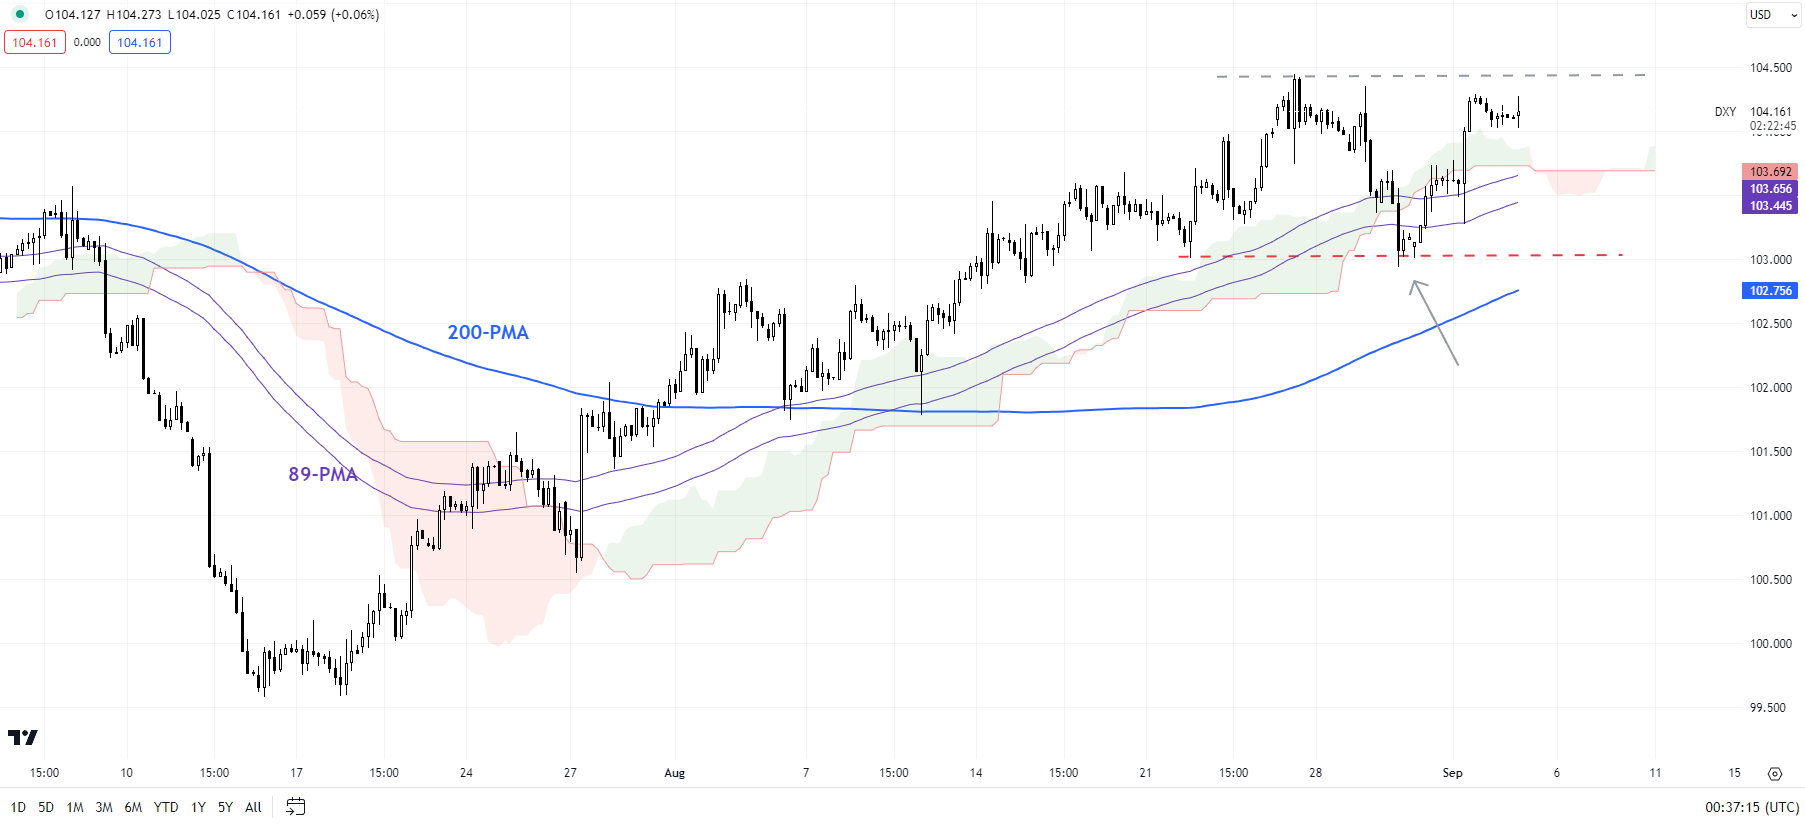
Moreover, the rapid support measures in recent months by China to revive the economy are providing a floor to sentiment, at least for now, weighing on the greenback. Having said that, the DXY Index would need to fall below 102.50 103.00 for the uptrend to reverse. For more discussion, see the previous update “US Dollar Looks Tired Ahead of Jackson Hole: EUR/USD, GBP/USD, USD/JPY Price Setups,” published August 22.

DXY Index (USD) Daily Chart

image1.png

On technical charts, the short-term bullish pressure remains intact after the DXY Index (USD index) rebounded last week from quite a strong converged floor at 102.50-1.0300, including the 89-period moving average and the lower edge of the Ichimoku cloud on the 240-minute charts. As highlighted in a recent update, the index needs to fall below the support for the uptrend to change. See “US Dollar Toppish Ahead of Powell; EUR/USD, AUD/USD, GBP/USD Price Setups,” published August 24.

DXY Index (USD) 240-Minute Chart

image2.png

Chart Created by Manish Jaradi Using TradingView

Zooming out, the index has been struggling to clear past a tough barrier at the May high of 104.70, slightly above the 200-day moving average. Negative divergence on the daily charts (declining momentum associated with flat index levels) is a sign that the index lacks the strength to break past the barrier, raising the risk of a retreat. For more discussion, see “US Dollar Flirts with Resistance After Powell; EUR/USD, GBP/USD, AUD/USD Price Action,” published August 28.

EUR/USD Weekly Chart

image3.png

EUR/USD: Awaiting confirmation of a low

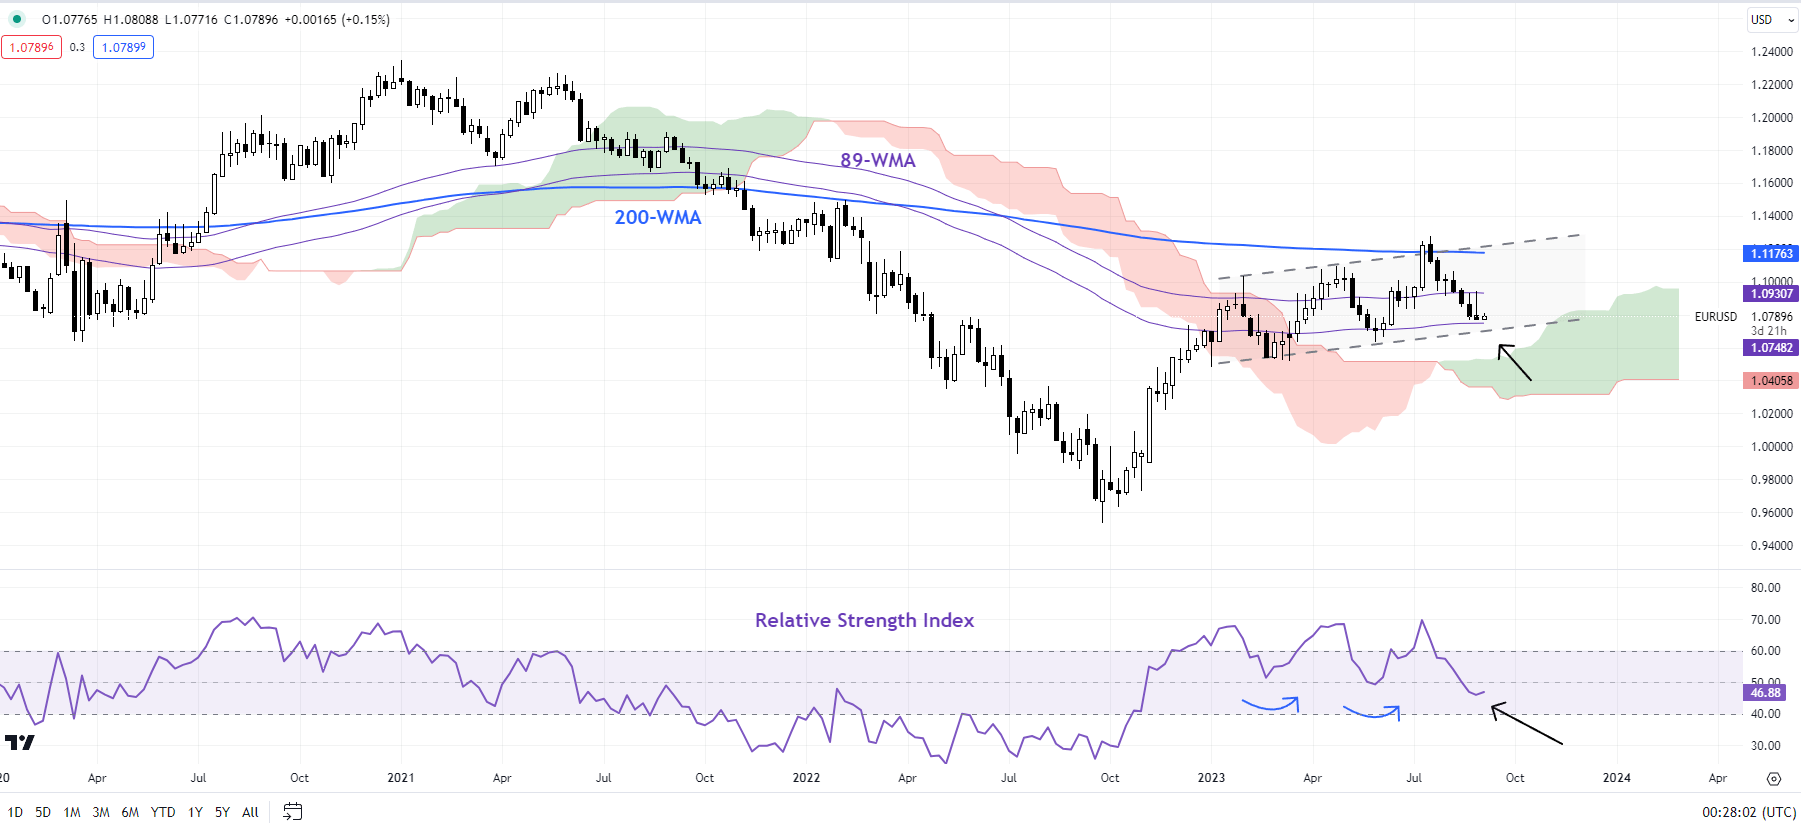
EUR/USD is near a fairly strong cushion on the 200-day moving average, coinciding with the lower edge of an upward-sloping channel, and the 89-week moving average. Despite the choppy price action since the beginning of 2023, the pair hasn’t made a lower low since late last year, suggesting that the broader bias remains up. However, any fall below 1.0500-1.0600 could threaten the uptrend. Meanwhile, EUR/USD is looking oversold, raising the prospect of a rebound. For any rebound to be material, the pair would need to cross above last week’s high of 1.0950.

GBP/USD Daily Chart

image4.png

GBPUSD: Settles in a range

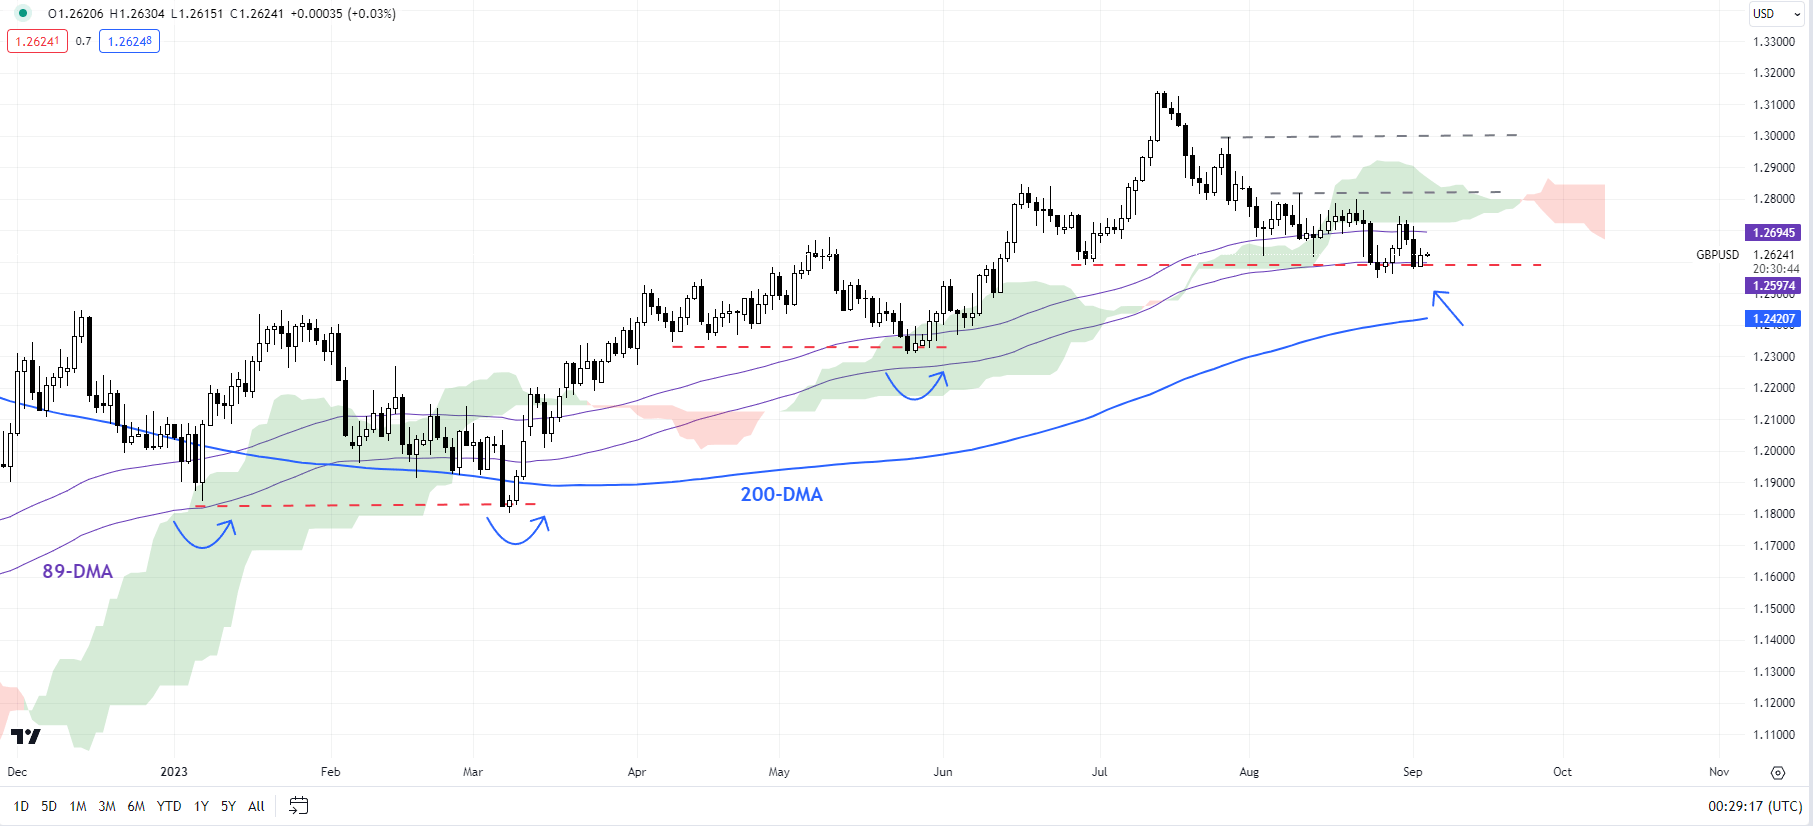
GBP/USD continues to be weighed by important immediate resistance at the August 10 high of 1.2820, slightly below another barrier at the end-July high of 1.3000, reinforcing the bigger-picture consolidation. For more discussion, see “Pound’s Resilience Masks Broader Fatigue: GBP/USD, EUR/GBP, GBP/JPY Setups,” published August 23. So far, the pair is holding above quite strong converged support at the end-June low of 1.2600, a shade above the 200-day moving average. Only a break below the May low of 1.2300 would disrupt the higher-low-higher-high sequence since late 2022. Until then, the trend could be sideways at best.

USD/CAD Weekly Chart

image5.png

USD/CAD: At a key threshold

USD/CAD is testing a crucial resistance at the Q2-2023 high of 1.3650. For the broader downward bias to remain intact, the pair needs to hold below this resistance. This follows a rebound in July from near-strong converged support on the 200-week moving average and the 89-week moving average. However, any break below last week’s low of 1.3500 would confirm that the short-term upward pressure had faded.

Australian Dollar Languishes Near Lows After RBA Pauses Again. Lower AUD/USD?

Australian Dollar Languishes Near Lows After RBA Pauses Again. Lower AUD/USD?

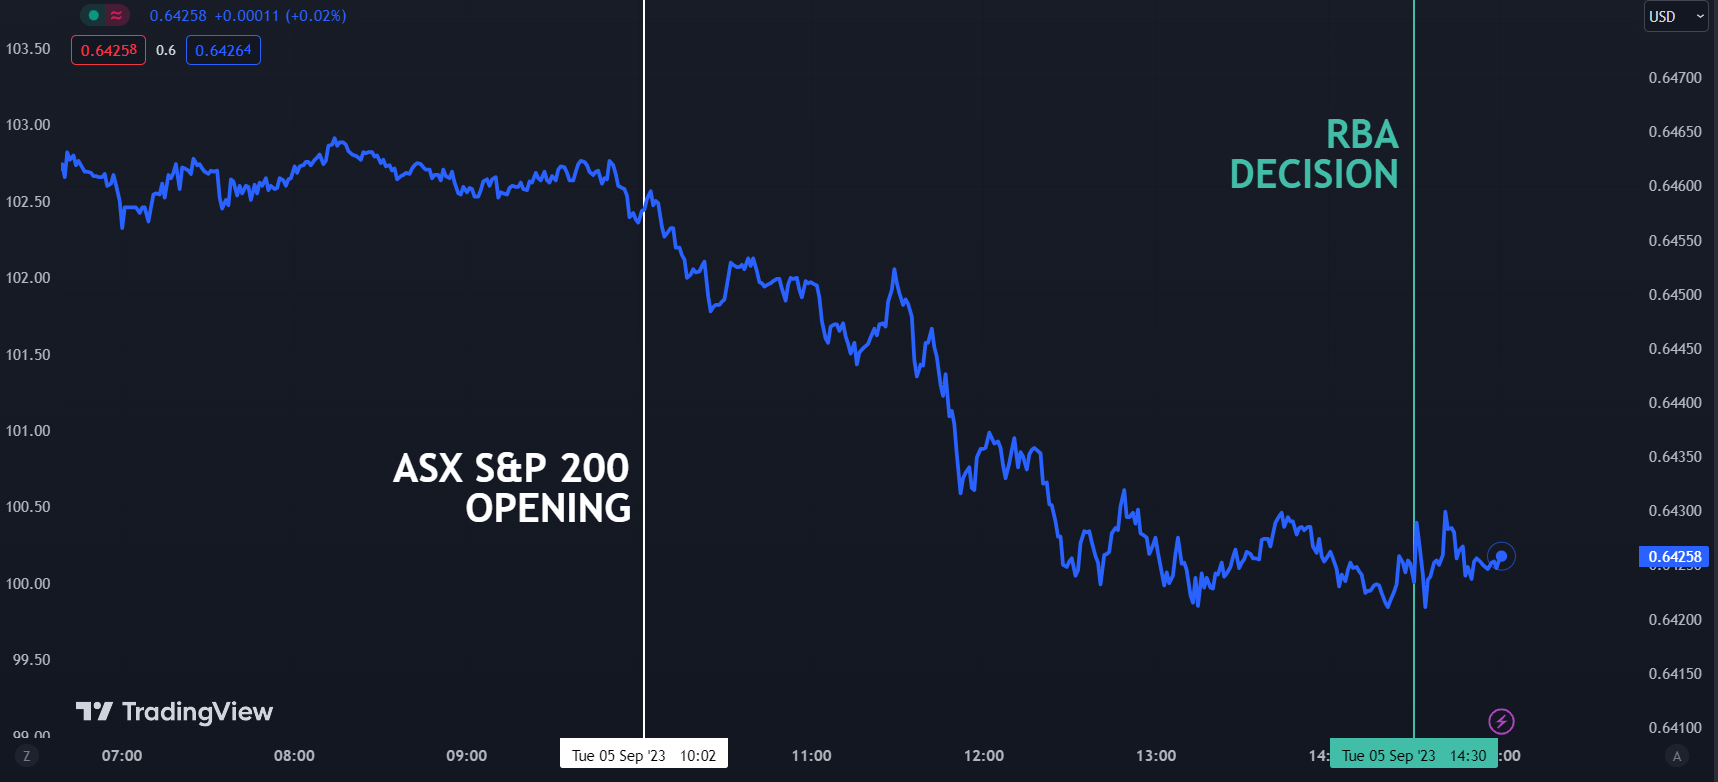
The Australian Dollar struggled to gain traction on Tuesday after the RBA left its cash rate at 4.10% as widely anticipated by the interest rate market and economists.

The Aussie had been battling going into the decision on slight risk aversion sentiment with equity markets seeing a soft day.

The ASX S&P 200 slid slightly lower from the open but steadied in the afternoon session and was little changed after the RBAs announcement.

The accompanying statement on the monetary policy decision by Governor Philip Lowe cited notable risks around services inflation, the uncertainty around the laggard effects of tighter policy, household consumption and the economic outlook for China given the problems in its property sector.

The statement noted, “Some further tightening of monetary policy may be required to ensure that inflation returns to target in a reasonable timeframe, but that will continue to depend upon the data and the evolving assessment of risks.”

This was Mr Lowe’s last decision as Governor, and he will hand over the reins in a fortnight to Michele Bullock.

Ms Bullock has been the Deputy Governor of the bank since April 2022 and has been with the institution since 1985. She has a reputation as a leading economist in her own right.

The appointment is mostly viewed as a steady transfer of leadership at a critical time for monetary policy at the RBA and her recent remarks point toward a similar approach to that of her predecessors.

Going into today’s monetary policy decision, AUD/USD had been slipping lower as the US Dollar strengthened across the board, despite a holiday there overnight.

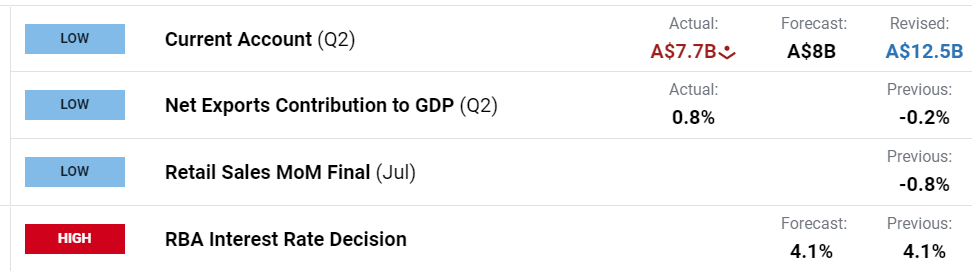
Perhaps undermining the Aussie, headline current account figures missed estimates earlier today. However, on closer inspection, the statistics could be seen as neutral, given the upward revisions to the prior reading.

In addition, net exports as a percentage of GDP were robust through the second quarter. This points towards another stellar trade surplus that will be released on Thursday.

AUSTRALIAN DATA TODAY

image1.png

Elsewhere in Asia today, China’s attempts to reignite its economy continue to struggle to get off the ground with the Caixin services PMI missing estimates today, further highlighting the RBA’s concerns.

It came in at 51.8 for June, rather than the 53.5 anticipated and 54.1 previously. The composite PMI was 51.7 against 51.9 prior.

On Wednesday, 2Q Australian quarter-on-quarter GDP is forecast to be 0.3% against 0.2% previously.

Annual GDP to the end of July is anticipated to be 1.8% against the prior read of 2.3% as the base effect kicks in.

The full economic calendar can be viewed here.

AUD/USD 1 MINUTE CHART PRICE REACTION TO RBA HIKE

Live prices can be found here.

image2.png


Bitcoin & Ethereum Influenced by Thick Cloud Cover; BTC/USD & ETH/USD Price Setups

Bitcoin & Ethereum Influenced by Thick Cloud Cover; BTC/USD & ETH/USD Price Setups

BITCOIN: Not out of the woods yet

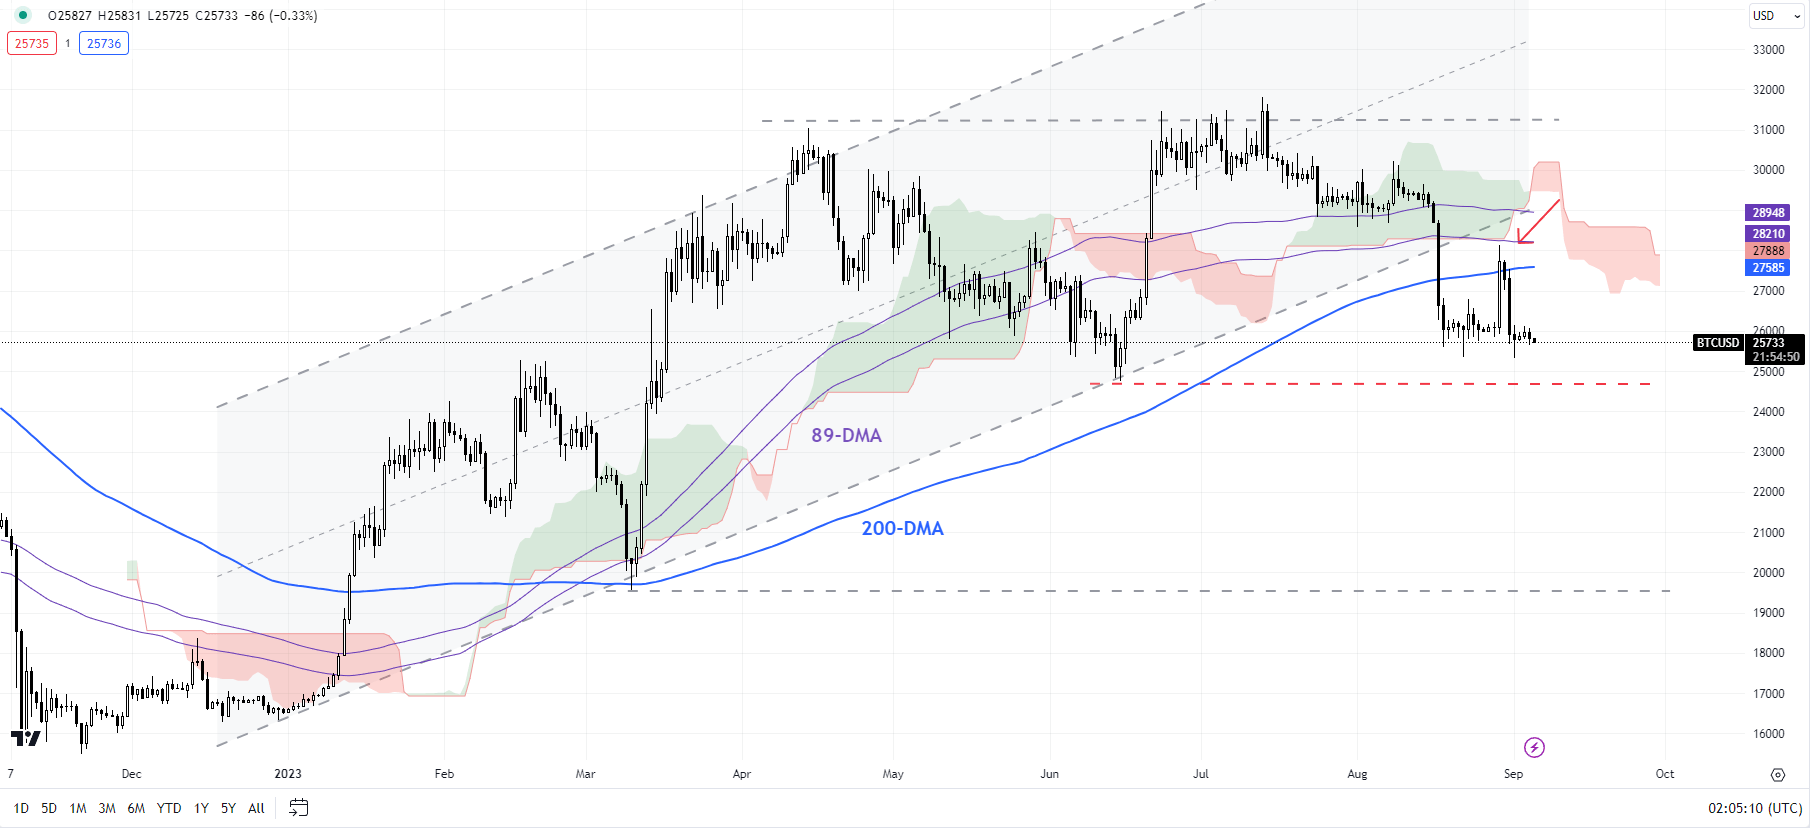
Last week’s early bounce was short-lived after the Securities and Exchange Commission (SEC) delayed making any decision on Bitcoin ETF applications. While many remain hopeful of an eventual blessing from the agency, the optimism isn’t being reflected on the technical charts of BTC/USD just yet.

BTC/USD Weekly Chart

image1.png

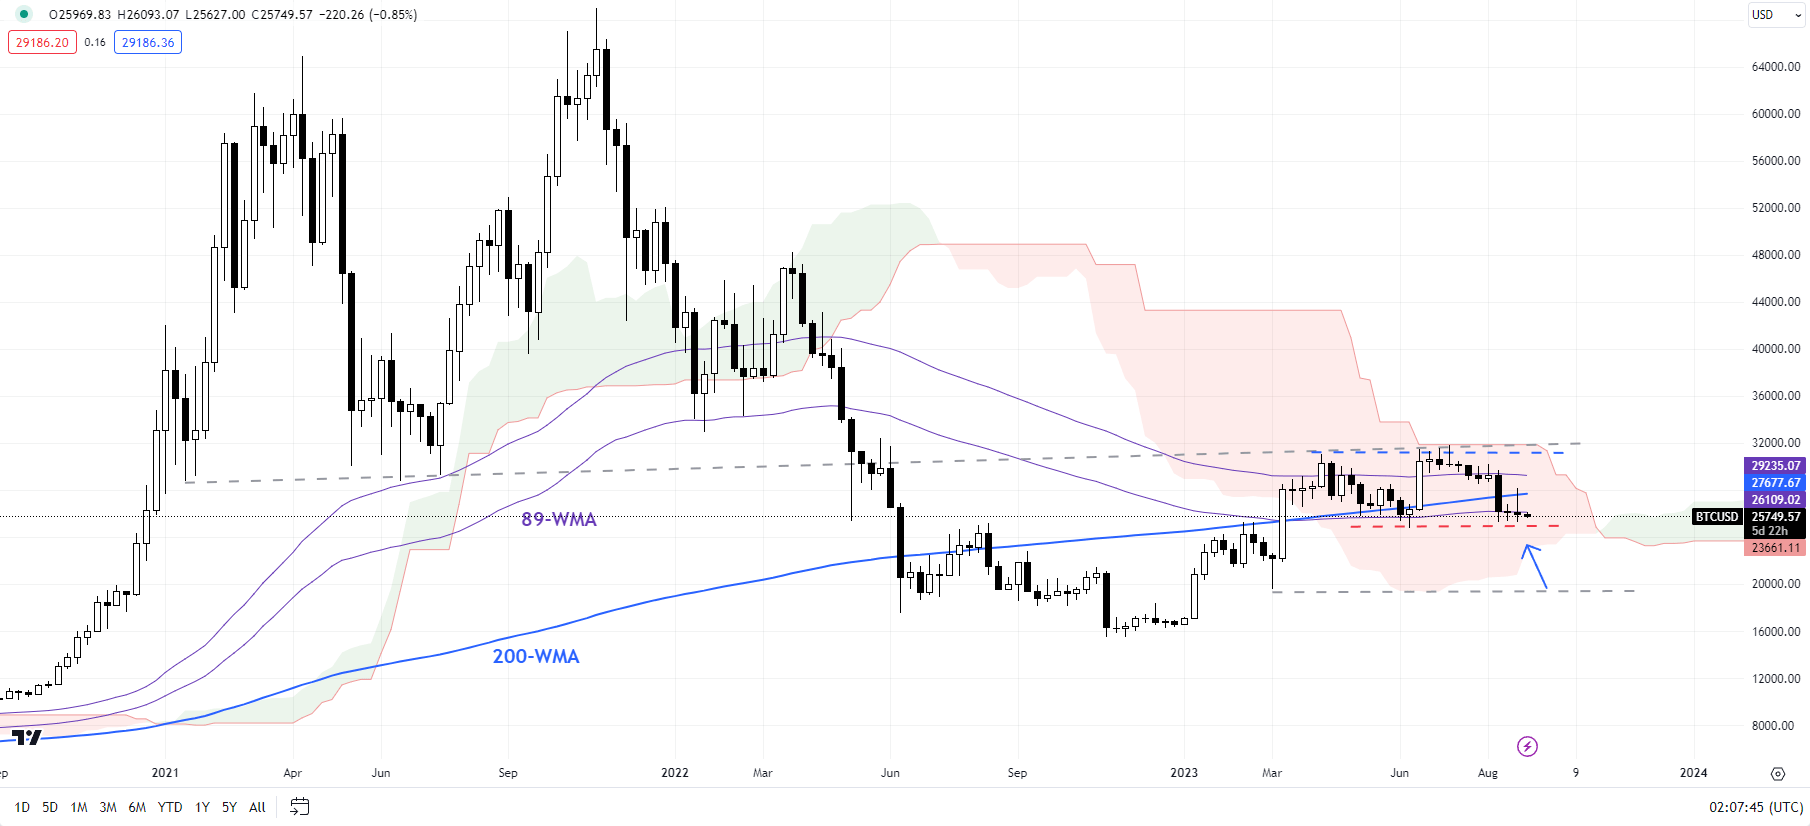
BTC/USD is now testing key support at the June low of 24750 – this support is crucial as a break below would disrupt the higher-highs-higher-lows sequence since late 2022. Furthermore, such a break would trigger a double top (the April and July highs), pointing to a deeper retracement toward the March low of 19550.

BTC/USD Daily Chart

image2.png

The recent weakness follows an inability to rise past the upper edge of the Ichimoku cloud on the weekly charts, roughly coinciding with a slightly upward-sloping trendline from 2021 and the 89-week moving average. For more discussion, see “Bitcoin & Ethereum Hold Ground Ahead of US CPI: BTC/USD & ETH/USD Price Setups,”published August 10.

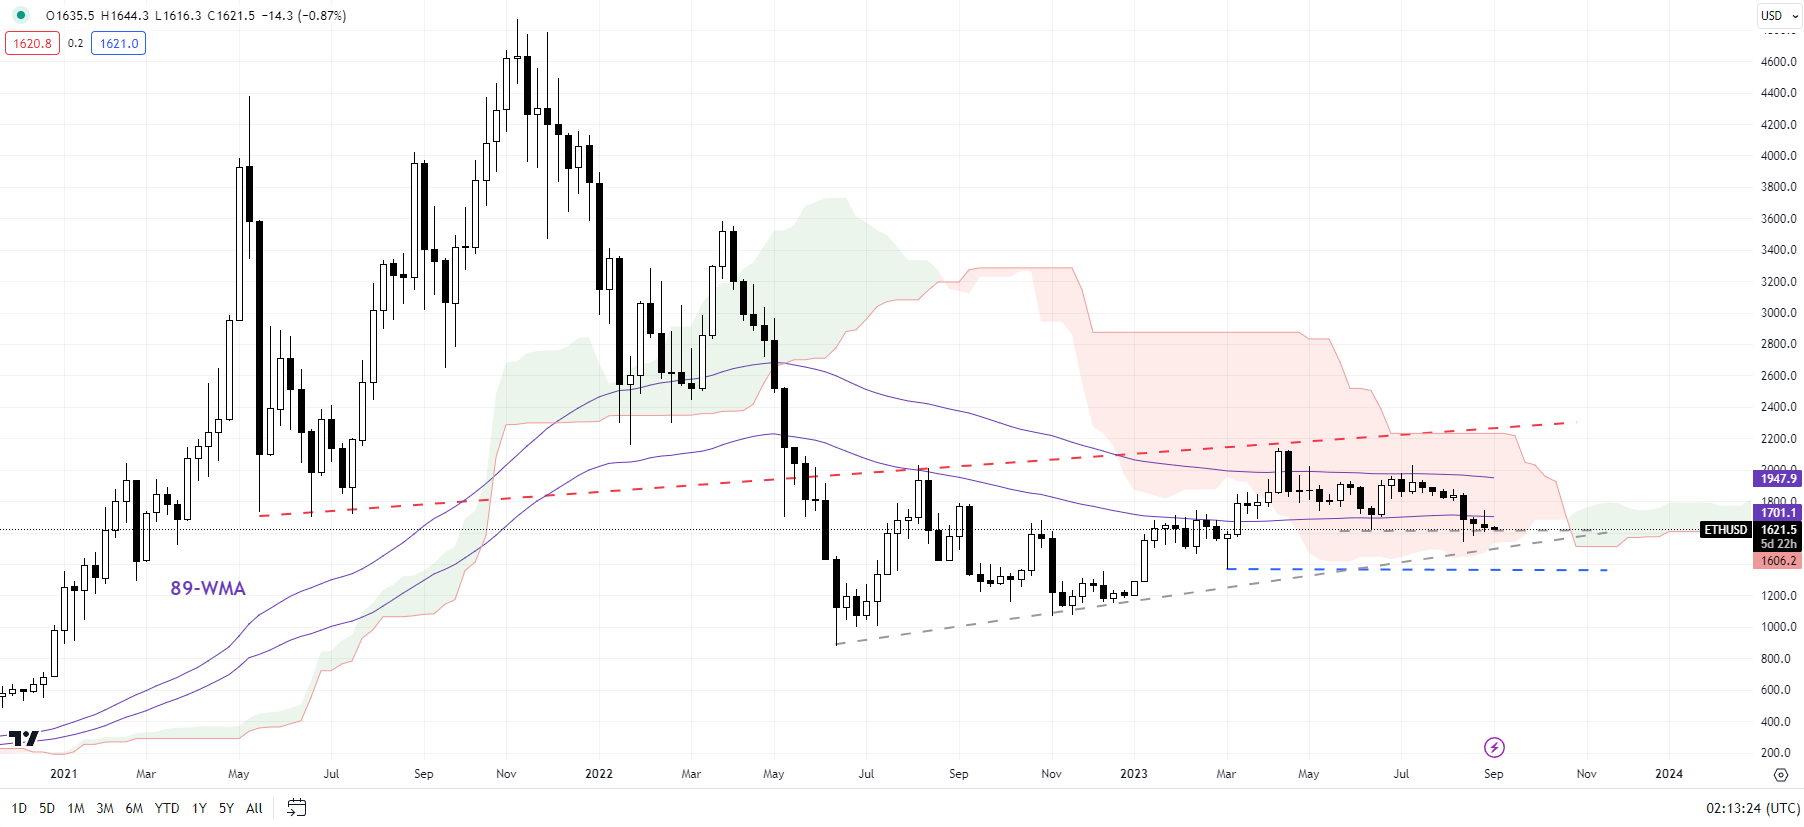
ETH/USD Weekly Chart

image3.png

ETHEREUM: Looking vulnerable

Ethereum appears to be struggling to hold above a vital floor at the June low of 1620. This support is crucial for the broader recovery from the end of 2022 to continue. Any break below would confirm that the bullish bias had dissipated. Such a fall would initially open the way toward the March low of 1370, with major support at the 2022 low of 880.

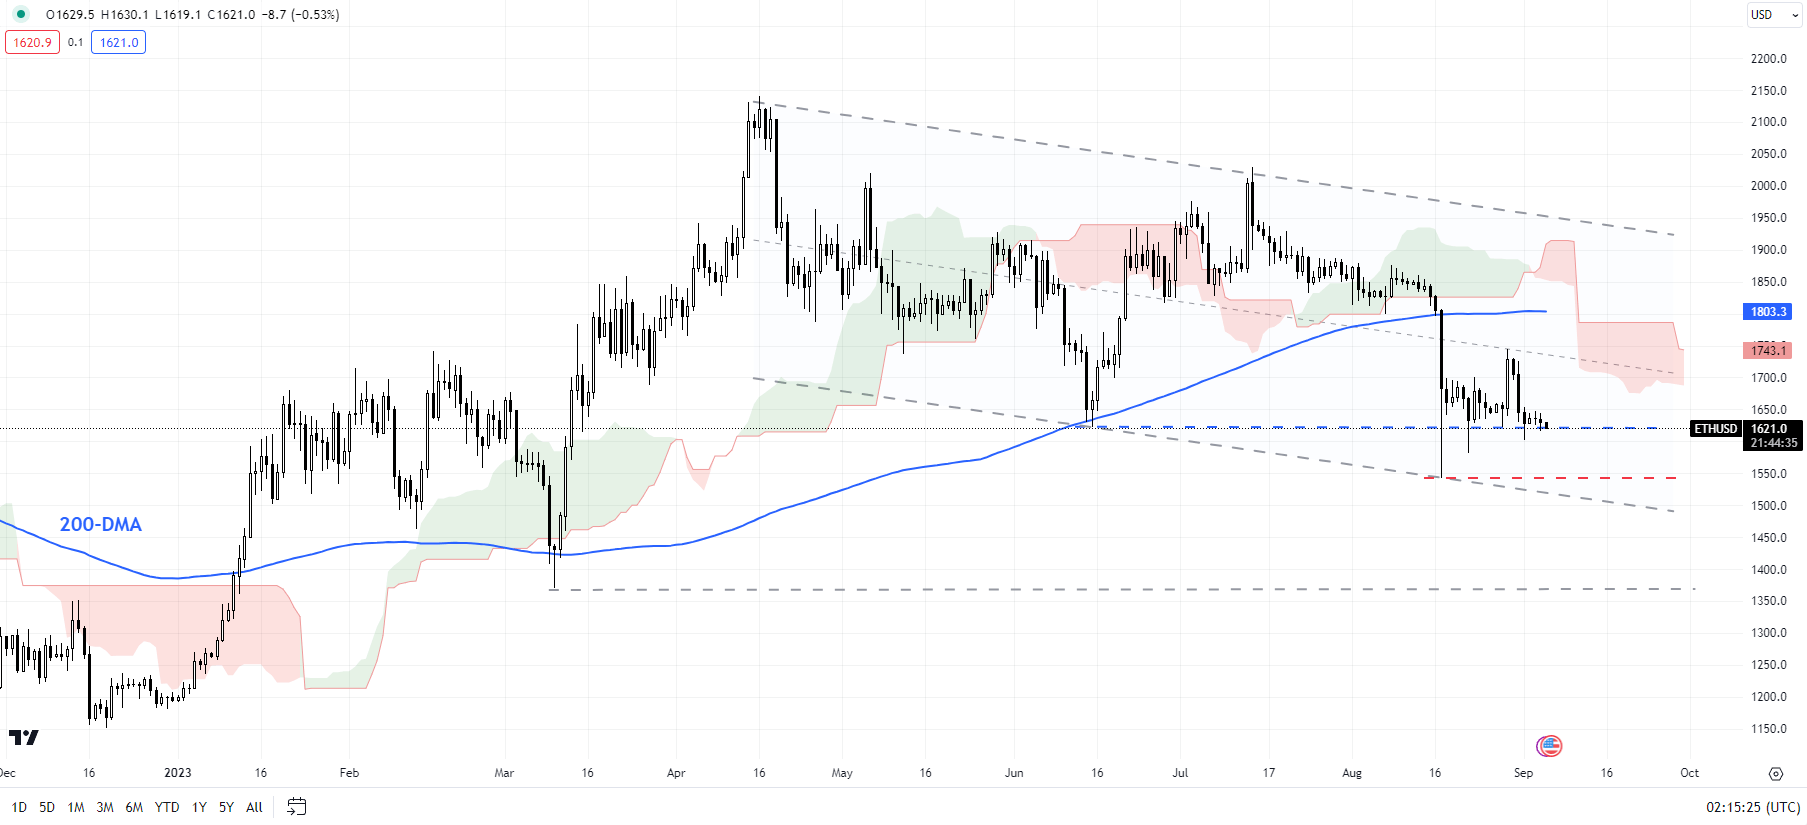
ETH/USD Daily Chart

image4.png

Like Bitcoin, ETH/USD has been under the influence of the bearish Ichimoku cloud cover on the weekly charts. In recent months, Ethereum hasn’t been able to clear past the upper edge of the cloud on the weekly charts, roughly coinciding with a slightly upward sloping trendline from 2021. ETH/USD’s inability to rise toward the top of the cloud cover, in comparison with BTC/USD, reflects its relative weakness. For more discussion, see “Is the Rally Over in Bitcoin & Ethereum? BTC/USD & ETH/USD Price Setups,” published August 23.

GBP/JPY Forecast – British Pound Rallies Against Yen

GBP/JPY Forecast – British Pound Rallies Against Yen

British Pound vs Japanese Yen Technical Analysis

The British pound has rallied during the trading session on Monday, reaching the ¥185 level. This is an area that a lot of people will pay close attention to, as it has been a bit of a magnet for price, therefore it’s likely that we continue to see a lot of choppy behavior. The ¥187 level above is a resistance barrier. If we can break above there, then the market could go much higher, perhaps reaching toward the ¥190 level.

Trading Derivatives carries a high level of risk to your capital and you should only trade with money you can afford to lose. Trading Derivatives may not be suitable for all investors, so please ensure that you fully understand the risks involved, and seek independent advice if necessary. A Product Disclosure Statement (PDS) can be obtained either from this website or on request from our offices and should be considered before entering into a transaction with us. Raw Spread accounts offer spreads from 0.0 pips with a commission charge of USD $3.50 per 100k traded. Standard account offer spreads from 1 pips with no additional commission charges. Spreads on CFD indices start at 0.4 points. The information on this site is not directed at residents in any country or jurisdiction where such distribution or use would be contrary to local law or regulation.

All things being equal, you should keep in mind that we are in a huge uptrend, and of course the Bank of Japan does everything he can to keep interest rates lower in that country, thereby driving down the value of the yen. This has been universal, and not just against the British pound but it’s also worth noting that the British pound has a huge interest-rate differential between it and the Japanese yen, thereby making this a pair that offers quite a bit of swap if you just hang onto it, and that is likely what is driving this market overall.

Pullbacks at this point will have to contend with the ¥183 level, and then perhaps even the 50-Day EMA underneath. All things being equal, this is a market that I think continues to offer a “buy on the pullbacks” type of scenario, and I do think that given enough time we go much higher. If we can break out above the recent highs, then I believe that the British pound will go looking to reach the ¥190 level, and then possibly even higher than that to reach the ¥200 level.

In general, I think you continue to buy the dips and ignore selling. If we do sell off from here, the 50-Day EMA and the ¥180 level both could offer plenty of support. Ultimately, I think you have a scenario which will continue to see a lot of volatility, but I do believe that given enough time we will continue to go higher and therefore I have no interest in shorting, at least not until we break down below the ¥180 level and of course the Bank of Japan changes its overall attitude.

Gold Price Forecast – Gold Markets Quiet on Labor Day

Gold Price Forecast – Gold Markets Quiet on Labor Day

Gold Market Technical Analysis

Gold markets initially tried to rally a bit during the trading session on Monday but gave back those gains to show signs of hesitation. At this point, the market is likely to continue to see a lot of noisy behavior, as there are a lot of questions as to how the Federal Reserve is going to treat the economy and perhaps monetary policy. At this point, the market seems to be comfortable hanging around the $1970 level, and we did of course see an attempt to break out on Friday, but then turned around to show signs of hesitation.

Trading Derivatives carries a high level of risk to your capital and you should only trade with money you can afford to lose. Trading Derivatives may not be suitable for all investors, so please ensure that you fully understand the risks involved, and seek independent advice if necessary. A Product Disclosure Statement (PDS) can be obtained either from this website or on request from our offices and should be considered before entering into a transaction with us. Raw Spread accounts offer spreads from 0.0 pips with a commission charge of USD $3.50 per 100k traded. Standard account offer spreads from 1 pips with no additional commission charges. Spreads on CFD indices start at 0.4 points. The information on this site is not directed at residents in any country or jurisdiction where such distribution or use would be contrary to local law or regulation.

The Monday session of course featured Labor Day, so the lack of liquidity would be a major issue. Because of this, I don’t read too much into the candlestick on Monday, but it does look like we are probably more likely than not going to pull back in order to find support. On the other hand, if we do break above the Friday candlestick, then we go looking to the $2000 level. The $2000 level of course is a large, round, psychologically significant figure, and an area where you would see a lot of noisy behavior. If we can take that out, then it’s likely that the market could go looking to the $2100 level.

Alternatively, if we were to break down below the 200-Day EMA, then we would challenge the $1900 level. The $1900 level of course is an area that previously has been supported, and therefore I think a lot of people would be paying close attention to that area. If we were to break down through there, then we could see a major selloff, but right now it does not look likely to happen. That being said, the market is likely to continue to see a lot of noisy behavior, and therefore it’s likely that you need to be cautious with your position sizing as we try to sort things out. Eventually, things will become a little bit more clear, but right now, it looks like we still have some fighting to do.

Silver Price Forecast – Silver Plunges in Thin Liquidity

Silver Price Forecast – Silver Plunges in Thin Liquidity

Silver Markets Technical Analysis

Silver has fallen again during the Monday session, as we continue to see a lot of negativity. That being said, we are also at the top of the major consolidation area, so that of course is something worth paying attention to. With this being the case, I think we probably go looking to the 50-Day EMA, an area that of course a lot of people will pay close attention to. Breaking down below that level then opens up the 200-Day EMA, and then possibly the $22.50 level after that.

Trading Derivatives carries a high level of risk to your capital and you should only trade with money you can afford to lose. Trading Derivatives may not be suitable for all investors, so please ensure that you fully understand the risks involved, and seek independent advice if necessary. A Product Disclosure Statement (PDS) can be obtained either from this website or on request from our offices and should be considered before entering into a transaction with us. Raw Spread accounts offer spreads from 0.0 pips with a commission charge of USD $3.50 per 100k traded. Standard account offer spreads from 1 pips with no additional commission charges. Spreads on CFD indices start at 0.4 points. The information on this site is not directed at residents in any country or jurisdiction where such distribution or use would be contrary to local law or regulation.

All things being equal, we could rally from here but it looks as if the $25.50 level continues to offer a lot of resistance, and right now we just don’t have a reason to do anything along the lines of a longer-term “buy-and-hold” strategy, it looks like we are just simply hanging around in this same range that we have been in for most of the year.

The biggest driver of where silver goes next is going to be the Federal Reserve, and interest rates coming out of that central bank. If interest rates do in fact start to drop, then it’s likely that the market would probably go looking to send a silver much higher. In general, the market is likely to see a lot of volatility, but if we could break out above the Wednesday candlestick of last week, then it’s possible that the silver market goes looking to the $26.50 level.

In general, this is a situation where I think you continue to see a lot of noisy behavior, and of course silver is known for being so violently volatile anyway. You need to be cautious with the position sizing, as sudden moves in the futures markets of course can cause a lot of trouble. You should also keep in mind that the Monday session was Labor Day in the United States, so there was a serious lack of volume. This will pick up again during the trading session on Tuesday, but at this point it looks like we are simply seeing a lot of profit-taking at the top of the range that a lot of people were very well aware of.

EUR/USD Forecast – The Euro Bounces From a Trendline

EUR/USD Forecast – The Euro Bounces From a Trendline

Euro vs US Dollar Technical Analysis

The euro rallied a bit during the trading session on Monday, bouncing from the uptrend line that people have been paying so much attention to. Furthermore, we are sitting right around the 200-Day EMA, an indicator that of course a lot of people paid attention to. That being said, the market is also trying to sort out what to do next, but keep in mind that the market is also having to deal with the fact that it was Labor Day in the United States, so therefore a lack of liquidity would make quite a bit of sense. If we can break above the candlestick from the Friday session, and by extension the 50-Day EMA, that would be a major turnaround.

Trading Derivatives carries a high level of risk to your capital and you should only trade with money you can afford to lose. Trading Derivatives may not be suitable for all investors, so please ensure that you fully understand the risks involved, and seek independent advice if necessary. A Product Disclosure Statement (PDS) can be obtained either from this website or on request from our offices and should be considered before entering into a transaction with us. Raw Spread accounts offer spreads from 0.0 pips with a commission charge of USD $3.50 per 100k traded. Standard account offer spreads from 1 pips with no additional commission charges. Spreads on CFD indices start at 0.4 points. The information on this site is not directed at residents in any country or jurisdiction where such distribution or use would be contrary to local law or regulation.

Underneath, the 1.0750 level is an area that people will be paying close attention to, because if we were to break below that level, it could descend quite a bit of downward pressure, perhaps continuing what we have seen as of late. At this point, we need to pay close attention to this area, due to the fact that we are at the bottom of the channel and now we are paying close attention to whether or not we can pick up enough momentum of the make a bigger move. After all, most traders are coming back from summer break right now, and markets could start to make more substantial moves. All things being equal, I think one of the important factors to consider is to know when we finally do break out of this range. The next couple of days could be very noisy, but given enough time we will eventually see the trend sort itself out for the fall season.

Because of this, I will be paying close attention for the next day or 2, but eventually will be putting money to work in whichever way we break. If we break to the upside, then we could see a move toward the 1.12 level. On the other hand, we break down below the 1.0750 level, then it opens up a move down to the 1.05 level underneath. Ultimately, I think we continue to see a lot of volatility, but sooner or later we have to make that decision.

EUR/USD Prices Forecast: German Economy’s Wobble Echoes in the Euro Zone

EUR/USD Prices Forecast: German Economy’s Wobble Echoes in the Euro Zone

Euro’s Subtle Climb Amid U.S. Economic Signals

The EUR/USD experienced a mild upturn against the U.S. Dollar on Monday. With U.S. banks observing a holiday, trading volumes remained subdued. This tepid activity underscores the market’s processing of the recent U.S. jobs data.

Released on Friday, the data presented mixed signals: while job growth accelerated in August, unemployment hit 3.8% and wage growth decelerated. Additionally, job figures were revised downwards for June and July by 110,000.

Trading Derivatives carries a high level of risk to your capital and you should only trade with money you can afford to lose. Trading Derivatives may not be suitable for all investors, so please ensure that you fully understand the risks involved, and seek independent advice if necessary. A Product Disclosure Statement (PDS) can be obtained either from this website or on request from our offices and should be considered before entering into a transaction with us. Raw Spread accounts offer spreads from 0.0 pips with a commission charge of USD $3.50 per 100k traded. Standard account offer spreads from 1 pips with no additional commission charges. Spreads on CFD indices start at 0.4 points. The information on this site is not directed at residents in any country or jurisdiction where such distribution or use would be contrary to local law or regulation.

Reflecting the mixed nature of this report, the financial community’s popular “Goldilocks” metaphor seems fitting, suggesting a neither too hot nor too cold economic situation. Current market sentiments anticipate a 93% likelihood of the Federal Reserve maintaining interest rates this month, with a significant tilt towards no rate hikes for the year.

Euro Zone’s Morale Dips, Spotlight on Germany

Domestic sentiments within the Euro zone have soured, largely driven by Germany’s faltering economy. A recent survey released on Monday pointed to a decline in the Sentix index for the Euro zone, slipping to -21.5 in September from its previous -18.9 in August. Germany’s deteriorating economic landscape, as emphasized by Sentix Managing Director Manfred Huebner, is not only reminiscent of the initial COVID-19 lockdown phase in July 2020 but also harks back to the lows of the 2008/2009 financial downturn. Huebner attributes this slump to a combination of political missteps and the ongoing energy crisis.

German Trade Dynamics Under Scrutiny

In terms of trade, Germany’s July export figures declined by a modest 0.9%, contrary to the anticipated 1.5% dip, indicating a dwindling global demand. Once a robust pillar, trade now poses challenges for the German economy. Several factors are at play: disruptions in the supply chain, an evolving global market, and China’s shift towards in-house production. Meanwhile, Germany saw a rise in imports by 1.4% in July, leading to a trade surplus of 15.9 billion euros. However, the cumulative impact of weakened retail sales and export data for July suggests a shaky start to Q3 for Germany.

Short-term Forecast

The immediate economic horizon appears bearish. With Germany’s economy wobbling, its ramifications for the Euro zone are evident. Concurrently, the U.S.’s mixed economic indicators warrant cautious optimism. As global economic frailties persist, especially in pivotal economies like Germany, it remains essential for investors to navigate with prudence.

Technical Analysis

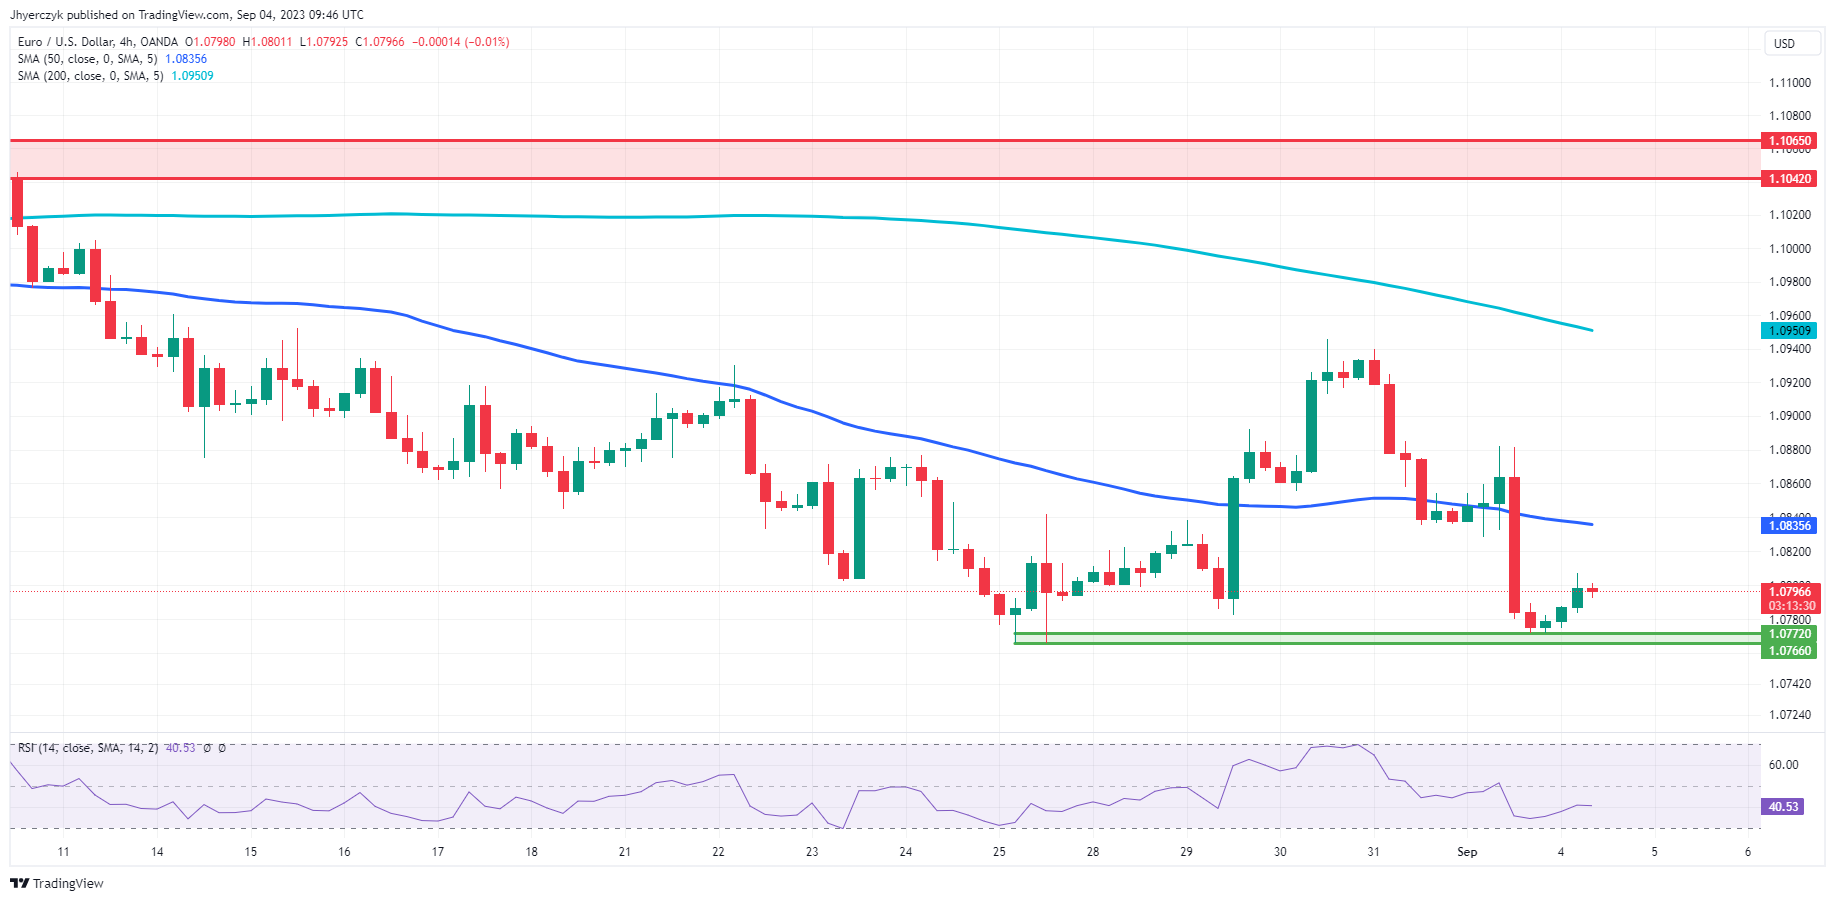
4-Hour EUR/USDThe current 4-hour price of EUR/USD is at 1.0798, unchanged from the previous 4-hour mark. It’s below both the 200-4H moving average (1.0951) and the 50-4H moving average (1.0836), indicating a bearish trend. The 14-4H RSI stands at 40.75, suggesting slightly weakened momentum. While it’s not in the oversold territory, it’s leaning that way.

The price is hovering just above the main support area (1.0772 to 1.0766) and below the main resistance area (1.1042 to 1.1065). Given these factors, the current market sentiment for EUR/USD on the 4-hour chart seems bearish.