Natural Gas Prices Forecast: Heightened Volatility Amid Weather Extremes to Labor Strife

Natural Gas Prices Forecast: Heightened Volatility Amid Weather Extremes to Labor Strife

Natural Gas and the Weather Game

The U.S. natural gas futures market is currently a mixed bag, affected by various weather forecasts and a potential decrease in demand due to Hurricane Idalia. Despite declining air-conditioning use with seasonally cooler weather, meteorologists suggest temperatures will stay hotter than average until mid-September.

Storage Builds and Supply Imbalance

The U.S. Energy Information Administration (EIA) revealed that utilities added 32 billion cubic feet of gas to storage in the week ending August 25. This figure not only surpassed the 25-bcf increase analysts had forecast but also contradicted expectations as extreme heat in the central U.S. led to increased air conditioner usage. Meanwhile, Texas continues to experience high temperatures, compelling businesses and households to keep their air conditioners running.

Trading Derivatives carries a high level of risk to your capital and you should only trade with money you can afford to lose. Trading Derivatives may not be suitable for all investors, so please ensure that you fully understand the risks involved, and seek independent advice if necessary. A Product Disclosure Statement (PDS) can be obtained either from this website or on request from our offices and should be considered before entering into a transaction with us. Raw Spread accounts offer spreads from 0.0 pips with a commission charge of USD $3.50 per 100k traded. Standard account offer spreads from 1 pips with no additional commission charges. Spreads on CFD indices start at 0.4 points. The information on this site is not directed at residents in any country or jurisdiction where such distribution or use would be contrary to local law or regulation.


Outages from Hurricane Idalia

Hurricane Idalia’s destruction has left over 173,000 homes and businesses without power in Florida and Georgia, adding to the market’s uncertainties. This situation has complicated the supply-demand equation, particularly in regions where utilities were already stretched thin due to ongoing heatwaves.

Australian Labor Strife Causes Market Jitters

Adding to the complexities are upcoming work stoppages at two of Australia’s largest LNG facilities. Workers at Chevron’s Gorgon and Wheatstone facilities rejected the company’s offer on pay and conditions, posing a significant risk to the global natural gas markets. Industrial action will commence unless a resolution is found, adding another layer of unpredictability to an already volatile situation.

Short-term Outlook

The short-term outlook for natural gas is bearish, given the multiplicity of factors affecting both supply and demand. From extreme weather conditions in the U.S. to labor disputes in Australia, traders have more than enough to consider in their speculations. Chevron, among others, is under pressure to avoid disruptions that could force additional market volatility.

ISM Manufacturing PMI Remains In Contraction Territory

ISM Manufacturing PMI Remains In Contraction Territory

On September 1, the Institute for Supply Management released ISM Manufacturing PMI report for August. The report indicated that ISM Manufacturing PMI increased from 46.4 in July to 47.6 in August, compared to analyst consensus of 47. Numbers below 50 show contraction.

New Orders index declined from 47.3 in July to 46.8 in August, while Employment index grew from 44.4 to 48.5. Both indices remained in the contraction territory.

The Institute for Supply Management commented: “The U.S. manufacturing sector shrank again, but the uptick in the PMI indicates a slower rate of contraction. The August composite index reading reflects companies managing outputs appropriately as order softness continues, but the month-over-month increase is a sign of improvement.”

Today, traders also had a chance to take a look at the final reading of the S&P Global Manufacturing PMI report for August. The report indicated that S&P Global Manufacturing PMI declined from 49 in July to 47.9 in August, compared to analyst consensus of 47.

U.S. Dollar Index gained ground after the release of the better-than-expected ISM Manufacturing PMI report. Treasury yields are moving higher, providing additional support to the American currency.

Gold pulled back towards the $1940 level as traders focused on stronger dollar and rising Treasury yields. The ISM report served as an additional negative catalyst for gold markets.

SP500 settled near the 4530 level. Major indices are moving higher as traders bet that Fed will not raise rates this year.

For a look at all of today’s economic events, check out our economic calendar.

August Sees 187,000 Job Boost as Unemployment Climbs to 3.8%

August Sees 187,000 Job Boost as Unemployment Climbs to 3.8%

Employment Statistics Overview

The latest data from the U.S. Bureau of Labor Statistics revealed a rise in total nonfarm payroll employment by 187,000 in August. However, this increase is below the prior 12-month average gain of 271,000. While sectors like health care, leisure and hospitality, social assistance, and construction witnessed employment growth, there was a notable decline in the transportation and warehousing sector.

Unemployment Rate Insights

There was a slight uptick in the unemployment rate, reaching 3.8 percent in August, marking a 0.3 percentage point increase from the previous month. This translates to an additional 514,000 unemployed individuals, totaling 6.4 million. Comparatively, the numbers remained fairly consistent from the previous year, with a 3.7 percent unemployment rate and 6.0 million unemployed persons.

Earnings and Workweek Duration

Average hourly earnings saw a moderate increase in August. Earnings for all private nonfarm payroll employees went up by 8 cents, settling at $33.82. This represents a 4.3 percent annual increase. Specifically, private-sector production and nonsupervisory employees experienced a 6 cent rise in hourly earnings, leading to an average of $29.00. Meanwhile, the average workweek for all private nonfarm payroll employees experienced a minor increment, resulting in a 34.4-hour workweek.

Revised Figures for June and July

Past employment data underwent revisions. June’s employment change was reduced by 80,000, from an initial estimate of +185,000 to the revised +105,000. July’s figures also saw a downward revision of 30,000, adjusting the number from +187,000 to +157,000. Consequently, the combined employment figures for these two months are now 110,000 less than the previously reported numbers.

NASDAQ 100, Dow Jones, S&P 500 News: Eyes on U.S. Jobs Data and Federal Reserve Signals

NASDAQ 100, Dow Jones, S&P 500 News: Eyes on U.S. Jobs Data and Federal Reserve Signals

Market Awaits Crucial U.S. Jobs Data Amid Mixed Economic Signals

Stock futures on Friday pointed towards a positive opening, setting a hopeful tone as August drew to a close and investors braced for crucial U.S. employment figures. The Dow Jones Industrial Average futures suggested an opening climb by 120 points, an increment of 0.3%. Mirroring this optimism, the S&P 500 and Nasdaq 100 futures edged higher by 0.3% and 0.2%, respectively.

Treasuries React to Anticipated Labor Market Insights

In the fixed income sphere, U.S. Treasury yields inched upwards. The primary driver behind this movement is the impending August jobs report, scheduled for a 12:30 GMT release. Market experts, taking their cue from a Dow Jones poll, anticipate that the U.S. economy expanded its workforce by 170,000 positions in the past month. The broader trading community is holding its collective breath, hoping this report will indicate a significant economic deceleration. Such a slowdown might convince the Federal Reserve to reconsider its stance on imminent benchmark interest rate hikes.

Trading Derivatives carries a high level of risk to your capital and you should only trade with money you can afford to lose. Trading Derivatives may not be suitable for all investors, so please ensure that you fully understand the risks involved, and seek independent advice if necessary. A Product Disclosure Statement (PDS) can be obtained either from this website or on request from our offices and should be considered before entering into a transaction with us. Raw Spread accounts offer spreads from 0.0 pips with a commission charge of USD $3.50 per 100k traded. Standard account offer spreads from 1 pips with no additional commission charges. Spreads on CFD indices start at 0.4 points. The information on this site is not directed at residents in any country or jurisdiction where such distribution or use would be contrary to local law or regulation.

Federal Reserve’s Next Move: Speculations Abound

The financial streets are rife with speculation on the Federal Reserve’s next course of action. A dominant sentiment is the anticipation of at least one more rate increase from the central bank. Fueling this theory is the recent surge in commodity prices, expected to impact personal consumption expenditures and the consumer price index figures for the upcoming months. As one analyst put it, “If inflation remains stubborn or even rises slightly, it may trigger more aggressive action from the Fed. The exact timing, be it September or October, remains the market’s big question.”

Corporate Performance Highlights

In the corporate sector, positive earnings reports buoyed spirits. MongoDB, a leading database software producer, and tech giant Dell Technologies witnessed their shares leap by 6% and 9% in after-hours trading, respectively, both surpassing earnings expectations. Not to be left behind, athletic wear brand Lululemon Athletica enjoyed a 2% stock price hike post its commendable earnings announcement.

Reflecting on a Turbulent August

In a retrospective glance, August painted a picture of volatility for the stock market. Even though there were multiple upbeat trading sessions which reduced the month’s losses, major indexes reported a downturn. The S&P 500 retreated by 1.77%, the tech-heavy Nasdaq decreased by 2.17%, and the Dow Jones Industrial Average, encompassing 30 significant stocks, declined by a substantial 2.36%.

In light of these developments, the short-term forecast leans towards cautious optimism. While positive corporate earnings provide a silver lining, all eyes remain fixed on the Federal Reserve’s imminent decisions in the wake of the upcoming jobs report.

Dax Index: How Hawkish ECB Sentiments and Mixed Fed Signals Shape the Dax Market

Dax Index: How Hawkish ECB Sentiments and Mixed Fed Signals Shape the Dax Market

DAX Resumes Uptrend on Central Bank Bets

On Thursday, the DAX gained 0.35%. Reversing a 0.24% gain from Wednesday, the DAX ended August down 3.04% to 15,947.

German Economy Flashes Red Amidst Hawkish ECB Sentiment

Private sector PMI numbers from China and German retail sales painted a gloomy economic backdrop.

Trading Derivatives carries a high level of risk to your capital and you should only trade with money you can afford to lose. Trading Derivatives may not be suitable for all investors, so please ensure that you fully understand the risks involved, and seek independent advice if necessary. A Product Disclosure Statement (PDS) can be obtained either from this website or on request from our offices and should be considered before entering into a transaction with us. Raw Spread accounts offer spreads from 0.0 pips with a commission charge of USD $3.50 per 100k traded. Standard account offer spreads from 1 pips with no additional commission charges. Spreads on CFD indices start at 0.4 points. The information on this site is not directed at residents in any country or jurisdiction where such distribution or use would be contrary to local law or regulation.

German unemployment numbers also weighed, with sticky Eurozone inflation numbers supporting hawkish ECB policy bets. With hotter-than-expected Eurozone inflation numbers, the ECB monetary policy meeting minutes green-light a September ECB rate hike.

US Personal Income and Outlays Report Sends Mixed Fed Signals

In contrast, US economic indicators failed to boost the chance of a September Fed rate hike. The US Personal Income and Outlays Report reported a surge in personal spending and a modest increase in the Core PCE Price Index. However, personal income came in cooler. The mixed numbers left investors to await the US Jobs Report before making a decisive move.

According to the CME FedWatch Tool, the chances of the Fed delivering a September rate hike stood at 11.0% versus 10.0% one day earlier.

The US equity markets had a mixed reaction to the Thursday economic calendar. On Thursday, the S&P 500 and Dow fell by 0.16% and 0.48%, respectively. The NASDAQ Composite Index bucked the trend, rising by 0.11%.

The Thursday Market Movers

Bank and auto stocks limited the upside for the DAX on Thursday. Economic indicators raised more red flags. Commerzbank and Deutsche Bank were the worst performers, falling by 1.74% and 1.35%, respectively.

Volkswagen (-0.34%), Porsche (-0.12%), and BMW (-0.09%) also ended the day in negative territory.

Today’s Session

Economic indicators from China will set the tone this morning. The all-important China Caixin Manufacturing PMI caught the markets by surprise. The PMI jumped from 49.2 to 51.0 in August. Economists forecast a modest increase to 49.3. Weak overseas demand remained a concern despite the pickup in domestic business.

Later this morning, manufacturing PMI numbers for Spain and Italy and finalized PMIs for France, Germany, and the Eurozone will draw interest.

Barring a marked revision to the German PMI, we expect the Eurozone PMI to have more impact on buyer appetite. According to flash numbers, the Eurozone Manufacturing PMI increased from 42.7 to 43.7 in August.

The DAX Futures was up 25 points this morning on the better-than-expected Manufacturing PMI from China.

US Jobs Report to Have the Final Say of the Week

The US Jobs Report will garner interest this afternoon. Investors eased bets on Fed interest rates in response to the weaker-than-expected US JOLTs and ADP reports. However, the US Personal Income and Outlays Report left mixed signals, with spending and inflation up but income down.

A pickup in wage growth and a steady unemployment rate should put a final Fed rate hike on the table. Economists forecast an unemployment rate of 3.5% and wage growth of 4.4%.

Beyond the economic indicators, investors should monitor the news wires for central bank chatter. Reaction to this week’s economic calendar would draw interest.

Short-Term Forecast: Precarious Moment for the DAX

Rising bets on a September ECB rate hike and a grim macroeconomic environment leave the DAX under pressure. However, an end to the Fed monetary tightening would cushion the downside. The US Jobs Report needs to materially improve the chances of a Fed rate hike to leave the DAX at sub-$15,750.

DAX Technical Indicators

Daily Chart

On Thursday, resistance at 16,007 left the DAX at sub-16,000. However, the DAX broke through and held above the 50-day EMA, a bullish price signal. The DAX would need the US Jobs Report to reveal a softer wage growth and a modest increase in unemployment to retest resistance at 16,007.

However, a hotter-than-expected US Jobs Report would send the DAX down through the 50-day EMA to bring the trend line and 15,663 support band into play.

Considering the 14-Daily RSI at 53.70, the DAX has room to run before hitting overbought territory. However, the US Jobs Report needs to be DAX-friendly to support further gains.

DAX Daily Chart sends bullish price signals.
DAX 010923 Daily Chart

4-Hourly Chart

On Thursday, the DAX broke through the 200-day EMA to test the 16,007 resistance band. Notably, the 50-day EMA narrowed on the 200-day EMA, bringing a bullish cross into play. Euro area manufacturing sector PMIs and the US Jobs Report must be DAX-friendly to support a breakout from the 16,007 resistance band.

A hotter-than-expected US Jobs Report would likely see the DAX fall through the EMAs to target the trend line and 15,663 support band. We expect strong support at 15,663, with the support band and trend line crossing.

Considering the 60.70 RSI reading, the DAX has more room to run before entering overbought territory.

4-Hourly Chart affirms bullish price signals.
DAX 010923 4-Hourly ChartFor a look at the economic events, check out our economic calendar.

Don’t miss a thing! Sign up for a daily update delivered to your inbox
Silver Prices Forecast: Spot Value’s Rise Amid Waning US Interest Hopes

Silver Prices Forecast: Spot Value’s Rise Amid Waning US Interest Hopes

Silver’s Response to Economic Indicators

As the week winds down, spot silver hovers at $24.56 an ounce, anticipating a weekly rise exceeding 1%. Concurrently, U.S. silver futures display bullish sentiment, marked at $24.94. The catalyst? Decreasing prospects for U.S. interest rate hikes this year. With the U.S. non-farm payrolls (NFP) report on the horizon, the silver market is abuzz.

Economic Climate and the Fed’s Stance

Recent economic data from the U.S. portrays a mix of apprehension and hope among investors. July witnessed an all-time low in job openings, and the second quarter’s economic growth lagged behind predictions. These factors, in conjunction with the Federal Reserve’s ambiguous position on inflation, have dampened the U.S. dollar and Treasury yields. This softening is augmenting silver’s allure. Federal Reserve Chairman Jerome Powell’s insights on the persistent high inflation rates further complicate the picture, suggesting potential rate hikes.

Trading Derivatives carries a high level of risk to your capital and you should only trade with money you can afford to lose. Trading Derivatives may not be suitable for all investors, so please ensure that you fully understand the risks involved, and seek independent advice if necessary. A Product Disclosure Statement (PDS) can be obtained either from this website or on request from our offices and should be considered before entering into a transaction with us. Raw Spread accounts offer spreads from 0.0 pips with a commission charge of USD $3.50 per 100k traded. Standard account offer spreads from 1 pips with no additional commission charges. Spreads on CFD indices start at 0.4 points. The information on this site is not directed at residents in any country or jurisdiction where such distribution or use would be contrary to local law or regulation.

Jobs Data and Market Dynamics

Silver’s market dynamics are tightly knit with employment figures. The ADP’s August report showed a disappointing 177,000 new jobs, falling short of the Dow Jones’ 200,000 estimate. This could be a precursor for the NFP’s revelations, which have the potential to further influence the silver market. With Treasury yields already in decline, a subpar jobs report could amplify silver’s sheen.

Treasury Yields and Silver’s Appeal

The trajectory of U.S. Treasury yields is intrinsically tied to silver’s rise. With forecasts predicting a 3% decline by the week’s close, silver’s attraction is only poised to grow, especially considering the Federal Reserve’s hesitance towards imminent interest rate modifications.

Short-Term Outlook:  Bullish

Despite looming economic uncertainties, the immediate forecast for silver tilts towards bullish. The impending NFP report possesses the ability to redefine the narrative. However, for the time being, silver is on track for a second successive week of gains.

Technical Analysis

4-Hour Silver (XAG/USD)Silver (XAG/USD) on the 4-hour chart is currently trading at 24.59, having risen from its previous position of 24.45. The commodity finds itself trading above both the 200-4H moving average of 23.85 and the 50-4H moving average of 24.21, suggesting a bullish trend.

The 14-4H RSI registers at 58.05, signifying a momentum build-up, albeit not in overbought territory yet.

With the primary support zone set between 22.70 to 22.28 and resistance between 25.00 to 25.27, the price is closer to its resistance levels. This places the market sentiment for Silver (XAG/USD) in a bullish realm.

Gold Prices Forecast: XAU/USD Rises as NFP Report Looms Amid Soft U.S. Data

Gold Prices Forecast: XAU/USD Rises as NFP Report Looms Amid Soft U.S. Data

Gold Market Watches Fed’s Next Move

Spot gold (XAU/USD) hovered at $1,942.22 per ounce by early Friday morning GMT, setting itself up for over a 1% weekly gain. U.S. gold futures were also bullish, trading near $1,970. The commodity’s strong showing comes on the back of weakened prospects for U.S. interest rate hikes this year, particularly as market participants await the U.S. non-farm payrolls (NFP) report due later in the day.

U.S. Economic Indicators Point to Slowing Activity

The general mood among investors appears cautious but optimistic, as economic indicators from the U.S. this week have largely been softer than expected. Job openings in July hit their lowest level in 2.5 years, and second-quarter economic growth was slightly less robust than previously projected. These metrics have led to a softening of the U.S. dollar and Treasury yields, both contributing factors to gold’s rising attractiveness.

Trading Derivatives carries a high level of risk to your capital and you should only trade with money you can afford to lose. Trading Derivatives may not be suitable for all investors, so please ensure that you fully understand the risks involved, and seek independent advice if necessary. A Product Disclosure Statement (PDS) can be obtained either from this website or on request from our offices and should be considered before entering into a transaction with us. Raw Spread accounts offer spreads from 0.0 pips with a commission charge of USD $3.50 per 100k traded. Standard account offer spreads from 1 pips with no additional commission charges. Spreads on CFD indices start at 0.4 points. The information on this site is not directed at residents in any country or jurisdiction where such distribution or use would be contrary to local law or regulation.

Treasury Yields and The Dollar Index

The decline in U.S. Treasury yields has played a pivotal role in gold’s recent upward trajectory. Treasury yields are set to conclude the week approximately 3% lower, largely owing to subdued inflation data. The declining yields have boosted the allure of gold, a non-interest-bearing asset, especially as the Federal Reserve seems unlikely to adjust interest rates in the near term.

NFP Report Could Be a Game Changer

The upcoming NFP report could further solidify gold’s bullish run. If the report prints a lower-than-expected number of new jobs, it’s likely to push Treasury yields even lower, thereby adding another layer of shine to gold. On the flip side, a stronger report could put a damper on the current rally.

Short-Term Forecast: Bullish

Given the week’s economic data and the diminishing likelihood of an imminent rate hike by the Fed, the short-term outlook for gold prices remains bullish. Of course, this could change with the release of the NFP report, but as it stands, gold is on track for its second consecutive week of gains

China Caixin Manufacturing PMI Hits 51 Despite Weak Overseas Demand

China Caixin Manufacturing PMI Hits 51 Despite Weak Overseas Demand

China Caixin Manufacturing PMI Impresses

The Caixin Manufacturing PMI increased from 49.2 to 51.0 in August. Economists forecast the PMI to rise to 49.3.

According to the August survey,

  • Market conditions supported an increase in new domestic orders.
  • However, new orders from overseas continued to fall, albeit at a less marked pace.
  • The upswing in new orders led to a pickup in production, though firms remained cautious about stockpiling.
  • Nonetheless, manufacturers increased staff levels on expansion plans. The rate of job creation was the most marked since March 2010.
  • Rising prices for raw materials pushed input prices higher for the first time since February.
  • Despite the upswing in input prices, firms reduced output prices amidst increased competition for new business.
  • Optimism across the manufacturing sector deteriorated in August, with sentiment declining to an 11-month low.

While the return to growth was positive, weakness in overseas demand remains a concern. The Chinese economy will need more than domestic demand to support an economic recovery.

AUD/USD Reaction to the China Caixin Manufacturing PMI

Before the China Caixin Manufacturing PMI Report, the AUD/USD fell to a low of $0.64739 before striking a pre-stat high of $0.64999.

However, in response to the Caixin survey, the AUD to USD rose to a post-stat high of $0.64917 before falling to a low of $0.64814.

This morning, the Aussie Dollar was up 0.01% to $0.64850.

AUD/USD responds to the China Caixin Manufacturing PMI
Up NextThe US Jobs Report will be in the spotlight this afternoon. With the markets divided on Fed interest rate goals, US wage growth and unemployment figures could refuel bets on a final rate hike.

Economists forecast average hourly earnings to increase by 4.4% year-over-year in July. Despite the disappointing ADP and JOLTs numbers, economists expect a US unemployment rate of 3.5%.

ISM Manufacturing and finalized S&P Global Manufacturing PMIs will also draw interest. Investors will likely consider any data points that can influence Fed monetary policy bets.

Indices on Track for Second Week of Gains: FTSE 100, Nasdaq 100, DAX 40

Indices on Track for Second Week of Gains: FTSE 100, Nasdaq 100, DAX 40

FTSE 100, DAX 40, Nasdaq 100 Analysis and Charts

​​​FTSE 100 on track for second week of gains

​The FTSE 100, which slid back to its breached July-to-August downtrend line on Thursday, is bouncing off it ahead of US Non-Farm Payrolls on Friday. ​The UK blue chip index looks to be on track for a second week of gains as investors positively interpreted the weaker US growth and employment data out this week as dovish with regard to monetary policy. ​The 55-day simple moving average (SMA) at 7,482 is back in focus, as is this week’s high at 7,510.

​Minor support can now be found along the breached July-to-August downtrend line at 7,425 ahead of more significant support made up of the May, June, and early August lows at 7,437 to 7,401.

FTSE 100 Daily Chart

​​DAX 40 is expected to end the week on a positive note

​The DAX 40 continues its advance as China’s manufacturing activity unexpectedly expanded in August, boosting Asian stock markets, except Australia’s AU200. ​Thursday’s high at 16,044 and the 10 August high at 16,062 remain in sight. These highs need to be exceeded for a medium-term bullish reversal to be confirmed.

​Minor support comes in at the 15,895 high seen last week, ahead of Wednesday’s low at 15,821. ​Further support comes in along the breached one-month resistance line, now because of inverse polarity a support line, at 15,685.

DAX 40 Daily Chart

​​Nasdaq 100 is losing upside momentum ahead of US NFP data

​The Nasdaq 100’s five consecutive days of gains take place among diminishing upside momentum as investors brace themselves for today’s US Non-Farm Payrolls. Nonetheless, the index regained most of its August losses within the past week as investors pursued a more dovish Fed outlook. ​Were this week’s high at 15,576 to be exceeded, the late July high at 15,807 would be in focus, together with the July peak at 15,932.

​Slips should find support around last week’s high at 15,369. Minor support below this level is seen along the 55-day simple moving average (SMA) at 15,236.

Nasdaq 100 Daily Chart

Gold Price Outlook: XAU/USD Faces Key Technical Intersection as Retail Traders Sell

Gold Price Outlook: XAU/USD Faces Key Technical Intersection as Retail Traders Sell

Gold prices remain over 3 percent higher compared to the middle of August. Since then, retail traders have continued to increase downside exposure. This can be seen by taking a look at IG Client Sentiment (IGCS), which often functions as a contrarian indicator. With that in mind, could the yellow metal extend its recent winning streak?

Gold Sentiment Outlook – Bullish

The IGCS gauge shows that about 65% of retail traders are net-long gold. Since most of them are biased to the upside, this continues to hint that prices may decline down the road. But, downside exposure has increased by 4.61% and 42.15% compared to yesterday and last week, respectively. With that in mind, despite overall positioning, recent changes in exposure hint that the current price trend may extend higher.

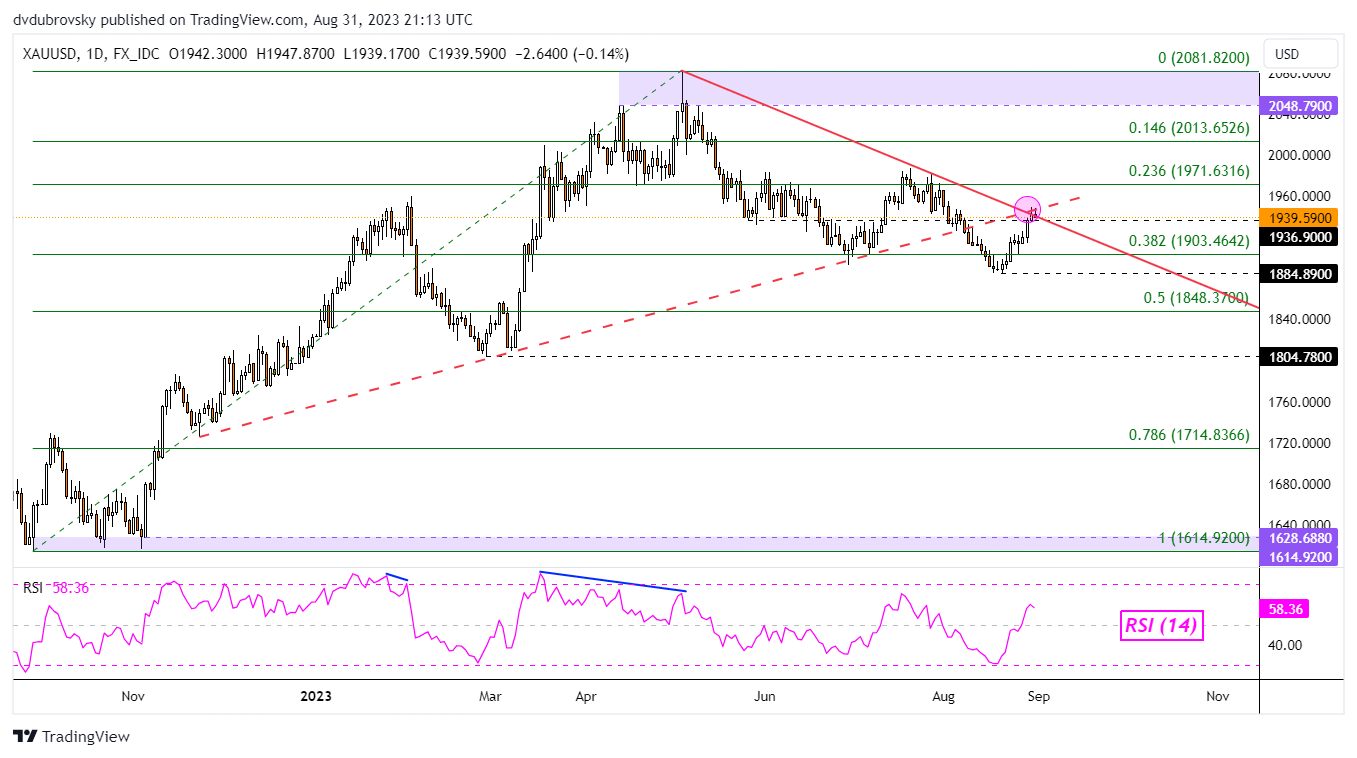
XAU/USD Daily Chart

On the daily chart, gold prices are facing the next critical technical test. It is the intersection of a falling trendline from May and former rising support from the end of last year – highlighted as the pink circle in the daily chart below. A hold at resistance would open the door to extending the downtrend since earlier this year.

That would place the focus on near-term support which is the 38.2% Fibonacci retracement level of 1903.46. Beyond that sits the August swing low of 1884.89. Clearing the latter opens the door to resuming broader losses since May. Otherwise, pushing above resistance offers an increasingly bullish technical outlook, placing the focus on the 23.6% Fibonacci retracement level of 1971.63.

XAU/USD Daily Chart